Introduction
In a variety of recent publications, a strong
independent predictor of breast cancer is reported to be
mammographic density (1–3). From the middle of the 1990s it was found
that women with a mammographic breast density (MBD) >75% had an
almost 5-fold increased risk of presenting with breast cancer
(4). To this end, an objective
computer system for MBD classification is of paramount importance
for cancer screening and monitoring. Such computer systems are
usually evaluated against the actual breast density scoring from
expert radiologists using the BI-RADS reporting system of the
American College of Radiology (ACR) (5). As of 2013, the BI-RADS descriptors
classify breast density content as ‘entirely fat’, ‘scattered areas
of fibroglandular density’, ‘heterogeneously dense’ and ‘extremely
dense’.
This classification problem is usually handled by
machine and deep learning techniques. Published studies concerning
feature-based methods have incorporated several approaches. In
particular, Bovis (6) proposed image
analysis with spatial gray level dependence (SGLD) matrices as a
texture feature extractor, dimensionality reduction with principal
component analysis (PCA) and two-/four-class density scoring using
artificial neural networks (ANN). Tzikopoulos et al
(7) examined statistical and
differential feature extraction methods for MBD classification by
decision trees. Oliver et al (8) utilized the fuzzy C-means algorithm
paired with both k-NN and ID3 decision trees for scoring
mammographic data.
On the other hand, a deep learning framework was
previously applied by Fonseca et al (9) with a three-layer CNN for feature
extraction and a Support Vector Machine (SVM) for a four-class
classification according to the American College of Radiology (ACR)
density characterization. Petersen et al (10) investigated both learnable segmentation
and patch-based CNN classification based on scoring of percentage
mammographic density (PMD). Kallenberg et al (11) proposed a merged unsupervised
segmentation and feature extraction process with an external
classifier for PMD scoring. The performance metrics of the relevant
literature is summarized in Table
I.
 | Table I.Breast density scoring. |
Table I.
Breast density scoring.
| Methodology or study,
authors (Refs.) | mini-MIAS (2-class)
ACC/AUC (%) | mini-MIAS (3-class)
ACC (%) | DDSM (2-class)
ACC/AUC (%) | DDSM (3-class) ACC
(%) | DDSM (4-class) ACC
(%) | No. of images |
|---|
| Machine learning |
|
|
|
|
|
|
| HOG | 71.8/52.3 | 53.1 | – | – | – | Full |
| LBP | 83.3/78.0 | 74.2 | 67.1/71.4 | 55.1 | 36.6 | Full |
| SURF | 82.6/77.6 | 68.3 | 79.3/84.2 | 67.5 | 46.8 | Full |
| Gabor +
LBP | 76.7/68.4 | 61.7 | 62.8/67.1 | 52.1 | 35.8 | Full |
| Selected
HOG | 69.0/48.7 | 53.1 | – | – | – | Full |
| Selected
LBP | 77.9/71.1 | 70.2 | 73.7/79.2 | 64.5 | 40.7 | Full |
| Selected
SURF | 83.8/77.6 | 73.6 | 75.6/81.5 | 62.9 | 46.8 | Full |
| Selected
Gabor + LBP | 64.9/60.9 | 50.9 | 62.1/67.7 | 55.4 | 37.7 | Full |
| Bovis
et al (6) | – | – | 96.6/ - | – | 71.4 | 377 |
|
Tzikopoulos et al
(7) | – | 70.3 | – | – | – | Full |
| Oliver
et al (8) | – | – | – | – | 40.3–47 | 300 |
| Deep learning |
|
|
|
|
|
|
|
Proposed architecture |
84.2/87.3 | 79.8 |
75.2/82.7 | 68.6 | 54.8 | Full |
|
Inception 3 | 73.6/75.7 | 70.8 | 72.7/79.1 | 49.5 | 48.8 | Full |
|
VGG19 | 68.6/67.8 | 72.4 | 72.1/79.3 | 62 | 36.8 | Full |
|
InceptionResNetV2 |
69.9/63.7 | 73.1 | 72.7/79.2 | 55.6 | 37.3 | Full |
|
DenseNet201 |
75.5/79.6 | 77.9 | 73.1/80.5 | 61.7 | 36.5 | Full |
|
NASNetLarge |
66.5/66.3 | 72.8 | 72.3/78.7 | 61.4 | 37.8 | Full |
This study constitutes an extensive analysis of MBD
classification using two publicly available datasets incorporating
various feature extraction methods, such as histogram of oriented
gradients (HOG) (12), speeded-up
robust features (SURF) (13), local
binary pattern (LBP) (14), Gabor
filters (15) and deeper end-to-end
convolutional neural networks (CNNs) fully trained or off-the-shelf
models trained on the ImageNet dataset (16).
The main aim of this study was to present and
discuss the results of modern machine learning techniques combining
the aforementioned feature extraction methods alongside with more
robust CNN schemes presented in the bibliography. In the following
section, the mammographic datasets and the proposed workflow are
presented.
Patients and methods
Patient cohort
The patient population used in this study is based
on two publicly available datasets, the Mammographic Image Analysis
Society Digital Mammogram (mini-MIAS) and the Digital Database for
Screening Mammography (DDSM). Further information regarding each
dataset is presented below:
Mini-MIAS
The mini-MIAS (http://peipa.essex.ac.uk/info/mias.html) is a free
scientific database for research and consists of 161 patients with
322 mammograms. The database is digitized at 50-micron pixel edge.
Image labels are categorized by their breast density from expert
radiologists, using 3 classes: Fatty (F) (106 images),
fatty-glandular (G) (104 images) and dense-glandular (D) (112
images).
DDSM
The DDSM (http://www.eng.usf.edu/cvprg/Mammography/Database.html)
database consists of approximately 2,500 patients with 10,239
multi-view images including benign, malignant and normal cases.
Image resolution varies from 42 to 50 microns. Breast density
labels for this dataset are categorized using four classes: Fatty,
glandural, dense and extremely dense.
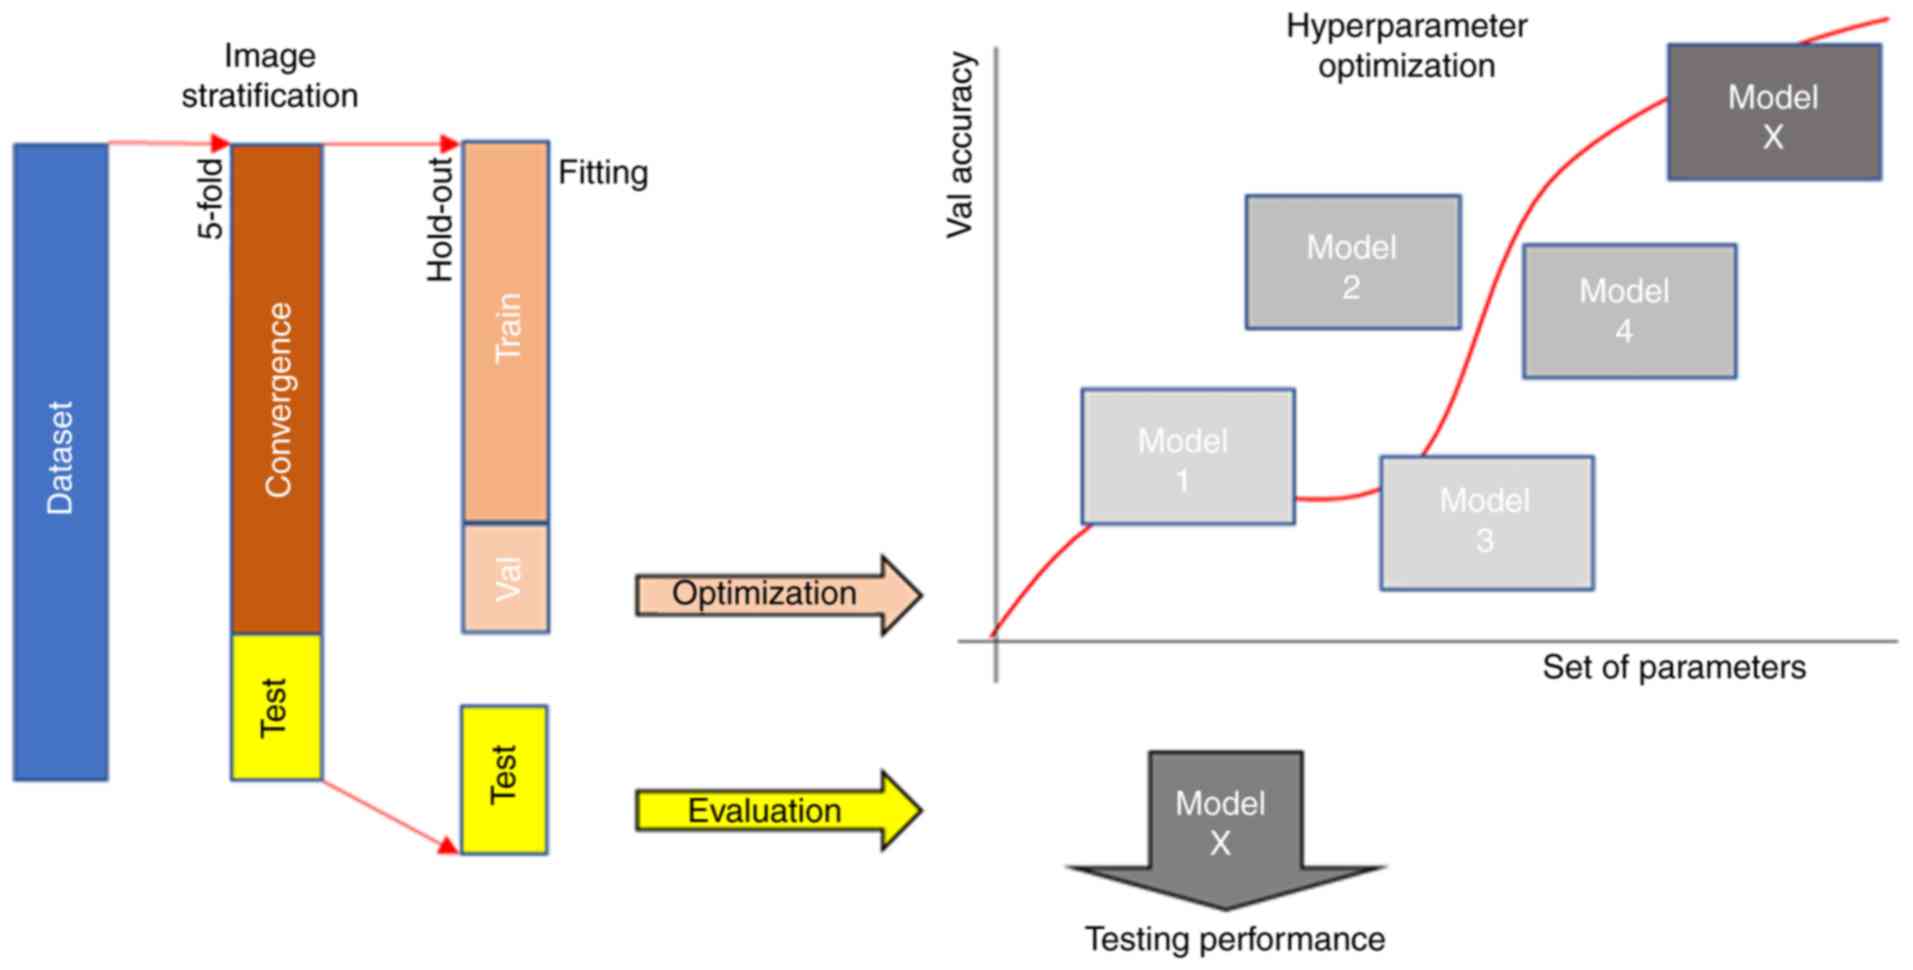
Dataset stratification
Medical imaging databases usually consist of limited
patient cohorts, such as the aforementioned datasets restricting
the learning capacity of deep models. Therefore, to avoid biases
related to the low sample number, an exhaustive k-fold
cross-validation was performed for splitting the dataset into the
multiple convergence and testing set. Additionally, the
corresponding convergence set was split into the training and
validation set by a shuffle hold-out process as presented in
Fig. 1. In particular, the
performance metrics on mini-MIAS were acquired by 64 testing images
and the fitting process on 258 images (208 training, 50 validation)
per fold. Similarly, the same stratification procedure was applied
on the whole patient cohort of the DDSM dataset but only the
cranio-caudal images were used (approximately 5,000). Every
examined image analysis methodology including deep and
feature-based models were adapted on the same convergence set and
evaluated on same unseen testing set to establish a fair assessment
among the resulted models.
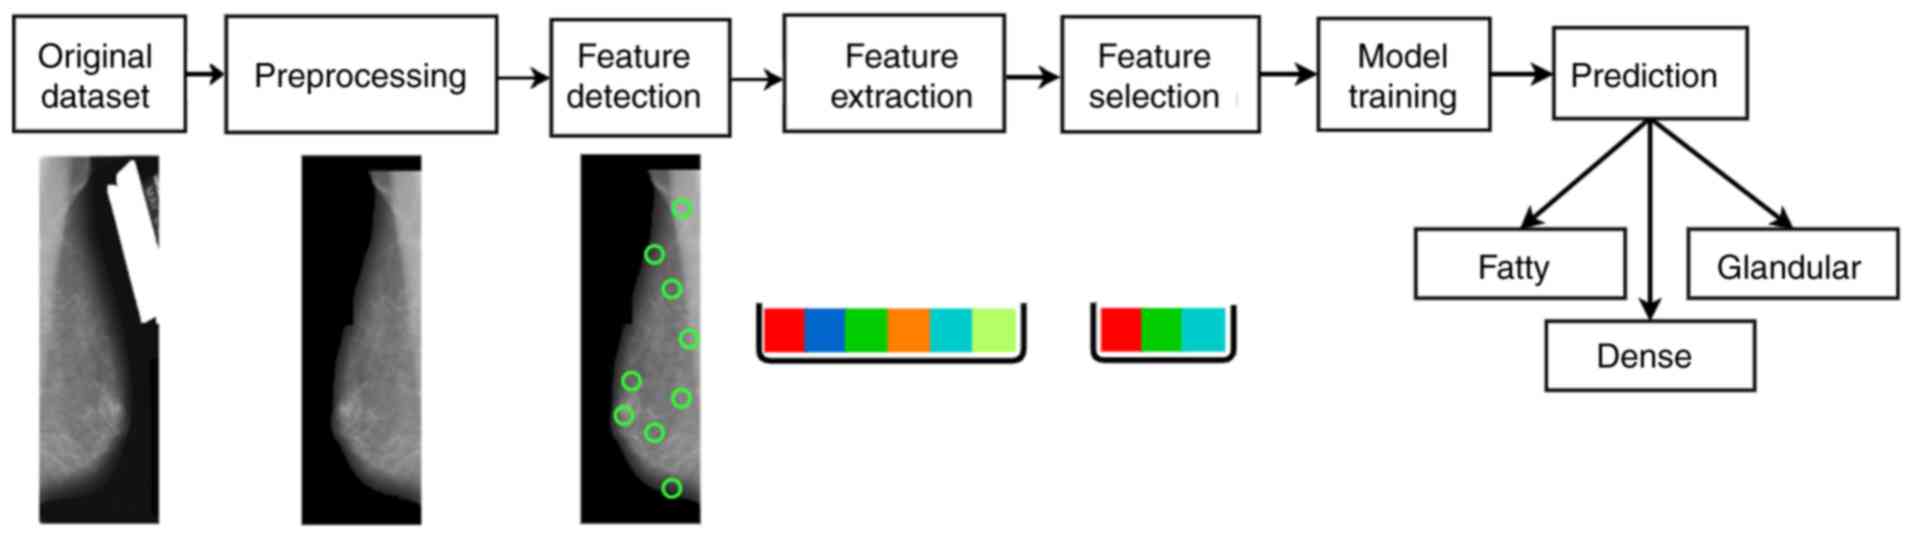
Pre-processing
In order to ensure reliable image quality without
artefacts, and limit background noise that may potentially affect
the feature extraction analysis, both mini-MIAS and DDSM images
were pre-processed as follows. Initially, the threshold selection
method described in the study by Otsu (17) was applied as a method for background
removal. Moreover, boundary detection (18) was performed for the elimination of
these areas (labels with a patient's personal information, as
illustrated in Fig. 2, ‘Original
Dataset’). Image cropping in addition to bicubic interpolation for
resizing was applied to reduce computational complexity for the MBD
analysis and ensure consistent image size across the studied
cohorts.
Machine learning workflow
Feature extraction
Distinguishing key points in imaging structures is a
crucial step to capture essential abstractions, pixel intensity
variations and local dependencies for differentiating between
tissue classes. Mammography images usually include different
structures, including muscle, breast tissue and benign/malignant
lesions. To address this variability in tissue content, a number of
algorithms with diverse mathematical backgrounds were employed for
extracting discriminative compact representations, including
gradient-based features, such as HOG, SURF and texture features,
such as LBP and Gabor filters combined with LBP.
Feature selection
This step has been established in the proposed
methodology for reducing the high-dimensional raw features to the
most significant components resulting in an improved computational
complexity and improved performance. The selection was enacted with
the use of the neighborhood component analysis (NCA) (19).
Classification
Linear discriminant analysis (20) was used for the classification of the
annotated feature vectors following the NCA selection process by
modeling the differences among the examined classes and searching
for linear combinations of the most statistical significant
features. A graphical representation of the proposed machine
learning methodology is provided in Fig.
2.
Deep learning-fully trained CNN
methodology
Deep learning analytics introduce a fully automated
analysis pipeline with data-driven learnable parameters providing a
domain-specific modelling methodology. The main objective of these
deep learning architectures, such as CNNs is to learn hierarchical
representations of the examined domain across several layers by
convolving and propagating features maps of the initial input in an
end-to-end and automatic manner. This is formulated as a convex
optimization where the model adapts its weights through backwards
propagation. To address the clinical question of this study,
several pre-trained deep learning models were evaluated for feature
extraction such as inception networks, VGG19 (http://www.robots.ox.ac.uk/~vgg/research/very_deep/),
DenseNet (https://ai-pool.com/m/densenet-1556378134) and NASNet
(https://ai-pool.com/m/nasnet-1556378807).
Additionally, a custom end-to-end 2D CNN architecture trained on
the studied datasets was developed.
Data augmentation
This process represents an artificial method of
increasing the training set and simultaneously promote the
generalization ability of the models by offering alternative
variants of the original image. The added noise of image
transformations, including rotation, flipping, elastic deformation
and mirroring amplifies model properties, such as translation,
rotational and scale invariance.
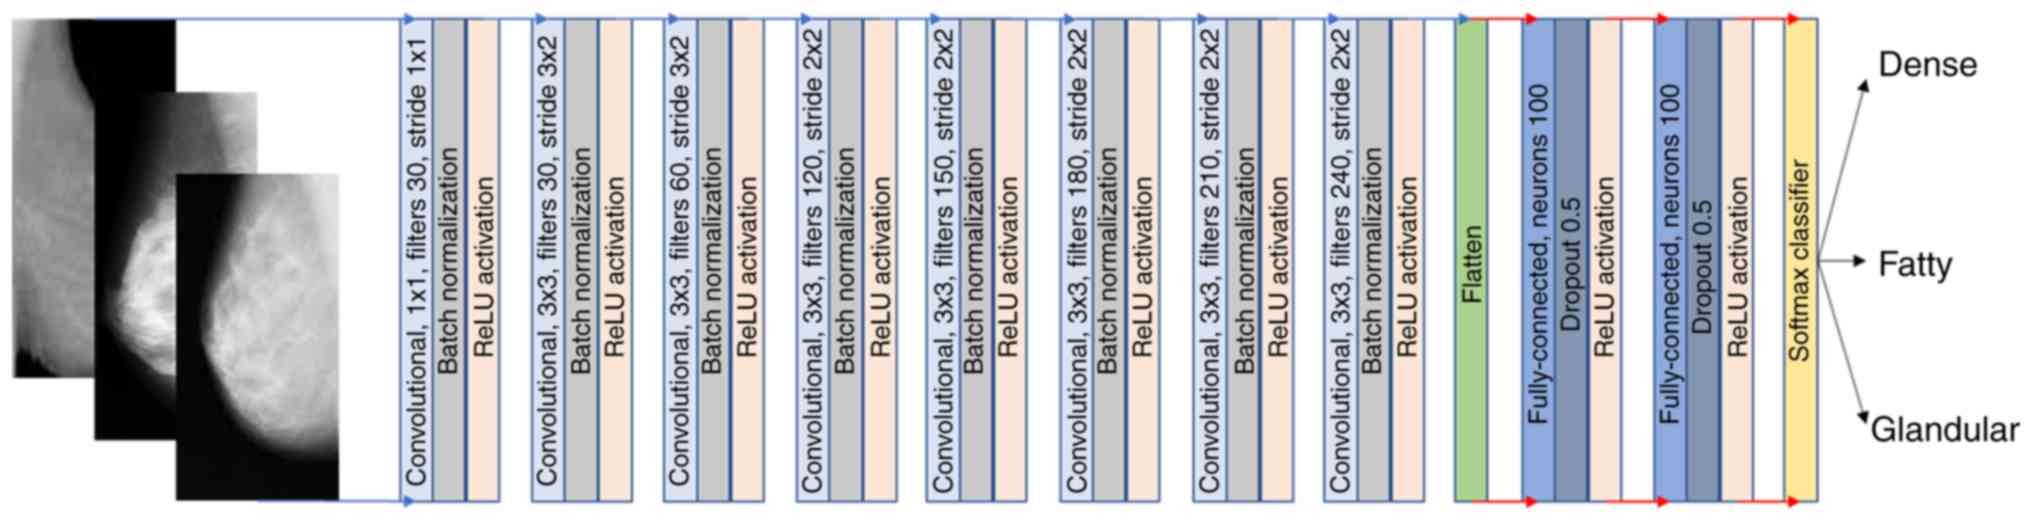
Proposed architecture
The fully trained 2D CNN architecture consists of 15
layers, including the image input of shape 725×234×1, 6
convolutional layers each followed by a batch-normalization layer,
2 fully-connected layers with 100 neurons each and finally a
softmax classification layer as depicted in Fig. 3. ReLU was selected as the activation
function of the convolutional layers with 30 to 240 kernels per
layer and a 3×3 receptive field. Additionally, 20% chance of
dropout was applied to the fully-connected neurons. Glorot
methodology was utilized for weight initialization. The complete
source code and the final hyperparameters of the custom 2D
architecture are available online (https://github.com/trivizakis/breast-density-analysis).
Hyperparameter optimization
The fitting process of a deep architecture poses a
challenging task of searching the optimal parameters in order to
discover the best performing model. The validation set as part of
the convergence set was used to perform this task in a transparent
and unbiased way on a limiting database, as depicted in Fig. 1. In particular, overlaying the
training and validation loss curve reveal details about the fitting
status of the model and assists in the parameter selection process.
Adjusting the number of learnable parameters, such as layers,
kernels and neurons can minimize the memorization of the dataset
from the model therefore preventing overfitting. Additionally,
early-stopping was performed after maximizing the validation
accuracy to provide the best fitted models, avoiding overtraining
and refraining from unnecessary time-consuming convergence
cycles.
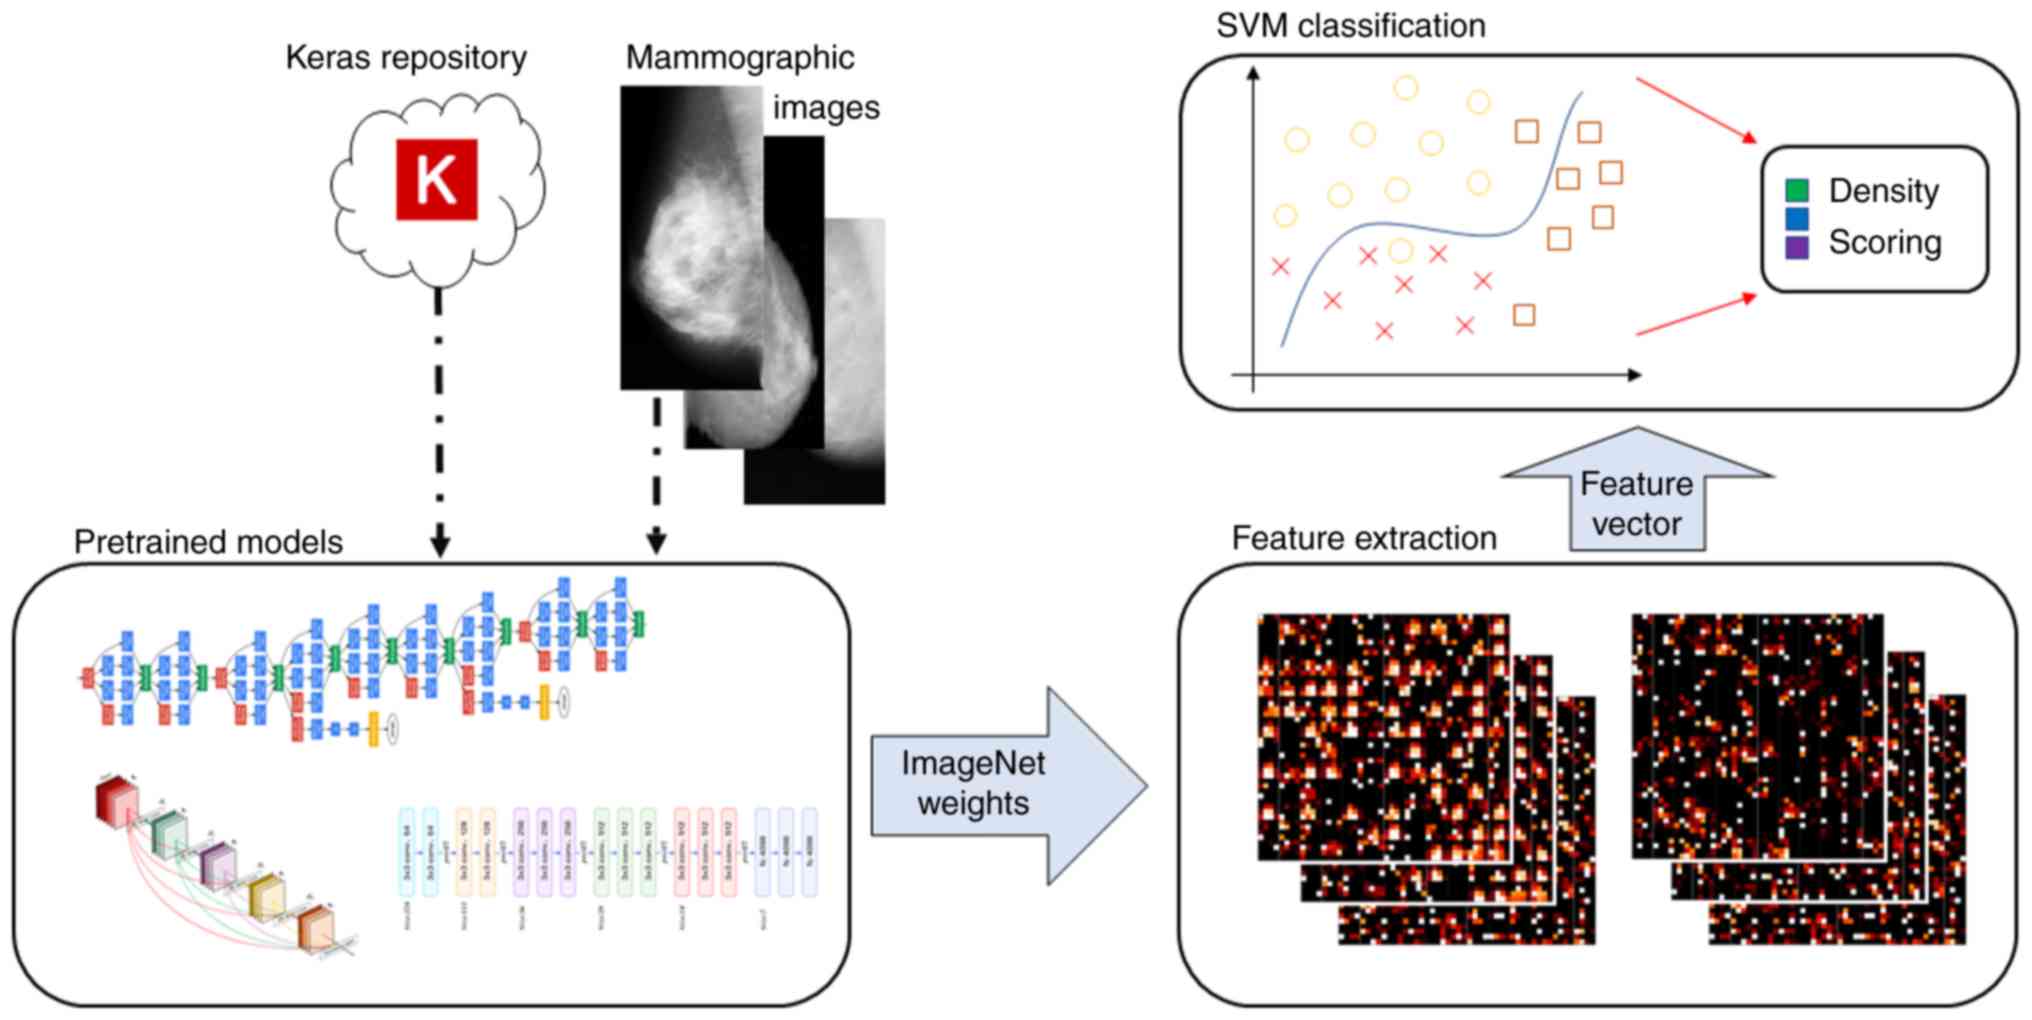
Deep learning based on pre-trained
models
Models
Transfer learning is a powerful research methodology
used in the data science community particularly for overcoming the
limitations arising in highly-specialized but small datasets. In
particular, the contribution of an ‘off-the-shelf’ model in terms
of performance was evaluated by an external classifier as a feature
extraction component. The selected pre-trained models compute
different type of deep features since they integrate diverse
architecture elements, such as residual connections, connectivity
between successive layers, number of layers and number of
parameters.
Deep feature extraction
The pre-trained models with ImageNet weights were
employed for this purpose from the open source Keras library
(21). During feature extraction, the
input layer and the neural part of the trained network were
discarded. This was a necessary step considering the differences in
the ImageNet versus the mini-MIAS image size. Only the weights of
the convolutional part were retained for extracting deep features
from the last convolutional layer of each pre-trained model.
Classification
SVMs are popular classifiers widely used in a
variety of image analysis problems demonstrating robust
performance. Taking into account the different types of
feature-based and deep features calculated by the corresponding
proposed methodologies, SVM was selected for the evaluation of the
classification performance among the feature extraction processes
in a meaningful and direct manner. In particular, the selected
kernels for the studied SVMs were the following: Radial basis
function for the multiclass and linear for the binary MBD
classification. Finally, input feature vectors were generated from
the original 5-fold splits of the corresponding model to guarantee
a fair evaluation.
Performance evaluation metrics
The studied binary classification models were
evaluated mainly in terms of the area under curve (AUC) score,
which is a widely used performance metric of class separability.
The multi-class analyses were evaluated with the following accuracy
(ACC) metric:
TP+TNTP+TN+FP+FN
where TP, TN, FP, and FN stand for true-positive,
true-negative, false-positive and false-negative respectively.
Results
All studied models were fitted on the same
stratified hold-out convergence (training/validation) set and
evaluated on identical testing folds of cross-validation to ensure
a fair and transparent comparison. This resulted in 64.6% training,
15.4% validation and 20% testing mammography images from the
mini-MIAS and 63.9% training, 16.1% validation and 20% testing from
the DDSM database, respectively.
Different algorithms and annotation strategies were
performed on the two studied datasets to identify the optimal
feature space representation. Accuracies in the mini-MIAS dataset
ranged from 50.9% (GABOR + LBP selected features) to 74.2% (LBP)
for three-class classification, while for binary classification,
the AUC scores varied from 48.7% (HOG selected features) to 78.0%
(LBP). Similarly, the previously described methodology was applied
on the full DDSM dataset for predicting the MBD scoring in a binary
and multi-class annotation scheme. The optimal score (ACC 79.3% and
AUC 84.2%) for the feature-based techniques was observed in binary
(non-dense versus dense mammograms) analysis with the SURF method.
The full performance metrics of the proposed machine learning
analyses are presented in Table I
along with results from relevant studies in the literature.
The proposed 2D CNN, as depicted in Fig. 3, is a custom architecture with
hyperparameters tuned on the studied databases. Data augmentation
was applied on the training set to artificially increase the total
number of samples up to a factor of 10 with targeted
transformations, leading to models that are less prone to
overfitting, as mentioned above (please see subsection entitled
‘Data augmentation’ in the section entitled ‘Deep learning-fully
trained CNN methodology’). This increased the validation accuracy
by 4% on average. The convergence process was performed on an
Nvidia GTX 1070 with approximately 7 sec per epoch on the mini-MIAS
and 34 sec per epoch on DDSM. The pre-trained models with ImageNet
weights were downloaded from the Keras library and were utilized as
‘off-the-shelf’ feature extractors with a new input and no fully
connected layers. Only the convolutional kernels with weights
trained on ImageNet were transferred to the new pipeline, where a
feature vector was extracted from the last convolutional layer of
the model and an SVM was trained on the same cross validation folds
as the previous methodologies. A complete pipeline overview of this
methodology is provided in Fig. 4. An
empirical comparison of the average cross-validation performance
metrics reveals the superiority of the data-driven custom CNN
against the other methodologies employed in this study. In
addition, the proposed CNN exhibit a greater efficiency than those
reported in relevant studies on datasets of similar sizes as
presented above in the Introduction section, apart from the
methodology reported by Bovis and Singh (6), achieving up-to 96.9% accuracy, but on a
selected subset of DDSM dataset consisting of 377 images as opposed
to this study with >2.500 patients. The proposed architecture
demonstrates the highest performance in density scoring with AUC
performance of up to 87.3% for the binary classification task and
up to a 79.8% accuracy for the multi-class models. A complete
comparison of the metrics across every methodology and the
corresponding literature is provided in Table I.
Discussion
In the present study, modern machine and deep
learning techniques for MBD classification were developed and
evaluated on two open datasets. A variety of texture and
gradient-based features were investigated in the context of breast
density scoring classification. Additionally, end-to-end image
analysis architectures including fully trained CNN and
‘off-the-shelf’ deep learning models were also employed with the
goal to increase accuracy in the automated breast tissue density
classification.
The examined classification clinical tasks were
selected based on the current literature regarding mammography
image analysis and classification. The majority of similar
published works incorporate binary tissue type analysis (non-dense
versus dense). This was achieved by merging the fatty and glandular
into the ‘non-dense’ class for binary classification in the
mini-MIAS dataset. The DDSM can also be examined as a two-class set
by merging fatty-glandular and dense-extremely dense, or as a
three-class problem with fatty, glandular and a unified
dense-extremely dense and finally a four-class analysis based on
the BI-RADS criteria for tissue characterization.
The reported results in Table I confirm that deep learning
architectures outperform feature-based methods by a wide margin,
exhibiting increased performance regardless of the number of
classes in the classifications tasks. The integration of the NCA
feature selection process in the feature-based analysis did not
improve the performance in most scenarios. It is noticeable that
the performance of all the examined methods is reduced in the DDSM
comparing to the MIAS database providing a robust and objective
benchmark for performance evaluation mainly considering the larger
patient cohort. As discussed in the previous section, according to
the study by Bovis and Singh (6), the
authors reported the optimal performance method concerning the DDSM
database, but using only a limited set of images of the DDSM
database. As regards the findings of this study, the custom CNN
achieved an AUC performance of up to 87.3%, the pre-trained
‘off-the-shelf’ models up to 79.6% and the best feature-based model
up to 70.6%, all for the MIAS database and the binary
classification case. It is worth mentioning that the transfer
learning technique seems promising, particularly as regards the
investigation of fine-tuning of the trained weights to better model
the target domain by adapting additional neural and classification
layers.
This study mainly focused on the medium-size
database setting. As regards the presented deep-learning framework,
other published studies using databases of similar sizes, have
reported an AUC from 59 to 73% for binary MBD classification. In
particular, Kallenberg et al (11) reported an AUC of 59%, while Fonseca
et al (9) and Petersen et
al (10) reported an ACC of 73%
and AUC 68%, respectively. Driven from the results of this study,
the deep learning methodology outperforms the aforementioned
publications as shown in Table I.
Recently, in the literature, deep learning
architectures for MBD classification have achieved greater
performances than this study; however, these were with databases
that are not publicly available and the sample sizes were in the
order of tens of thousands of images. In particular, Lehman et
al (22) claimed an accuracy of
86–94% on >40,000 examinations; however, some issues were raised
regarding the density annotation by the expert radiologists.
Similarly, Mohamed et al (23)
reported an AUC of 92.6–98.8% from a cohort of 1,427 patients, but
with >20,000 images. Ma et al (24) also reported an accuracy of 80.7–89%
with 2,581 cases. It is important to note that the proposed
methodology is not comparable with these studies due to the lack of
performance metrics on benchmark open databases, such as the
examined DDSM, the vastly different database size and the
different, unknown data-curation curation strategies.
The high dimensionality of extracted features and
the challenging feature selection process can be a limiting factor
in feature-based methods. Selecting the optimal extraction
algorithm and reduction strategy requires a domain expert in both
clinical field and statistics. In particular, the extraction of HOG
features could not be completed due to the high demand in
computational time and memory resources for the analysis of a large
dataset like DDSM. By contrast, deep architectures converge to
better models with large databases, but require specialized high
throughput computing (HTC) and a complex hyperparameter search to
ensure a generalizable analysis. This can be partially resolved by
utilizing pre-trained models with the only drawback being the
potential need for fine-tuning for domain adaptation.
A dense breast could possibly mask suspicious
neoplasms difficult to differentiate in routine mammographic
images; thus, a computer-based decision support can add valuable,
objective information in support of the clinicians' assessment. To
this end, MDB classification is a challenging and important task
and the results of this study call for further research in this
field, as well as for the further testing of new methodologies,
particularly in the smaller dataset setting.
To facilitate future research, a meta-model analysis
on multiple feature extraction methods, sophisticated selection
algorithms and machine learning classifiers fused by a higher-level
decision component, such as logistic regression, AdaBoost, weighted
average or even voting could provide richer compact representations
of the mammographic data improving the inference confidence. As
regards the pre-trained models, fine-tuning could introduce
domain-specific analysis improvements allowing an end-to-end fully
automated inference and consequently offering substantial
performance gains. Finally, the integration of both cranio-caudal
and medio-lateral mammographic images either in a unified model or
by combining different methods, features and models derived from
both views, may further enhance the prediction power of such
automated breast density classification systems.
Acknowledgements
Not applicable.
Funding
GSI acknowledges the support by the Hellenic
Foundation for Research and Innovation (HFRI) and the General
Secretariat for Research and Technology (GSRT), under the HFRI PhD
Fellowship grant (GA. no. 31430). ET was financially supported by
the Stavros Niarchos Foundation within the framework of the project
ARCHERS (‘Advancing Young Researchers’ Human Capital in Cutting
Edge Technologies in the Preservation of Cultural Heritage and the
Tackling of Societal Challenges’).
Availability of data and materials
All data generated or analyzed within this study are
included in this published article.
Authors' contributions
ET, GSI, VDM and KM conceived and designed the
study. GZP, AT and DAS researched the literature, performed the
analysis of the data and contributed to the drafting of the
manuscript. ET, GSI, VDM, GZP, AT, DAS and KM critically revised
the article for important intellectual content. All authors have
read and approved the final manuscript.
Ethics approval and consent to
participate
All patient data were obtained from publicly
available datasets. Thus, no approval was required.
Patient consent for publication
Not applicable.
Competing interests
DAS is the Editor-in-Chief for the journal, but had
no personal involvement in the reviewing process, or any influence
in terms of adjudicating on the final decision, for this article.
All the authors declare that they have not competing interests.
References
|
1
|
Duffy SW, Morrish OWE, Allgood PC, Black
R, Gillan MGC, Willsher P, Cooke J, Duncan KA, Michell MJ, Dobson
HM, et al: Mammographic density and breast cancer risk in breast
screening assessment cases and women with a family history of
breast cancer. Eur J Cancer. 88:48–56. 2018. View Article : Google Scholar : PubMed/NCBI
|
|
2
|
Titus-Ernstoff L, Tosteson AN, Kasales C,
Weiss J, Goodrich M, Hatch EE and Carney PA: Breast cancer risk
factors in relation to breast density (United States). Cancer
Causes Control. 17:1281–1290. 2006. View Article : Google Scholar : PubMed/NCBI
|
|
3
|
Checka CM, Chun JE, Schnabel FR, Lee J and
Toth H: The relationship of mammographic density and age:
Implications for breast cancer screening. AJR Am J Roentgenol.
198:W292–W295. 2012. View Article : Google Scholar : PubMed/NCBI
|
|
4
|
Byrne C, Schairer C, Wolfe J, Parekh N,
Salane M, Brinton LA, Hoover R and Haile R: Mammographic features
and breast cancer risk: Effects with time, age, and menopause
status. J Natl Cancer Inst. 87:1622–1629. 1995. View Article : Google Scholar : PubMed/NCBI
|
|
5
|
D'Orsi CJ, Sickles EA, Mendelson EB,
Morris EA, et al: ACR BI-RADS® Atlas, Breast Imaging
Reporting and Data SystemReston, VA: American College of Radiology;
2013
|
|
6
|
Bovis K and Singh S: Classification of
mammographic breast density using a combined classifier paradigm.
Proceedings of the 4th International Workshop on Digital
Mammography. 177–180. 2002.
|
|
7
|
Tzikopoulos S, Georgiou H, Mavroforakis M
and Theodoridis S: A fully automated scheme for breast density
estimation and asymmetry detection of mammograms. Eur Signal
Process Conf. 1869–1873. 2009.
|
|
8
|
Oliver A, Freixenet J and Zwiggelaar R:
Automatic classification of breast densityProceedings of the IEEE
International Conference on Image Processing. IEEE; pp. II–1258.
2005
|
|
9
|
Fonseca P, Mendoza J, Wainer J, Ferrer J,
Pinto J, Guerrero J and Castaneda B: Automatic breast density
classification using a convolutional neural network architecture
search procedureProceedings of the Medical Imaging 2015.
Computer-Aided Diagnosis. 9414. SPIE Medical Imaging; Orlando, FL:
2015
|
|
10
|
Petersen K, Chernoff K, Nielsen M and Ng
AY: Breast density scoring with multiscale denoising autoencoders.
Proceedings of the MICCAI Workshop on Sparsity Techniques in
Medical Imaging. 2012.
|
|
11
|
Kallenberg M, Petersen K, Nielsen M, Ng
AY, Pengfei Diao, Igel C, Vachon CM, Holland K, Winkel RR,
Karssemeijer N and Lillholm M: Unsupervised deep learning applied
to breast density segmentation and mammographic risk scoring. IEEE
Trans Med Imaging. 35:1322–1331. 2016. View Article : Google Scholar : PubMed/NCBI
|
|
12
|
Dalal N and Triggs B: Histograms of
Oriented Gradients for Human Detection. Proceedings of the 2005
IEEE Computer Society Conference on Computer Vision and Pattern
Recognition (CVPR'05). 1. IEEE; pp. 886–893. 2005, View Article : Google Scholar
|
|
13
|
Bay H, Tuytelaars T and Van Gool L: SURF:
Speeded Up Robust FeaturesSpringer; Berlin, Heidelberg: pp.
404–417. 2006
|
|
14
|
Ojala T, Pietikainen M and Harwood D:
Performance evaluation of texture measures with classification
based on Kullback discrimination of distributions. Proceedings of
12th International Conference on Pattern Recognition. 1. IEEE; pp.
582–585. 1994, View Article : Google Scholar
|
|
15
|
Fogel I and Sagi D: Gabor filters as
texture discriminator. Biol Cybern. 61:103–113. 1989. View Article : Google Scholar
|
|
16
|
Deng J, Dong W, Socher R, Li LJ, Li K and
Fei-Fei L: ImageNet: A Large-Scale Hierarchical Image
DatabaseProceedings of 2009 IEEE Conference on Computer Vision and
Pattern Recognition. IEEE; 2009, View Article : Google Scholar
|
|
17
|
Otsu N: A Threshold selection method from
gray-level histograms. IEEE Trans Syst Man Cybern. 9:62–66. 1979.
View Article : Google Scholar
|
|
18
|
Ma WY and Manjunath BS: EdgeFlow: A
technique for boundary detection and image segmentation. IEEE Trans
Image Process. 9:1375–1388. 2000. View Article : Google Scholar : PubMed/NCBI
|
|
19
|
Yang W, Wang K and Zuo W: Fast
neighborhood component analysis. Neurocomput. 83:31–37. 2012.
View Article : Google Scholar
|
|
20
|
Zhao W, Chellappa R and Phillips PJ:
Subspace Linear Discriminant Analysis for Face Recognition
(Technical Report CAR-TR-914)Center for Automation Research
University of Maryland; College Park, MD: 1999
|
|
21
|
Chollet F: Keras. GitHub Repository.
2015.
|
|
22
|
Lehman CD, Yala A, Schuster T, Dontchos B,
Bahl M, Swanson K and Barzilay R: Mammographic breast density
assessment using deep learning: Clinical implementation. Radiology.
290:52–58. 2019. View Article : Google Scholar : PubMed/NCBI
|
|
23
|
Mohamed AA, Berg WA, Peng H, Luo Y,
Jankowitz RC and Wu S: A deep learning method for classifying
mammographic breast density categories. Med Phys. 45:314–321. 2018.
View Article : Google Scholar : PubMed/NCBI
|
|
24
|
Ma X, Fisher CE, Wei J, et al: Multi-path
deep learning model for automated mammographic density
categorizationProceedings of the Medical Imaging 2019.
Computer-Aided Diagnosis. 10950. SPIE Medical Imaging; pp.
862019
|