Introduction
In recent years, dogs have been suggested as a model
for several types of human cancer, including melanoma (1,2). Melanoma
is the most lethal skin cancer affecting humans. According to
‘Cancer statistics, 2018’ from the American Cancer Society, a total
of 9,320 deaths were estimated in 2018, only in the US (3). However, the global incidence of melanoma
is more of a concern (4). Cutaneous
melanoma is the most common form of melanoma among individuals with
fair skin, whereas non-cutaneous melanoma occurs in a greater
proportion in populations of other ethnic groups (4,5). Oral
melanoma is the most common melanoma type among dogs and accounts
for 7% of all malignant tumors in dogs (6). The median progression-free survival of
dogs with oral melanoma is <200 days even following excision and
DNA vaccination (6,7).
It has recently been reported that human mucosal and
dog oral melanoma bear more similar genetic alterations, such as
copy number variations (CNVs), single nucleotide variations (SNVs)
and mutations or deletions than human cutaneous melanoma (8). More similarities have also been observed
in tumor location and histology with the mucosal than the cutaneous
type (2,8). Moreover, the genomic classification of
cutaneous melanoma has revealed a subtype without mutation that
exhibits increased aggressiveness, such as mucosal melanoma
(9,10). Due to these similarities between both
species, dog oral melanoma has been suggested as a suitable model
for both mucosal and triple wild-type human melanoma (2,10,11). Several genetic mutations or loss of
function events observed in human melanoma have also been
identified in dog oral melanoma, such as BRAFV600E
(12), NRAS (Q61) mutation (11), loss function of phosphatase and tensin
homolog (PTEN) (11) and c-KIT
mutation and/or overexpression (13).
Genomic instability is a hallmark of cancer. Some
aberrant genes promote cancer progression, while simultaneously
inhibiting normal cellular process, whereas other deregulated genes
occur as passenger alterations. The identification of specific
cancer-causative genes may be effective for the development of
therapeutic strategies against cancer. In this study, we used a
novel technique to identify genes that are involved in melanoma
development. We hypothesized that cancer-causing genes include
orthologous genes that are altered within the same type of cancer
among different species. Our hypothesis is an extension of cancer
research that has been used for a number of years: Recurrent
abnormalities among multiple cases are more likely to be causative
factors than non-recurrent events. Our view was that recurrently
aberrant orthologous genes in the same type of cancer between two
related species are the main causative agents for disease
progression. We extended our analysis between dogs and humans,
which share ancestral DNA and have a similar incidence of melanoma
(2,14). This approach can better distinguish
melanoma-causing genes from passenger aberrations, which may appear
as a miscue in a single species investigation.
Previous reports have suggested dogs as a model for
human melanoma. However, the genes and pathways involved in
melanoma susceptibility have not yet been studied between species,
at least to the best of our knowledge. In this study, we
systematically analyzed and compared the canine and human melanoma
transcriptome to address two objectives: To identify gene
expression similarities between dog and human melanoma, and to
examine common functional aspects of genes regulated during
melanoma development between the species. We identified common
differentially expressed genes (DEGs) between the two species and
revealed causative or active genes involved in the pathogenesis of
melanoma, which may further aid in the development of more
effective therapeutic approaches for melanoma in both species.
Materials and methods
Tissue samples
Dog oral melanoma tissue samples (n=17) were
obtained following surgical resection (as a primary treatment for
the melanoma patient) at the Kagoshima University veterinary
teaching hospital. The patient's owners were informed prior to
sample collection. Confirmed diagnosis was affirmed by the
hospital. Tissue samples were maintained immediately in
RNAlater™ (Invitrogen; Thermo Fisher Scientific) following
isolation and incubated overnight at 4°C and then stored at −80°C
until further RNA extraction. Detailed information of the 17
samples is listed in Table SI.
Control oral tissues were obtained following surgical resection
from healthy dogs (n=12) during routine anatomical practical
training classes from the Kagoshima University shed. The site (oral
melanoma or healthy oral tissue) and general surgical procedure for
sample collection was the same between the healthy dogs and those
with melanoma. Anesthesia was performed and maintained accordingly
during the surgical procedure [pre-administration: Atropine sulfate
20 µg/kg (i.v.), Robenacoxib 2 mg/kg (i.v.); induction: Propofol ~5
mg/kg (i.v.); Maintenance: Sevoflurane 0.5–5% (inhalation)]. The
anesthesia regimen was according to the American Animal Hospital
Association (AAHA) guidelines (15).
Palpebral and jaw reflexes were used to confirm that the animals
were fully anesthetized. Other monitoring parameters, such as
temperature, heart and respiratory rate, blood pressure, oxygen
saturation, end tidal CO2, etc. were continuously
checked during this period. Animals were not euthanized as part of
the current study. The study design and experimental protocols were
approved by the university and the Kagoshima University veterinary
teaching hospital ethics committee (KV0004).
RNA extraction and sequencing
The mirVana™ miRNA isolation kit (Thermo
Fisher Scientific lnc.) was used to isolate total RNA from the
tissues according to the manufacturer's protocol. RNA concentration
was measured using a NanoDrop 2000c Spectrophotometer (Thermo
Fisher Scientific lnc.). RNA quality and integrity was assessed
using the Agilent 2100 Bioanalyzer (Agilent Technologies). The RNA
integrity number (RIN) mean value for the tissue was 8.8 (range
7–10).
Following RNA isolation and quality assurance, small
RNA libraries were prepared and sequenced by Hokkaido System
Science Co., Ltd. The TruSeq RNA Sample Prep kit version 2
(Illumina) was used for library preparation. The low sample
protocol was followed and input total RNA was 0.5 µg. Briefly,
PolyA-containing mRNA was purified using oligo-dT-attached magnetic
beads. mRNA was fragmented into small sections following
purification under an elevated temperature (94°C) using divalent
cations. Fragmented mRNAs were copied into first-strand cDNA using
reverse transcriptase with random primers. Second-strand cDNA
synthesis was followed by DNA polymerase I and RNase H treatment.
cDNA fragments underwent end repair process, a single addition of
‘A’ base and then ligation of adapters. The final cDNA library was
created through purification and enrichment with PCR process.
Bioinformatics analysis
For bioinformatics analysis, the below procedures
and analyses were performed.
Reads processing and differential
expression analysis
We received high quality reads from the sequencing
facilities average Phred score >36. Sequencing data were
imported into the CLC Bio Genomics Workbench (CLC Bio; Qiagen) as
recommended by the manufacturer's manual (http://resources.qiagenbioinformatics.com). The
normalization of reads, quality, ambiguity and adapter trimming or
quality control was performed with the CLC Bio Genomics Workbench
(versions 9 and 10). Paired end reads (100 bp) were further
analyzed according to the RNA-seq analysis guide of the CLC
Genomics Workbench. Default parameters were used during mapping and
all other subsequent analysis. Briefly, during reads mapping to a
genome, genome annotated with genes and transcripts were selected
and a mRNA track, gene track and a genome track Canis
familiris.canfam3.1 were used (16).
Reference sequences were downloaded using the workbench downloading
option. During counting, the reads for expression values and the
intact pairs were counted, while the broken pairs were ignored. The
expression value was calculated in total counts, unique counts,
transcripts per million, and reads per kilobase of exon model per
million mapped reads (RPKM) (17).
Differential Expression for the RNA-Seq tool was used to perform
the statistical differential expression test. This tool followed a
multi-factorial statistics based on a negative binomial Generalized
Linear Model. The Wald test was used for comparison between the
groups. We set the criteria for differential expression genes as
false discovery rate (FDR) <0.05, fold change (FC) >2 (both
upregulated and downregulated), and maximum group mean >5
(RPKM).
Cross species analysis of DEGs
We downloaded 3 RNA-seq datasets from the GEO
database: GSE71747 for the human melanoma tissue, GSE88741 for the
human melanoma cell line and GSE29155 for human prostate cancer.
The datasets included for the cross-species analysis are
illustrated in Fig. S1. Data were
downloaded directly to the genomic workbench and the
above-mentioned procedures and criteria were followed to analyze
the reads. Human ortholog genes were collected by the BioMart tool
within Ensembl (18). Comparisons
were drawn regarding the FC and with or without statistical
significance of the ortholog genes between the species.
Gene ontology (GO), pathways and
transcription factor analysis
GO and transcription factor analysis was performed
by the WebGestalt (WEB-based GEne SeT AnaLysis Toolkit) (19) following the gene set enrichment
analysis (GSEA) method. For pathway analysis, we blended 2 methods
from WebGestalt and Pathview (20).
We performed GSEA using the WebGestalt and Generally Applicable
Gene-Set Enrichment (GAGE) by Pathview according to their default
settings. Finally significant (q value or FDR <0.05) pathways
from the two methods were selected.
Network analysis
Common DEGs were uploaded to STRING (https://string-db.org/) to obtain the protein
interaction network (21). The
parameter for the confidence score was set to 7. Cytoscape 3.5.1
(https://cytoscape.org/) was used to analyze the
network (22). Closed networks were
considered during network construction both in STRING and
Cytoscape. MCODE algorithm was used within the Cytoscape
application for cluster network analysis.
RT-qPCR
Total RNA (250 ng) was reverse transcribed into cDNA
using the ReverTra Ace® qPCR RT Master Mix with gDNA
Remover (Toyobo). RT-qPCR was performed using a TaqMan®
Fast Advanced Master Mix kit (Thermo Fisher Scientific Inc.) and a
StepOne Plus™ Real Time PCR system (Applied Biosystems; Thermo
Fisher Scientific Inc.). Optimal reagent concentration and reaction
condition described in the manufacturer's instructions were
followed. The thermocycling conditions used for qPCR were as
follows: 50°C for 2 min, 95°C for 20 sec; followed by 40 cycles of
denaturation at 95°C for 1 sec and annealing/extension at 60°C for
20 sec. The 2−ΔΔCq method was used to determine gene
expression levels (23). RT-qPCR
reactions of undetermined Cq were assigned Cq=36 cycle. GAPDH was
used as a quantitative normalization reference. Primer sequences of
the TaqMan Gene Expression assays are available in the following
IDs: Glyceraldehyde 3-phosphate dehydrogenase (GAPDH; Cf04419463),
collagen type VII alpha 1 chain (COL7A1; Cf02690281), AKT
serine/threonine kinase 3 (AKT3; Cf02704523), ERBB receptor
feedback inhibitor 1 (ERRFI1; Cf02653684), inhibitor of nuclear
factor kappa B kinase subunit beta (IKBKB; Cf02695869), nerve
growth factor (NGF; Cf02697134), epidermal growth factor receptor
(EGFR; CF02626541), matrix metalloproteinase 9 (MMP9; CF02621845)
and interleukin (IL)6 (Cf02624282). The details of the mentioned
IDs can be found in the following website: https://www.thermofisher.com/order/genome-database/.
Statistical analysis
GraphPad Prism 7 (www.graphpad.com) was used for statistical analysis.
Hierarchical clustering analysis was performed on log10
ratio with every gene expression from each sample. Hierarchical
clustering was done with Euclidean distance metrics and complete
linkage algorithm. Comparisons between the group (healthy, n=12;
melanoma, n=17) of the RT-qPCR data were performed using the
Mann-Whitney U-test. A P-value <0.05 was considered to indicate
a statistically significant difference.
Results
RNA-seq
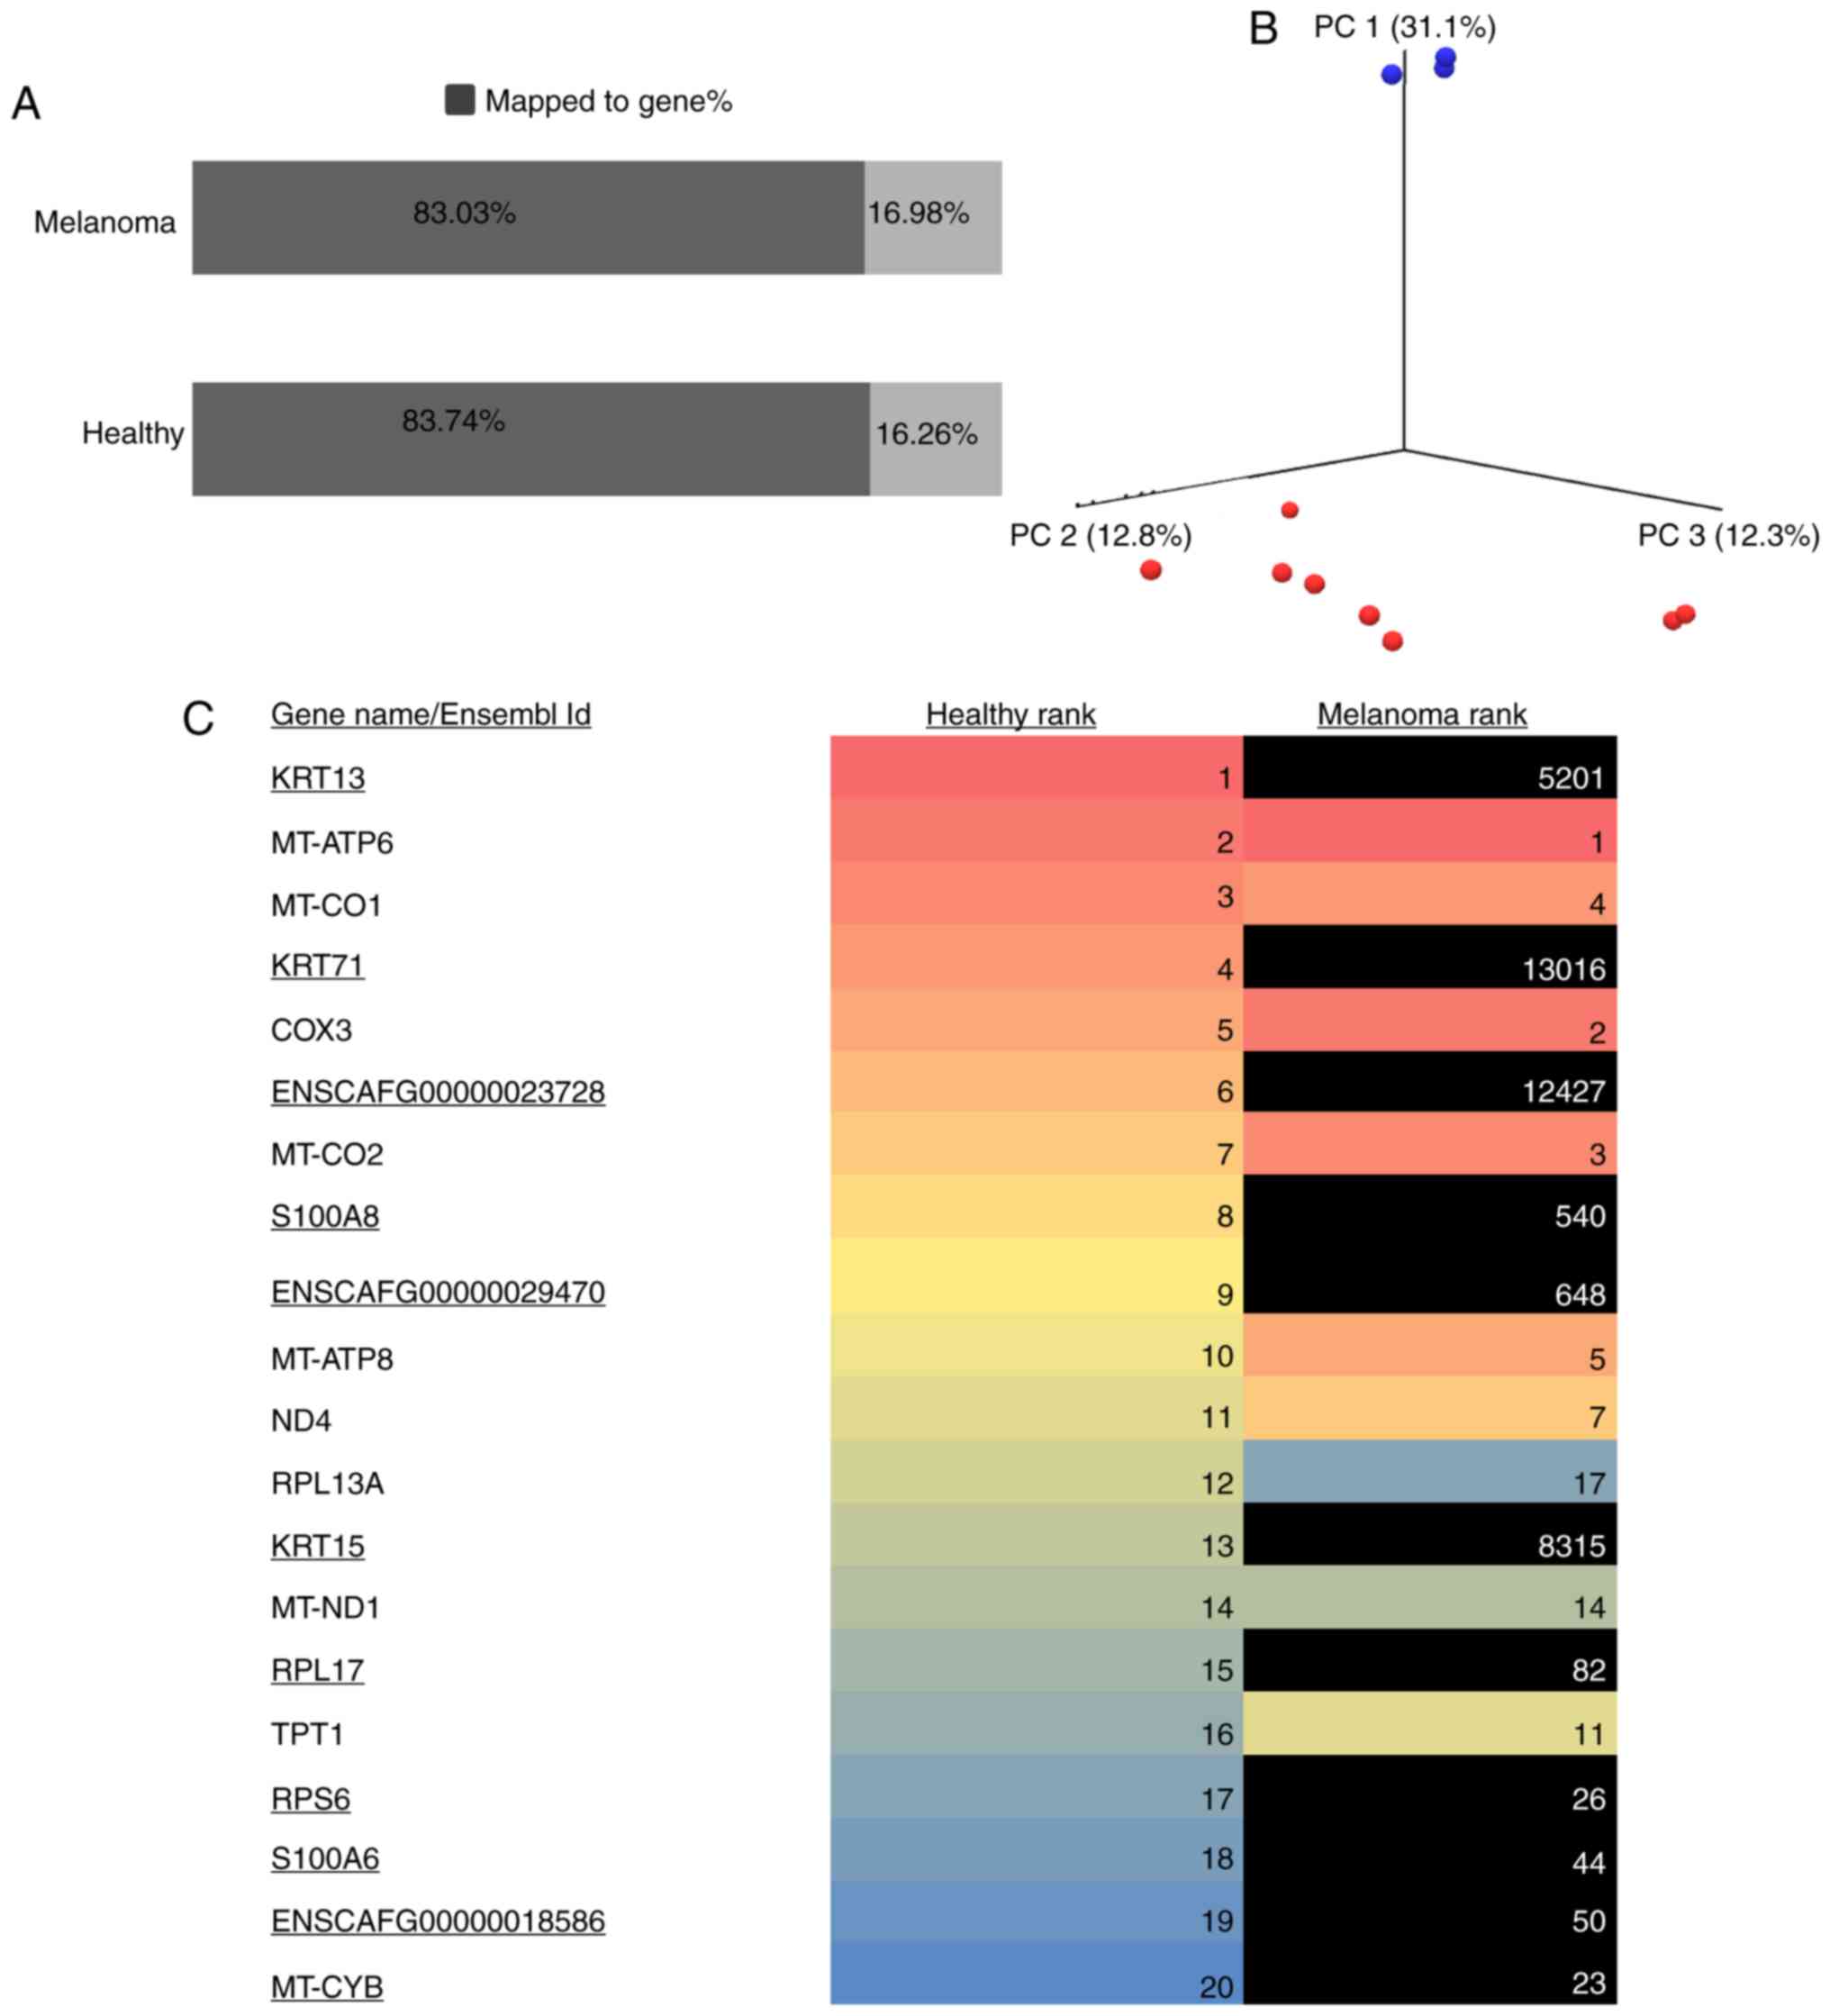
RNA-seq was performed successfully for 11 samples
(healthy controls, 3; melanoma, 8). Sequences were submitted to SRA
databases (PRJNA527141). All sequence data were 2×100 bp in length
with high quality metrics (>36 Phred score). The total number of
read pairs ranged from 44 million to 47 million. Approximately 83%
(range: 81–84%) of the read pairs were mapped to gene track
(Canfam3.1). The percentage of genomic mapping was similar between
the control and melanoma samples (means ± SD: 83.743±0.357 and
83.023±0.645%, respectively) (Fig.
1A), suggesting that no significant biases were introduced
during data generation between the groups (P=0.133). Mapping
statistics indicated that the data were of high quality and uniform
(no outliers regarding the genome). Principal component analysis of
the expressed genes revealed a clear separation of the control
group from the melanoma group (Fig.
1B). The status of the top 20 expressed genes in the healthy
group was compared with the expression in the melanoma group. In
total, 11 of the top 20 expressed genes in the healthy group were
not observed in the melanoma group (Fig.
1C). KRT13 was the most highly expressed gene in the
controls and MT-ATP6 was the most highly expressed gene in
the melanoma group (Table SII).
Known melanoma oncogenes, such as COL1A1, Vimentin and
SPARC, were among the top 10 expressed genes in the melanoma
group, while these genes were absent in the healthy group. These
results revealed that the data had sufficient sequencing depth and
were suitable for further differential expression analysis.
Identification and characterization of
DEGs
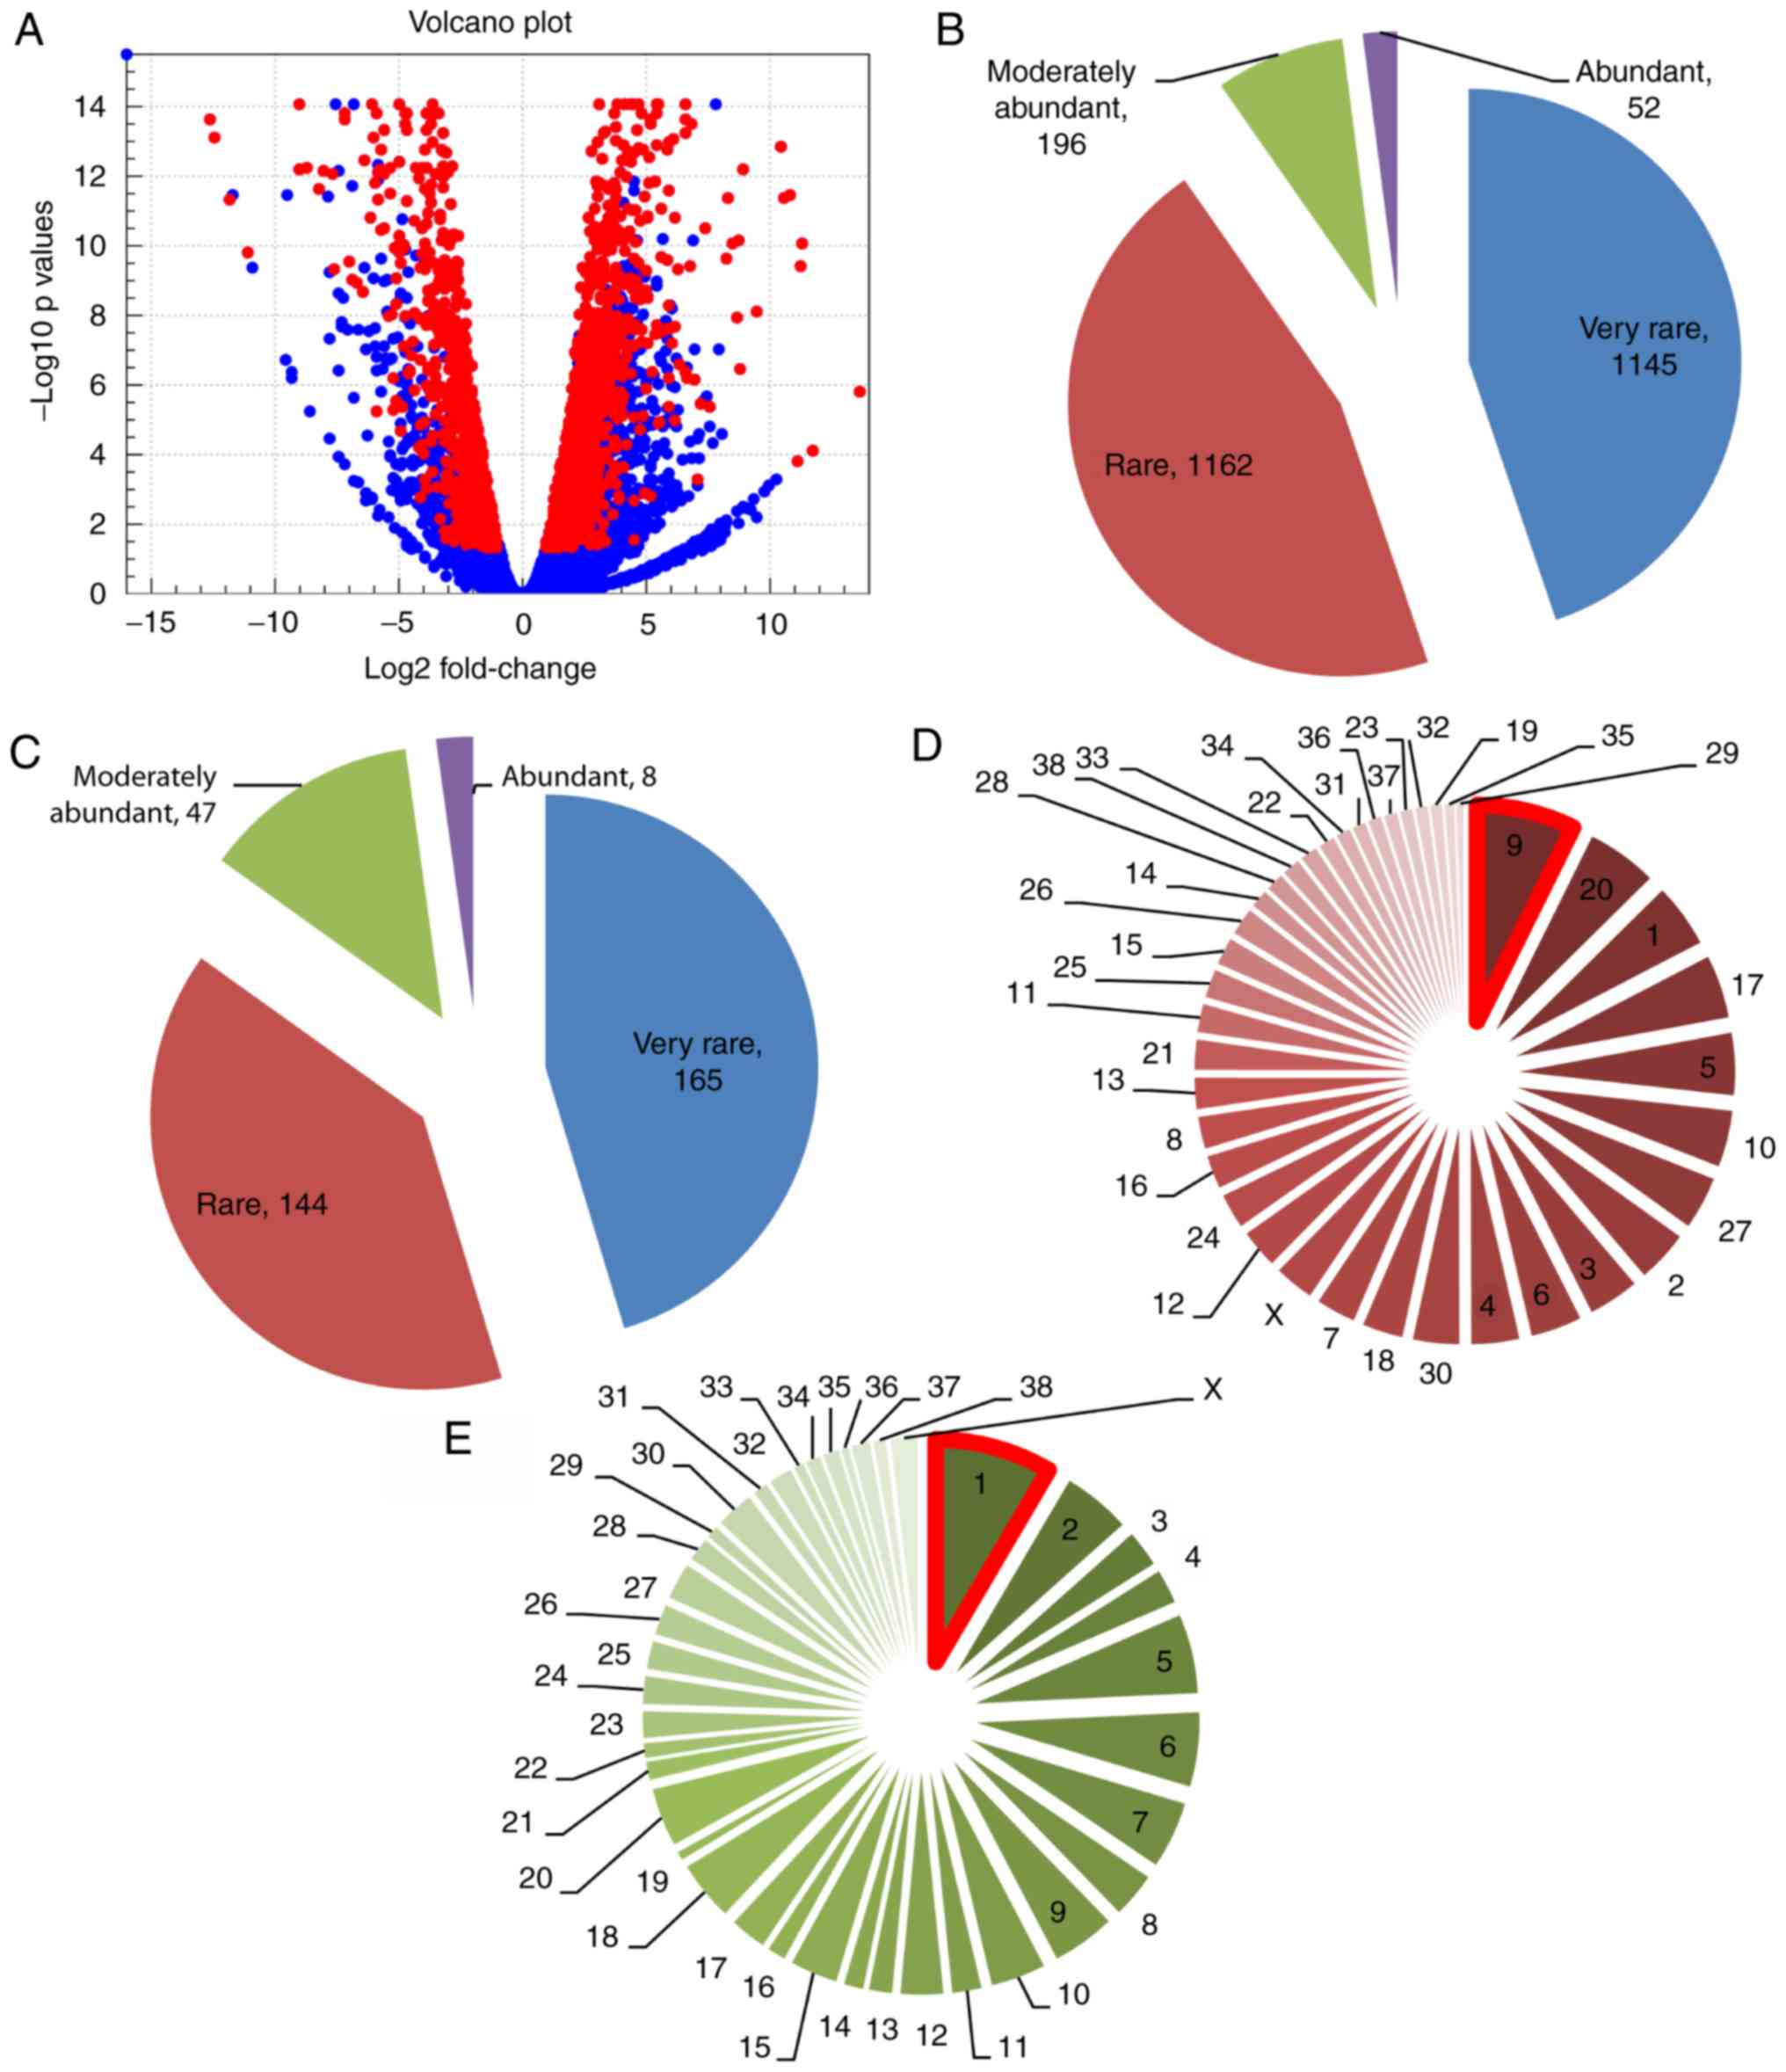
To identify DEGs in the melanoma samples, we set up
the following stringent criteria: FDR <0.05, FC >2, and
maximum group mean >5 (RPKM). This criterion identified 2,555
DEGs (Fig. 2A), including 1,421
upregulated and 1,134 downregulated genes (Tables SIII and SIV). The magnitude of the FC was higher in
the downregulated group. In addition, 364 DEGs annotated by Ensembl
were defined as novel genes, as they did not match species-specific
entries in the UniProtKB/Swiss-Prot or RefSeq databases; these
genes included 219 upregulated and 145 downregulated genes
(Tables I and SV).
 | Table I.Top 20 novel differentially expressed
genes in canine oral melanoma. |
Table I.
Top 20 novel differentially expressed
genes in canine oral melanoma.
| Ensembl ID | Chromosome | Region | Max group mean | Log2
fold change | FDR P-value |
|---|
|
ENSCAFG00000023728 | 17 |
61715810..61716667 | 6965.176802 | −13.0728668 | 0 |
|
ENSCAFG00000029470 | 7 | Complement | 4441.530653 | −6.317147271 | 8.66135E-15 |
|
|
|
(43565980..43569673) |
|
|
|
|
ENSCAFG00000018586 | 4 |
67701614..67703002 | 1576.83413 | −1.476555989 | 0.044341327 |
|
ENSCAFG00000032057 | 26 |
27624214..27624534 | 1030.146501 | 6.625580707 | 3.22992E-14 |
|
ENSCAFG00000031806 | 26 |
27626671..27632004 | 645.9357198 | 7.033040174 | 0 |
|
ENSCAFG00000030258 | 8 | Complement | 585.378127 | 7.09342349 | 0 |
|
|
|
(72906321..73387840) |
|
|
|
|
ENSCAFG00000017655 | 30 | Complement | 554.1272685 | 1.5182161 | 0.02925338 |
|
|
|
(35713470..35737559) |
|
|
|
|
ENSCAFG00000000471 | 12 | 742518..744376 | 502.6434471 | −14.74161241 | 0 |
|
ENSCAFG00000031786 | 26 |
27605067..27616302 | 497.5464419 | 7.498002132 | 0 |
|
ENSCAFG00000015206 | 21 |
40680858..40685074 | 476.1739252 | 7.802839134 | 0 |
|
ENSCAFG00000030164 | X | Complement | 473.8678307 | −1.319491428 | 0.025365105 |
|
|
|
(82986436..82986741) |
|
|
|
|
ENSCAFG00000019812 | 6 | Complement | 360.4657394 | −2.977400921 | 4.13027E-06 |
|
|
|
(42202578..42207944) |
|
|
|
|
ENSCAFG00000023111 | 17 | Complement | 354.3255735 | −1.423676 | 0.00159774 |
|
|
|
(60984425..60987378) |
|
|
|
|
ENSCAFG00000016966 | 30 |
27636259..27664073 | 309.6540468 | 2.174448832 | 0.018722413 |
|
ENSCAFG00000032259 | 9 | Complement | 298.0600534 | −8.627843471 | 0 |
|
|
|
(37617977..37622560) |
|
|
|
|
ENSCAFG00000019141 | X | Complement | 277.0573496 | −1.266862717 | 0.016078337 |
|
|
|
(119204969..119205259) |
|
|
|
|
ENSCAFG00000032358 | 8 | Complement | 268.1075815 | 5.707864264 | 5.27351E-11 |
|
|
|
(72847361..72852219) |
|
|
|
|
ENSCAFG00000029493 | 26 |
27620223..27620543 | 264.9025566 | 6.875187743 | 1.58428E-08 |
|
ENSCAFG00000014627 | 3 |
60899870..60901258 | 261.1790712 | 8.044118048 | 1.11703E-08 |
|
ENSCAFG00000012022 | 17 |
59698670..59701290 | 254.5146118 | −4.447052200 | 8.66135E-15 |
We then classified the DEGs based on expression
according to a previous study, with slight modifications (24). Genes were defined as very rare (5–15
RPKM), rare (16–99 RPKM), moderately abundant (100–499 RPKM) and
abundant (>500 RPKM). The majority of genes were categorized as
very rare (44.8%) and rare (45.5%), followed by moderately abundant
(7.7%) and abundant (2.0%) (Fig. 2B).
Similarly, the novel genes were mostly categorized as very rare
(45.32%) and rare (39.56%), followed by moderately abundant
(12.91%) and abundant (2.2%) (Fig.
2C).
We then examined the ‘on-off’ genes in melanoma.
Genes that were highly expressed (>5 RPKM maximum group mean) in
one group with no expression in the other group (<1 RPKM min
group mean) and FDR as ‘0’ were defined as ‘on-off’ genes. We
identified 321 ‘on-off’ genes, including 80 ‘on’ (upregulated)
genes and 241 ‘off’ (downregulated) genes (Tables SVI and SVII). Among the ‘on’ genes, BGN,
CXCL8 and PI3 were abundant genes (>500 RPKM),
whereas 14 ‘off’ genes, including 3 keratin genes (KRT13,
KRT71 and KRT78), were abundant. In the novel gene
group, we identified 48 ‘on-off’ genes (13 ‘on’ and 35 ‘off’
genes). Two genes were abundant (>500 RPKM) in each group
(Tables SVIII and SIX). The abundant ‘on-off’ genes are
presented in Table II.
| Table II.Abundant ‘on-off’ genes in canine
oral melanoma. |
Table II.
Abundant ‘on-off’ genes in canine
oral melanoma.
| Name | Chromosome | Max group mean | Log2
fold change | FDR P-value |
|---|
| BGN | X |
750.6354384 |
5.44424503 | 0 |
| CXCL8 | 13 |
718.7157383 |
8.318634019 | 0 |
| PI3 | 24 |
625.5995841 |
8.475895656 | 0 |
| KRT13 | 9 |
19890.23609 | −11.27810332 | 0 |
| KRT71 | 27 |
7541.688327 | −15.13319019 | 0 |
| S100A8 | 7 |
5616.157022 | −6.39785469 | 0 |
| ARSF | X |
1426.603766 | −12.19831506 | 0 |
| TGM3 | 24 |
1376.03872 | −15.43829609 | 0 |
| AQP3 | 11 |
1324.472821 | −11.7832697 | 0 |
| S100A14 | 7 |
1165.913739 | −9.555767692 | 0 |
| SPRR3 | 17 |
1090.426813 | −13.23899417 | 0 |
| S100A2 | 7 |
1023.838115 | −8.469980831 | 0 |
| SFN | 2 |
769.2134926 | −8.549424168 | 0 |
| RHCG | 3 |
723.8378326 | −12.84073049 | 0 |
| SPINK5 | 2 |
646.388121 | −11.37480897 | 0 |
| S100A16 | 7 |
549.0286762 | −6.490015324 | 0 |
| KRT78 | 27 |
508.5240706 | −11.77812871 | 0 |
|
ENSCAFG00000031806 | 26 |
645.936 |
7.03304 | 0 |
|
ENSCAFG00000030258 | 8 |
585.378 |
7.09342 | 0 |
|
ENSCAFG00000023728 | 17 |
6965.18 | −13.073 | 0 |
|
ENSCAFG00000000471 | 12 |
502.643 | −14.742 | 0 |
To identify which chromosome harbored the majority
of the DEGs, we analyzed the chromosomal location of all DEGs. We
found that the highest number of upregulated genes (n=104) were on
CFA9 (dog chromosome 9) and the highest number of
downregulated genes (n=96) were on CFA1 (dog chromosome
1) (Fig. 2D and E). We also observed
that 12 upregulated and 13 downregulated novel genes were located
on CFA9 and CFA1, respectively (Table SV). Of note, the highest numbers of
‘on’ genes (n=8) and ‘off’ genes (n=26) were on CFA9 and
CFA1, respectively (Tables
SVI and SVII). When sequence
reads were mapped against these 2 chromosomes, there were missing
peaks or new peaks (peaks were made by the mapped sequence in the
region) in each group (Fig. 2F and
G).
We then performed functional analysis of the DEGs.
Using the PANTHER classification system (25) DEGs produced 1,701 protein hits with 24
protein classes (Fig. S2A and B).
The most abundant group of genes was in hydrolase (8.70%).
Relatively higher percentages of upregulated genes were in the
signaling molecule, enzyme modulator, receptor, extracellular
matrix protein, defense/immunity protein and cell adhesion
molecule. Immuno-related genes are also investigated by comparing
the immune-genes from ImmPort resources (26). We found 174 and 75 immunogenes in the
up- and downregulated group, respectively. In both groups,
antimicrobial-related immunogens were abundant (Fig. S2C). Subsequently, we performed
overrepresentation enrichment analysis (ORA) and found chemokines
and antimicrobials were 2 significant (P<0.05) terms in the
upregulated group with the highest enrichment ratio (chemokines,
1.6; antimicrobials, 1.3), respectively. The term chemokines was
most enriched in the downregulated group, but did not bear
statistical significance (data not shown).
GO, pathway and transcription factor
analysis
GO analysis
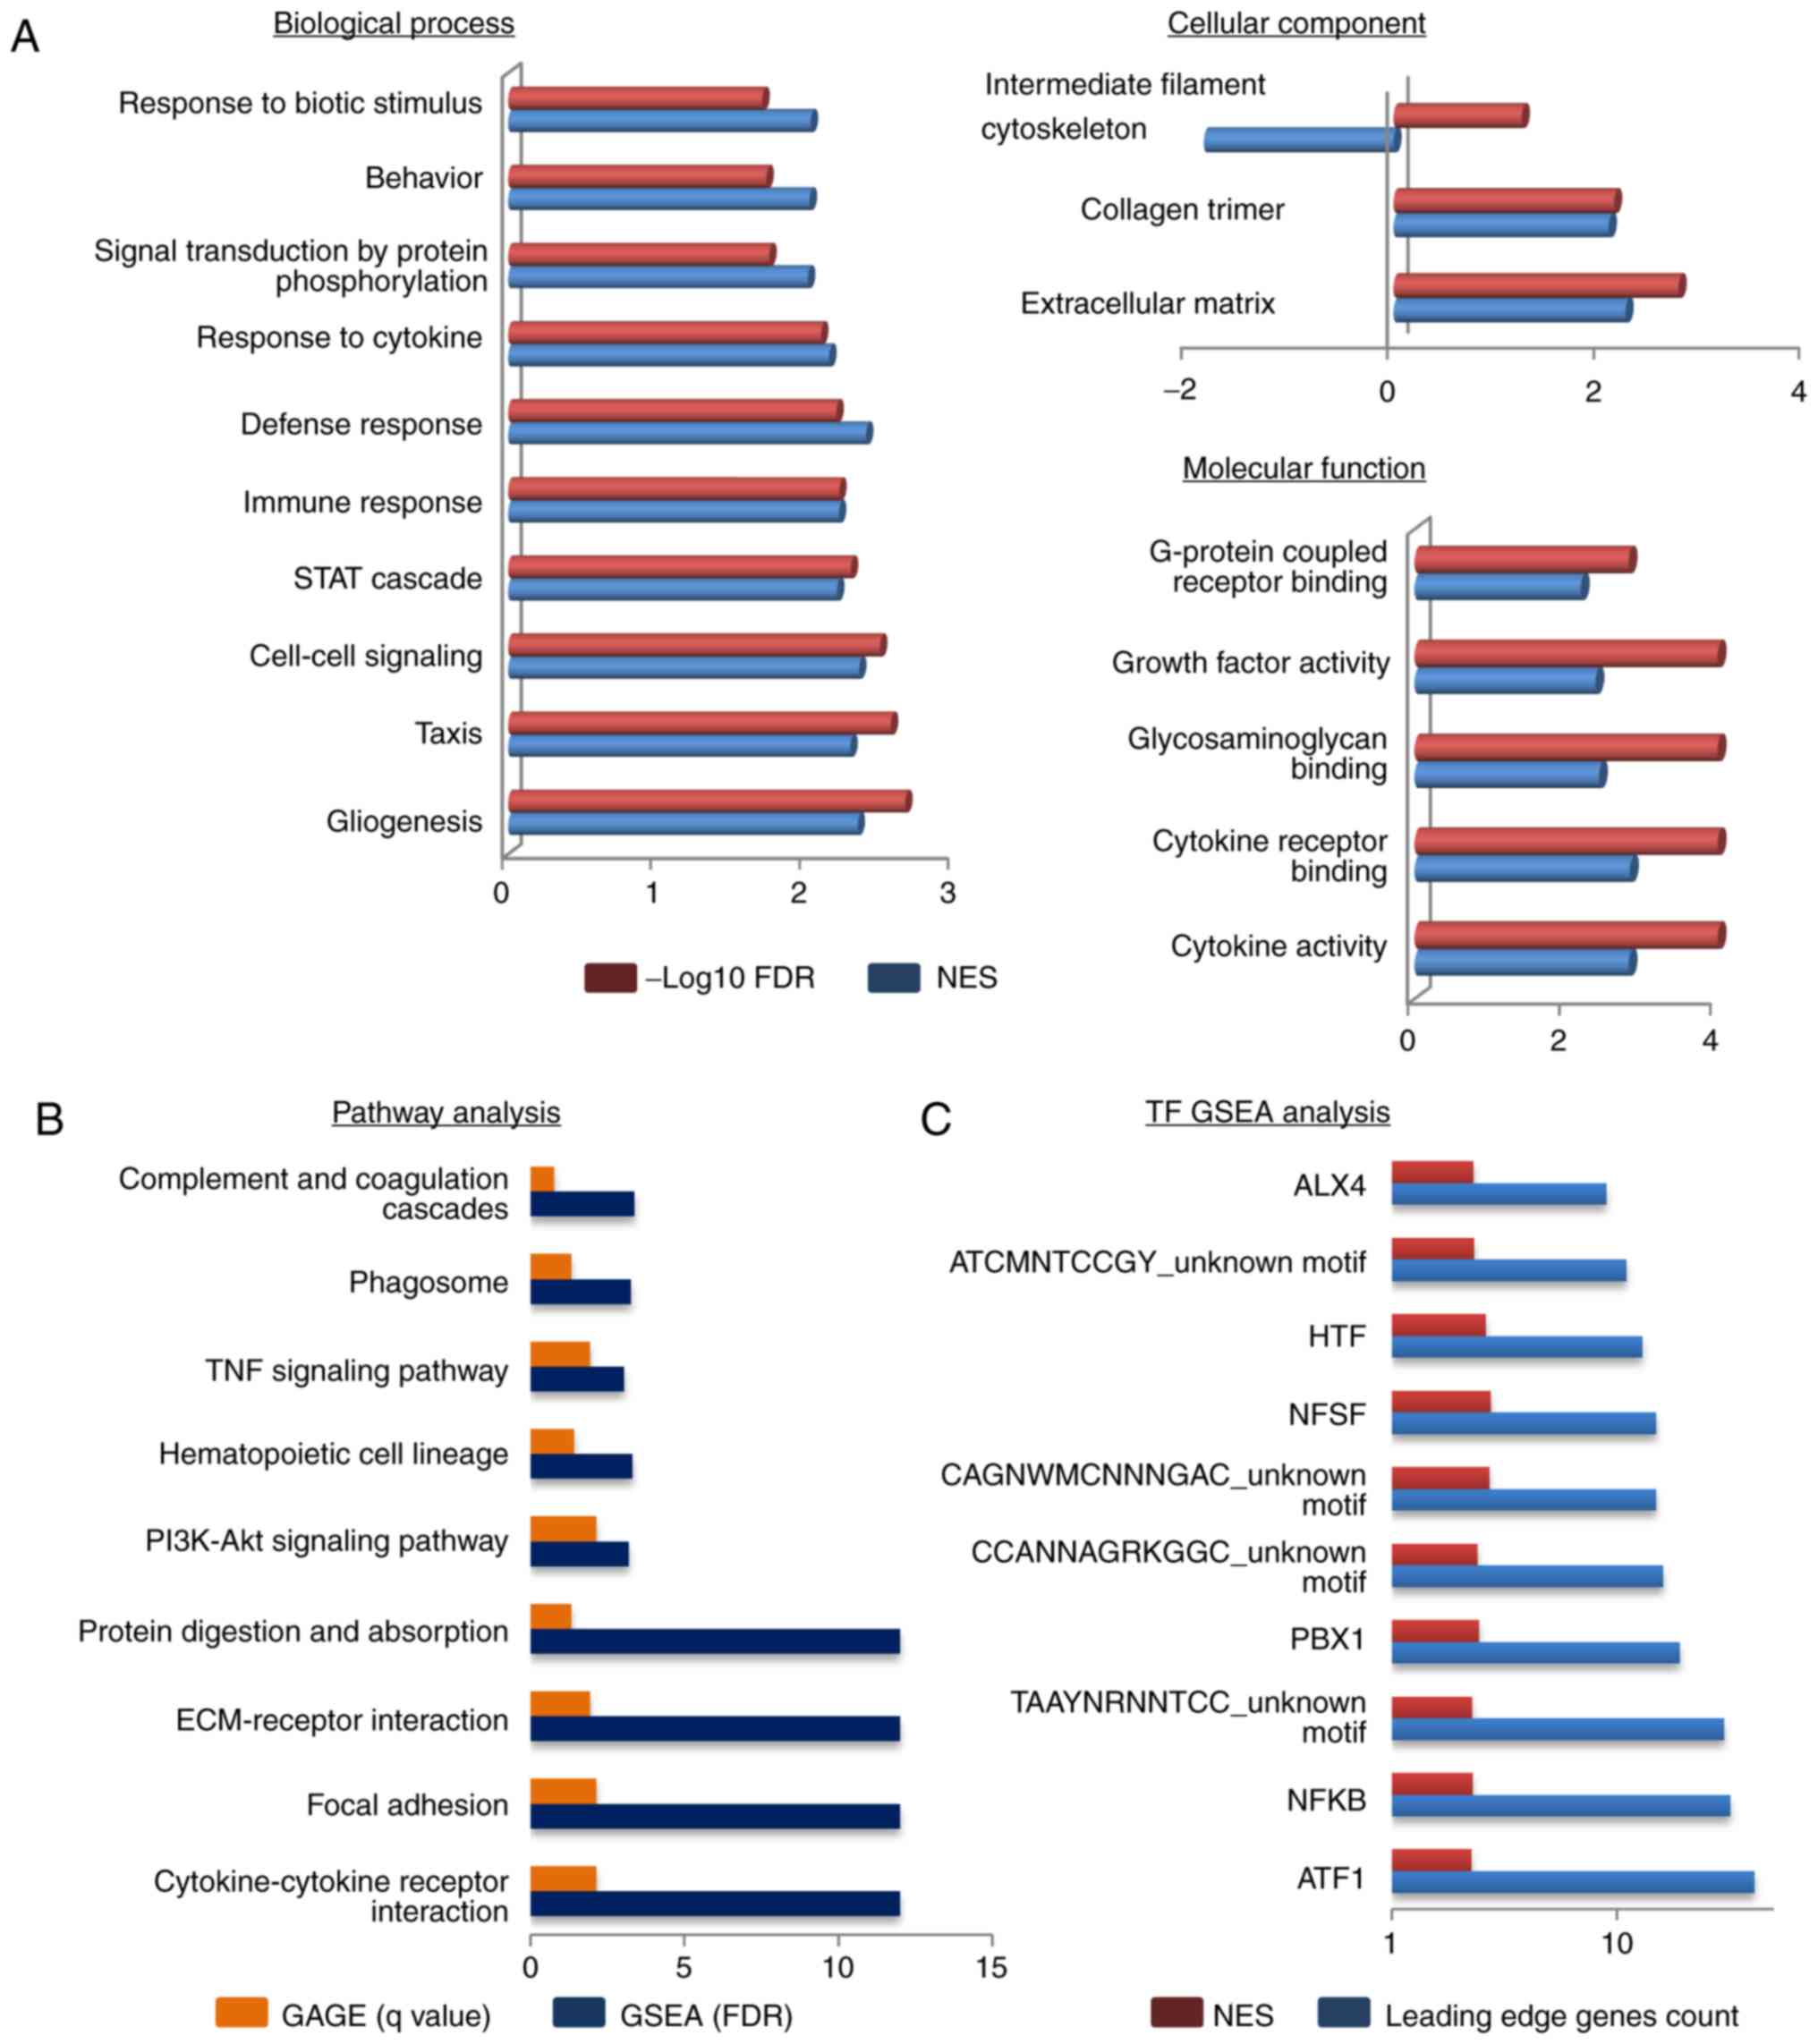
We then analyzed the DEGs by WebGestalt using the
GSEA method. GO analysis categorizes DEGs into 3 categories: i)
Biological process (BP); ii) cellular component (CC); and iii)
molecular function (MF). In total 18 GO terms were significantly
enriched (Fig. 3A). Defense response
(GO: 0006952), cell-cell signaling (GO: 0007267), extracellular
matrix (GO: 0031012), collagen trimer (GO: 0005581), cytokine
receptor binding (GO: 0005126) and cytokine activity (GO: 0005125)
were the top enriched terms in each category. Other significant GO
terms (gliogenesis, taxis, immune response, growth factor activity,
glycosaminoglycan binding, G-protein coupled receptor binding)
related with the altered physiology during melanoma progression.
Among the 18 significant GO terms, 9 were directly related to
cytokines. Taken together, the GO results indicate that most DEGs
are involved in cytokine-oriented functions.
Pathway analysis
We performed pathway analysis by 2 methods: GAGE and
GSEA. In total, 9 common pathways were significantly enriched in
both methods (Fig. 3B). To rank the
pathways, the position of each analysis was taken and the average
was examined. Cytokine-cytokine receptor interaction (CFA04060),
focal adhesion (CFA04510) and ECM-receptor interaction (CFA04512)
were the top 3 pathways. PI3K-AKT (CFA04151) and TNF (CFA04668)
signaling pathways were also present in our analysis.
Enriched transcription factor
motif
To examine motifs up to 4 kb around the
transcription start sites of the DEGs, we used GSEA within
WebGestalt. In total, 10 transcription site binding motifs were
significantly enriched in the upregulated DEGs (Fig. 3C). Among these 10, 6 were known and 4
were unknown motifs that do not match any known transcription
factor binding site from the database (v7.4 TRANSFAC). The binding
motifs for ATF1 and NF-κB were observed in the highest number of
upregulated DEGs.
Cross species analysis of human and
dog melanoma
We analyzed 2 human melanoma RNA-seq from GEO
datasets (please see Materials and methods). To evaluate the
pattern of FC of the dog DEGs in human melanoma, we converted the
genes to the human orthologues and compared the FC with the human
melanoma study without considering statistical significance. The
analysis of the human melanoma tissue results revealed that 63% of
the upregulated genes and 40% of the downregulated genes had the
same direction of FC between the species (Fig. 4A). In the case of human melanoma cell
lines, we observed 58 and 47% similarities in FC, respectively
(Fig. S3A). Of note, when we
compared the statistically significant genes between the species
(FDR <0.05, FC ≥2; common DEGs), the percentage of shared
upregulated genes increased (tissue, 88%; cell line, 62%) in both
experiments (Figs. 4B and S3B, and Tables
SX-SXIII). These findings indicate a marked overlap in
upregulated genes or oncogenes between human and dog melanoma.
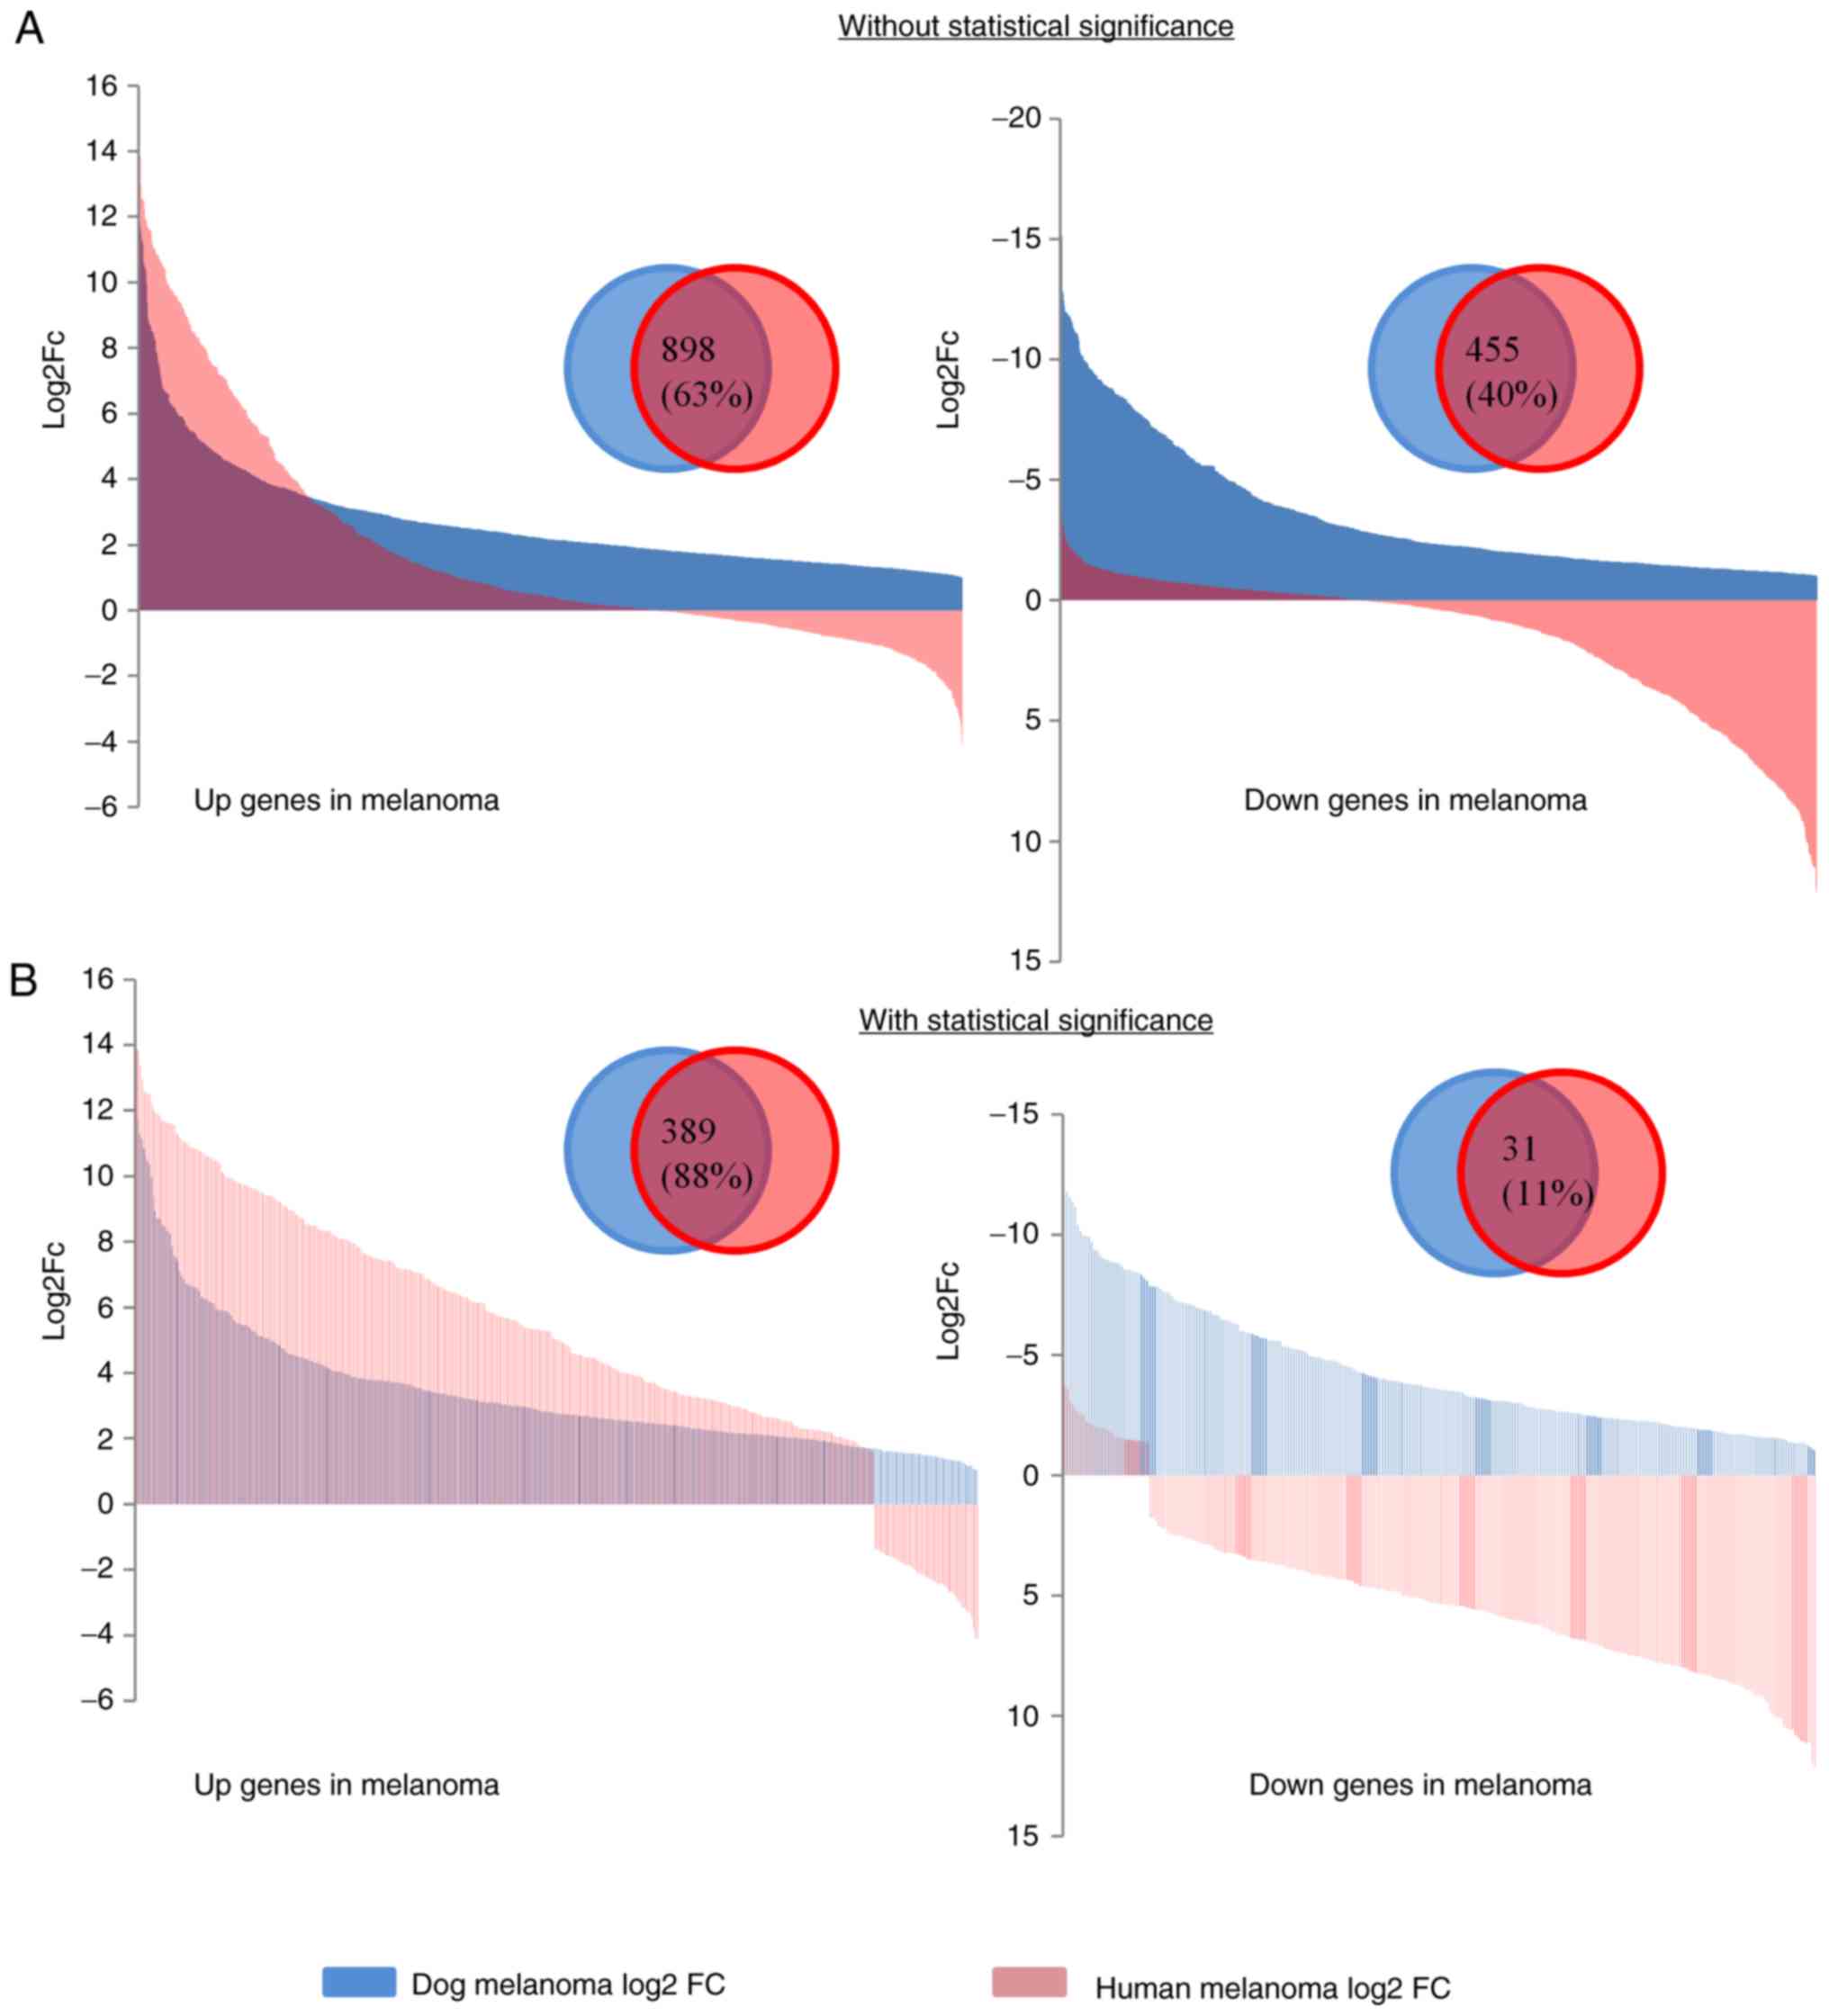 | Figure 4.Differentially expressed genes
between human and dog melanoma. (A and B) Gene fold change (FC)
between the species with or without considering statistical
significance in dog melanoma. Numbers and percentages of common up-
and downregulated genes are shown in the overlapping region. The
x-axis is the number of genes and the y-axis indicates the FC. (C)
Heatmap with cluster analysis showing the expression of common
oncogenes between prostate cancer cell lines (LNCaP-P1-P7), human
melanoma cell lines [SK_MEL_28 (28_1-3), SK_MEL_147 (147_1-3),
UACC_62 (62_1-3)], canine oral melanoma (DM_1-8) and human tissue
melanoma (HM_1-17). The color gradient on the right indicates the
expression values. Euclidean hierarchical clustering with complete
linkage was used. Dog and human clustered together is indicated
within the red line. Differentially expressed genes between human
and dog melanoma. (D) Common enriched pathways between humans and
dogs. Schematic on top right panel indicates how leading edge genes
were defined. Fold changes of the leading edge genes from the top 3
pathways in both species are shown on the bottom panel. FDR, false
discovery rate; NES, normalized enrichment score. (E) Schematic
presentation of 12 network clusters established by the common
differentially expressed genes. (F) The first three clusters are
shown in which a node indicates a gene and the lines between them
indicate the edge. Red color indicates upregulated genes and green
represents downregulated genes. Differentially expressed genes
between human and dog melanoma. (G) Relative expression of COL7A1
(healthy control, n=9), AKT3, ERRFI1, EGFR, NGF, IL6, MMP9 and
IKBKB genes examined by RT-qPCR in healthy oral tissue (n=12) and
oral melanoma (n=17). *P<0.05, ***P<0.01, ****P<0.0001.
The bars indicate standard deviation (SD). RE, relative expression;
COL7A1, collagen type VII alpha 1 chain; AKT3, AKT serine/threonine
kinase 3; ERRFI1, ERBB receptor feedback inhibitor 1; EGFR,
epidermal growth factor receptor; NGF, nerve growth factor; IL6,
interleukin 6; MMP9, matrix metallopeptidase 9; IKBKB, inhibitor of
nuclear factor kappa B kinase subunit beta. |
To further understand the association between human
and dog tissue melanoma, we performed hierarchical clustering
analysis. Common DEGs between the 2 melanoma (human and dog) tissue
experiments were selected and expression values were considered
from all other experiments for clustering. Clustering analysis of
dog and human melanoma tissues, cell line and prostate cancer
revealed that dog melanoma clustered together with a subset of
human tissue melanoma samples (Fig.
4C). These results indicate the closer transcriptomic
similarities between dog and human melanoma compared with other
types of cancer. Prostate cancer data were included to indicate the
dissimilarities in different types of cancer between the
species.
We found that 429 upregulated melanoma signature
genes, including 105 genes commonly upregulated in all 3 melanoma
sets, 284 genes upregulated in human and dogs tissue melanoma, and
40 genes upregulated in cell line and dog melanoma, were the main
causative driver genes for melanoma development (Table SXIV). Approximately half (n=41, 51%)
of the on genes identified in dog melanoma samples were present in
this group.
To examine the processes of melanoma development in
the 2 species, we performed GSEA of common DEGs from 3 experiments.
In total 10 pathways had an FDR <0.06 and 3 had a normalized
enrichment score >2 (Fig. 4D). The
top 3 pathways were immune and signaling related pathways. The
leading edge genes of these pathways were also deregulated in a
similar pattern in both species (Fig.
4D, lower panel).
We established a network from common DEGs by STRING
and performed analysis by MCODE in Cytoscape. Twelve cluster
networks were obtained (Fig. 4E). The
majority of the genes of the first 3 networks encode signaling
peptides. Genes in the first network are collagen and integrin
genes (Fig. 4F; upper left panel).
The second and third cluster genes are genes encoding
cytokines-chemokines and growth factors (Fig. 4F; upper right and lower panels). As
the FC of genes in the network was the same between the species,
this indicated that these genes may exhibit similar melanoma
promoting networking function between the species.
Validation of DEGs by RT-qPCR
To confirm the result of RNA-seq we validated
several genes by RT-qPCR. We confirmed that COL7A1, AKT3,
ERRFI1, IKBKB, NGF, IL6, MMP9 and EGFR genes were
differentially expressed in dog melanoma (Fig. 4G). Similar fold changes of the genes
were observed between RNA-seq and RT-qPCR.
Discussion
To the best of our knowledge, this is the first
report of comprehensive RNA-seq in canine oral malignant melanoma.
A previous study performed RNA-seq on canine cutaneous melanoma
(27). Oral melanoma is the most
frequent site for malignant melanoma compared with cutaneous type
(11,28). In addition, previous studies have
demonstrated that oral melanoma in dogs can be used as a model for
human melanoma (2,10,11).
The results of this study revealed that COL1A1,
SPARC and VIM were the top highly expressed DEGs in
canine oral malignant melanoma. These genes have also been well
studied in human melanoma or other types of cancer for their
oncogenic behavior (29–32). In comparison, KRT13, KRT71 and
S100A8 were not expressed in the melanoma group. In a study
on human squamous cell carcinomas of the head and neck and
esophagus, KRT13 was found to be epigenetically silenced,
while the chromosomal location of the S100A8 gene was found
to be frequently altered or deleted and downregulated (33,34).
However, genes that are expressed in either of the group bear more
significance than those with less magnitude of change. These genes
bear more importance for biomarker or therapeutic study. We thus
found the 80 genes that were expressed only in canine malignant
melanoma (>5 RPKM maximum group mean) compared with healthy
tissue (<1 RPKM min group mean), with the aim of identifying
genes that were turned on during melanoma progression. Using this
criterion, BGN, CXCL8 and PI3 were identified as 3
abundant genes in canine malignant melanoma. Only CXCL8 was
previously investigated in dogs to be increased in hemangiosarcoma
(35). BGN, CXCL8 and
PI3 have previously been studied in human melanoma and other
types of cancer (36–38). The abundant genes are only
approximately 2% of the total DEGs. As highly expressed genes
(abundant) are transcribed upon the essential demands of cells,
their exact association with and involvement in melanoma
progression warrants further investigation.
Cytogenic analysis of the DEGs revealed that
CFA1 harbored the majority of the ‘off’ genes or
downregulated genes. Loss of alleles or abnormalities in
HSA1 (human chromosome 1) in human malignant melanoma
was previously reported (39,40). This suggests that chromosome 1 is
important in melanoma and the function in melanoma suppression is
conserved in both species. We examined the distribution of DEGs in
24 protein classes and found the highest number of genes within the
hydrolase category (220 genes). Most of the hydrolases were
proteases (135 genes). Proteases are involved in regulatory
signaling networks with kinases or other factors can function to
transmit oncogenic signals in the tumor micro-environment. The
Protein classification of these DEGs provides an important
foundation for further understanding of the pathogenesis of
melanoma. Melanoma is one of the most immunogenic cancers. The
immunogenic landscape of dog oral melanoma DEGs revealed the
enrichment of chemokines and antimicrobials genes. Previous studies
have proven that chemokines play specific roles in human melanoma
tumor growth and metastasis (41,42).
Chemokine-based therapy is also under continuous investigation
(43). Moreover, antimicrobial
immunogenes may enrich as a first line defense of the cancer cells,
although many of them can regulate chemokines and other immunogenic
signals.
GO analysis revealed that the majority of proteins
encoded by DEGs were distributed in the extracellular domain or
cytoplasm. We hypothesized that these proteins drive cells to
undergo several physiological processes to generate the oncogenic
microenvironment. In this study, different response, cytokine and
signaling process-related genes were enriched and were involved in
G-protein, growth factor, glycosaminoglycan and cytokine-related
activity. G-protein-coupled receptors are key players in the
regulation of various pathophysiological responses to initiate
cancer development, including melanoma. GPCR-targeted drugs have
exhibited excellent therapeutic benefits in human cancers (44). Another significant term, growth factor
activity involved in cancer, was first discovered in the 1950s by
Cohen et al (45). Subsequent
studies demonstrated various roles of growth factors in the tumor
microenvironment including in melanoma (46). Glycosaminoglycans and the conjugated
proteins were reported to be involved in the tumor
micro-environment and often perform crucial functions along with
cytokine and growth factors (47).
In this study, we identified 9 pathways enriched in
the DEGs using 2 methods to avoid possible bias. ECM receptor
interaction, focal adhesion, protein digestion and absorption and
cytokine receptor interaction were the most enriched pathways and
along with 3 PI3K-AKT signaling pathways were previously reported
to be involved in canine cutaneous melanoma (27). Pathway analysis has been useful for
the analysis of experimental high-throughput biological data to
facilitate data interpretation. For example, IKKβ, one of
the major positive regulators of the NF-κB transcription factor,
was found to be downregulated in canine oral melanoma (Fig. S4). However, several target genes of
NF-κB were upregulated, indicating that NF-κB was activated. We
also examined the transcription factors binding motifs that may
represent the transcription factors of upregulated genes and found
that the NF-κB binding motif was the most enriched. This suggests
that NF-κB genes are activated through NF-κB-independent mechanisms
or that NF-κB is activated through IKKβ-independent
mechanisms. However, when we analyzed the pathways for the common
deregulated genes between humans and dogs, we found that JAK-STAT
was the most enriched pathway. Among the target genes of NF-κB,
STAT3, NF-κB1 and RELA share the highest number of
genes (http://www.grnpedia.org/trrust/result.php?gene=STAT3&species=human&confirm=).
This indicates that these target genes can be transactivated by
either NF-κB or STAT3, or both factors. In this study, we found
that 39 targets were upregulated in the dog melanoma data and 21
were significant. In the human data, among the 21 orthologues, 17
were upregulated (Table SXV). These
data again suggested that one or both of the transcription factors
may be activated. As IKKβ was downregulated, we hypothesized
that the canonical pathway was not activated in dogs. The target
genes can be transcribed by either non-canonical or atypical
pathways of NF-κB or by STAT3. A previous study also demonstrated
that feedback loops exist between both signaling pathways. IL6, as
one of the targets of NF-κB, can be regulated by STAT3 activation
(48). IL6 was expressed in both
human and dog melanoma. One study demonstrated that the
pro-survival function of NF-κB was related to its functional
interaction with the PI3K/AKT/mTOR signaling pathway. AKT engages
mainly with IKKα instead of IKKβ in promoting NF-κB activation
(49). NGF can activate NF-κB by the
atypical pathway (50).
Phosphorylation mediates the activation of STAT3 through TrkA by
NGF (51). Therefore, IL6 may be a
crucial regulator in melanoma initiation by regulating the
STAT3/NF-κB loop, while the atypical NF-kB pathway is maintained in
dogs by NGF. Further studies are required to examine the potential
for IL6 and NGF as novel therapeutic targets in melanoma for both
species. RT-qPCR analysis confirmed the upregulation of NGF,
AKT, and IL6 and IKKβ downregulation in canine
melanoma tissue samples.
Several studies have demonstrated
clinicopathological and molecular similarities in melanoma between
dogs and humans (10,11,52).
However, to the best of our knowledge, no study to date has
revealed the oncogenic transcriptomic similarities of melanoma
between these species. In this study, we evaluated the common DEGs
between the species. Among the upregulated genes in dog melanoma,
88 and 62% orthologous genes were also upregulated in human
melanoma tissue and cell lines, respectively. In addition, among
the 429 upregulated melanoma signature genes, 48 were previously
reported in melanoma according to the Melanoma Gene Database (MGDB)
(53) (Table SXIV). This result indicates that
oncogenic functions of these genes for melanoma progression are
conserved between the two species. Previous studies have also
demonstrated that higher homology of known cancer genes, as well as
mutation or inactivation events in cancer or other diseases are
shared between these 2 species (11,54,55). The
findings of this study further support the similarities in melanoma
progression between dogs and humans. Several subtypes of melanoma
have been identified in humans (9).
Dog oral melanoma has been suggested as a model for human mucosal
and the triple wild-type subtype (10,11). The
cluster analysis of this study with melanoma and prostate cancer
revealed that dog melanoma clustered with a group of human tissue
melanoma. These results again affirm previous studies that a human
melanoma subtype is similar to dog melanoma. This study also
demonstrates that the dog model will be more efficient to
investigate or develop novel therapeutics compared with cell
lines.
We also created a protein network using a human
database. We speculated that deregulated proteins/genes in melanoma
interact to drive disease progression. Functional association in
melanoma has been found from the protein interaction network
(56). In this study, each network
cluster contained genes that perform similar functions, such as the
first cluster that mostly contained collagen and integrins mainly
involved with extracellular matrix-related functions. Our results
suggest that the same network exists in both species, as the genes
show the same trend of expression in melanoma. The roles of
collagen and integrins in cancer have been well studied (57,58).
Potential therapeutic targets can be attained from this type of
interaction network strategy, which is also reported by a previous
study (56).
In conclusion, this study successfully identified
the transcriptomic aberrations in canine oral melanoma. Our
evidence demonstrating the similarity of melanoma between the 2
species further emphasizes dogs as a suitable pre-clinical model
for human melanoma. By comparing the melanoma transcriptome between
the 2 species, we identified the key genes and molecular pathways
for further study to develop more effective therapeutic approaches
to melanoma.
Supplementary Material
Supporting Data
Acknowledgements
The authors would like to thank Ms. Ayako Masuda,
Veterinary Teaching Hospital, Joint Faculty of Veterinary Medicine,
Kagoshima University; for assisting with the experiments. The
authors would also like to thank Edanz Group (www.edanzediting.com/ac) for editing a draft of
this manuscript.
Funding
This study was supported by the Japan Society for
the Promotion of Science KAKENHI (grant nos. 17H03926, 15H14872,
25292180 and 22780283).
Availability of data and materials
The datasets used and/or analyzed during the current
study are available from the corresponding author on reasonable
request.
Authors' contributions
NaM, MMR and YCL were involved in the conception and
design of the study. NaM, MMR, AAH and HWC developed the
methodology. NaM, MMR, YCL, AAH, HWC, YT, HK, HH NoM, TN and RF
were involved in data acquisition. NaM, MMR, YCL, AAH and HWC
analyzed and interpreted the data. The manuscript was written by
MMR and critically reviewed by all other authors. Administrative
and technical support was provided by NaM, YT, HK, HH, NoM, TN and
RF. Overall the study was supervised by NaM. All authors have read
and approved the final manuscript.
Ethics approval and consent to
participate
Informed consent to use the specimens in this study
was obtained from the owners of the dogs from which tissues were
obtained. The animal experiments were approved by the Kagoshima
University's Laboratory Animal Committee.
Patient consent for publication
Not applicable.
Competing interests
The authors state that there are no competing
interests.
References
|
1
|
Rowell JL, McCarthy DO and Alvarez CE: Dog
models of naturally occurring cancer. Trends Mol Med. 17:380–388.
2011. View Article : Google Scholar : PubMed/NCBI
|
|
2
|
Simpson RM, Bastian BC, Michael HT,
Webster JD, Prasad ML, Conway CM, Prieto VM, Gary JM, Goldschmidt
MH, Esplin DG, et al: Sporadic naturally occurring melanoma in dogs
as a preclinical model for human melanoma. Pigment Cell Melanoma
Res. 27:37–47. 2014. View Article : Google Scholar : PubMed/NCBI
|
|
3
|
Siegel RL, Miller KD and Jemal A: Cancer
statistics, 2018. CA Cancer J Clin. 68:7–30. 2018. View Article : Google Scholar : PubMed/NCBI
|
|
4
|
Ossio R, Roldán-Marín R, Martínez-Said H,
Adams DJ and Robles-Espinoza CD: Melanoma: A global perspective.
Nat Rev Cancer. 17:393–394. 2017. View Article : Google Scholar : PubMed/NCBI
|
|
5
|
Kong Y, Si L, Zhu Y, Xu X, Corless CL,
Flaherty KT, Li L, Li H, Sheng X, Cui C, et al: Large-scale
analysis of KIT aberrations in Chinese patients with melanoma. Clin
Cancer Res. 17:1684–1691. 2011. View Article : Google Scholar : PubMed/NCBI
|
|
6
|
Smith SH, Goldschmidt MH and McManus PM: A
comparative review of melanocytic neoplasms. Vet Pathol.
39:651–678. 2002. View Article : Google Scholar : PubMed/NCBI
|
|
7
|
Treggiari E, Grant JP and North SM: A
retrospective review of outcome and survival following surgery and
adjuvant xenogeneic DNA vaccination in 32 dogs with oral malignant
melanoma. J Vet Med Sci. 78:845–850. 2016. View Article : Google Scholar : PubMed/NCBI
|
|
8
|
Prouteau A and André C: Canine melanomas
as models for human melanomas: Clinical, histological, and genetic
comparison. Genes (Basel). 10(pii): E5012019. View Article : Google Scholar : PubMed/NCBI
|
|
9
|
Cancer Genome Atlas Network, . Genomic
classification of cutaneous melanoma. Cell. 161:1681–1696. 2015.
View Article : Google Scholar : PubMed/NCBI
|
|
10
|
Hernandez B, Adissu HA, Wei BR, Michael
HT, Merlino G and Simpson RM: Naturally occurring canine melanoma
as a predictive comparative oncology model for human mucosal and
other triple wild-type melanomas. Int J Mol Sci. 19(pii): E3942018.
View Article : Google Scholar : PubMed/NCBI
|
|
11
|
Gillard M, Cadieu E, De Brito C, Abadie J,
Vergier B, Devauchelle P, Degorce F, Dréano S, Primot A, Dorso L,
et al: Naturally occurring melanomas in dogs as models for non-UV
pathways of human melanomas. Pigment Cell Melanoma Res. 27:90–102.
2014. View Article : Google Scholar : PubMed/NCBI
|
|
12
|
Mochizuki H, Kennedy K, Shapiro SG and
Breen MB: BRAF mutations in canine cancers. PLoS One.
10:e01295342015. View Article : Google Scholar : PubMed/NCBI
|
|
13
|
Chu PY, Pan SL, Liu CH, Lee J, Yeh LS and
Liao AT: KIT gene exon 11 mutations in canine malignant melanoma.
Vet J. 196:226–230. 2013. View Article : Google Scholar : PubMed/NCBI
|
|
14
|
Lindblad-Toh K, Wade CM, Mikkelsen TS,
Karlsson EK, Jaffe DB, Kamal M, Clamp M, Chang JL, Kulbokas EJ III,
Zody MC, et al: Genome sequence, comparative analysis and haplotype
structure of the domestic dog. Nature. 438:803–819. 2005.
View Article : Google Scholar : PubMed/NCBI
|
|
15
|
Bednarski R, Grimm K, Harvey R, Lukasik
VM, Penn WS, Sargent B and Spelts K; American Animal Hospital
Association, : AAHA anesthesia guidelines for dogs and cats. J Am
Anim Hosp Assoc. 47:377–385. 2011. View Article : Google Scholar : PubMed/NCBI
|
|
16
|
Hoeppner MP, Lundquist A, Pirun M, Meadows
JR, Zamani N, Johnson J, Sundström G, Cook A, FitzGerald MG,
Swofford R, et al: An improved canine genome and a comprehensive
catalogue of coding genes and non-coding transcripts. PLoS One.
9:e911722014. View Article : Google Scholar : PubMed/NCBI
|
|
17
|
Mortazavi A, Williams BA, McCue K,
Schaeffer L and Wold B: Mapping and quantifying mammalian
transcriptomes by RNA-Seq. Nat Methods. 5:621–628. 2008. View Article : Google Scholar : PubMed/NCBI
|
|
18
|
Kinsella RJ, Kähäri A, Haider S, Zamora J,
Proctor G, Spudich G, Almeida-King J, Staines D, Derwent P,
Kerhornou A, et al: Ensembl BioMarts: A hub for data retrieval
across taxonomic space. Database (Oxford). 2011:bar0302011.
View Article : Google Scholar : PubMed/NCBI
|
|
19
|
Wang J, Vasaikar S, Shi Z, Greer M and
Zhang B: WebGestalt 2017: A more comprehensive, powerful, flexible
and interactive gene set enrichment analysis toolkit. Nucleic Acids
Res. 45((W1)): W130–W137. 2017. View Article : Google Scholar : PubMed/NCBI
|
|
20
|
Luo W, Pant G, Bhavnasi YK, Blanchard SG
Jr and Brouwer C: Pathview Web: User friendly pathway visualization
and data integration. Nucleic Acids Res. 45((W1)): W501–W508. 2017.
View Article : Google Scholar : PubMed/NCBI
|
|
21
|
Szklarczyk D, Franceschini A, Wyder S,
Forslund K, Heller D, Huerta-Cepas J, Simonovic M, Roth A, Santos
A, Tsafou KP, et al: STRING v10: Protein-protein interaction
networks, integrated over the tree of life. Nucleic Acids Res.
43((Database Issue)): D447–D452. 2015. View Article : Google Scholar : PubMed/NCBI
|
|
22
|
Lopes CT, Franz M, Kazi F, Donaldson SL,
Morris Q and Bader GD: Cytoscape Web: An interactive web-based
network browser. Bioinformatics. 26:2347–2348. 2010. View Article : Google Scholar : PubMed/NCBI
|
|
23
|
Livak KJ and Schmittgen TD: Analysis of
relative gene expression data using real-time quantitative PCR and
the 2(-Delta Delta C(T)) method. Methods. 25:402–408. 2001.
View Article : Google Scholar : PubMed/NCBI
|
|
24
|
Li RW and Schroeder SG: Cytoskeleton
remodeling and alterations in smooth muscle contractility in the
bovine jejunum during nematode infection. Funct Integr Genomics.
12:35–44. 2012. View Article : Google Scholar : PubMed/NCBI
|
|
25
|
Mi H, Muruganujan A, Casagrande JT and
Thomas PD: Large-scale gene function analysis with the PANTHER
classification system. Nat Protoc. 8:1551–1566. 2013. View Article : Google Scholar : PubMed/NCBI
|
|
26
|
Bhattacharya S, Dunn P, Thomas CG, Smith
B, Schaefer H, Chen J, Hu Z, Zalocusky KA, Shankar RD, Shen-Orr SS,
et al: ImmPort, toward repurposing of open access immunological
assay data for translational and clinical research. Sci Data.
5:1800152018. View Article : Google Scholar : PubMed/NCBI
|
|
27
|
Brachelente C, Cappelli K, Capomaccio S,
Porcellato I, Silvestri S, Bongiovanni L, De Maria R, Verini
Supplizi A, Mechelli L and Sforna M: Transcriptome analysis of
canine cutaneous melanoma and melanocytoma reveals a modulation of
genes regulating extracellular matrix metabolism and cell cycle.
Sci Rep. 7:63862017. View Article : Google Scholar : PubMed/NCBI
|
|
28
|
Spangler WL and Kass PH: The histologic
and epidemiologic bases for prognostic considerations in canine
melanocytic neoplasia. Vet Pathol. 43:136–149. 2006. View Article : Google Scholar : PubMed/NCBI
|
|
29
|
Miskolczi Z, Smith MP, Rowling EJ,
Ferguson J, Barriuso J and Wellbrock C: Collagen abundance controls
melanoma phenotypes through lineage-specific microenvironment
sensing. Oncogene. 37:3166–3182. 2018. View Article : Google Scholar : PubMed/NCBI
|
|
30
|
Han MJ, Wang H, Beer LA, Tang HY, Herlyn M
and Speicher DW: A systems biology analysis of metastatic melanoma
using in-depth three-dimensional protein profiling. Proteomics.
10:4450–4462. 2010. View Article : Google Scholar : PubMed/NCBI
|
|
31
|
Tichet M, Prod'Homm V, Fenouille N,
Ambrosetti D, Mallavialle A, Cerezo M, Ohanna M, Audebert S, Rocchi
S, Giacchero D, et al: Tumour-derived SPARC drives vascular
permeability and extravasation through endothelial VCAM1 signalling
to promote metastasis. Nat Commun. 6:69932015. View Article : Google Scholar : PubMed/NCBI
|
|
32
|
Wurth L, Papasaikas P, Olmeda D, Bley N,
Calvo GT, Guerrero S, Cerezo-Wallis D, Martinez-Useros J,
García-Fernández M, Hüttelmaier S, et al: UNR/CSDE1 drives a
post-transcriptional program to promote melanoma invasion and
metastasis. Cancer Cell. 30:694–707. 2016. View Article : Google Scholar : PubMed/NCBI
|
|
33
|
Naganuma K, Hatta M, Ikebe T and Yamazaki
J: Epigenetic alterations of the keratin 13 gene in oral squamous
cell carcinoma. BMC Cancer. 14:9882014. View Article : Google Scholar : PubMed/NCBI
|
|
34
|
Khammanivong A, Sorenson BS, Ross KF,
Dickerson EB, Hasina R, Lingen MW and Herzberg MC: Involvement of
calprotectin (S100A8/A9) in molecular pathways associated with
HNSCC. Oncotarget. 7:14029–14047. 2016. View Article : Google Scholar : PubMed/NCBI
|
|
35
|
Kim JH, Frantz AM, Anderson KL, Graef AJ,
Scott MC, Robinson S, Sharkey LC, O'Brien TD, Dickerson EB and
Modiano JF: Interleukin-8 promotes canine hemangiosarcoma growth by
regulating the tumor microenvironment. Exp Cell Res. 323:155–164.
2014. View Article : Google Scholar : PubMed/NCBI
|
|
36
|
Andrlová H, Mastroianni J, Madl J, Kern
JS, Melchinger W, Dierbach H, Wernet F, Follo M, Technau-Hafsi K,
Has C, et al: Biglycan expression in the melanoma microenvironment
promotes invasiveness via increased tissue stiffness inducing
integrin-β1 expression. Oncotarget. 8:42901–42916. 2017. View Article : Google Scholar : PubMed/NCBI
|
|
37
|
Nagarsheth N, Wicha MS and Zou W:
Chemokines in the cancer microenvironment and their relevance in
cancer immunotherapy. Nat Rev Immunol. 17:559–572. 2017. View Article : Google Scholar : PubMed/NCBI
|
|
38
|
Labidi-Galy SI, Clauss A, Ng V, Duraisamy
S, Elias KM, Piao HY, Bilal E, Davidowitz RA, Lu Y, Badalian-Very
G, et al: Elafin drives poor outcome in high-grade serous ovarian
cancers and basal-like breast tumors. Oncogene. 34:299–309. 2015.
View Article : Google Scholar
|
|
39
|
Smedley D, Sidhar S, Birdsall S, Bennett
D, Herlyn M, Cooper C and Shipley J: Characterization of chromosome
1 abnormalities in malignant melanomas. Genes Chromosom Cancer.
28:121–125. 2000. View Article : Google Scholar : PubMed/NCBI
|
|
40
|
Dracopoli NC, Harnett P, Bale SJ, Stanger
BZ, Tucker MA, Housman DE and Kefford RF: Loss of alleles from the
distal short arm of chromosome 1 occurs late in melanoma tumor
progression. Proc Natl Acad Sci USA. 86:4614–4618. 1989. View Article : Google Scholar : PubMed/NCBI
|
|
41
|
Kuo PT, Zeng Z, Salim N, Mattarollo S,
Wells JW and Leggatt GR: The role of CXCR3 and its chemokine
ligands in skin disease and cancer. Front Med (Lausanne).
5:2712018. View Article : Google Scholar : PubMed/NCBI
|
|
42
|
Payne AS and Cornelius LA: The role of
chemokines in melanoma tumor growth and metastasis. J Invest
Dermatol. 118:915–922. 2002. View Article : Google Scholar : PubMed/NCBI
|
|
43
|
Jacquelot N, Duong CPM, Belz GT and
Zitvogel L: Targeting chemokines and chemokine receptors in
melanoma and other cancers. Front Immunol. 9:24802018. View Article : Google Scholar : PubMed/NCBI
|
|
44
|
Lappano R and Maggiolini M: G
protein-coupled receptors: Novel targets for drug discovery in
cancer. Nat Rev Drug Discov. 10:47–60. 2011. View Article : Google Scholar : PubMed/NCBI
|
|
45
|
Cohen S, Levi-Montalcini R and Hamburger
V: A nerve growth-stimulating factor isolated from sarcom as 37 and
180. Proc Natl Acad Sci USA. 40:1014–1018. 1954. View Article : Google Scholar : PubMed/NCBI
|
|
46
|
Witsch E, Sela M and Yarden Y: Roles for
growth factors in cancer progression. Physiology (Bethesda).
25:85–101. 2010.PubMed/NCBI
|
|
47
|
Afratis N, Gialeli C, Nikitovic D,
Tsegenidis T, Karousou E, Theocharis AD, Pavão MS, Tzanakakis GN
and Karamanos NK: Glycosaminoglycans: Key players in cancer cell
biology and treatment. FEBS J. 279:1177–1197. 2012. View Article : Google Scholar : PubMed/NCBI
|
|
48
|
Wang Y, van van Boxel-Dezaire AH, Cheon H,
Yang J and Stark GR: STAT3 activation in response to IL-6 is
prolonged by the binding of IL-6 receptor to EGF receptor. Proc
Natl Acad Sci USA. 110:16975–16980. 2013. View Article : Google Scholar : PubMed/NCBI
|
|
49
|
Dan HC, Cooper MJ, Cogswell PC, Duncan JA,
Ting JP and Baldwin AS: Akt-dependent regulation of NF-{kappa}B is
controlled by mTOR and Raptor in association with IKK. Genes Dev.
22:1490–1500. 2008. View Article : Google Scholar : PubMed/NCBI
|
|
50
|
Gentry JJ, Casaccia-Bonnefil P and Carter
BD: Nerve growth factor activation of nuclear factor kappaB through
its p75 receptor is an anti-apoptotic signal in RN22 schwannoma
cells. J Biol Chem. 275:7558–7565. 2000. View Article : Google Scholar : PubMed/NCBI
|
|
51
|
Ng YP, Cheung ZH and Ip NY: STAT3 as a
downstream mediator of Trk signaling and functions. J Biol Chem.
281:15636–15644. 2006. View Article : Google Scholar : PubMed/NCBI
|
|
52
|
Hendricks WPD, Zismann V, Sivaprakasam K,
Legendre C, Poorman K, Tembe W, Perdigones N, Kiefer J, Liang W,
DeLuca V, et al: Somatic inactivating PTPRJ mutations and
dysregulated pathways identified in canine malignant melanoma by
integrated comparative genomic analysis. PLoS Genet.
14:e10075892018. View Article : Google Scholar : PubMed/NCBI
|
|
53
|
Zhang D, Zhu R, Zhang H, Zheng CH and Xia
J: MGDB: A comprehensive database of genes involved in melanoma.
Database (Oxford). 2015(pii): bav0972015. View Article : Google Scholar : PubMed/NCBI
|
|
54
|
Bushell KR, Kim Y, Chan FC, Ben-Neriah S,
Jenks A, Alcaide M, Fornika D, Grande BM, Arthur S, Gascoyne RD, et
al: Genetic inactivation of TRAF3 in canine and human B-cell
lymphoma. Blood. 125:999–1005. 2015. View Article : Google Scholar : PubMed/NCBI
|
|
55
|
Ulvé R, Rault M, Bahin M, Lagoutte L,
Abadie J, De Brito C, Coindre JM, Botherel N, Rousseau A, Wucher V,
et al: Discovery of human-similar gene fusions in canine cancers.
Cancer Res. 77:5721–5727. 2017. View Article : Google Scholar : PubMed/NCBI
|
|
56
|
Li Z, Ivanov AA, Su R, Gonzalez-Pecchi V,
Qi Q, Liu S, Webber P, McMillan E, Rusnak L, Pham C, et al: The
OncoPPi network of cancer-focused protein-protein interactions to
inform biological insights and therapeutic strategies. Nat Commun.
8:143562017. View Article : Google Scholar : PubMed/NCBI
|
|
57
|
Hamidi H, Pietilä M and Ivaska J: The
complexity of integrins in cancer and new scopes for therapeutic
targeting. Br J Cancer. 115:1017–1023. 2016. View Article : Google Scholar : PubMed/NCBI
|
|
58
|
Chen P, Cescon M and Bonaldo P: Collagen
VI in cancer and its biological mechanisms. Trends Mol Med.
19:410–417. 2013. View Article : Google Scholar : PubMed/NCBI
|