Introduction
As one of the most common types of cancer that
threat the health of women worldwide, breast cancer originates from
breast epidermal tissues and has a high mortality rate (1). The difficulty in clinical treatment of
breast cancer has mainly been attributed to two aspects. First,
breast cancer exhibits a higher risk of metastasizing to distant
vital organs of the body compared with other solid tumors (2). Second, the heterogeneity of breast
cancer limits the development of targeted therapy (3). According to the expression of the
estrogen receptor (ER), progesterone receptor (PR) and HER2, breast
cancer can be classified into two categories (4). For the first category, at least one of
these receptors is positive. Selective ER inhibitors, such as
Tamoxifen, and PR inhibitors, such as Mifepristone, are widely used
in the clinical treatment of ER-positive and PR-positive breast
cancer (5). For the clinical
treatment of HER2-positive breast cancer, the potent monoclonal
HER2 antibody Herceptin and its derivatives are the most efficient
therapy (6). Combinations of
Herceptin with small-molecular drugs for the treatment of
HER2-positive metastatic breast cancer have entered clinical
trials, suggesting the advantages of combined medication (6).
For the second category, triple-negative breast
cancer (TNBC) lacks the expression of ER, PR or HER2. According to
statistics from 2010, TNBC comprises 12–20% of breast cancer cases
and the percentage is rising (7).
Since TNBC is the most malignant breast cancer type and prone to
metastasis and recurrence, common therapies usually fail to achieve
satisfactory treatment effects (8).
Therefore, seeking novel therapeutic targets and agents for the
treatment of TNBC is challenging and urgent. Usually, molecular
targeted therapy aims at retrieving aberrant signaling transduction
by selective inhibitors (9).
Considering the heterogeneity of TNBC, various categories of
pathway inhibitors are used in clinical treatment (10). However, a large proportion of
patients with TNBC receiving monotherapy encounter drug-resistance,
metastasis and recurrence (11).
Therefore, combined medications using inhibitors targeting
different signaling pathways are emerging for the clinical
treatment of TNBC (12). Compared
with traditional monotherapy, combined therapies usually are
associated with enhanced efficacy and reduced risks of recurrence
(13–15).
As a molecular chaperone, heat shock protein 90
(HSP90) aids various client proteins to fold into correct
conformation (16). However, the
dysfunction of HSP90 leads to the misfolding and degradation of its
client proteins. As a derivative of the antibiotic Geldanamycin,
the HSP90 inhibitor 17-AAG (Tanespimycin) exhibits improved
selectivity (17). The binding
affinity of 17-AAG to the HSP90 protein in tumor cells is ~100
times higher than to HSP90 protein in normal cells (18). 17-AAG exhibits broad-spectrum
antitumor activity against various types of cancer in pre-clinical
studies (19–21). It is worth noting that HER2 is one
of the client proteins of HSP90, and clinical trial results have
revealed that HSP90 inhibitor 17-AAG treatment is beneficial in
HER2-positive breast cancer (22).
A previous study has demonstrated that the combination of 17-AAG
with Herceptin effectively overcomes the drug-resistance of
Herceptin monotherapy (23). As a
previously identified biomarker for TNBC, the inhibitors of HSP90
may be beneficial to the combined medications of breast cancer
(24,25).
Dysfunction of histone acetylation is frequently
observed in various types of cancer, including breast cancer
(26–28). Histone acetyltransferase (HAT) and
histone deacetylase (HDAC) are responsible for the regulation of
histone acetylation (29,30). HAT and HDAC are important epigenetic
targets for the development of antitumor agents (31). Overwhelming evidence has
demonstrated that HDAC inhibitors, including HDAC6 inhibitors, are
promising for the combined treatment of TNBC (32–35).
Besides the acetylation of histone H4, HDAC6 also regulates the
acetylation of other proteins, including HSP90 and α-tubulin
(36). Additionally, a previous
study has revealed that the overexpression of HDAC6 is closely
associated with the metastasis and poor prognosis of patients with
breast cancer (37). As one of the
client proteins of HSP90, HDAC6 regulates the acetylation of HSP90
reversely (38). Acetylated HSP90
protein loses most of the chaperone activity, and the activity of
its client proteins will abrogate afterwards (39). As a HDAC inhibitor, Belinostat
exhibits potent inhibitory effects on HDAC6 in vitro, with
an IC50 value of 82 nM (40,41).
Previous studies have indicated that Belinostat is a beneficial
choice for combined therapy of both blood and solid tumors
(42,43). Previous studies in other cancer
types have indicated that the combination of HSP90 inhibitor and
HDAC6 inhibitor exhibits more benefits than administration alone
(44–46). Several HSP90 or HDAC combination
therapies have been investigated in clinical trials (12,47);
however, most of them investigated combination therapies with
chemotherapeutic drugs, such as cisplatin or paclitaxel. The
primary clinical trial data indicated that TNBC may show response
to HSP90 or HDAC combination therapy, but in combination with
chemotherapeutic drugs unchangeable side effects caused by
chemotherapeutic drugs remain. In TNBC, combination therapies with
chemotherapeutic drugs exhibit high risk (48) and occasionally have no benefit
compared with single drug treatment (49,50).
Therefore, combined with chemotherapeutic drugs, HSP90 inhibitor or
HDAC inhibitor may show the same high risk as single drug treatment
in TNBC. Considering the internal mechanism of HDAC6 and HSP90, it
was proposed that the HDAC6-HSP90 axis may show benefits in TNBC.
If the HDAC6-HSP90 axis could show a combination effect, in further
clinical trials, researchers may have the choice to avoid using
chemotherapeutic drugs. The present study revealed that the HSP90
inhibitor 17-AAG synergizes with the HDAC6 inhibitor Belinostat in
MDA-MB-231 cells, which may provide a beneficial reference for the
clinical treatment of TNBC.
Materials and methods
Cell lines and compounds
The ER-positive breast cancer MCF-7 cell line, TNBC
MDA-MB-231 and BT549 cell lines, and a normal human mammary
epithelial MCF-10A cell line were purchased from the American Type
Culture Collection. All cell lines were cultured in a cell
incubator (model no. thermo3111; Thermo Fisher Scientific, Inc.) at
37°C with 5% CO2. The MDA-MB-231 and MCF-7 cells were
cultured in DMEM (cat. no. L110KJ; BasalMedia, Inc.) supplemented
with 10% fetal bovine serum (FBS; cat. no. 16000-044; Gibco; Thermo
Fisher Scientific, Inc.) BT549 cells were cultured in DMEM
supplemented with 10% FBS and 0.023 U/ml insulin. MCF-10A cells
were cultured in DMEM/F12 (cat. no. L310KJ; BasalMedia, Inc.)
supplemented with 5% donor horse serum (cat. no. 26050088; Gibco;
Thermo Fisher Scientific, Inc.) and certain additives (20 ng/ml
EGF, 10 µg/ml insulin and 10 ng/ml cholera toxin). Belinostat
(HDAC6 inhibitor) and 17-AAG (HSP90 inhibitor) were purchased from
Target molecule Corp. and prepared in DMSO as 50 mM stock
solutions. The solutions were diluted in cell culture medium
immediately prior to use.
Cell viability assay and combination
studies
Four different cell lines (MDA-MB-231, BT549, MCF-7
and MCF-10A) were seeded in 96-well flat bottom plates at a density
of 3,000 cells/well and treated with 200 µM to 0.78 nM (double
gradient dilution) 17-AAG or Belinostat at 37°C in triplicate 12 h
later. The viability of cells was measured using the CellTiter-Glo
Luminescent Cell Viability assay (Promega Corporation) at 72 h
after treatment. The optical density of each well was recorded
using a microplate reader (PerkinElmer Envision multimode plate
reader; PerkinElmer, Inc.). A range of drug concentrations was
added at their fixed ratio based on their respective individual
IC50 values at 72 h (51). Using the CompuSyn software (52) (CompuSyn v1.0; ComboSyn, Inc.),
combination indexes (CIs) were calculated according to the cell
viability at corresponding concentrations. Briefly, the CI value
indicates the interaction of co-administrated compounds: CI<1
indicates synergism effect, CI=1 indicates additive effect and
CI>1 indicates antagonism effect (53).
Apoptosis and cell cycle analysis
For the apoptosis analysis, cells were seeded in
6-well flat bottom plates at a density of 1.5×10⁵
cells/well and treated with single 17-AAG (0.5 and 1.0 µM), single
Belinostat (0.1 and 0.2 µM), or the combination of 17-AAG and
Belinostat at 37°C for 12 h. After incubation for 72 h, cells were
harvested in iced PBS buffer. Apoptosis was evaluated using the
Annexin V-FITC Apoptosis Detection kit (Vazyme Biotech Co., Ltd.).
Briefly, collected cells were re-suspended in 100 µl binding buffer
and incubated with 5 µl propidium iodide (PI) and 5 µl Annexin
V-FITC for 15 min in the dark at room temperature. Before analyzing
apoptosis percentage using the FACSCalibur flow cytometry system
(BD Biosciences), 400 µl binding buffer was added to the samples to
stop the staining procedure. The apoptosis data were analyzed using
FlowJo™ software (FlowJo 7.6.1; BD Biosciences), with ≥10,000 cells
for each sample. For the cell cycle analysis by PI staining, cells
were seeded and harvested as for the apoptosis assay. Each sample
was fixed and re-suspended in 1 ml iced 70% ethanol at −20°C
overnight. After washing twice with iced PBS buffer, samples were
stained with PI in the dark at room temperature for 30 min. The PI
stain was included in the Cell Cycle and Apoptosis Analysis kit
(Yeasen). Subsequently, cell cycle analysis was performed using
FACScan flow cytometry (FACS Canto II; BD Biosciences) by red
fluorescence at an excitation wavelength of 488 nm, and the data
were analyzed using ModFit software (ModFit LT v3.3; BD
Biosciences).
Reverse transcription-quantitative PCR
(RT-qPCR)
Total RNA was extracted from MDA-MB-231 cells using
the RNA Isolation kit (Beyotime Institute of Biotechnology). Each
sample of 300 ng total RNA was reverse transcribed to cDNA using
the HiScript II Q RT SuperMix for qPCR kit (Vazyme Biotech Co.,
Ltd.). The reverse transcription temperature protocol was as
follows: 50°C for 15 min, followed by 80°C for 5 sec. The qPCR
procedures were performed on the ViiA 7 Real-Time PCR system
(Applied Biosystems; Thermo Fisher Scientific, Inc.) using the
ChamQ SYBR qPCR Master Mix (Low ROX Premixed) kit (Vazyme Biotech
Co., Ltd.). The thermocycling program for the RT-qPCR reactions was
as follow: Pre-denaturation at 95°C for 10 min, 40 cycles of
denaturation at 95°C for 15 sec and annealing at 60°C for 30 sec,
followed by extension at 72°C for 1 min. Subsequently, the
expression values of mRNA were calculated using the
2−ΔΔCq method (54),
with GAPDH as a reference for normalization, and represented as
fold change. Primers were synthesized by Sangon Biotech Co., Ltd.
and are listed in Table I.
 | Table I.List of primers used for quantitative
PCR. |
Table I.
List of primers used for quantitative
PCR.
| Primer | Sequence
(5′-3′) |
|---|
|
HSP90AA1-Forward |
GCTTGACCAATGACTGGGAAG |
|
HSP90AA1-Reverse |
AGCTCCTCACAGTTATCCATGA |
|
HSP90AB1-Forward |
CATCTCCATGATTGGGCAGTT |
|
HSP90AB1-Reverse |
CTTTGACCCGCCTCTCTTCTA |
| GAPDH-Forward |
AGGTCGGTGTGAACGGATTTG |
| GAPDH-Reverse |
GGGGTCGTTGATGGCAACA |
| TEAD1-Forward |
ATGCCAACCATTCTTACAGTGAC |
| TEAD1-Reverse |
ACAGTTCCTTTAAGCCACCTTTC |
| TEAD2-Forward |
CTTCGTGGAACCGCCAGAT |
| TEAD2-Reverse |
GGAGGCCACCCTTTTTCTCA |
| TEAD3-Forward |
GCTCCTGGAGTATTCAGCCTT |
| TEAD3-Reverse |
GTCGGCCCAGAACTTGACAA |
| TEAD4-Forward |
GGACACTACTCTTACCGCATCC |
| TEAD4-Reverse |
TCAAAGACATAGGCAATGCACA |
| YAP-Forward |
CGCTCTTCAACGCCGTCA |
| YAP-Reverse |
AGTACTGGCCTGTCGGGAGT |
| TAZ-Forward |
CACCGTGTCCAATCACCAGTC |
| TAZ-Reverse |
TCCAACGCATCAACTTCAGGT |
| EGFR-Forward |
AGGCACGAGTAACAAGCTCAC |
| EGFR-Reverse |
ATGAGGACATAACCAGCCACC |
| COX5B-Forward |
ATCTGGAGGTGGTGTTCCCA |
| COX5B-Reverse |
TCCAGTCCCTTCTTTGCAGC |
| COX7C-Forward |
GGGCCCTGGGAAGAATTTGC |
| COX7C-Reverse |
GGAAGGGTGTAGCAAATGCAGA |
| UBA52-Forward |
GTCGTGCGGACGCAAACAT |
| UBA52-Reverse |
TCTCAATGGTGTCACTGGGC |
| NFKBIE-Forward |
AAACTGGCAAGGTCTGGCTT |
| NFKBIE-Reverse |
GTCTTACCACTGGTGCCCTC |
|
GADD45A-Forward |
GCAGAAGACCGAAAGCGACC |
|
GADD45A-Reverse |
TGATGTCGTTCTCGCAGCAA |
Western blotting
Cells were seeded in 6-well flat plates and split in
1X SDS sample loading buffer (250 mM Tris HCl pH 6.8, 10% SDS, 30%
glycerol, 5% β-mercaptoethanol and 0.02% bromophenol blue). Protein
concentrations were determined using the BCA Protein assay (Thermo
Fisher Scientific, Inc.). Samples (25 µg/lane) were resolved by 6,
10 or 12% SDS-PAGE and transferred to 0.22-µm nitrocellulose
membranes. Following blocking with 5% milk at room temperature for
1 h, the nitrocellulose membranes were washed four times for 15 min
with TBS with 0.1% Tween-20 (TBST) buffer and incubated with
primary antibodies (dilution, 1:1,000) at 4°C overnight.
Subsequently, the membranes were washed four times with TBST buffer
and incubated with horseradish peroxidase (HRP)-conjugated Goat
Anti-Mouse lgG (cat. no. D110087; Sangon Biotech Co., Ltd.) and
HRP-conjugated Goat Anti-Rabbit lgG (cat. no. D110058; Sangon
Biotech Co., Ltd.) secondary antibodies (dilution, 1:10,000; BBI
Life Sciences Corporation) for 1 h at room temperature. The bands
were visualized using an enhanced chemiluminescence kit (Thermo
Fisher Scientific, Inc.) with a ChemiScope 3400 mini imaging system
(Clinx Science Instrument Co., Ltd.). Densitometry was performed
for each group using ImageJ 1.50b software (National Institutes of
Health). All primary antibodies used are listed in Table II.
| Table II.List of primary antibodies used for
western blotting. |
Table II.
List of primary antibodies used for
western blotting.
| Name | Supplier | Cat. no. |
|---|
| HDAC6 | Beyotime Institute
of Biotechnology | AH395 |
| α-tubulin
(11H10) | Cell Signaling
Technology, Inc. | 2125S |
| Ac-α-tubulin | Cell Signaling
Technology, Inc. | 5335S |
| HSP90 | Cell Signaling
Technology, Inc. | 4877T |
| Ac-k | Cell Signaling
Technology, Inc. | 9441S |
| Cleaved-parp | Cell Signaling
Technology, Inc. | 5625S |
|
Cleaved-caspase3 | Cell Signaling
Technology, Inc. | 9664S |
| CDK1 | Absin | abs135544 |
| P-CDK1 | Cell Signaling
Technology, Inc. | 2461T |
| cyclin B1 | Cell Signaling
Technology, Inc. | 4138S |
| P-MLC | Invitrogen; Thermo
Fisher Scientific, Inc. | PA5-17727 |
| MLC2 | Cell Signaling
Technology, Inc. | 8505S |
| YAP | Cell Signaling
Technology, Inc. | 14074S |
| P-YAP | Cell Signaling
Technology, Inc. | 13008T |
| TEAD1 | Cell Signaling
Technology, Inc. | 12292S |
| TEAD2 | ProteinTech Group,
Inc. | 21159-1-AP |
| TEAD3 | Cell Signaling
Technology, Inc. | 13224S |
| TEAD4 | Abcam | ab58310 |
RNA-sequencing (RNA-seq) data
collection and analysis
To characterize the genomic impact of single and
combined compound treatment, RNA-seq data was collected using
1.5×10⁵ MDA-MB-231 cells treated with DMSO as a control,
17-AAG (1.0 µM), Belinostat (0.2 µM) and the combination of 17-AAG
and Belinostat at 37°C for 72 h. After 24 h, total RNA was isolated
and purified using DNaseI (Takara Bio, Inc.) and Dynabeads Oligo
(dT) 25 (Thermo Fisher Scientific, Inc.). Subsequently, purified
RNA (100 ng) was used for cDNA library construction, using the
NEBNext Ultra™ RNA Library Prep kit for Illumina (cat. no. E7530L;
New England BioLabs, Inc.). Sequencing data was collected on an
Illumina HiSeq 2500 instrument. Subsequently, paired-end reads were
processed using the Tophat2 v2.1.1 software package (55), with the GRCh38/hg18 Ensembl
transcript set as a reference. Following transcript assembly using
the Cufflinks v2.2.1 software package (56), differentially expressed genes
(|log2fold-change| >0.5 and P<0.05) were
identified using Cuffdiff 2 (57).
From the list of differentially expressed genes, each gene was
checked in the Gene database of the National Center for
Biotechnology Information (https://www.ncbi.nlm.nih.gov/gene/). According to the
relevant abstract description of genes in NCBI, only the most
migration-related or metastasis-related genes were selected for the
final heatmap. The Kyoto Encyclopedia of Genes and Genomes (KEGG)
database (http://www.kegg.jp/) was used for
pathway analysis. Using the GeneAnswers v3.0 package (58) of the Bioconductor project, the
P-values of involved KEGG pathways were calculated with a threshold
value of 0.1, based on all differentially expressed genes. Finally,
the heatmap and pathways histogram were plotted using the ggplot2
v2.1.0 package in R (http://www.rdocumentation.org/packages/gglot2/versions/2.1.0).
The raw sequencing data and processed expression tables have been
deposited to the Gene Expression Omnibus (GEO) database (http://www.ncbi.nlm.nih.gov/geo/; accession no.
GSE129944).
Detection of reactive oxygen species
(ROS)
MDA-MB-231 cells were seeded in 6-well plates at a
density of 7.5×10⁴ cells/ml and permitted to adhere
overnight. After cells were treated with 0.2 µM Belinostat, 1 µM
17-AAG or the combination at 37°C for 3 days, cells were stained
with 1 µM DCFH-DA for 30 min in the dark at 37°C. Subsequently,
cells were washed three times with PBS and subjected to FACScan
flow cytometry (FACS Canto II; BD Biosciences). Green fluorescence
FITC (FL1) was detected at 488 nm (excitation wavelength) and 530
nm (emission wavelength). FlowJo™ software (FlowJo 7.6.1; BD
Biosciences) was used to calculate and analyze the data.
Fluorescence microscopy (magnification, ×40) was used to capture
images with fixed exposure time.
Wound healing assay
For the wound healing assay, coordinates were marked
on the 35-mm dish, and MDA-MB-231 cells were inoculated at a
density of 1.5×10⁶ cells/well. When the confluence was
~100%, cells were rinsed twice with PBS, and serum-free DMEM was
added for cell starvation. After cells were starved for 24 h, three
marks were scratched on the dish covered with cells with a 200-µl
pipette tip. Subsequently, the dish was washed twice with PBS to
remove cell debris, and serum-free DMEM containing 0.2 µM
Belinostat, 1 µM 17-AAG or the combination of both was added after
scratching. Images were captured under an inverted light microscope
(magnification, ×40) at different time points. The cell scratch
area at each coordinate point was recorded. The relative migration
area was calculated, and average values were taken for comparison.
The area of cells was calculated for each group using ImageJ 1.50b
software (National Institutes of Health) The wound-closing
procedure was observed for 36 h, and images were captured at 0 and
36 h, respectively.
Cell migration and invasion
assays
For the cell migration assay, serum-free medium was
added to the Transwell (cat. no. 353097; Corning Inc.) and outer
chamber, and the membrane of the chamber was hydrated 1 h later. A
total of 1.5×10⁵ MDA-MB-231 cells were plated into 35-mm
dishes containing serum-free DMEM. Following starvation at 37°C for
12–24 h to further remove the effect of serum, cells were digested,
centrifuged at 300 × g at room temperature for 5 min and the media
were discarded. Subsequently, cells were washed once or twice with
PBS, and re-suspended with the serum-free culture medium containing
0.1% BSA (Sigma-Aldrich; Merck KGaA) The density of cells was
adjusted to 1×10⁶ cells/ml. A total of
1.0×10⁵ MDA-MB-231 cells were added to the upper
Transwell chamber containing 0.2 µM Belinostat, 1 µM 17-AAG or
combination of both, and 600 µl DMEM containing 10% FBS was added
to the lower chamber of the 24-well plate. Placed on a 24-well
plate, the surface of the Transwell compartment membrane was
carefully observed for bubble formation. Following incubation at
37°C for 24 h, Transwell cells were washed twice with PBS, and a
cotton swab was used to remove cells from the upper chamber.
Subsequently, cells were fixed with 90% ethanol at room temperature
for 15 min, and the membrane was dried and stained with 0.1%
crystal violet at room temperature for 30 min. Finally, the
Transwell membrane was cut off and placed on a glass slide for
microscopic observation, and six locations were randomly selected
for imaging by means of an inverted light microscope
(magnification, ×40). The number of cells was calculated for each
group using ImageJ 1.50b software (National Institutes of Health).
For the cell invasion assay, the procedure was similar to the cell
migration assay, except that the Transwell membranes were
pre-coated with 50 mg/ml Matrigel (BD Biosciences) at 37°C for 1
h.
Small interfering RNA (siRNA)
transfection
TEA domain family members (TEADs) siRNAs were
synthesized by Shanghai GenePharma Co., Ltd. Cells were seeded in a
6-well plate to be 60–80% confluent. A total of 1.5 µl siRNA (20
µM) and 9 µl Lipofectamine® RNAiMAX reagent (cat. no.
13778150; Invitrogen; Thermo Fisher Scientific, Inc.) were mixed
with 150 µl Opti MEM medium (cat. no. 31985070; Gibco; Thermo
Fisher Scientific, Inc.). The final concentration of siRNAs was 25
pM. Next, diluted siRNA was added to diluted Lipofectamine RNAiMAX
reagent and cultured 5 min at room temperature. siRNA-lipid complex
was added to cells for 6–8 h at 37°C and cells were re-cultured in
complete medium for 48 h at 37°C. Subsequent experiments were
performed after the cells were transfected for 48 h. Control siRNA
was used as a negative control. siRNAs used for siRNA transfection
are listed in Table III.
| Table III.List of siRNAs used for siRNA
transfection. |
Table III.
List of siRNAs used for siRNA
transfection.
| Gene name | Sequence
(5′-3′) |
|---|
|
TEAD1-homo-1018 |
CCACUGCCAUUCAUAACAATT |
|
TEAD1-homo-1826 |
CAUGGCCUGUGUGUUUGAAT |
| TEAD2-homo-667 |
CCAGAUGUGAAGCCAUUCUTT |
|
TEAD2-homo-1283 |
GCGCCAGAUCUAUGACAAATT |
|
TEAD3-homo-1040 |
GCGCCAGAUCUAUGACAAATT |
|
TEAD3-homo-1510 |
CCCAGCACCAUGUCUACAATT |
|
TEAD4-homo-1284 |
CCACGAAGGUCUGCUCUUUTT |
|
TEAD4-homo-1507 |
GGAGACCUUGCUGUGCAUUTT |
| NC |
UUCUCCGAACGUGUCACGUTT |
Statistical analysis
All data are presented as the mean ± SEM. All
experiments, including western blotting, were performed in
duplicate or triplicate. Western blotting semi-quantification was
implemented by ImageJ 1.50b (National Institutes of Health)
Statistical analyses were carried out using the GraphPad 5.0
software (GraphPad Software, Inc.). Comparisons between two groups
were implemented using the unpaired two-tailed Student's t-test.
Comparisons of three groups were executed by multiple t-tests with
the Holm-Sidak method, as recommended by the GraphPad software.
P<0.05 was considered to indicate a statistically significant
difference.
Results
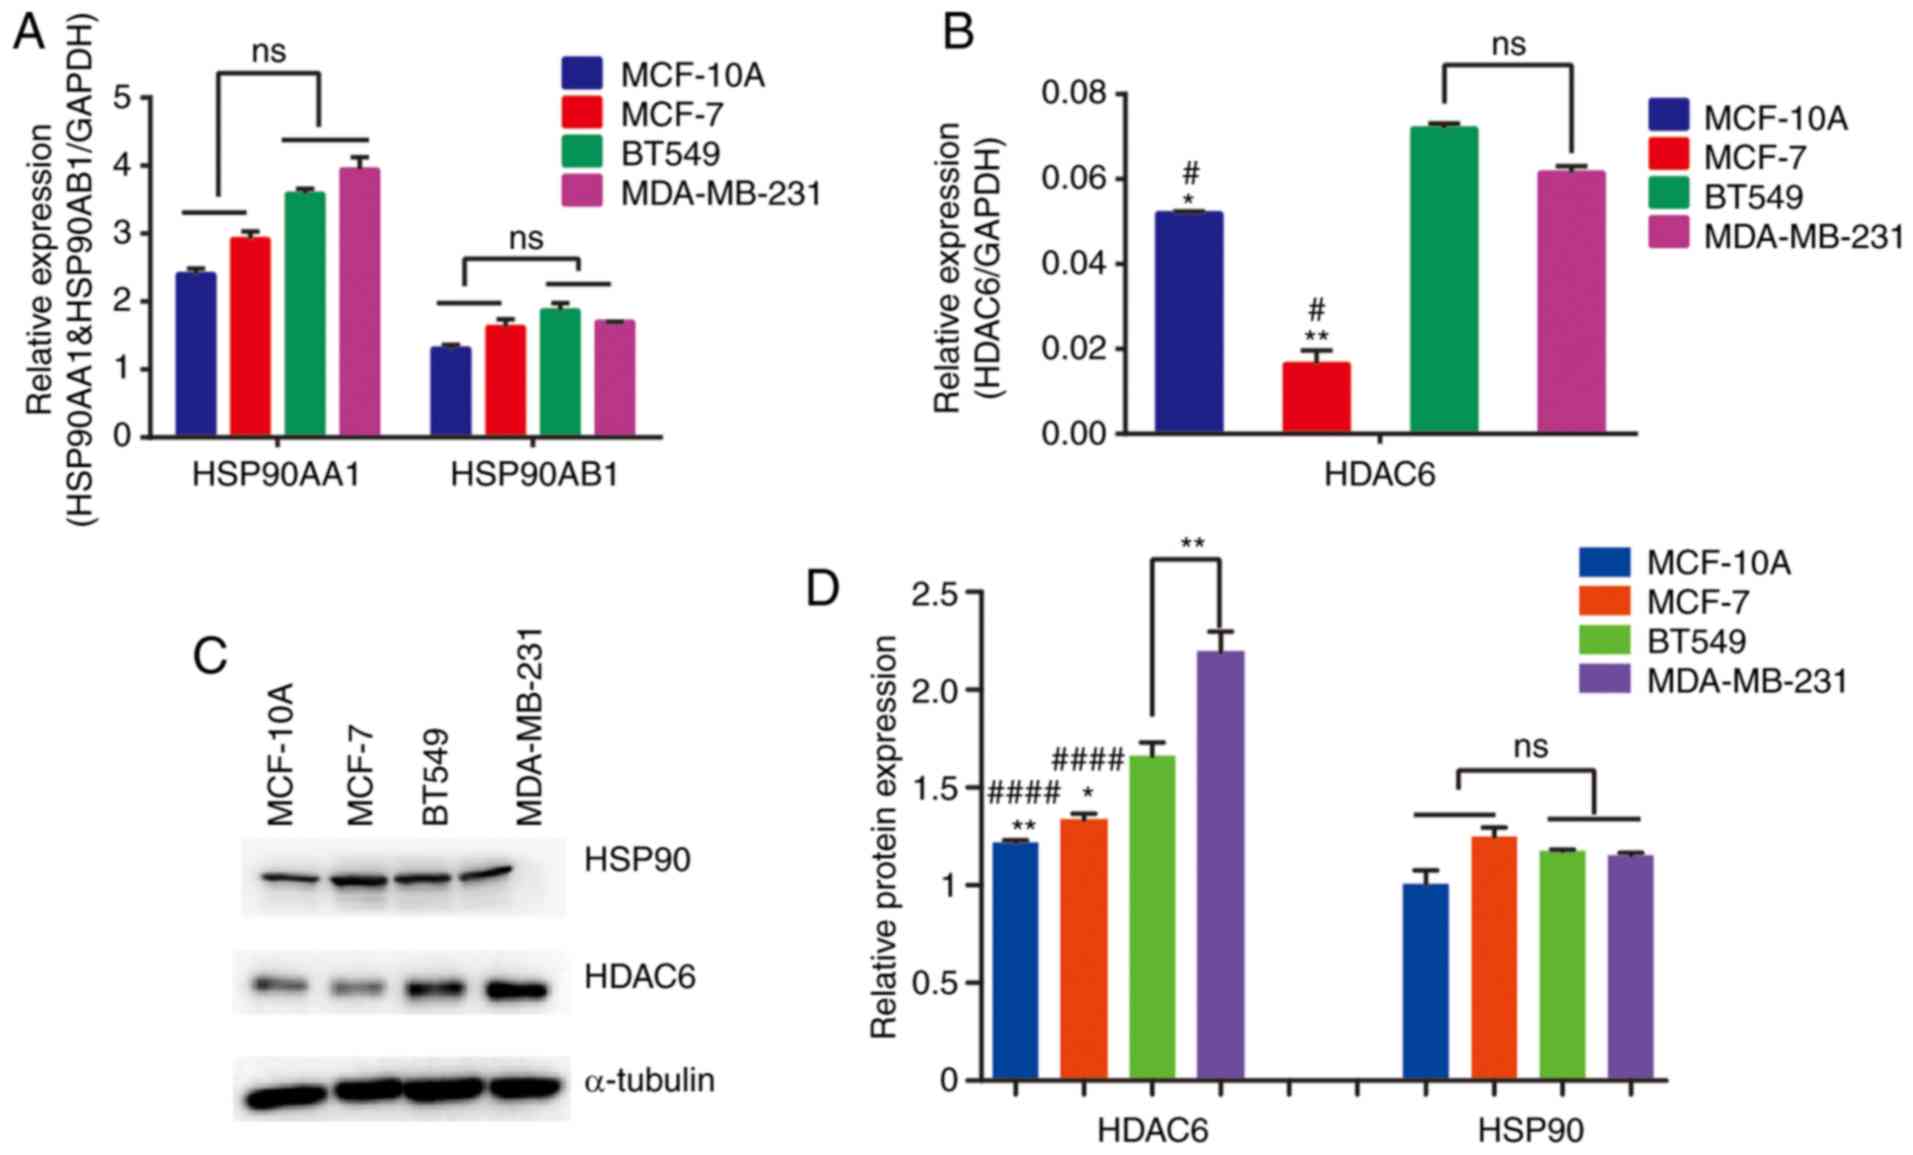
TNBC cell lines maintain relatively
high expression levels of HSP90 and HDAC6
To confirm whether TNBC cell lines have relatively
high expression levels of both HSP90 and HDAC6, the mRNA expression
and protein abundance levels of HSP90 and HDAC6 were detected in
four breast cell lines. It was identified that the mRNA expression
levels of HDAC6 were upregulated in TNBC cell lines, but for HSP90,
the two subunits, HSP90AA1 and HSP90AB1, exhibited no significant
differences across the four cell lines examined (Fig. 1A and B). Based on the protein
expression levels presented in Fig.
1C, HSP90 exhibited similar abundance in the cell lines, except
in BT549 where its expression was slightly decreased. Statistical
analysis demonstrated that HSP90 protein levels did not no differ
across the four cell lines (Fig.
1D). However, HDAC6 expression was upregulated in TNBC cells
which was consistent with the results for mRNA expression. Overall,
the results indicated that TNBC cell lines maintain relatively high
expression levels of HDAC6, whereas the expression levels of HSP90
were almost consistent. It may be speculated that the combination
of HSP90 inhibitor and HDAC6 inhibitor could have an improved
therapeutic effect in TNBC cell lines. As aforementioned,
reciprocal effects exist between HSP90 and HDAC6 (38). The present study aimed to determine
whether combined treatment with HSP90 inhibitor and HDAC6 inhibitor
may achieve enhanced efficacy compared with treatment with either
inhibitor alone.
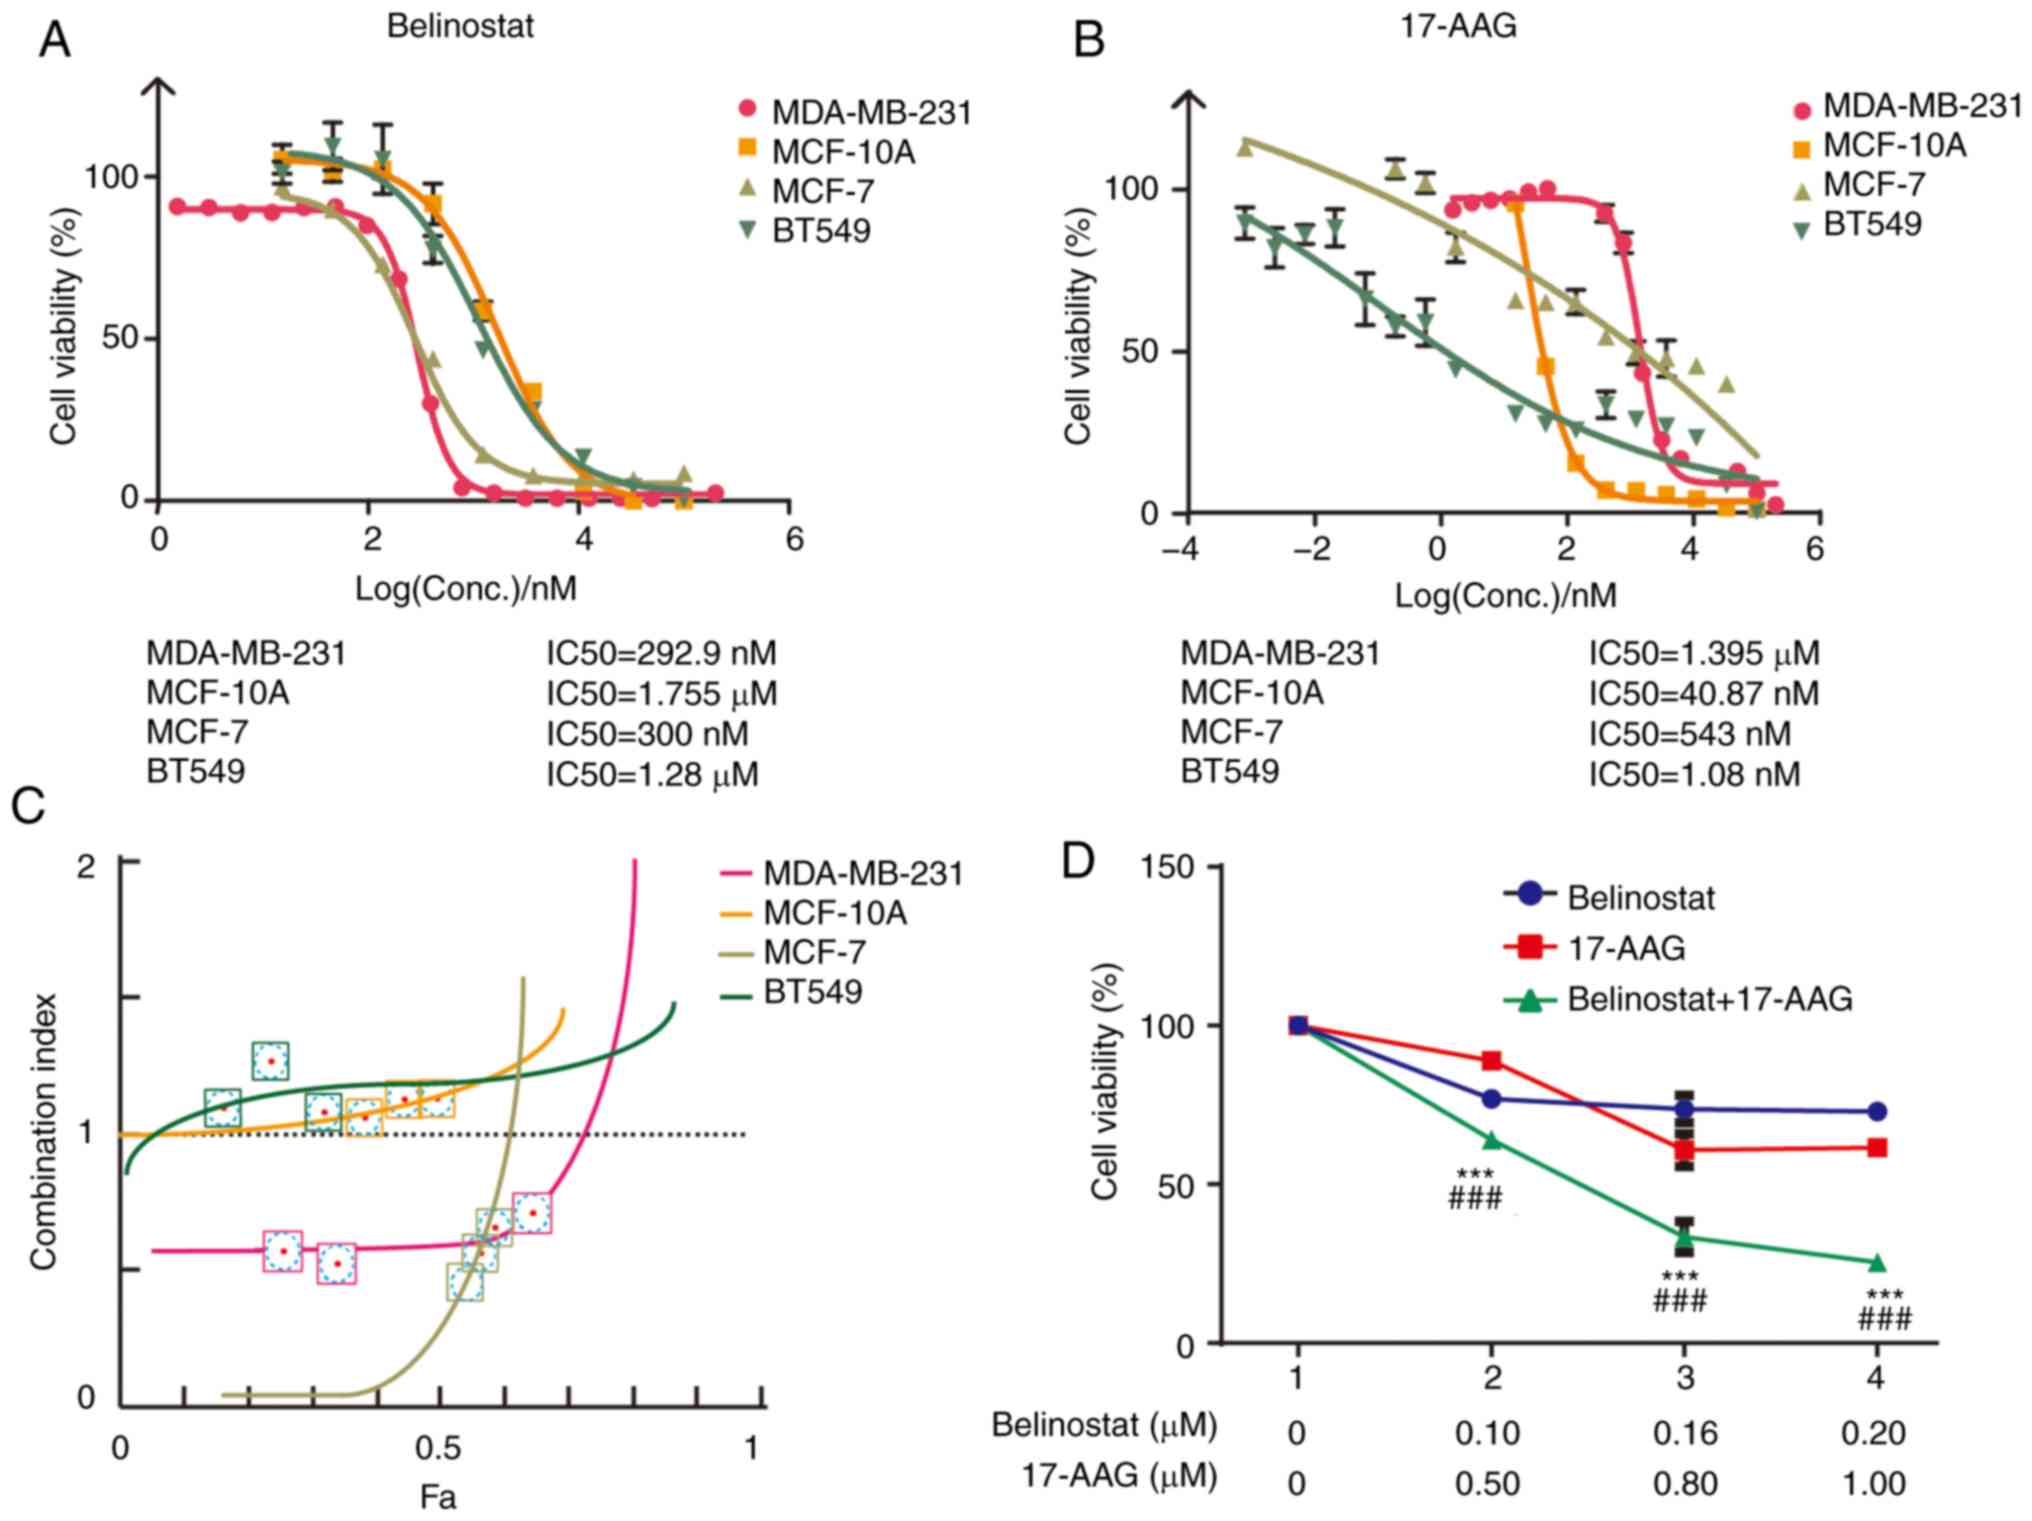
Synergistic effects exist between
HSP90 inhibitor 17-AAG and HDAC6 inhibitor Belinostat in MDA-MB-231
cells
To determine whether synergistic effects exist
between the HSP90 inhibitor 17-AAG and HDAC6 inhibitor Belinostat,
the IC50 value and cell viability of these two drugs
were measured to generate a concentration-inhibition matrix for
combined treatment (Fig. 2A and B).
Based on a previous study (51),
the effects of the combination were calculated using the CI,
because it has been recognized that the fixed dose ratio of two
drugs based on individual IC50 values can achieve a
rational CI. MDA-MB-231, MCF-10A, MCF-7 and BT549 cells were
treated with three different concentrations of 17-AAG and
Belinostat. The effective concentration ratio between 17-AAG and
Belinostat was ~5, 0.023, 1.8 and 0.0008, respectively (Fig. 2A and B). In MCF-10A and BT549 cells,
the CI values were >1 at three groups of concentrations selected
according to effective concentration ratio between 17-AAG and
Belinostat (Fig. 2C). This
indicated that the two drugs have an antagonistic effect. The
antagonistic effect may be caused by high sensitivity to 17-AAG of
MCF-10A and BT549 cells. BT549 cells exhibited higher sensitivity
to 17-AAG than Belinostat (Fig. 2A and
B), which could not be observed and concluded from Fig. 1. The mechanism of the dominant
effect of 17-AAG in BT549 cells requires further study; however,
the present study aimed to explore the combination effect of the
HSP90-HDAC6 axis. The CI values were <1 at different
concentrations in MDA-MB-231 and MCF7 cells. However, considering
the IC50 value of 17-AAG in MCF-7, it was revealed that
the difference in cell inhibition rate was not obvious at the near
drug concentration (Fig. 2C).
Therefore, when setting the fixed molar ratio of the two drugs, the
selected three concentration points would lead to a Fa value higher
than that of MDA-MB-231. These results indicated that 17-AAG and
Belinostat exhibited the best synergistic effect in MDA-MB-231
cells compared with in the other three breast cell lines. Three
concentration groups in MDA-MB-231 cells were established for
17-AAG and Belinostat, including 0.50 µM 17-AAG and 0.10 µM
Belinostat, 0.80 µM 17-AAG and 0.16 µM Belinostat, and 1.00 µM
17-AAG and 0.20 µM Belinostat (Fig.
2D).
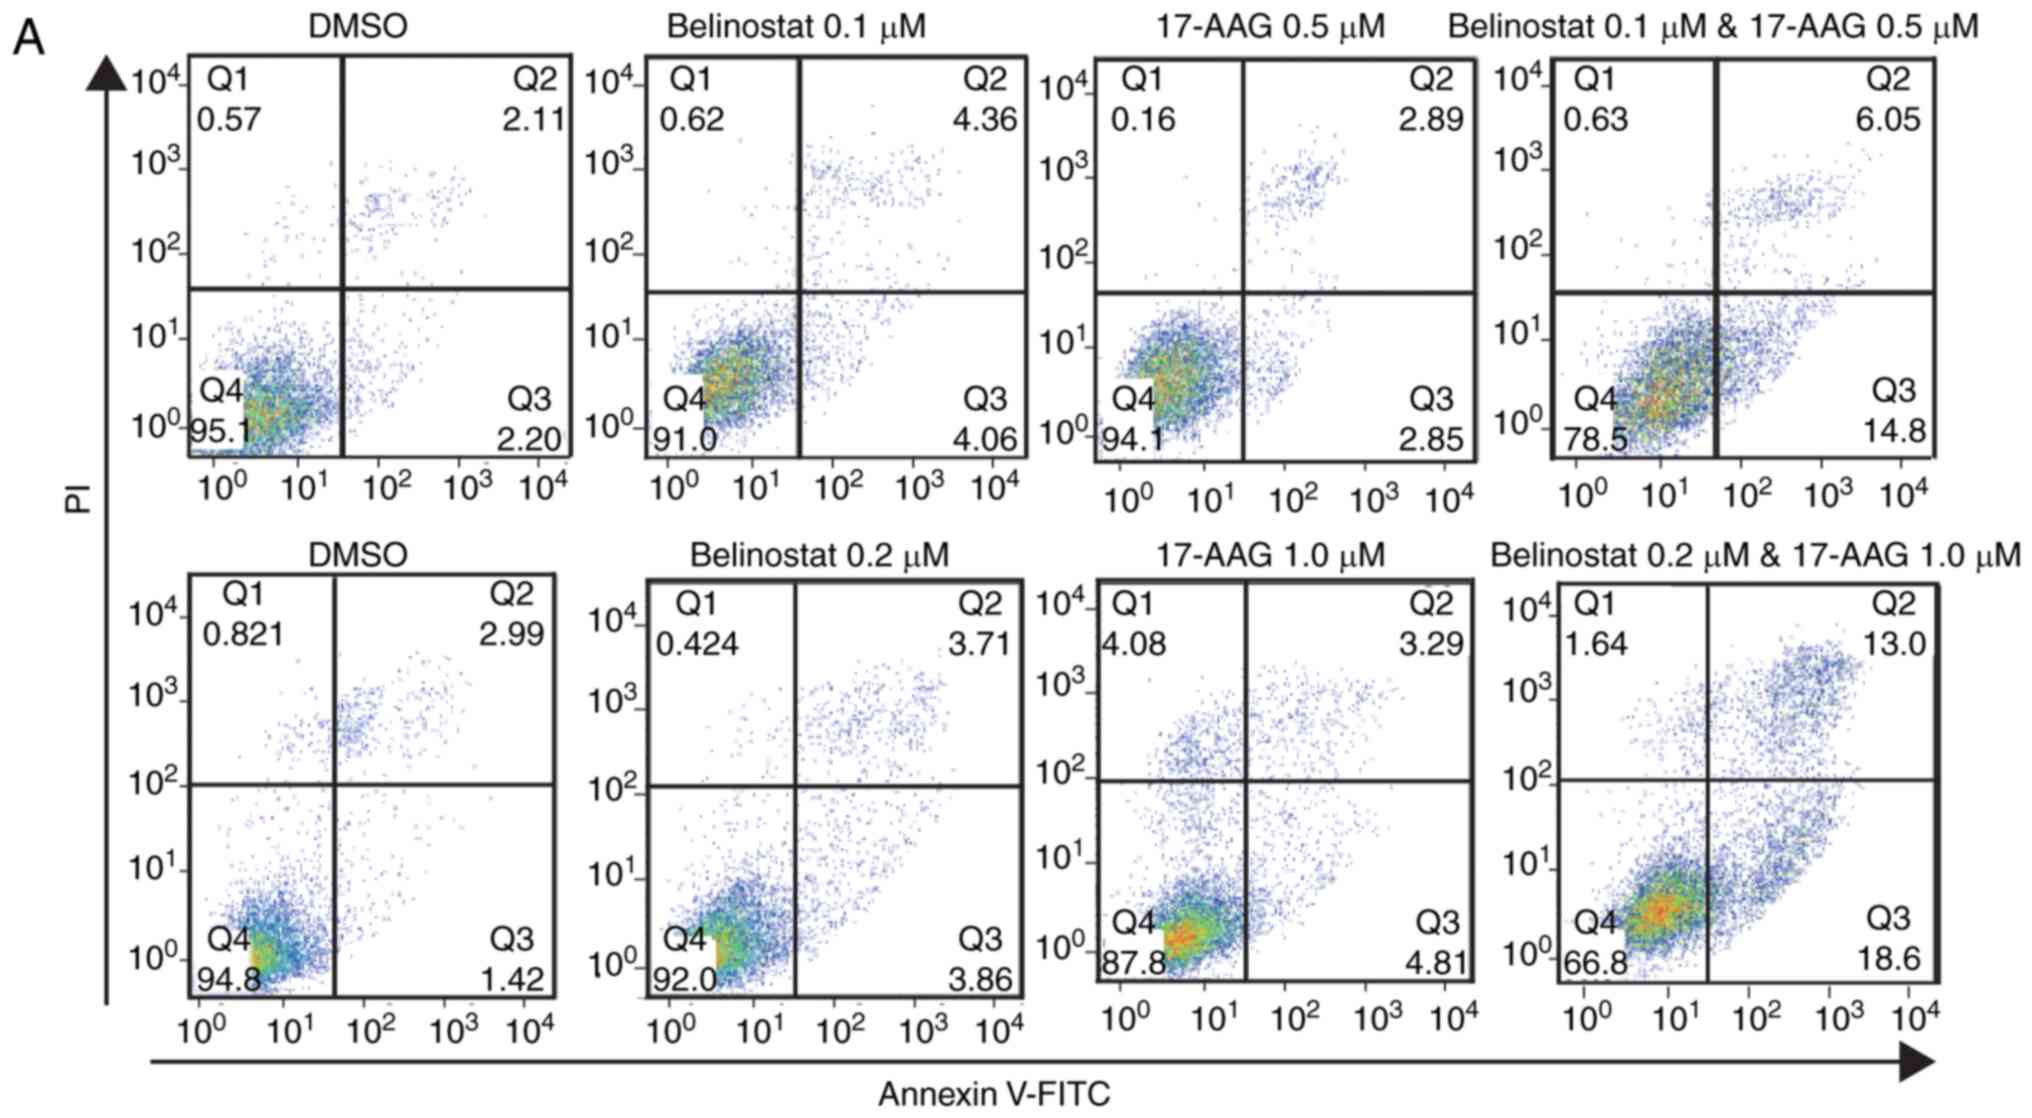
Combination of 17-AAG and Belinostat
leads to enhanced cell cycle arrest and apoptosis in MDA-MB-231
cells
In addition to combination index, the combination of
17-AAG and Belinostat also led to enhanced cell cycle arrest and
apoptosis in MDA-MB-231 cells. Two combination groups with low CI
values (0.1 µM Belinostat with 0.5 µM 17-AAG, and 0.2 µM Belinostat
with 1.0 µM 17-AAG) were selected to treat MDA-MB-231 cells for 3
days. The relative apoptosis rate was not significantly increased
in cells treated with 17-AAG or Belinostat (Fig. 3A and C). The combination of 17-AAG
and Belinostat led to a marked increase in apoptosis, and the total
apoptosis rate increased with the elevation of concentrations
(Fig. 3A and C). Additionally, a
higher proportion of cells were arrested in the G2 phase
following the combined treatment with 17-AAG and Belinostat
compared with the single treatment of 17-AAG or Belinostat alone
(Fig. 3B), and the rate of
G2 phase arrest in the combined treatment group was
higher than that in the single treatment groups (Fig. 3D). Consistent with the flow
cytometry results, western blotting results demonstrated that the
levels of cleaved poly (ADP-ribose) polymerase and caspase 3 were
upregulated in the combination group. In addition, the protein
abundance of CDK1 phosphorylation (p-CDK1) was upregulated in the
combination group and in the single 17-AAG (1 µM) group, indicating
increased inactivation of CDK1. Furthermore, the protein abundance
of cyclin B1 was downregulated in the combination group, indicating
an increased proportion of G2/M phase arrest.
Reciprocal interactions between
Belinostat and HSP90, and 17-AAG and HDAC6
According to a previous study (59), reciprocal interactions may exist
between HSP90 and HDAC6. To determine whether Belinostat affected
HSP90 expression, and whether 17-AAG affected the protein abundance
of HDAC6, qPCR and western blotting were performed. Subsequently,
it was demonstrated that Belinostat downregulated the transcription
levels of HSP90 (HSP90AA1 and HSP90AB1; Fig. 4A). However, Belinostat did not
reduce the HSP90 protein level (Fig.
4B). Compared with the treatment with Belinostat alone, the
acetylation of HSP90 was sharply enhanced in the combination group,
indicating that 17-AAG amplified the acetylation effect of
Belinostat on HSP90. Although Belinostat induced higher acetylation
of α-tubulin than 17-AAG, this effect was not further enhanced in
the combination group. Similarly, the protein abundance of HDAC6
was decreased following treatment with 17-AAG alone, whereas this
effect was not further enhanced in the combination group (Fig. 4B).
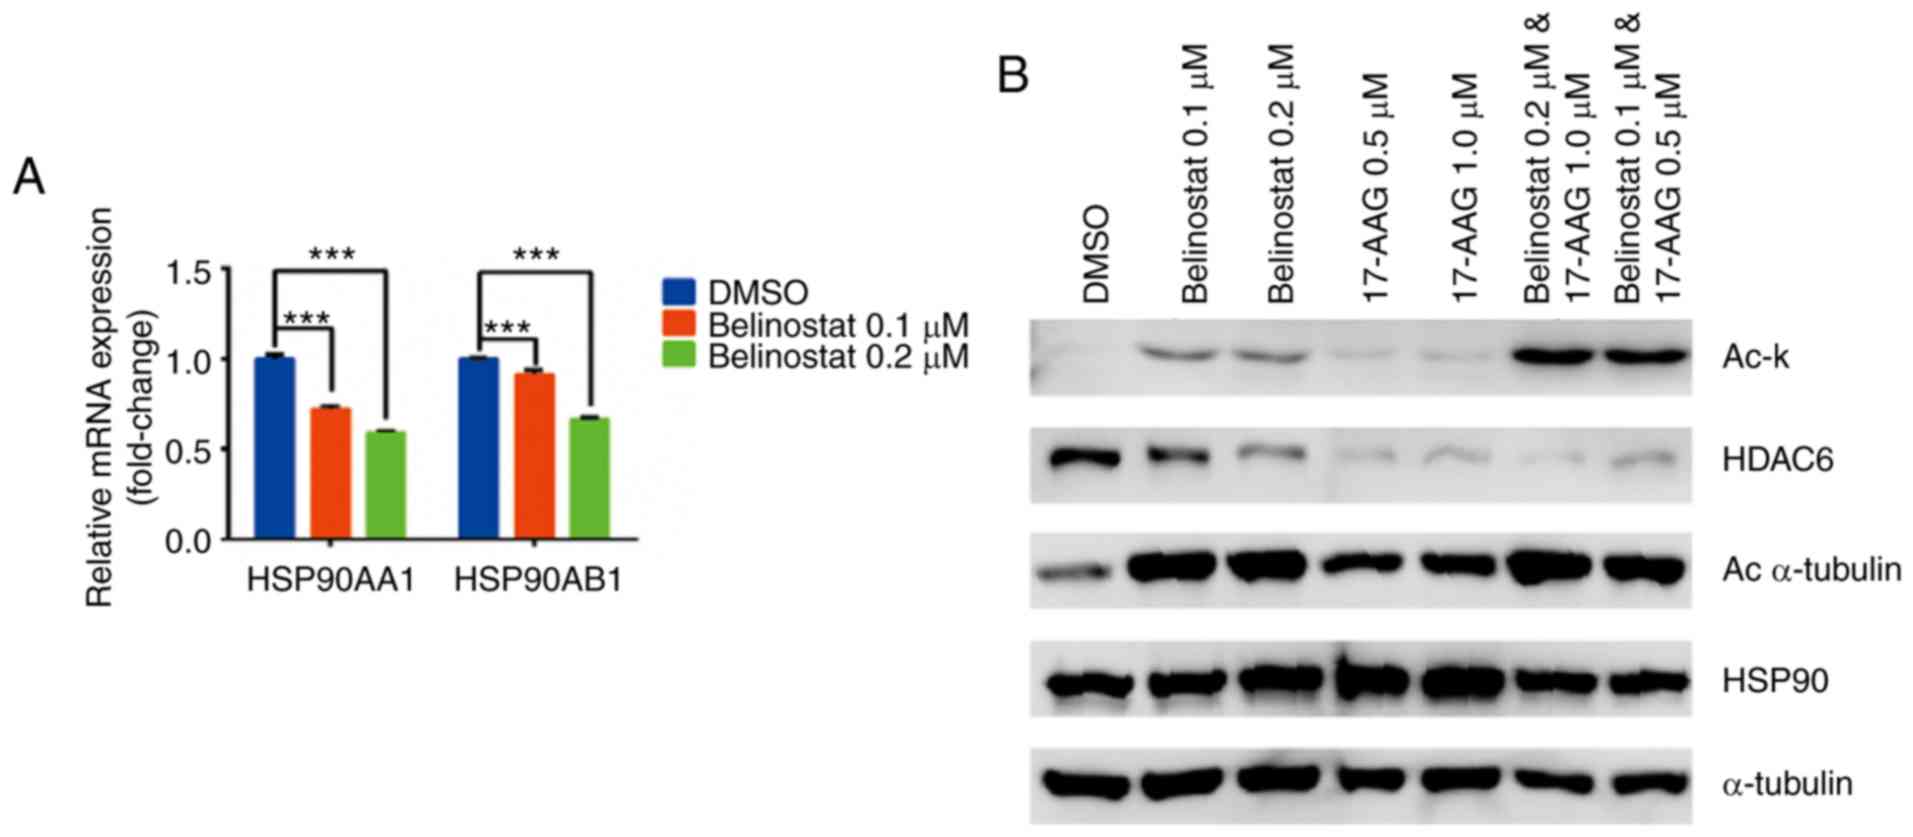 | Figure 4.Reciprocal interactions between
HSP90i 17-AAG and HDAC6i Belinostat. (A) HDAC6i Belinostat
decreased the mRNA expression levels of HSP90 subunits (HSP90AA1
and HSP90AB1) in a concentration-dependent manner. MDA-MB-231 cells
were treated with 0.1 µM or 0.2 µM Belinostat for 72 h. (B) HSP90i
17-AAG significantly enhanced the acetylation effect of Belinostat
on HSP90, as shown for Ac-k, whereas 17-AAG alone showed stronger
inhibition of HDAC6 expression than Belinostat alone. 17-AAG alone
increased the acetylation level of α-tubulin, while this effect was
enhanced in the combination group. HSP90 and α-tubulin were used as
internal references, and compound treatment duration was 72 h. Data
are shown as the mean ± SEM. ***P<0.001. HSP90i, HSP90
inhibitor; HDAC6i, HDAC6 inhibitor; HDAC6, histone deacetylase 6;
HSP90, heat shock protein 90; Ac, acetylated; Ac-k,
Acetylated-lysine antibody. |
RNA-seq analysis suggests that the
combination of 17-AAG and Belinostat may achieve enhanced
inhibition of the migration and invasion of MDA-MB-231 cells
To determine the specific genes and pathways that
are responsible for the synergistic effect of the combination of
17-AAG and Belinostat, RNA-seq was carried out using MDA-MB-231
cells treated with 17-AAG alone, Belinostat alone, and the
combination of 17-AAG and Belinostat. The IC50 ratio of
Belinostat and 17-AAG was ~1 vs. 5, as shown in Fig. 2A and B, and the concentration used
for RNA-seq was selected according to the previously calculated CI
value, apoptosis and cell cycle experiments. When the dose for
17-AAG was 1.0 µM and that for Belinostat was 0.2 µM, cell
viability and apoptosis data exhibited an improved combination
effect. Overall, this dosage was selected for RNA-Seq exploration.
The results demonstrated that the numbers of differentially
expressed genes were 3,576, 1,517 and 874, for the treatment of
17-AAG alone compared with the DMSO group, Belinostat alone
compared with the DMSO group, and the combination group compared
with the DMSO group, respectively. The numbers of shared and unique
differentially expressed genes for each treatment group were
presented as a Venn diagram (Fig.
5A). In terms of pathways analysis, the P-values for each
significantly enriched KEGG pathway were plotted as a histogram for
each treatment group, and the length of each bar is proportional to
the P-value of each KEGG pathway. the ‘cell cycle’ pathway was more
significantly enriched than the ‘TGF-beta signaling pathway’ and
the ‘Focal adhesion’ pathway, for both the treatment of 17-AAG
alone, or Belinostat alone (Fig. 5B and
C). However, ‘Focal adhesion’, ‘TGF-beta signaling pathway’ and
‘Regulation of actin cytoskeleton’ were the most significantly
enriched KEGG pathways in the combination group (Fig. 5D). For treatment with 17-AAG alone,
the P-values for ‘Focal adhesion’, ‘TGF-beta signaling pathway’ and
‘Regulation of actin cytoskeleton’ were 1.9×10⁻³,
2.1×10⁻³ and 2.9×10⁻³, respectively. For
treatment with Belinostat alone, the P-values for ‘Focal adhesion’
and ‘TGF-beta signaling pathway’ were 0.014 and 0.022,
respectively. However, in the combination group, the P-values for
‘Focal Adhesion’, ‘TGF-beta signaling pathway’ and ‘Regulation of
actin cytoskeleton’ were 6.8×10⁻⁵, 2.9×10⁻⁴
and 4.7×10⁻⁴, respectively. In addition, considering the
over-representation of the ‘Oxidative phosphorylation’ pathway in
MDA-MB-231 cells following with treatment with Belinostat alone,
the accumulation ROS in different groups was examined. It was
identified that the ROS level was significantly higher in the
combination group (Fig. S1A). In
addition, several genes that regulate relevant signaling pathways
were also significantly affected in the combination group,
including EGFR, COX5B and UBA52 (Fig.
S1B). Consistent with the pathway analysis, dozens of
migration-associated genes were identified in the list of
differentially expressed genes. Some of them were observed in the
shared list of all the treatment groups, including the treatment
with 17-AAG alone, Belinostat alone and the combination group
(Fig. 5E), whereas some of them
were observed only in the list of the combination group (Fig. 5F). As these pathways and genes
mainly mediate the migration and invasion of cancer cells, these
findings indicated that the combination of 17-AAG and Belinostat
may have enhanced the inhibition of the migration and invasion of
MDA-MB-231 cells compared with treatment with 17-AAG or Belinostat
alone.
 | Figure 5.Pathway statistics and heatmap
analysis for RNA-sequencing data of different treatment groups. (A)
Venn diagram for shared and unique numbers of differentially
expressed genes in the treatment groups of 17-AAG alone, Belinostat
alone, and the combination of 17-AAG and Belinostat. The total
number of shared differentially expressed genes for the three
treatment groups was 360, whereas the total number of unique
differentially expressed genes for the combination group was 185.
(B) Most enriched KEGG pathways of MDA-MB-231 cells, following the
treatment with 17-AAG alone. The ‘Cell cycle’ and ‘Oxidative
phosphorylation’ pathways were more significantly enriched than
three migration-related pathways, including ‘Focal adhesion’,
‘TGF-beta signaling pathway’ and ‘Regulation of actin
cytoskeleton’. (C) Most enriched KEGG pathways of MDA-MB-231 cells
following treatment with Belinostat alone. The ‘Cell cycle’ and
‘Oxidative phosphorylation’ pathways were more significantly
enriched than three migration-related pathways, including ‘Focal
adhesion’ and ‘TGF-beta signaling pathway’. (D) Most enriched KEGG
pathways of MDA-MB-231 cells following combined treatment with
17-AAG and Belinostat. Unlike for the treatment groups of 17-AAG or
Belinostat alone, the ‘Focal adhesion’, ‘TGF-beta signaling
pathway’ and ‘Regulation of actin cytoskeleton’ were more enriched
than the ‘Cell cycle’ pathway, and other typical signaling
pathways, including P53 signaling pathway, MAPK signaling pathway
and Wnt signaling pathway. Pathway statistics and heatmap analysis
for RNA-sequencing data of different treatment groups. ((E) Heatmap
of selected differentially expressed genes from the shared list
(n=360) of the three treatment groups, including 17-AAG alone,
Belinostat alone and the combination group. These genes are
associated with the migration or cytoskeleton remodeling of cells,
according to previous studies (82–84).
The relative expression values were compared with the DMSO group,
and relatively higher expression is presented in red, whereas
relatively lower expression is presented in blue. Pathway
statistics and heatmap analysis for RNA-sequencing data of
different treatment groups. (F) Heatmap of selected differentially
expressed genes from the unique list (n=185) for the combination
group, instead of the treatment groups of 17-AAG or Belinostat
alone. These genes were associated with the migration or survival
of tumor cells, according to previous studies (85–87).
The relative expression values were compared with the DMSO group,
and relatively higher expression was presented in red, whereas
relatively lower expression was presented in blue. KEGG, Kyoto
Encyclopedia of Genes and Genomes. |
Combination of 17-AAG and Belinostat
leads to enhanced inhibition of the migration and invasion of
MDA-MB-231 cells
To confirm whether the combination of 17-AAG and
Belinostat may have inhibitory effects on migration and invasion,
MDA-MB-231 cells were treated with single or combined compounds and
subjected to Transwell and wound-healing assays. The doses for
17-AAG and for Belinostat were consistent with those for RNA-seq.
Compared with the treatment of 17-AAG alone, or Belinostat alone,
the numbers of migrating and invasive cells were decreased
following the combined treatment with 17-AAG and Belinostat for 24
h (Fig. 6A and B). Similarly, in
the wounding healing assay, it was identified that the migration of
cells was significantly suppressed following the combined treatment
with 17-AAG and Belinostat for 24 h (Fig. 6C). According to the RNA-seq data
analysis, relevant signaling pathways and genes mediating cell
migration and invasion were investigated (60,61).
TEAD1 is one of the differentially expressed genes shared by the
single and combined treatment groups (Fig. 5E). Additionally, significant
downregulation was observed for the TEAD family proteins in the
combination group (Fig. 6D).
Consistent with RNA sequencing results (Fig. 5E), western blotting results
demonstrated that the abundance of TEAD family proteins was
decreased in the combination group (Fig. 6E). Additionally, the phosphorylation
of YAP and MLC was increased in the combination group.
Subsequently, siRNA was used to knockdown TEAD genes in MDA-MB-231
cells. The knockdown efficiency of each siRNA was >80% compared
with the normal group (Fig. S2A).
Additionally, the protein expression levels of TEADs were decreased
(Fig. S2B). As shown in the
results of the cell migration assay (Fig. 6F), TEAD1 exhibited a greater effect
on migration of MDA-MB-231 cells than other TEADs, whereas TEAD3
had no effect on cell migration.
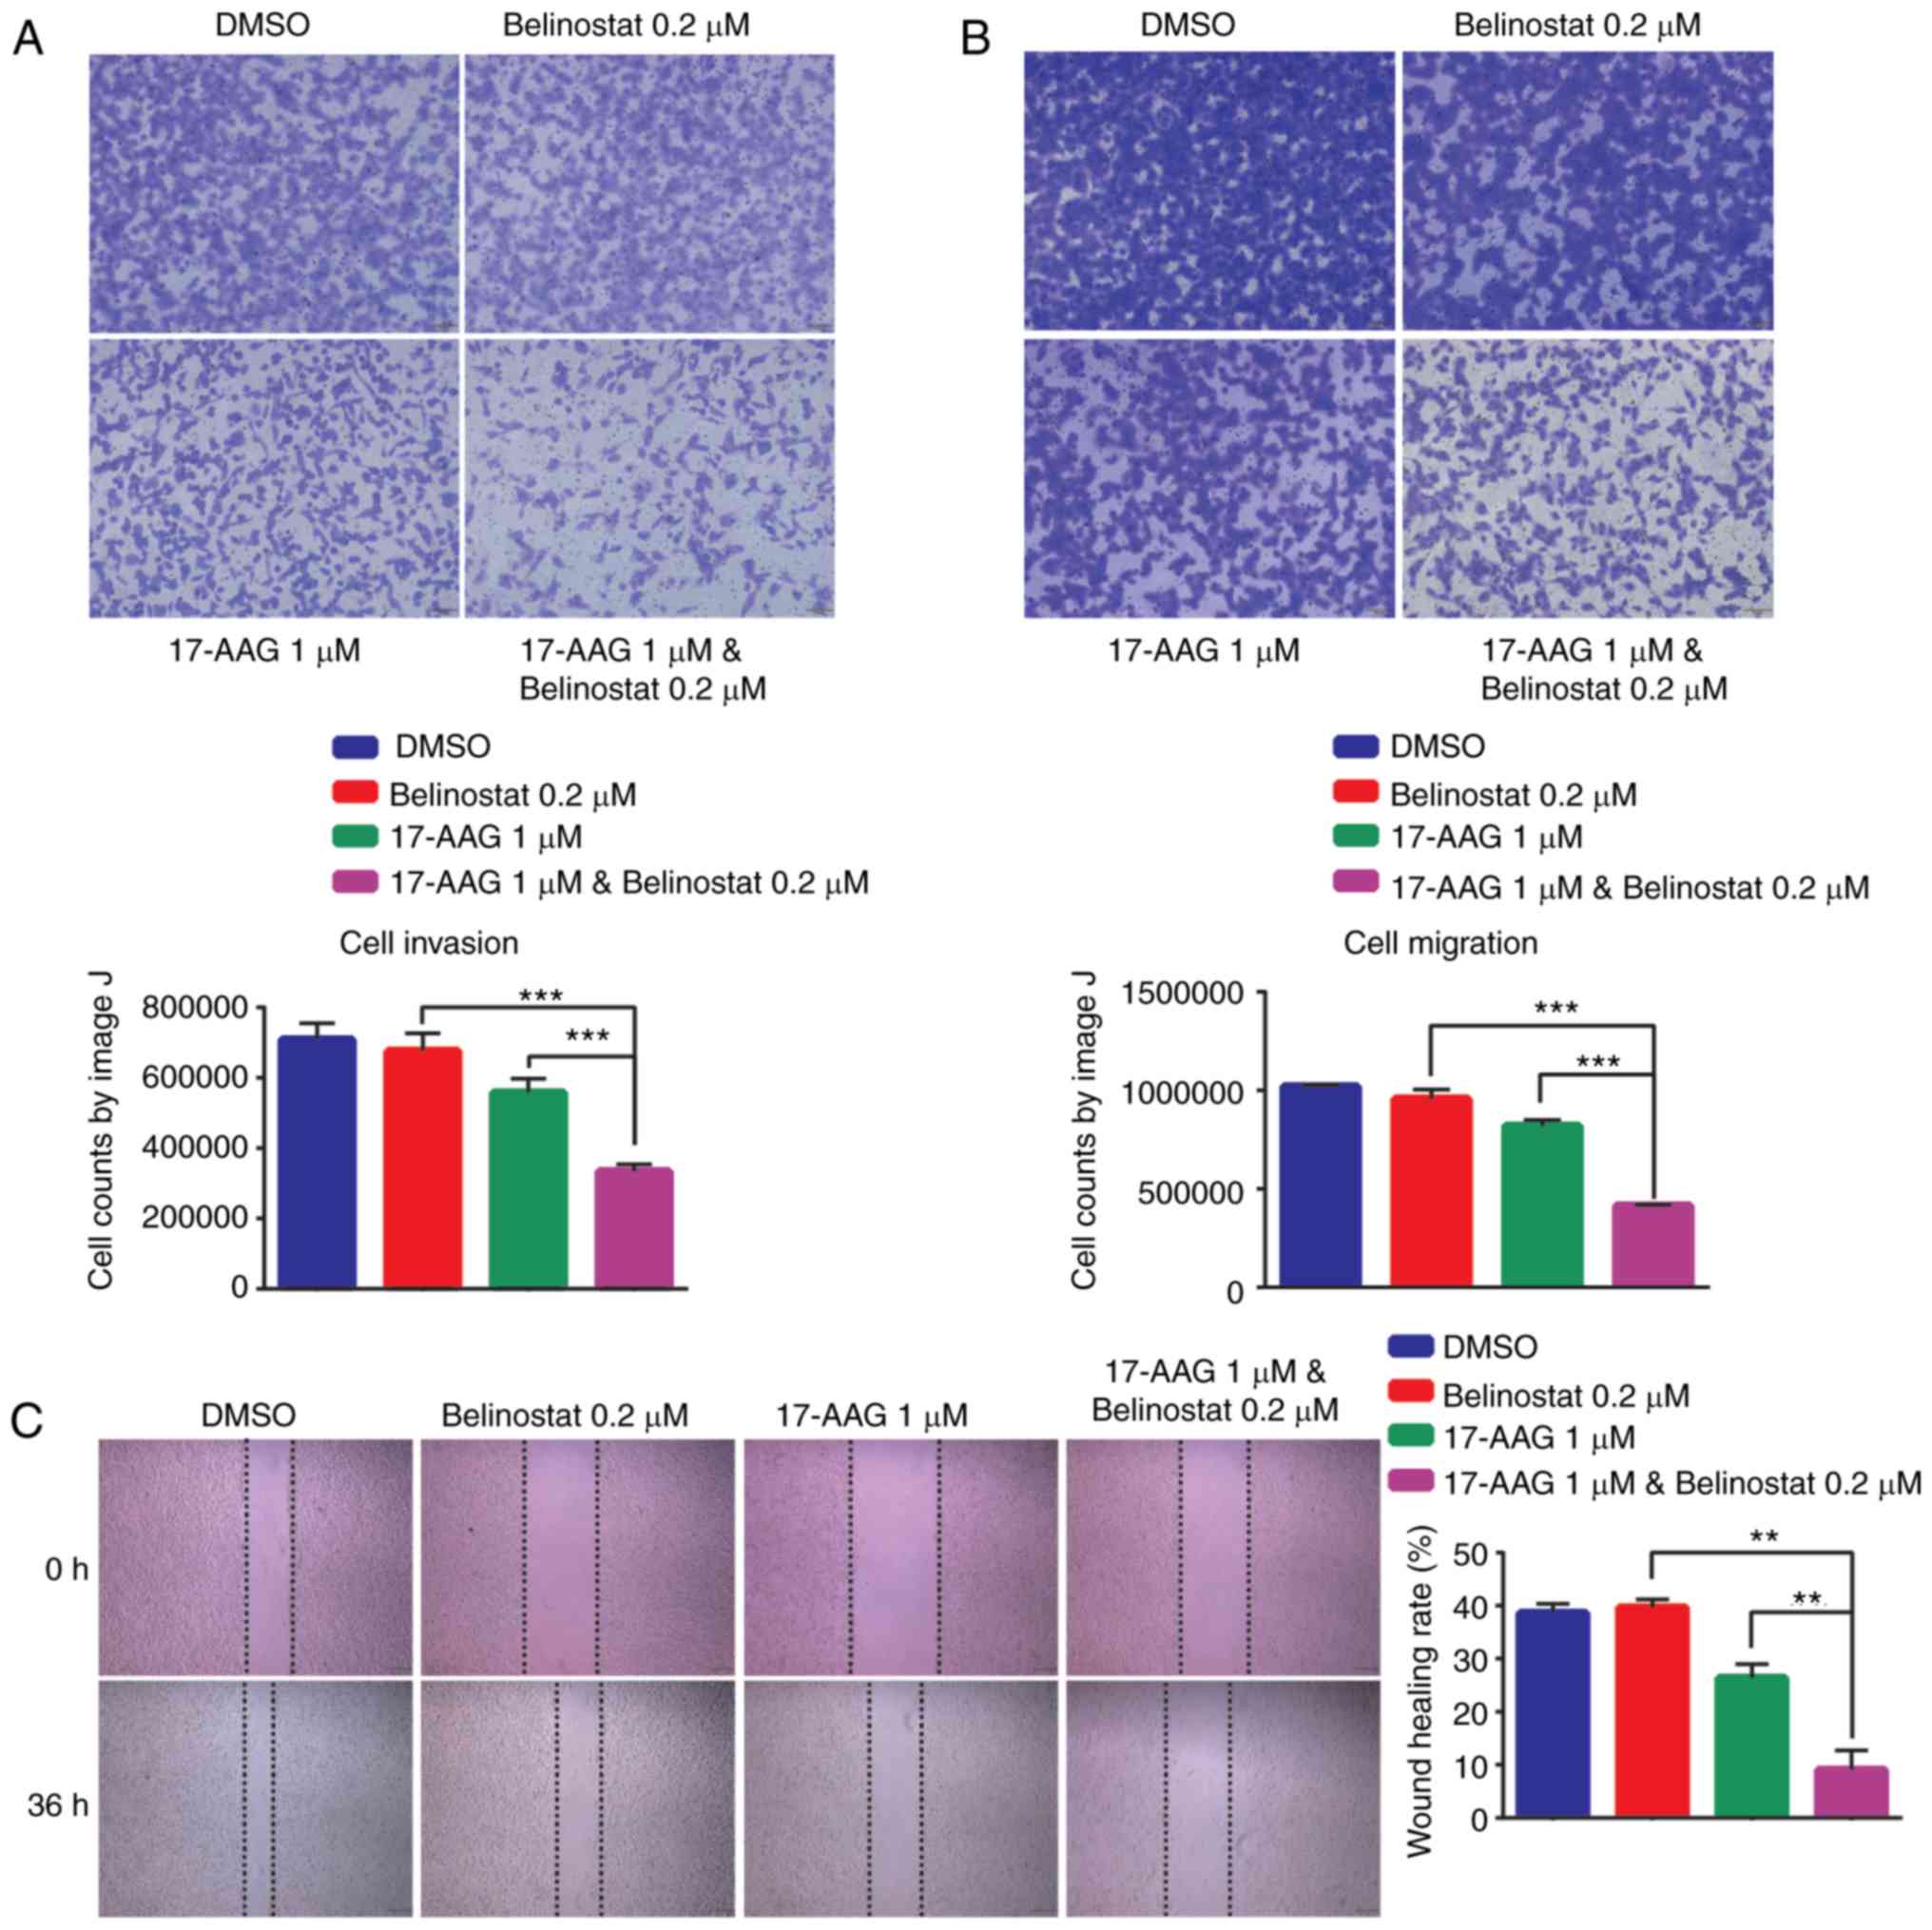 | Figure 6.Enhanced inhibition of the migration
and invasion of MDA-MB-231 cells. (A) Transwell migration assays
demonstrated that enhanced inhibition was observed for the
combination group of 17-AAG and Belinostat in MDA-MB-231 cells.
Magnification, ×40. (B) Transwell invasion assay demonstrated that
enhanced inhibition was observed for the combination group of
17-AAG and Belinostat in MDA-MB-231 cells. Magnification, ×40. (C)
Wound healing assays revealed that enhanced inhibition was observed
for the combination group of 17-AAG and Belinostat in MDA-MB-231
cells. Magnification, ×40. Enhanced inhibition of the migration and
invasion of MDA-MB-231 cells. (D) Significant downregulation of
expression was observed for the TEAD family proteins in the
combination group compared with in the treatment groups of 17-AAG
or Belinostat alone. (E) Phosphorylation of YAP and MLC was
significantly increased in the combination group, indicating the
suppression of migration and invasion-associated pathways.
Decreased protein abundance of the TEAD family was consistent with
the mRNA downregulation. (F) Transwell migration assays
demonstrated that the knockdown of TEADs genes inhibited the
migration of MDA-MB-231 cells. Magnification, ×40. Data are
presented as the mean ± SEM. *P<0.05, **P<0.01,
***P<0.001. p-, phosphorylated; TEAD, TEA domain family member;
ns, not significant; YAP, YY1 associated protein 1; TAZ, tafazzin;
MLC, modulator of VRAC current 1; si, small interfering RNA; NC,
negative control. |
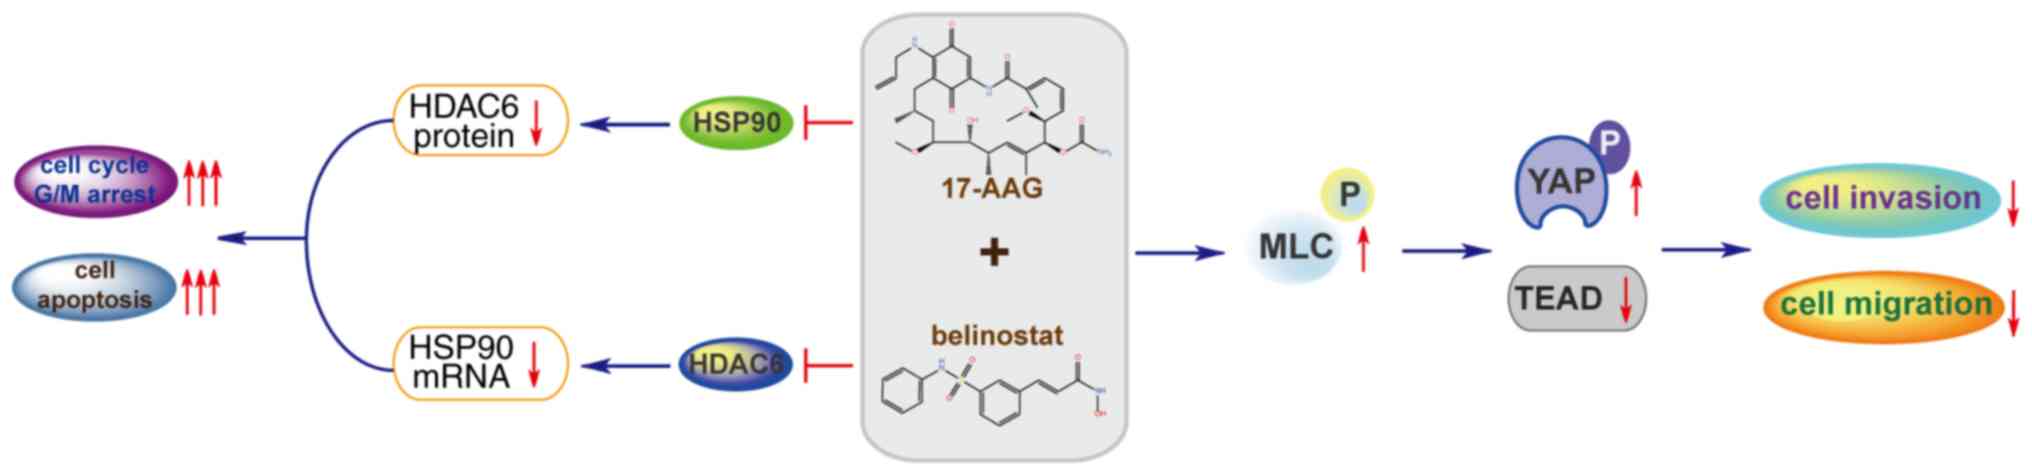
Discussion
The present study reported the synergistic effect of
the HSP90 inhibitor 17-AAG and the HDAC6 inhibitor Belinostat on
the proliferation, as well as migration and invasion, of TNBC
MDA-MB-231 cells. HSP90 has been reported as a biomarker of TNBC
(24,25), and HDACs are considered to be a
therapeutic target of TNBC (62).
According to previous studies, HSP90 regulates the protein folding
of HDAC6, whereas HDAC6 reversely promotes the acetylation of HSP90
(38,39). Higher expression levels of HSP90 and
HDAC6 were observed in TNBC BT549 and MDA-MB-231 cell lines
compared with in the non-TNBC MCF-7 cell line and normal breast
MCF-10A cell line, suggesting that the combined treatment of HSP90
inhibitor and HDAC6 inhibitor may achieve synergistic efficacy
(63). Subsequently, it was
revealed that the combined treatment with HSP90 inhibitor 17-AAG
and HDAC6 inhibitor Belinostat synergistically inhibited the
proliferation of MDA-MB-231 cells, with a CI<1 in three
different concentration groups (Fig.
1D). Additionally, the inhibition rate in the combination group
was greater than the sum of inhibition rates of the two
single-treatment groups, which is a remarkable feature of this
combination formula.
According to previous studies of the interactions
between HSP90 and HDAC6, the inhibitors of these two targets may
crosstalk (38,64,65).
The results revealed that the HDAC6 inhibitor Belinostat
downregulated the mRNA expression of HSP90, whereas the HSP90
inhibitor 17-AAG significantly downregulated the protein abundance
of HDAC6. Indeed, HDAC inhibitors have been identified to turn on
gene expression via an increase in histone acetylation and
chromatin opening (66). However,
subsequent studies have revealed that open chromatin resulting from
inhibition of histone deacetylases can result in either the
upregulation or the repression of genes (67,68).
Due to this reciprocal interaction, the acetylation rate of HSP90
and α-tubulin were significantly elevated in the combination group
of 17-AAG and Belinostat. The difference between mRNA and protein
expression may be caused by time delay between transcription and
translation. The decrease in mRNA may require more time to impact
the protein level. In order to investigate the involved genes and
pathways which are responsible for the synergistic effect of the
combination of 17-AAG and Belinostat, RNA-seq data was collected
and analyzed. It was identified that migration and
invasion-associated pathways were the most significantly enriched
in the combination group. Subsequent results confirmed the
significant downregulation of TEAD family proteins, and increased
phosphorylation of YAP and MLC, indicating the suppression of the
Hippo signaling pathway and Rho-mediated cell migration (Fig. 7). The present study revealed that
the protein expression levels of YAP were decreased in the
combination group, and previous studies have demonstrated that YAP
is associated with the occurrence of breast cancer (69–71).
YAP can enhance cell growth and tumor growth (72,73).
Therefore, the downregulation of YAP may explain why the
combination group can inhibit cell proliferation better than a
single drug. Overall, the combination of 17-AAG and Belinostat
increased the phosphorylation of YAP and modulator of VRAC current
1 (MLC), and decreased the expression of YAP and TEAD family
proteins, leading to the suppression of Hippo signaling pathway
(74) and Rho-mediated cell
migration (75,76). These alterations may contribute to
the enhanced inhibition of the combination group, in terms of
migration and invasion of MDA-MB-231 cells. TEAD is a well
investigated regulator that mediates the migration and invasion of
cancer cells. Previous studies have indicated the key regulatory
role of the YY1 associated protein 1(YAP)/TAZ/TEAD complex in the
metastasis of breast cancer (77,78).
Transcriptional co-activator with PDZ-binding motif (TAZ) is
structurally similar transcriptional co-factors involved in
multiple cellular processes including proliferation, organ growth
and stem cell differentiation with YAP (79). In addition, as a transcription
factor, the alteration in TEAD expression may have a wider and
deeper impact on the migration and invasion of cancer cells
compared with various other genes. Previous studies have indicated
the effect of HSP90 and HDAC6 (80,81) in
regulating the function of the YAP/TAZ/TEAD complex. However, the
detailed mechanism of how the TEAD genes affected MDA-MB-231 cell
migration requires further research. The observation in MDA-MB-231
cells require verification in BT549 or other TNBC cell lines in
addition to in vivo studies to verify this effect. Overall,
according to previous experiment on MDA-MB-231 cells, the
combination of 17-AAG and Belinostat has great potential for the
treatment of TNBC. However, the enhanced efficacy of this
combination requires clinical data to substantiate, before it
actually benefits the patients with TNBC.
In conclusion, as a heterogeneous subtype of breast
cancer, TNBC is challenging for clinical treatment due to the high
risk of metastasis and recurrence. The current study reported the
enhanced inhibitory effect of the combination of 17-AAG and
Belinostat on the proliferation, cell cycle progression and
survival of TNBC MDA-MB-231 cells. Additionally, the inhibition
rate in the combination group was greater than the sum of the
inhibition rates in the single-treatment groups. According to the
RNA-seq data analysis, this combination may exhibit enhanced
inhibitory effects on the migration and invasion of MDA-MB-231
cells, which was subsequently confirmed by migration and invasion
assays. In addition, it was revealed that this enhanced efficacy
may be achieved through the suppression of the Hippo signaling
pathway and Rho-mediated cell migration (78). Since the anti-metastasis feature of
this combination has great potential for the treatment of TNBC, it
was concluded that the effect and mechanism of this combination
provided a novel strategy, as well as beneficial reference, for the
clinical treatment of TNBC, based on experiments in MDA-MB-231
cells.
Supplementary Material
Supporting Data
Acknowledgements
Not applicable.
Funding
The present study was financially supported by the
CAS Strategic Priority Research Program (grant no. XDA12020353 to
CL), the Institutes for Drug Discovery and Development, Chinese
Academy of Sciences (grant no. CASIMM0120184015 to CL), and the
Shanghai Young Science and Technology Talents Sailing Plan (grant
no. 19YF1457200 to HZ).
Availability of data and materials
The datasets used and/or analyzed during the current
study are available from the corresponding author on reasonable
request.
Authors' contributions
CL, KC, HJ, HX and HZ designed the study and
discovered the combination. YZ, HX, FX and ZC conducted the
experiments of cell viability, flow cytometry, western blotting and
migration assays. HZ and BZ analyzed the RNA-seq data, and uploaded
the raw data to the GEO database. KC, HJ and CL were responsible
for the collection and assembly of data. YZ and HX prepared the
figures and wrote the manuscript. KC, HJ and HZ revised the
manuscript. CL and HZ supervised the project. All authors read and
approved the final version of this manuscript and agree to be
accountable for all aspects of the research in ensuring that the
accuracy or integrity of any part of the work are appropriately
investigated and resolved.
Ethics approval and consent to
participate
Not applicable.
Patient consent for publication
Not applicable.
Competing interests
The authors declare that they have no competing
interests.
References
|
1
|
Ito H and Matsuo K: Molecular
epidemiology, and possible real-world applications in breast
cancer. Breast Cancer. 23:33–38. 2016. View Article : Google Scholar
|
|
2
|
Khan MA, Jain VK, Rizwanullah M, Ahmad J
and Jain K: PI3K/AKT/mTOR pathway inhibitors in triple-negative
breast cancer: A review on drug discovery and future challenges.
Drug Discov Today. 24:2181–2191. 2019. View Article : Google Scholar
|
|
3
|
Ellsworth RE, Blackburn HL, Shriver CD,
Soon-Shiong P and Ellsworth DL: Molecular heterogeneity in breast
cancer: State of the science and implications for patient care.
Semin Cell Dev Biol. 64:65–72. 2017. View Article : Google Scholar
|
|
4
|
Harbeck N, Penault-Llorca F, Cortes J,
Gnant M, Houssami N, Poortmans P, Ruddy K, Tsang J and Cardoso F:
Breast cancer. Nat Rev Dis Primers. 5:662019. View Article : Google Scholar
|
|
5
|
El Etreby MF, Liang Y, Wrenn RW and
Schoenlein PV: Additive effect of mifepristone and tamoxifen on
apoptotic pathways in MCF-7 human breast cancer cells. Breast
Cancer Res Treat. 51:149–168. 1998. View Article : Google Scholar
|
|
6
|
Arab A, Yazdian-Robati R and Behravan J:
HER2-Positive breast cancer immunotherapy: A focus on vaccine
development. Arch Immunol Ther Exp (Warsz). 68:22020. View Article : Google Scholar
|
|
7
|
Chacón RD and Costanzo MV: Triple-negative
breast cancer. Breast Cancer Res. 12 (Suppl 2):S32010. View Article : Google Scholar
|
|
8
|
Chang-Qing Y, Jie L, Shi-Qi Z, Kun Z,
Zi-Qian G, Ran X, Hui-Meng L, Ren-Bin Z, Gang Z, Da-Chuan Y and
Chen-Yan Z: Recent treatment progress of triple negative breast
cancer. Prog Biophys Mol Biol. 151:40–53. 2020. View Article : Google Scholar
|
|
9
|
Lee YT, Tan YJ and Oon CE: Molecular
targeted therapy: Treating cancer with specificity. Eur J
Pharmacol. 834:188–196. 2018. View Article : Google Scholar
|
|
10
|
Bianchini G, Balko JM, Mayer IA, Sanders
ME and Gianni L: Triple-negative breast cancer: Challenges and
opportunities of a heterogeneous disease. Nat Rev Clin Oncol.
13:674–690. 2016. View Article : Google Scholar :
|
|
11
|
Wein L, Luen SJ, Savas P, Salgado R and
Loi S: Checkpoint blockade in the treatment of breast cancer:
Current status and future directions. Br J Cancer. 119:4–11. 2018.
View Article : Google Scholar :
|
|
12
|
Lee A and Djamgoz MBA: Triple negative
breast cancer: Emerging therapeutic modalities and novel
combination therapies. Cancer Treat Rev. 62:110–122. 2018.
View Article : Google Scholar
|
|
13
|
Gahr S, Ocker M, Ganslmayer M, Zopf S,
Okamoto K, Hartl A, Leitner S, Hahn EG and Herold C: The
combination of the histone-deacetylase inhibitor trichostatin A and
gemcitabine induces inhibition of proliferation and increased
apoptosis in pancreatic carcinoma cells. Int J Oncol. 31:567–576.
2007.
|
|
14
|
Jang JH, Cho YC, Kim KH, Lee KS, Lee J,
Kim DE, Park JS, Jang BC, Kim S, Kwon TK and Park JW: BAI, a novel
Cdk inhibitor, enhances farnesyltransferase inhibitor
LB42708-mediated apoptosis in renal carcinoma cells through the
downregulation of Bcl-2 and c-FLIP (L). Int J Oncol. 45:1680–1690.
2014. View Article : Google Scholar
|
|
15
|
Wang XN, Wang KY, Zhang XS, Yang C and Li
XY: 4-Hydroxybenzoic acid (4-HBA) enhances the sensitivity of human
breast cancer cells to adriamycin as a specific HDAC6 inhibitor by
promoting HIPK2/p53 pathway. Biochem Biophys Res Commun.
504:812–819. 2018. View Article : Google Scholar
|
|
16
|
Schopf FH, Biebl MM and Buchner J: The
HSP90 chaperone machinery. Nat Rev Mol Cell Boil. 18:345–360. 2017.
View Article : Google Scholar
|
|
17
|
Talaei S, Mellatyar H, Asadi A, Akbarzadeh
A, Sheervalilou R and Zarghami N: Spotlight on 17-AAG as an Hsp90
inhibitor for molecular targeted cancer treatment. Chem Biol Drug
Des. 93:760–786. 2019. View Article : Google Scholar
|
|
18
|
Kamal A, Thao L, Sensintaffar J, Zhang L,
Boehm MF, Fritz LC and Burrows FJ: A high-affinity conformation of
Hsp90 confers tumour selectivity on Hsp90 inhibitors. Nature.
425:407–410. 2003. View Article : Google Scholar
|
|
19
|
Mellatyar H, Talaei S,
Pilehvar-Soltanahmadi Y, Barzegar A, Akbarzadeh A, Shahabi A,
Barekati-Mowahed M and Zarghami N: Targeted cancer therapy through
17-DMAG as an Hsp90 inhibitor: Overview and current state of the
art. Biomed Pharmacother. 102:608–617. 2018. View Article : Google Scholar
|
|
20
|
Zagouri F, Sergentanis TN, Chrysikos D,
Papadimitriou CA, Dimopoulos MA and Psaltopoulou T: Hsp90
inhibitors in breast cancer: A systematic review. Breast.
22:569–578. 2013. View Article : Google Scholar
|
|
21
|
Pontes FSC, Pontes HAR, de Souza LL, de
Jesus AS, Joaquim AMC, Miyahara LAN, Fonseca FP and Pinto Junior
DS: Effect of 17-allylamino-17-demethoxygeldanamycin (17-AAG) on
Akt protein expression is more effective in head and neck cancer
cell lineages that retain PTEN protein expression. J Oral Pathol
Med. 47:253–259. 2018. View Article : Google Scholar
|
|
22
|
Modi S, Stopeck A, Linden H, Solit D,
Chandarlapaty S, Rosen N, D'Andrea G, Dickler M, Moynahan ME,
Sugarman S, et al: HSP90 inhibition is effective in breast cancer:
A phase II trial of tanespimycin (17-AAG) plus trastuzumab in
patients with HER2-positive metastatic breast cancer progressing on
trastuzumab. Clin Cancer Res. 17:5132–5139. 2011. View Article : Google Scholar
|
|
23
|
Raja SM, Clubb RJ, Bhattacharyya M, Dimri
M, Cheng H, Pan W, Ortega-Cava C, Lakku-Reddi A, Naramura M, Band V
and Band H: A combination of Trastuzumab and 17-AAG induces
enhanced ubiquitinylation and lysosomal pathway-dependent ErbB2
degradation and cytotoxicity in ErbB2-overexpressing breast cancer
cells. Cancer Boil Ther. 7:1630–1640. 2008. View Article : Google Scholar
|
|
24
|
Jensen MR, Schoepfer J, Radimerski T,
Massey A, Guy CT, Brueggen J, Quadt C, Buckler A, Cozens R,
Drysdale MJ, et al: NVP-AUY922: A small molecule HSP90 inhibitor
with potent antitumor activity in preclinical breast cancer models.
Breast Cancer Res. 10:R332008. View Article : Google Scholar :
|
|
25
|
Cheng Q, Chang JT, Geradts J, Neckers LM,
Haystead T, Spector NL and Lyerly HK: Amplification and high-level
expression of heat shock protein 90 marks aggressive phenotypes of
human epidermal growth factor receptor 2 negative breast cancer.
Breast Cancer Res. 14:R622012. View Article : Google Scholar :
|
|
26
|
Chelladurai P, Boucherat O, Stenmark K,
Kracht M, Seeger W, Bauer UM, Bonnet S and Pullamsetti SS:
Targeting histone acetylation in pulmonary hypertension and right
ventricular hypertrophy. Br J Pharmacol. Nov 20–2019.(Epub ahead of
print).
|
|
27
|
Mirzaei H, Ghorbani S, Khanizadeh S,
Namdari H, Faghihloo E and Akbari A: Histone deacetylases in
virus-associated cancers. Rev Med Virol. 30:e20852020. View Article : Google Scholar
|
|
28
|
Guo P, Chen W, Li H, Li M and Li L: The
histone acetylation modifications of breast cancer and their
therapeutic implications. Pathol Oncol Res. 24:807–813. 2018.
View Article : Google Scholar
|
|
29
|
Hassell KN: Histone deacetylases and their
inhibitors in cancer epigenetics. Diseases. 7:E572019. View Article : Google Scholar
|
|
30
|
Huang M, Huang J, Zheng Y and Sun Q:
Histone acetyltransferase inhibitors: An overview in synthesis,
structure-activity relationship and molecular mechanism. Eur J Med
Chem. 178:259–286. 2019. View Article : Google Scholar
|
|
31
|
Sanaei M and Kavoosi F: Histone
deacetylases and histone deacetylase inhibitors: Molecular
mechanisms of action in various cancers. Adv Biomed Res. 8:632019.
View Article : Google Scholar :
|
|
32
|
Falkenberg KJ and Johnstone RW: Histone
deacetylases and their inhibitors in cancer, neurological diseases
and immune disorders. Nat Rev Drug Discov. 13:673–691. 2014.
View Article : Google Scholar
|
|
33
|
Min A, Im SA, Kim DK, Song SH, Kim HJ, Lee
KH, Kim TY, Han SW, Oh DY, Kim TY, et al: Histone deacetylase
inhibitor, suberoylanilide hydroxamic acid (SAHA), enhances
anti-tumor effects of the poly (ADP-ribose) polymerase (PARP)
inhibitor olaparib in triple-negative breast cancer cells. Breast
Cancer Res. 17:332015. View Article : Google Scholar :
|
|
34
|
Bolden JE, Peart MJ and Johnstone RW:
Anticancer activities of histone deacetylase inhibitors. Nat Rev
Drug Discov. 5:769–784. 2006. View Article : Google Scholar
|
|
35
|
Tate CR, Rhodes LV, Segar HC, Driver JL,
Pounder FN, Burow ME and Collins-Burow BM: Targeting
triple-negative breast cancer cells with the histone deacetylase
inhibitor panobinostat. Breast cancer Res. 14:R792012. View Article : Google Scholar :
|
|
36
|
Aldana-Masangkay GI and Sakamoto KM: The
role of HDAC6 in cancer. J Biomed Biotechnol. 2011:8758242011.
View Article : Google Scholar
|
|
37
|
Boyault C, Sadoul K, Pabion M and Khochbin
S: HDAC6, at the crossroads between cytoskeleton and cell signaling
by acetylation and ubiquitination. Oncogene. 26:5468–5476. 2007.
View Article : Google Scholar
|
|
38
|
Krämer OH, Mahboobi S and Sellmer A:
Drugging the HDAC6-HSP90 interplay in malignant cells. Trends
Pharmacol Sci. 35:501–509. 2014. View Article : Google Scholar
|
|
39
|
Rao R, Fiskus W, Yang Y, Lee P, Joshi R,
Fernandez P, Mandawat A, Atadja P, Bradner JE and Bhalla K: HDAC6
inhibition enhances 17-AAG-mediated abrogation of hsp90 chaperone
function in human leukemia cells. Blood. 112:1886–1893. 2008.
View Article : Google Scholar
|
|
40
|
Plumb JA, Finn PW, Williams RJ, Bandara
MJ, Romero MR, Watkins CJ, La Thangue NB and Brown R:
Pharmacodynamic response and inhibition of growth of human tumor
xenografts by the novel histone deacetylase inhibitor PXD101. Mol
Cancer Ther. 2:721–728. 2003.
|
|
41
|
Qian X, LaRochelle WJ, Ara G, Wu F,
Petersen KD, Thougaard A, Sehested M, Lichenstein HS and Jeffers M:
Activity of PXD101, a histone deacetylase inhibitor, in preclinical
ovarian cancer studies. Mol Cancer Ther. 5:2086–2095. 2006.
View Article : Google Scholar
|
|
42
|
Paoluzzi L, Scotto L, Marchi E, Zain J,
Seshan VE and Connor OA: Romidepsin and belinostat synergize the
antineoplastic effect of bortezomib in mantle cell lymphoma. Clin
Cancer Res. 16:554–565. 2010. View Article : Google Scholar
|
|
43
|
Thomas A, Rajan A, Szabo E, Tomita Y,
Carter CA, Scepura B, Lopez-Chavez A, Lee MJ, Redon CE, Frosch A,
et al: A phase I/II trial of belinostat in combination with
cisplatin, doxorubicin, and cyclophosphamide in thymic epithelial
tumors: A clinical and translational study. Clin Cancer Res.
20:5392–5402. 2014. View Article : Google Scholar :
|
|
44
|
Kim SH, Kang JG, Kim CS, Ihm SH, Choi MG,
Yoo HJ and Lee SJ: The heat shock protein 90 inhibitor SNX5422 has
a synergistic activity with histone deacetylase inhibitors in
induction of death of anaplastic thyroid carcinoma cells.
Endocrine. 51:274–282. 2016. View Article : Google Scholar
|
|
45
|
Nguyen A, Su L, Campbell B, Poulin NM and
Nielsen TO: Synergism of heat shock protein 90 and histone
deacetylase inhibitors in synovial sarcoma. Sarcoma.
2009:7949012009. View Article : Google Scholar :
|
|
46
|
Zismanov V, Drucker L and Gottfried M: ER
homeostasis and motility of NSCLC cell lines can be therapeutically
targeted with combined Hsp90 and HDAC inhibitors. Pulm Pharmacol
Ther. 26:388–394. 2013. View Article : Google Scholar
|
|
47
|
Jamdade VS, Sethi N, Mundhe NA, Kumar P,
Lahkar M and Sinha N: Therapeutic targets of triple-negative breast
cancer: A review. Br J Pharmacol. 172:4228–4237. 2015. View Article : Google Scholar :
|
|
48
|
Conlin AK and Seidman AD: Taxanes in
breast cancer: An update. Curr Oncol Rep. 9:22–30. 2007. View Article : Google Scholar
|
|
49
|
Sikov WM, Berry DA, Perou CM, Singh B,
Cirrincione CT, Tolaney SM, Kuzma CS, Pluard TJ, Somlo G, Port ER,
et al: Impact of the addition of carboplatin and/or bevacizumab to
neoadjuvant once-per-week paclitaxel followed by dose-dense
doxorubicin and cyclophosphamide on pathologic complete response
rates in stage II to III triple-negative breast cancer: CALGB 40603
(Alliance). J Clin Oncol. 33:13–21. 2015. View Article : Google Scholar
|
|
50
|
von Minckwitz G, Schneeweiss A, Loibl S,
Salat C, Denkert C, Rezai M, Blohmer JU, Jackisch C, Paepke S,
Gerber B, et al: Neoadjuvant carboplatin in patients with
triple-negative and HER2-positive early breast cancer (GeparSixto;
GBG 66): A randomised phase 2 trial. Lancet Oncol. 15:747–756.
2014. View Article : Google Scholar
|
|
51
|
Zhan Y, Chen Y, Liu R, Zhang H and Zhang
Y: Potentiation of paclitaxel activity by curcumin in human breast
cancer cell by modulating apoptosis and inhibiting EGFR signaling.
Arch Pharm Res. 37:1086–1095. 2014. View Article : Google Scholar
|
|
52
|
Chou TC: Theoretical basis, experimental
design, and computerized simulation of synergism and antagonism in
drug combination studies. Pharmacol Rev. 58:621–681. 2006.
View Article : Google Scholar
|
|
53
|
Ashton JC: Drug combination studies and
their synergy quantification using the Chou-Talalay method--letter.
Cancer Res. 75:24002015. View Article : Google Scholar
|
|
54
|
Livak KJ and Schmittgen TD: Analysis of
relative gene expression data using real-time quantitative PCR and
the 2(-Delta Delta C(T)) method. Methods. 25:402–408. 2001.
View Article : Google Scholar
|
|
55
|
Kim D, Pertea G, Trapnell C, Pimentel H,
Kelley R and Salzberg SL: TopHat2: Accurate alignment of
transcriptomes in the presence of insertions, deletions and gene
fusions. Genome Biol. 14:R362013. View Article : Google Scholar :
|
|
56
|
Trapnell C, Roberts A, Goff L, Pertea G,
Kim D, Kelley DR, Pimentel H, Salzberg SL, Rinn JL and Pachter L:
Differential gene and transcript expression analysis of RNA-seq
experiments with TopHat and cufflinks. Nat Protoc. 7:562–578. 2012.
View Article : Google Scholar :
|
|
57
|
Trapnell C, Hendrickson DG, Sauvageau M,
Goff L, Rinn JL and Pachter L: Differential analysis of gene
regulation at transcript resolution with RNA-seq. Nat Biotechnol.
31:46–53. 2013. View Article : Google Scholar
|
|
58
|
Feng G, Du P, Krett NL, Tessel M, Rosen S,
Kibbe WA and Lin SM: A collection of bioconductor methods to
visualize gene-list annotations. BMC Res Notes. 3:102010.
View Article : Google Scholar :
|
|
59
|
Kovacs JJ, Murphy PJ, Gaillard S, Zhao X,
Wu JT, Nicchitta CV, Yoshida M, Toft DO, Pratt WB and Yao TP: HDAC6
regulates Hsp90 acetylation and chaperone-dependent activation of
glucocorticoid receptor. Mol Cell. 18:601–607. 2005. View Article : Google Scholar
|
|
60
|
Chen D, Sun Y, Wei Y, Zhang P, Rezaeian
AH, Teruya-Feldstein J, Gupta S, Liang H, Lin HK, Hung MC and Ma L:
LIFR is a breast cancer metastasis suppressor upstream of the
Hippo-YAP pathway and a prognostic marker. Nat Med. 18:1511–1517.
2012. View Article : Google Scholar :
|
|
61
|
Wyckoff JB, Pinner SE, Gschmeissner S,
Condeelis JS and Sahai E: ROCK- and myosin-dependent matrix
deformation enables protease-independent tumor-cell invasion in
vivo. Curr Biol. 16:1515–1523. 2006. View Article : Google Scholar
|
|
62
|
Garmpis N, Damaskos C, Garmpi A,
Kalampokas E, Kalampokas T, Spartalis E, Daskalopoulou A, Valsami
S, Kontos M, Nonni A, et al: Histone deacetylases as new
therapeutic targets in triple-negative breast cancer: Progress and
promises. Cancer Genomics Proteomics. 14:299–313. 2017.
|
|
63
|
Park Y, Lee KS, Park SY, Kim JH, Kang EY,
Kim SW, Eom KY, Kim JS and Kim IA: Potential prognostic value of
histone deacetylase 6 and acetylated heat-shock protein 90 in
early-stage breast cancer. J Breast Cancer. 18:249–255. 2015.
View Article : Google Scholar :
|
|
64
|
Kekatpure VD, Dannenberg AJ and
Subbaramaiah K: HDAC6 modulates Hsp90 chaperone activity and
regulates activation of aryl hydrocarbon receptor signaling. J Biol
Chem. 284:7436–7445. 2009. View Article : Google Scholar :
|
|
65
|
Li D, Marchenko ND and Moll UM: SAHA shows
preferential cytotoxicity in mutant p53 cancer cells by
destabilizing mutant p53 through inhibition of the HDAC6-Hsp90
chaperone axis. Cell Death Differ. 18:1904–1913. 2011. View Article : Google Scholar :
|
|
66
|
Dietz KC and Casaccia P: HDAC inhibitors
and neurodegeneration: At the edge between protection and damage.
Pharmacol Res. 62:11–17. 2010. View Article : Google Scholar :
|
|
67
|
Dokmanovic M, Clarke C and Marks PA:
Histone deacetylase inhibitors: Overview and perspectives. Mol
Cancer Res. 5:981–989. 2007. View Article : Google Scholar
|
|
68
|
Marks PA, Richon VM and Rifkind RA:
Histone deacetylase inhibitors: Inducers of differentiation or
apoptosis of transformed cells. J Natl Cancer Inst. 92:1210–1216.
2000. View Article : Google Scholar
|
|
69
|
Kushner MH, Ory V, Graham GT, Sharif GM,
Kietzman WB, Thevissen S, Yuan M, Schmidt MO, Wellstein A and
Riegel AT: Loss of ANCO1 repression at AIB1/YAP targets drives
breast cancer progression. EMBO Rep. 21:e487412020. View Article : Google Scholar
|
|
70
|
Wang L, Wang C, Tao Z, Zhao L, Zhu Z, Wu
W, He Y, Chen H, Zheng B, Huang X, et al: Curcumin derivative WZ35
inhibits tumor cell growth via ROS-YAP-JNK signaling pathway in
breast cancer. J Exp Clin Cancer Res. 38:4602019. View Article : Google Scholar :
|
|
71
|
Chen W, Bai Y, Patel C and Geng F:
Autophagy promotes triple negative breast cancer metastasis via YAP
nuclear localization. Biochem Biophys Res Commun. 520:263–268.
2019. View Article : Google Scholar
|
|
72
|
Wang X, Su L and Ou Q: Yes-associated
protein promotes tumour development in luminal epithelial derived
breast cancer. Eur J Cancer. 48:1227–1234. 2012. View Article : Google Scholar
|
|
73
|
Overholtzer M, Zhang J, Smolen GA, Muir B,
Li W, Sgroi DC, Deng CX, Brugge JS and Haber DA: Transforming
properties of YAP, a candidate oncogene on the chromosome 11q22
amplicon. Proc Natl Acad Sci USA. 103:12405–12410. 2006. View Article : Google Scholar
|
|
74
|
Liu X, Li H, Rajurkar M, Li Q, Cotton JL,
Ou J, Zhu LJ, Goel HL, Mercurio AM, Park JS, et al: Tead and AP1
coordinate transcription and motility. Cell Rep. 14:1169–1180.
2016. View Article : Google Scholar :
|
|
75
|
Gaggioli C, Hooper S, Hidalgo-Carcedo C,
Grosse R, Marshall JF, Harrington K and Sahai E: Fibroblast-led
collective invasion of carcinoma cells with differing roles for
RhoGTPases in leading and following cells. Nat Cell Biol.
9:1392–1400. 2007. View Article : Google Scholar
|
|
76
|
Schlienger S, Campbell S and Claing A:
ARF1 regulates the Rho/MLC pathway to control EGF-dependent breast
cancer cell invasion. Mol Biol Cell. 25:17–29. 2014. View Article : Google Scholar :
|
|
77
|
Zanconato F, Forcato M, Battilana G,
Azzolin L, Quaranta E, Bodega B, Rosato A, Bicciato S, Cordenonsi M
and Piccolo S: Genome-wide association between YAP/TAZ/TEAD and
AP-1 at enhancers drives oncogenic growth. Nat Cell Biol.
17:1218–1227. 2015. View Article : Google Scholar :
|
|
78
|
Lamar JM, Stern P, Liu H, Schindler JW,
Jiang ZG and Hynes RO: The Hippo pathway target, YAP, promotes
metastasis through its TEAD-interaction domain. Proc Natl Acad Sci
USA. 109:E2441–E2450. 2012. View Article : Google Scholar
|
|
79
|
Delve E, Co V, Regmi SC, Parreno J,
Schmidt TA and Kandel RA: YAP/TAZ regulates the expression of
proteoglycan 4 and tenascin C in superficial-zone chondrocytes. Eur
Cell Mater. 39:48–64. 2020. View Article : Google Scholar
|
|
80
|
Faião-Flores F, Emmons MF, Durante MA,
Kinose F, Saha B, Fang B, Koomen JM, Chellappan SP, Maria-Engler
SS, Rix U, et al: HDAC inhibition enhances the in vivo efficacy of
MEK inhibitor therapy in uveal melanoma. Clin Cancer Res.
25:5686–5701. 2019. View Article : Google Scholar :
|
|
81
|
Han H, Yang B, Nakaoka HJ, Yang J, Zhao Y,
Le Nguyen K, Bishara AT, Mandalia TK and Wang W: Hippo signaling
dysfunction induces cancer cell addiction to YAP. Oncogene.
37:6414–6424. 2018. View Article : Google Scholar :
|
|
82
|
Liu Y, Xing H, Jiang X, Chen Y, Huang M
and Yu S: Network pharmacology-based preventive effect of XZF on
cutaneous toxicities induced by EGFR inhibitor. Biomed
Pharmacother. 123:1097552020. View Article : Google Scholar
|
|
83
|
Wang X, Li XD, Fu Z, Zhou Y, Huang X and
Jiang X: Long noncoding RNA LINC00473/miR1955p promotes glioma
progression via YAP1TEAD1Hippo signaling. Int J Oncol. 56:508–521.
2020.
|
|
84
|
Zucchini C, Manara MC, Cristalli C,
Carrabotta M, Greco S, Pinca RS, Ferrari C, Landuzzi L, Pasello M,
Lollini PL, et al: ROCK2 deprivation leads to the inhibition of
tumor growth and metastatic potential in osteosarcoma cells through
the modulation of YAP activity. J Exp Clin Cancer Res. 38:5032019.
View Article : Google Scholar :
|
|
85
|
Renda I, Bianchi S, Vezzosi V, Nori J,
Vanzi E, Tavella K and Susini T: Expression of FGD3 gene as
prognostic factor in young breast cancer patients. Sci Rep.
9:152042019. View Article : Google Scholar :
|
|
86
|
Shuai Y, Ma Z, Liu W, Yu T, Yan C, Jiang
H, Tian S, Xu T and Shu Y: TEAD4 modulated LncRNA MNX1-AS1
contributes to gastric cancer progression partly through
suppressing BTG2 and activating BCL2. Mol Cancer. 19:62020.
View Article : Google Scholar :
|
|
87
|
Wang J, Zou Y, Wu X, Chen M, Zhang S, Lu X
and Wang Q: DACH1 inhibits glioma invasion and tumor growth via the
Wnt/catenin pathway. Onco Targets Ther. 11:5853–5863. 2018.
View Article : Google Scholar :
|