Introduction
Pediatric solid brain tumors are the most common
central nervous system neoplasia in children and the second most
common in individuals <20 years old (1). Glioblastoma multiforme (GBM), or grade
IV astrocytoma, is the most common and lethal adult malignant brain
tumor, whereas it only occurs in 8–12% of the pediatric population
(2). Nevertheless, glioblastoma in
both populations is characterized by an aggressive medical
behavior, as well as high mortality and morbidity rates, with an
incidence of 3.19 cases per 100,000 individuals and a 5-year
survival rate of 5% (3,4). GBM has a high diversity in terms of
morphology, localization and genetic alterations; therefore, GBM
has been poorly characterized, which makes glioblastoma difficult
to diagnose (4). Understanding
glioblastoma heterogeneity should be a priority for developing
improved therapies and searching for novel biomarkers (5).
Mitochondria, which are the ‘power houses’ of the
cell, are abundant in the brain. Biogenesis, mitophagy, migration
and morphogenesis are crucial in brain development and synaptic
pruning (6,7). Therefore, mitochondria can affect the
susceptibility of the brain to injury, and they serve a role in
innate immunity, in inflammation in response to infection and acute
damage, and in antiviral and antibacterial defense (6,8). As
mitochondria serve critical roles in numerous bioenergetic,
anabolic and cell biochemical pathways (9,10),
their genetic and metabolic alterations have been suggested to be a
pathogenic cause of, or contributing factor to, a broad range of
human diseases, including cancer (11,12).
Several common tumor cell features can result from mitochondrial
dysregulation, because, the biology of mitochondria supports cell
transformation during carcinogenesis (11,13,14),
which suggests that the mitochondrial proteome is versatile and can
sense the spatial and temporal dynamics of cell biological
processes from the onset to the end of cancer. However, the
specific role of mitochondria in cancer has not been completely
uncovered, mainly due to the large amount of information regarding
mitochondrial processes in cancer not having been properly
integrated.
Proteomic analysis can be applied in GBM research
for early detection, for making a reliable diagnosis and for
performing an accurate risk assessment. However, Petrak et
al (15), Deighton et al
(16) and Valledor and Jorrín
(17) agree that, despite the
utility of proteomic research to obtain insights into
cancer-associated biological processes and the knowledge of
neuro-oncology, the glioblastoma proteomic studies performed to
date have focused on how proteins are up- or downregulated, and
these results have been generated without any specific approach to
establish the existence of key proteins and/or specific signaling
pathways in cancer development or regulation. To the best of our
knowledge, most of the generated data lack reproducibility,
validity and comparability, mainly due to methodological and
analytical constraints. The identified proteins in these studies
are diverse and make it hard to understand the nature of the
disease or its background.
Mitochondria compose a biological system that
interacts in, with or between other living systems, and that
maintains physiological associations with other subsystems in
cells, such as organelles, genes and proteins. In a complex
disease, the mitochondrion and its environment are altered
(14). Therefore, systemic
questions in the context of cancer are: How do the mitochondria
interact with other components and their environment? Additionally,
what are the roles of the mitochondria within the cell? (18) In this regard, analyzing protein
abundance data according to fold-change, univariate statistics
(such as Student's t-test or ANOVA) or analog nonparametric tests
do not answer these questions due to their nature; on the other
hand, multivariate statistical analysis involves >2 variables in
≥2 conditions simultaneously for any possible association or
empirical relationship, so the description of the interactions
between cellular components can be improved.
Proteomic data enclose information about the whole
cellular system, bringing an improved description through
multivariate statistical approaches. Additionally, principal
component analysis (PCA) applied to GBM mitochondrial proteomic
data could reveal that mitochondria metabolism acts as a cellular
sensor of specific isolated cancer states, which could result in
reliable and useful information to help improve diagnosis and risk
assessment, as well as to understand the role of mitochondria in
GBM.
In the present study, a proteomic functional
analysis based on PCA of liquid chromatography coupled to tandem
mass spectrometry (LC-MS/MS) and 2D isoelectric focusing
(IEF)/SDS-PAGE intensity data was conducted. A specific
mitochondrial proteomic landscape was obtained from the
glioblastoma T98G and U87MG cell lines associated with biological
processes that characterize ‘oxidative’ and ‘glycolytic’ types of
tumor. Additionally, the present cell model resembles the metabolic
transition from mitochondrial oxidative phosphorylation (OXPHOS) to
glycolysis (a process known as the Warburg effect), as reported
during tumorigenesis (19).
Finally, protein-protein interaction networks (PPIns) and Gene
Ontology (GO) overrepresentation based on PCA revealed that
LC-MS/MS and 2D IEF/SDS-PAGE analysis were comparable and
complementary with each other, indicating that mitochondria may act
as key sensing organelles for GBM tumor characterization and serve
as valuable tools for therapeutic targets.
Materials and methods
Cell culture
The T98G (CRL-1690™) and U87MG (glioblastoma of
unknown origin; HTB-14™) cell lines were purchased from the
American Type Culture Collection and cultured in 175-cm2
plastic flasks at 37°C with 5% CO2 in Eagle's Minimum
Essential Medium (In Vitro S. A.) supplemented with 10% fetal
bovine serum (Gibco; Thermo Fisher Scientific, Inc). Cells were
grown to 80–90% confluence, harvested with trypsin, washed twice in
PBS and used for mitochondrial isolation.
Mitochondrial isolation
Mitochondria were isolated by differential
centrifugation. Cells were separately disrupted in 250 mM sucrose,
1 mM EGTA and 10 mM HEPES (pH 7.4) at 4°C and centrifuged for 10
min at 1,500 × g and 4°C to recover the supernatant. This step was
repeated three times. Subsequently, all of the supernatants were
pooled and centrifuged for 10 min at 12,000 × g and 4°C to obtain a
mitochondrial pellet. The pellets were used immediately or kept at
−80°C until use.
LC-MS/MS
Mitochondrial proteome extraction
A total of six mitochondrial pellets (3 biological
replicates each from T98G and U87MG cells) from the same passages
were lysed, incubated and sonicated at 4°C (5 cycles of 20 pulses)
in lysis buffer (4% SDS, 0.1 M DTT and 0.1 M Tris pH 8.6). To
reduce disulfide bridges, samples were incubated at 40°C for 30
min, and cysteine residues were alkylated with 100 mM iodoacetamide
for 30 min in the dark. The protein content was estimated by 1D
SDS-PAGE scanned in a GS-800 densitometer (Bio-Rad Laboratories,
Inc.), stained overnight at room temperature with colloidal
Coomassie brilliant blue R-250 and quantified using the Quantity
One software v4.6.9 (Bio-Rad Laboratories, Inc.).
Peptide separation and spectrometry
The peptide mixture was subjected to reverse phase
chromatography on a Dionex Ultimate 3,000 RSLC nano-UPLC system
(Thermo Fisher Scientific, Inc.) in-line coupled to a Q-Exactive
Plus high-resolution mass spectrometer (Thermo Fischer Scientific,
Inc.). Peptides (2 µg) resuspended were first trapped on a
precolumn (C18 PepMap 100, 5 µm, 100 A, 300 µm inner diameter × 5
mm; Thermo Fisher Scientific, Inc), then separated using an
EASY-Spray PepMap RSLC C18 capillary column (2 µm, 15 cm × 50 µm;
Thermo Fischer Scientific, Inc.) with a 250-min elution gradient at
250 nl/min. The mobile phases were: A) 2% acetonitrile and 0.1%
formic acid in water; and B) 90:10 (v:v) acetonitrile:water and
0.1% formic acid in water. The mass spectrometer was operated in
positive data-dependent acquisition mode and the full MS range was
300-1,800 m/z. A total of 10 of the most intense ions were isolated
in the quadrupole and fragmented under higher-energy collisional
dissociation with a normalized collision energy of 27%. Precursor
ions were measured at a resolution of 70,000 (at 200 m/z) and the
fragments were measured at 17,500. Only ions with charge states ≥2
were fragmented with an isolation window of 2 m/z.
Protein identification and quantification
Protein identification and label-free quantification
were performed using MaxQuant v1.6.2.3 (20). The parameters included trypsin/P as
the digestion enzyme, carbamidomethyl-cysteine as a fixed
modification, and N-terminal protein acetylation and methionine
oxidation as variable modifications. Proteins were identified with
a 1% false discovery rate (FDR) based on the target-decoy strategy
provided by MaxQuant, setting Arg-C as the digestion enzyme and
carbamidomethylcysteine as a fixed modification. Proteins were
identified with an FDR of 1% based on the target-decoy strategy
provided by MaxQuant. Protein identification was performed
according to the human reference proteome UP000005640 from the
UniProt repository downloaded on August 03, 2018 (https://www.uniprot.org/proteomes/UP000005640).
Label-free quantification was performed using proteins with ≥2
razor-unique peptides identified by LC-MS/MS.
Multivariate analysis of protein intensities
Statistical analysis of protein abundances was
performed only with proteins with ≥2 intensity values in each cell.
The protein abundance was normalized between conditions and missing
values were imputed with the Random Forest method (missForest v.4;
R package v3.5) (21). PCA was
carried out on the protein intensity correlation matrix (FactoMiner
v2.3; R package v3.5) (22) to
generate a protein abundance pattern for the cell lines (15). To determine whether any component
could distinguish between the cell lines, the sample scores for
each component were plotted. After finding the component, the
significant proteins with discriminatory capacity in that component
were identified using the cos2 of the correlation matrix
between the components and the proteins (23).
To evaluate the PCA performance on LC-MS/MS data, a
t-test (significance level, 0.05) and a fold-change analysis were
conducted to compare the abundance spots of proteins between cell
lines.
2D SDS-PAGE
Mitochondrial proteome extraction
T98G and U87MG mitochondrial-associated proteins
were obtained according to Hurkman's protocol (24), which was modified as follows: Six
mitochondrial pellets (three biological replicates each from T98G
and U87MG cells) from the same passage were resuspended in 500 µl
extraction buffer (0.7 M sucrose, 0.5 M Tris-Base, 0.1 M KCI, 0.03
M HCI, 0.05 M EDTA and 2% β-mercaptoethanol) and 500 µl saturated
phenol, and incubated for 20 min at −20°C. Subsequently,
mitochondrial samples were centrifuged for 10 min at 400 × g and
4°C, and the phenolic phase was recovered after the addition of 0.1
M ammonium acetate for 12–15 h at −20°C. Subsequently,
mitochondrial samples were washed twice with 0.1 M ammonium acetate
and centrifuged for 10 min at 4,000 × g and 4°C. Pellets with
mitochondrial proteins were washed with 1 ml 80% acetone and
centrifuged for 10 min at 4,000 × g and 4°C. The supernatants were
discarded, and the pellets were resuspended in IEF buffer (7 M
urea, 2 M thiourea, 0.06 M DTT, 2% ampholytes at pH 3–10 and 4%
CHAPS) and centrifuged for 30 min at 8,000 × g and 4°C. The
obtained supernatants were recovered and frozen at −80°C until use
in 2D electrophoresis (2DE).
2-DE gels
IEF was performed in acrylamide gel tubes as
previously described (25).
Briefly, gel tubes were pre-focused (2500 V; 110 mA; 1 h and 250/h
per gel) before IEF (22 h at 125 V). Each gel (three for T98G and
three for U87MG cells) was loaded with 500 µg protein, which was
quantified via the Bradford method. Electrofocused gels were used
for 12% 2D SDS-PAGE for additional spot separation. 2D gels were
fixed for 30 min and stained for 1 h with colloidal Coomassie
brilliant blue R-250 for image acquisition; fixing and staining
processes were carried out at room temperature.
Image pre-processing
The gels were scanned in a GS-800 densitometer
(Bio-Rad Laboratories, Inc.), and six images were acquired, wrapped
and overlapped with PdQuest v8.0.1 software (Bio-Rad Laboratories,
Inc.). Subsequently, with all six images combined, a master gel was
created by the default PdQuest algorithm from the intensity sum of
all of the spots in the gel images.
Random spot selection in the master
gel
To increase the protein representativeness of the
cellular processes carried out in the T98G and U87MG cell lines,
400 spots (of the 1,274 detected by PdQuest) were randomly selected
from the master gel regardless of their size, intensity or
abundance differences between cell lines. This process ensures that
every spot in the master gel had an equal chance of being selected
and allowed to obtain a representative mitochondrial proteome
sample (26,27). The generated spot sample was
rematched in all gel images to allow for a more reliable abundance
analysis (17).
Multivariate analysis of spot
intensities
To select the spots to be identified, a spreadsheet
with the normalized intensity of the 400 spots sampled was exported
from PdQuest. The abundance of the spots was logarithmically
transformed, and missing values were imputed with the Random Forest
method (missForest; R package) (21) to perform multivariate analysis.
Abundance analysis was performed using PCA of the
spot intensity correlation matrix (FactoMineR; R package) (22) to generate a spot abundance pattern
for the cell line gels (17). To
understand whether any component could distinguish between the cell
lines, the gel scores for each component were plotted.
Subsequently, significant spots were identified using the
cos2 of the correlation matrix between the components
and the spots with discriminatory capacity (23).
To evaluate the PCA performance on 2DE-MALDI-TOF
data, a t-test (significance level, 0.05) and a fold-change
analysis were conducted to compare the abundance spots of proteins
between cell lines.
Mass spectrometry
Each selected spot was cut from the gel, alkylated,
reduced, digested and automatically transferred to a
matrix-assisted laser desorption/ionization (MALDI) analysis target
via a Proteineer SPII and SP robot using the SP control v3.1.48.0
software (Bruker Corporation) with the aid of a DP Chemicals 96 gel
digestion kit (Bruker Corporation) and processed in a MALDI-time of
flight (TOF) Autoflex spectrometer (Bruker Corporation) to obtain
the peptide mass fingerprints. A total of 100 satisfactory shots in
20 short steps were performed, the peak resolution threshold was
set at 1,500, the signal/noise ratio of tolerance was 6 and
contaminants were not excluded. The spectrum was annotated using
flexAnalysis 1.2 vSD1 Patch 2 (Bruker Corporation). The search
engine MASCOT (28) was used to
compare the fingerprints against the SwissProt (29) 2016 release database with the
following parameters: Taxon-Human, mass tolerance of ≤200 ppm, one
missed cleavage allowed, and fixed modification of carbamidomethyl
and oxidation of methionine as the variable modifications.
PPIn construction
A PPIn network for T98G and another for U87MG cell
lines were built with overexpressed and specific proteins obtained
from the LC-MS/MS abundance data employing the GeneMANIA
application v3.4.1 (30) in
Cytoscape v3.3 (31). The networks
were constructed only using the experimental evidence of physical
interactions between proteins without added nodes. Subsequently, to
compare the consistency between the PCA results from the LC-MS/MS
and the 2DE data, overexpressed and specific proteins obtained from
2DE were localized to the LC-MS/MS PPIn.
Representative biological processes
identification
To further understand the critical biochemical
processes taking place in each PPIn, only the connected proteins in
the networks were taken into account for comparative
overrepresentation analysis based on GO (32). Overrepresentation was performed
online employing the Gene List Analysis tool on the PANTHER
Classification system site (33)
(http://www.pantherdb.org/). As inputs,
the official gene symbols were uploaded as identifiers. The
overrepresented biological processes were clustered with REViGO web
tool (http://revigo.irb.hr/) (34) and R software v3.4 (35).
Western blot analysis
For OXPHOS system comparison, 20 µg of mitochondrial
extracts were separated via 12% SDS-PAGE (36) and transferred to a PVDF membrane
(37) at 100 V for 1 h (36,37).
The membrane was blocked with 5% non-fat milk in PBS-0.05% Tween-20
(PBST) for 1 h at room temperature, incubated with primary
antibodies (overnight at 4°C) purchased from Abcam against each
subunit of the OXPHOS complex, which is one of the most affected
systems: NADH dehydrogenase [uniquinone] 1α subunit 10 or complex
(CI; cat. no. ab14713; 1:2,000); subunit 70 kDa (CII; cat. no.
ab14715; 1:10,000); core 2 (CIII; cat. no. ab14745; 1:4,000);
subunit IV (CIV; cat. no. ab14744; 1:1,000) and β-subunit ATP
synthase (CV; cat. no. ab110273; 1:1,000). Next, the membrane was
washed three times with PBST, each for 10 min at room temperature,
and incubated with HRP-conjugated goat anti-mouse IgG secondary
antibody (cat. no. NB7539; Novus Biological; 1:5,000). After
membrane washing as described, the reaction bands were detected via
chemiluminescence (EMD Millipore) and read with a C-Digit Blot
Scanner (LI-COR Biosciences). To compare the densitometry values
[(pixels/cm2) ×104] between cell lines, a
Mann-Whitney test was performed for 3 independent gels for each
cell line using R software v3.4 (35). Comparisons are shown as 95%
confidence intervals of the median.
To obtain bioenergetic signatures, total protein
from the two cell lines was extracted using RIPA buffer (10 mM
Tris-Cl pH 8.0, 1 mM EDTA, 0.5 mM EGTA, 1% Triton X-100, 0.1%
sodium deoxycholate, 0.1% SDS and 140 mM NaC) and protein
concentration was determined using the Lowry method (38). As GAPDH and β-ATPase exhibited
differences in abundance, western blotting was performed using both
10 and 20 µg of total protein to avoid artefacts due to protein
quantity. Total protein was separated and transferred in the same
way as mitochondrial extracts. The membrane was blocked, incubated
and bands detected using the same protocol as for OXPHOS western
blot analysis with primary antibodies purchased from Abcam against
GAPDH (cat. no. ab8245; 1:1,000) and β-subunit ATP synthase
(1:1,000), with an anti-mouse secondary antibody used (1:5,000).
The experimental conditions, reagents, equipment and software used
are those mentioned for mitochondrial extracts.
Results
PCA of LC-MS/MS identified
proteins
The LC-MS/MS process identified 1,805 proteins, and
1,069 proteins were identified with ≥2 unique peptides and had ≥2
intensity values for each cell line (Table SI and Fig. S1). However, 161 proteins were
specific for T98G and 82 proteins for U87MG; these proteins were
considered for the overrepresentation analysis (Fig. S1). Additionally, three proteins
were eliminated during the imputation data process as they were
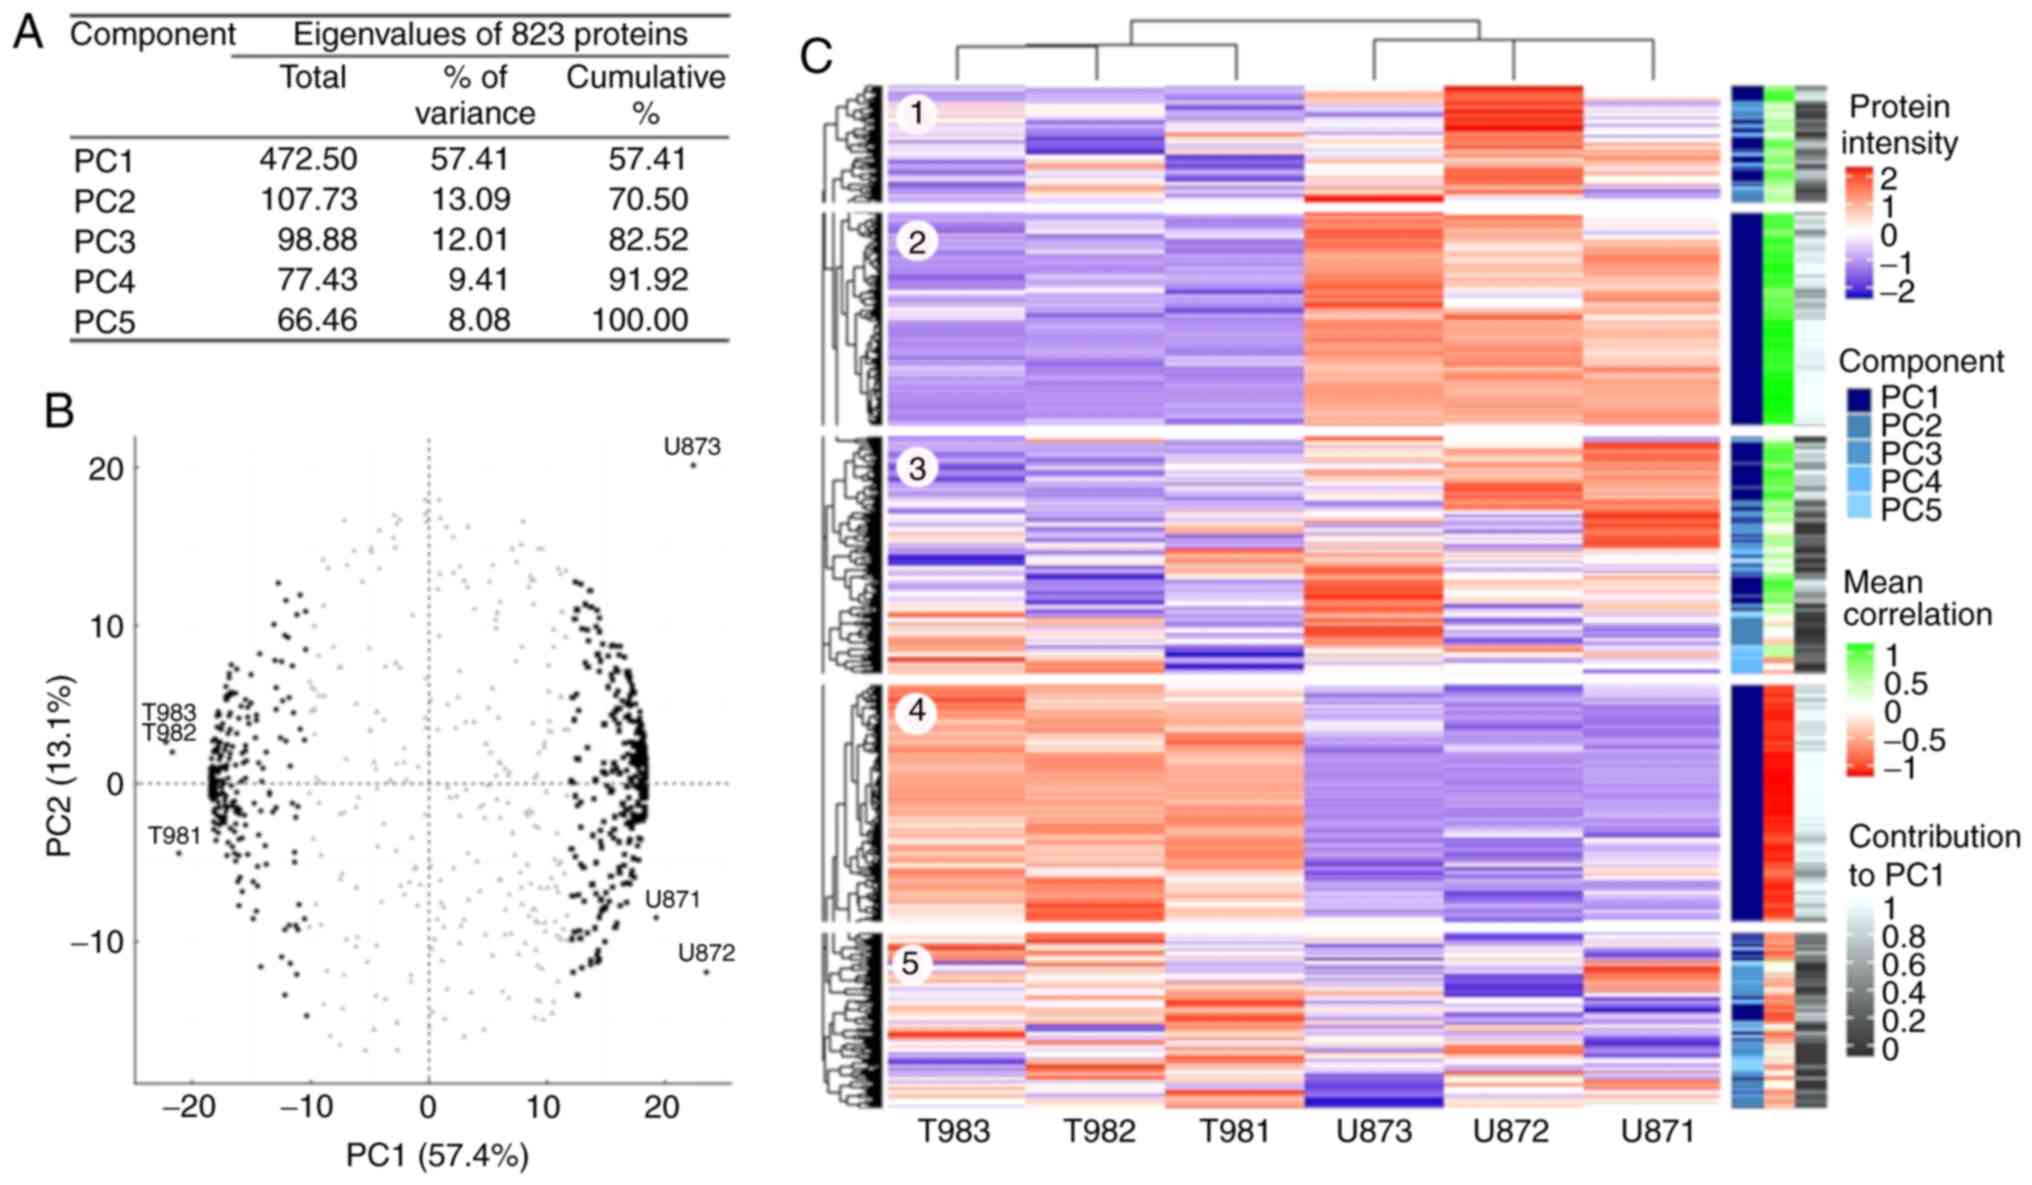
identified as outliers. PCA was performed on 823 shared proteins
(Table SII and Fig. S1). The total protein abundance
variation was explained via five principal components (PCs;
Fig. 1A). PC1 embraces 57% of the
whole abundance variability, while the other four components only
explain 43% of the remaining variability. The association of
proteins and samples with PC1 and PC2 (Fig. 1B) revealed 235 proteins (black
dots), with negative PC1 values, associated with T98G samples, and
308 proteins (black squares) with positive PC1 values, associated
with U87MG samples. These 543 proteins (dark blue on the component
scale in Fig. 1C) had a homogeneous
intensity pattern within the cell lines (blocks 2 and 4 on the
heatmap; Fig. 1C) and significant
(r<-0.5 or r>0.5) correlation values with PC1 (light red and
light green in the mean correlation scale in Fig. 1C and Table SII), and their contribution to
explain this intensity pattern was significant (white color in the
contribution scale in Fig. 1C and
Table SII). The proteins grouped
on the left had a greater abundance in T98G and a lower abundance
in U87MG (block 4 on the heatmap; Fig.
1C), and those grouped on the right were more abundant in U87MG
(block 2 on the heatmap; Fig. 1C).
The proteins in the center of the circular biplot (grey triangles;
Fig. 1B) had heterogeneous
intensity values within the cell lines (blocks 1, 3 and 5 on the
heatmap; Fig. 1C), as well as low
correlation and contribution values (Fig. 1C and Table SII).
PCA for 2DE gel spots
Overall, 400 protein spots were selected across all
gel surfaces regardless of size, intensity or difference in
abundance between the cell lines. A total of three spots did not
pass quality control, and 161 protein spots were specific for
either T98G or U87MG (Fig. S1).
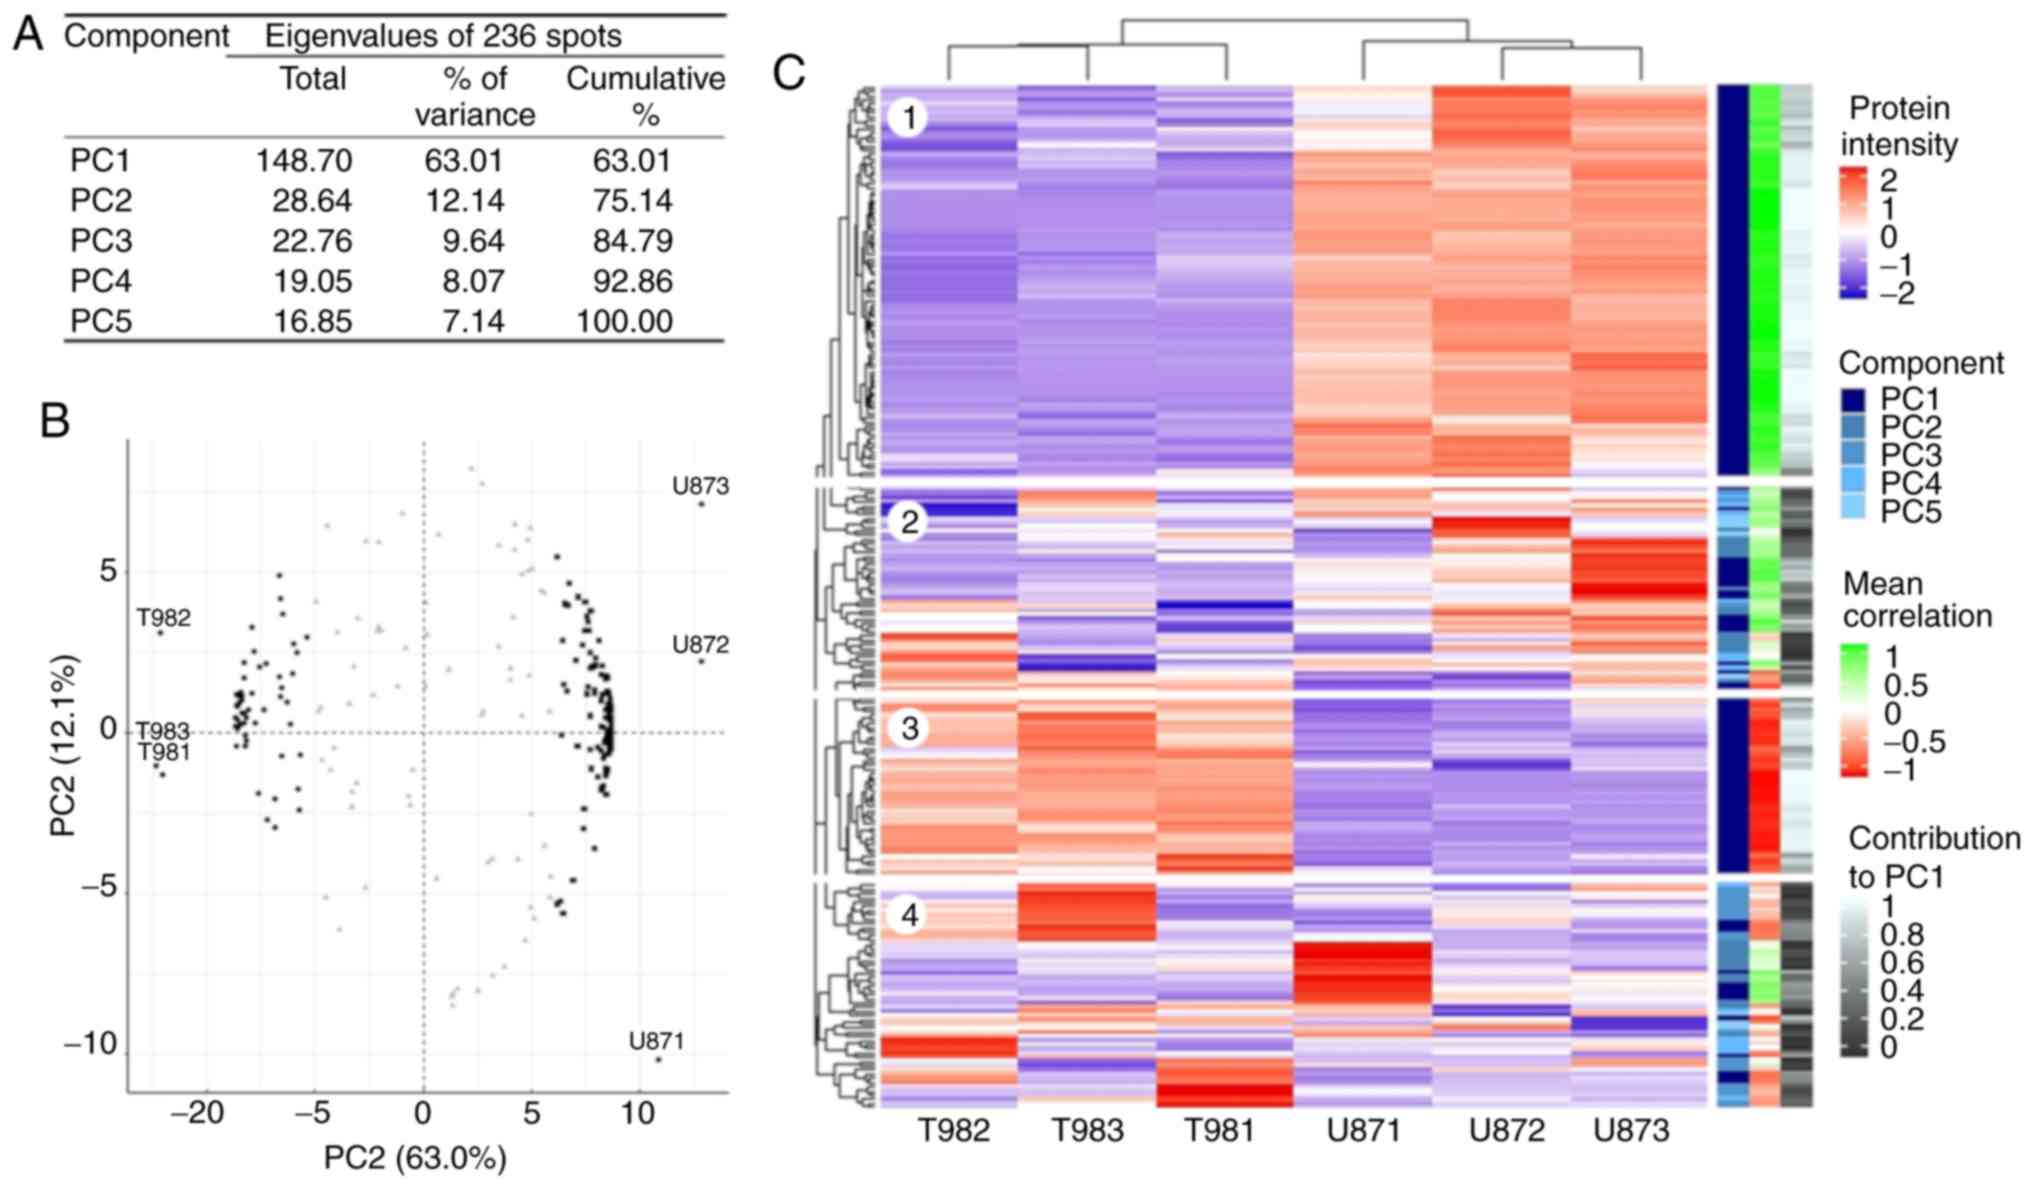
Finally, PCA was performed on 236 spots shared by both cell lines
(Table SIII and Fig. S1). The 2DE-PCA results were close
to those obtained via LC-MS/MS, as five PCs explained the gel
intensity behavior (Fig. 2A).
Similarly, to LC-MS/MS, PC1 accounted for 63% of the whole
explained variance, while the other four components only explained
37%. The circular biplot (Fig. 2B)
exhibits the same spatial arrangement between gels (proteins
visualized as spots) as for the LC-MS/MS data. A total of 165 spots
strongly correlated with PC1; 51 spots (black dots), associated
with T98G gels, had negative values, and 114 spots (black squares)
associated with U87MG gels, had positive PC1 values. Additionally,
the 2DE intensity heatmap (Fig. 2C)
replicated that obtained for LC-MS/MS. As expected, protein spots
that differed between cell lines (dark blue on the component scale)
had a homogeneous intensity within cell lines (blocks 1 and 3 on
the heatmap; Fig. 2C), with
significant correlation and contribution values (light red and
light green in the mean correlation scale, and white in the
contribution scale in Fig. 2C and
Table SIII) with PC1. Likewise,
the protein spots grouped on the left in the circular biplot
(Fig. 2B), had a larger abundance
in T98G cells and a lower abundance in U87MG cells (block 3 on the
heatmap; Fig. 2C), and those
grouped on the right were more abundant in U87MG cells (block 1 on
the heatmap; Fig. 2C).
Additionally, the spots in the center of the circular biplot (grey
triangles in Fig. 2B) had very
heterogeneous intensity values within the cell lines (blocks 2 and
4 on the heatmap; Fig. 2C), as well
as low correlation and contribution values (Fig. 2C and Table SIII). According to the present
results, these 165 spots, and 20 specific spots for T98G and 20
specific spots for U87MG cells (randomly selected) were selected
for MALDI-TOF identification.
MALDI-TOF protein identification
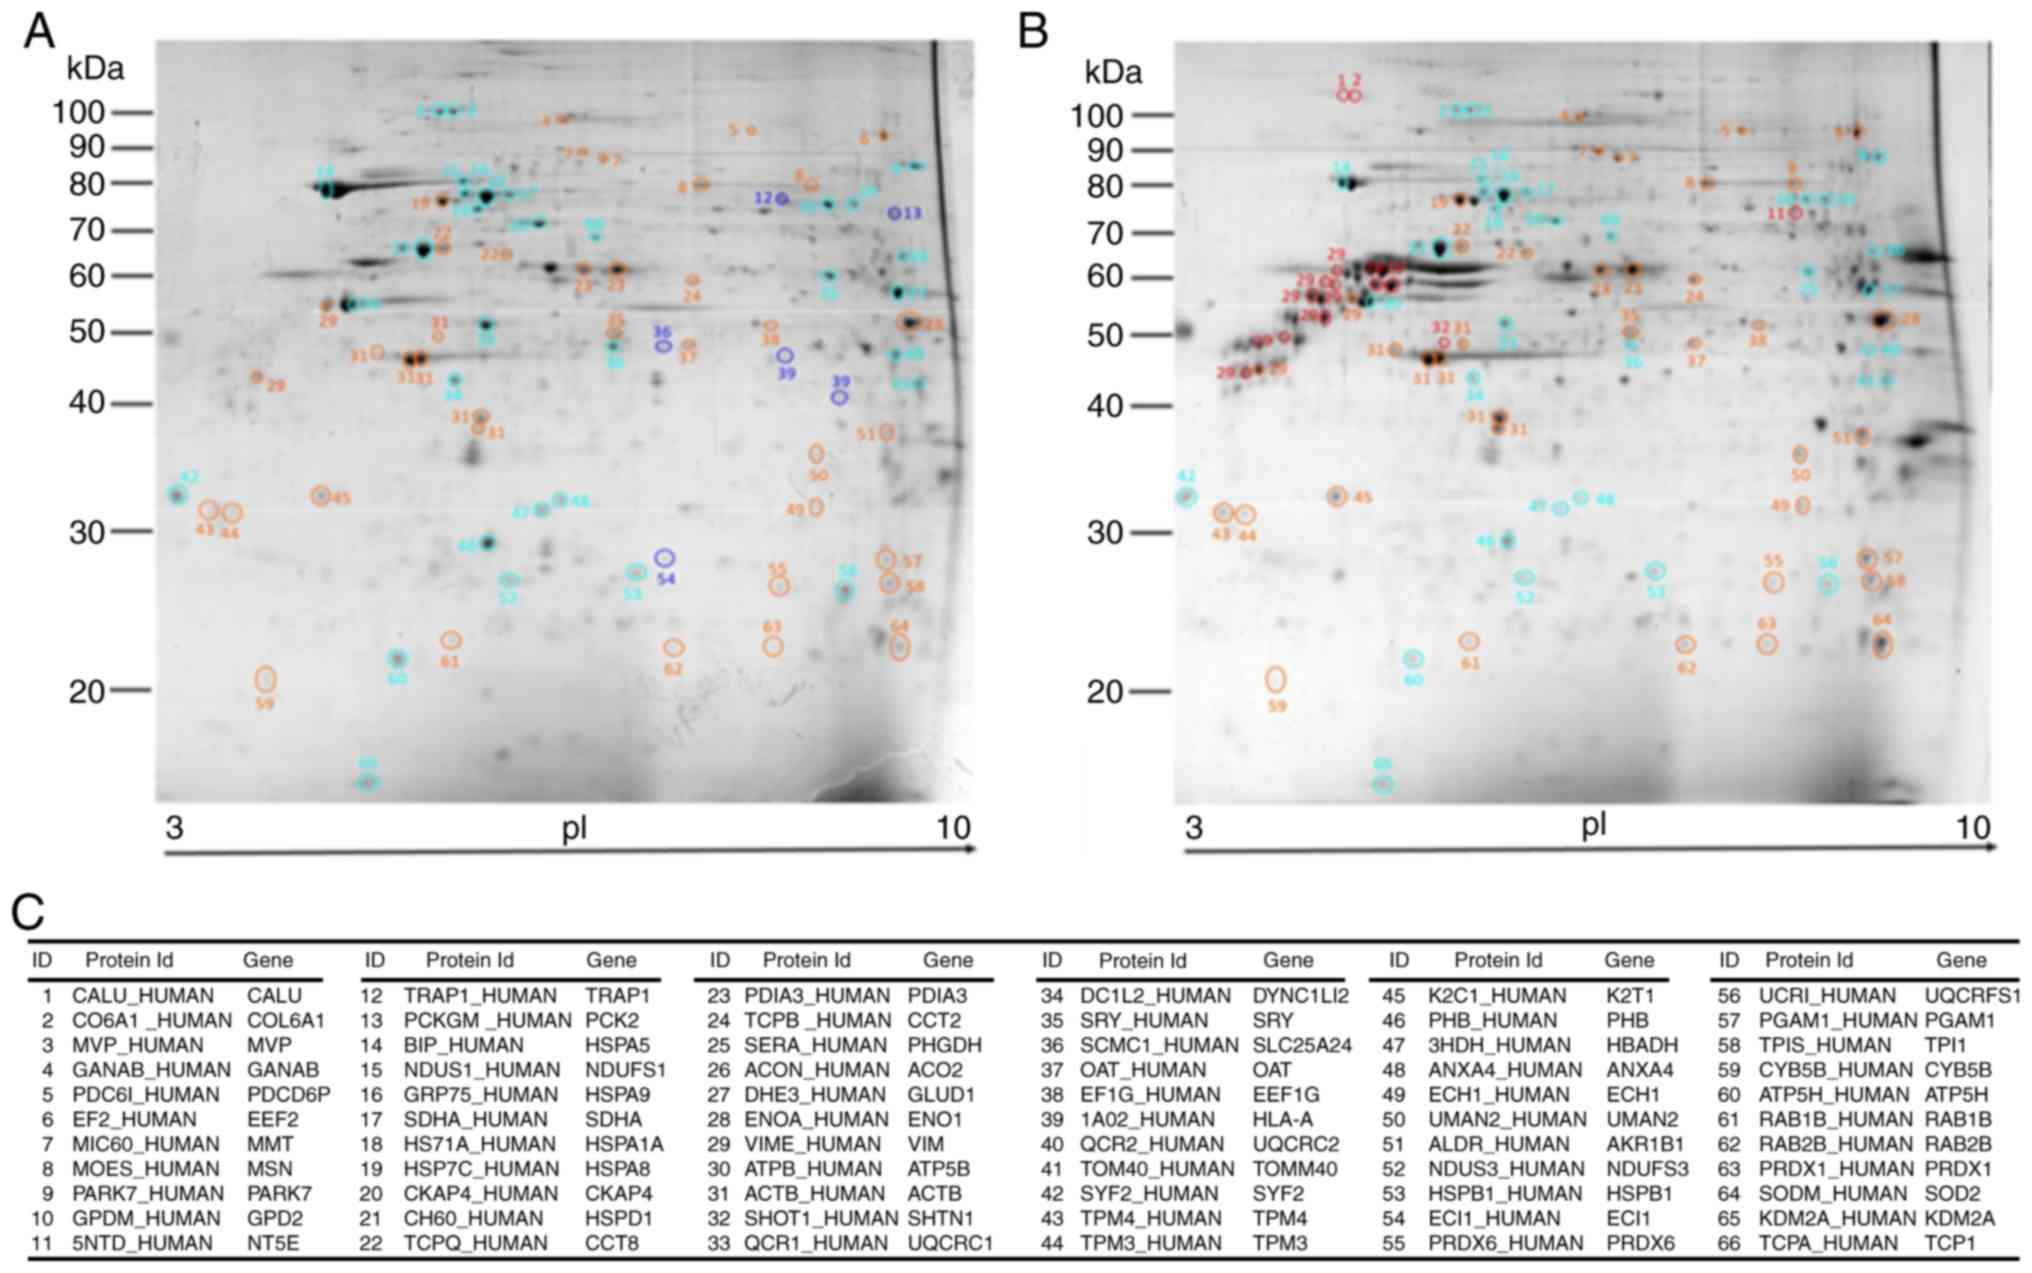
As a result of random sampling and PCA, 66 proteins
exhibited a homogeneous distribution in the T98G and U87MG gels
(Fig. 3A and B), which assured
whole mitochondrial proteins were represented. The T98G cell line
was represented by 33 proteins (4 specific and 29 upregulated), and
the U87MG cell line was represented by 33 proteins (5 specific and
28 more abundant; Fig. 3).
PPIns from T98G and U87MG cell
lines
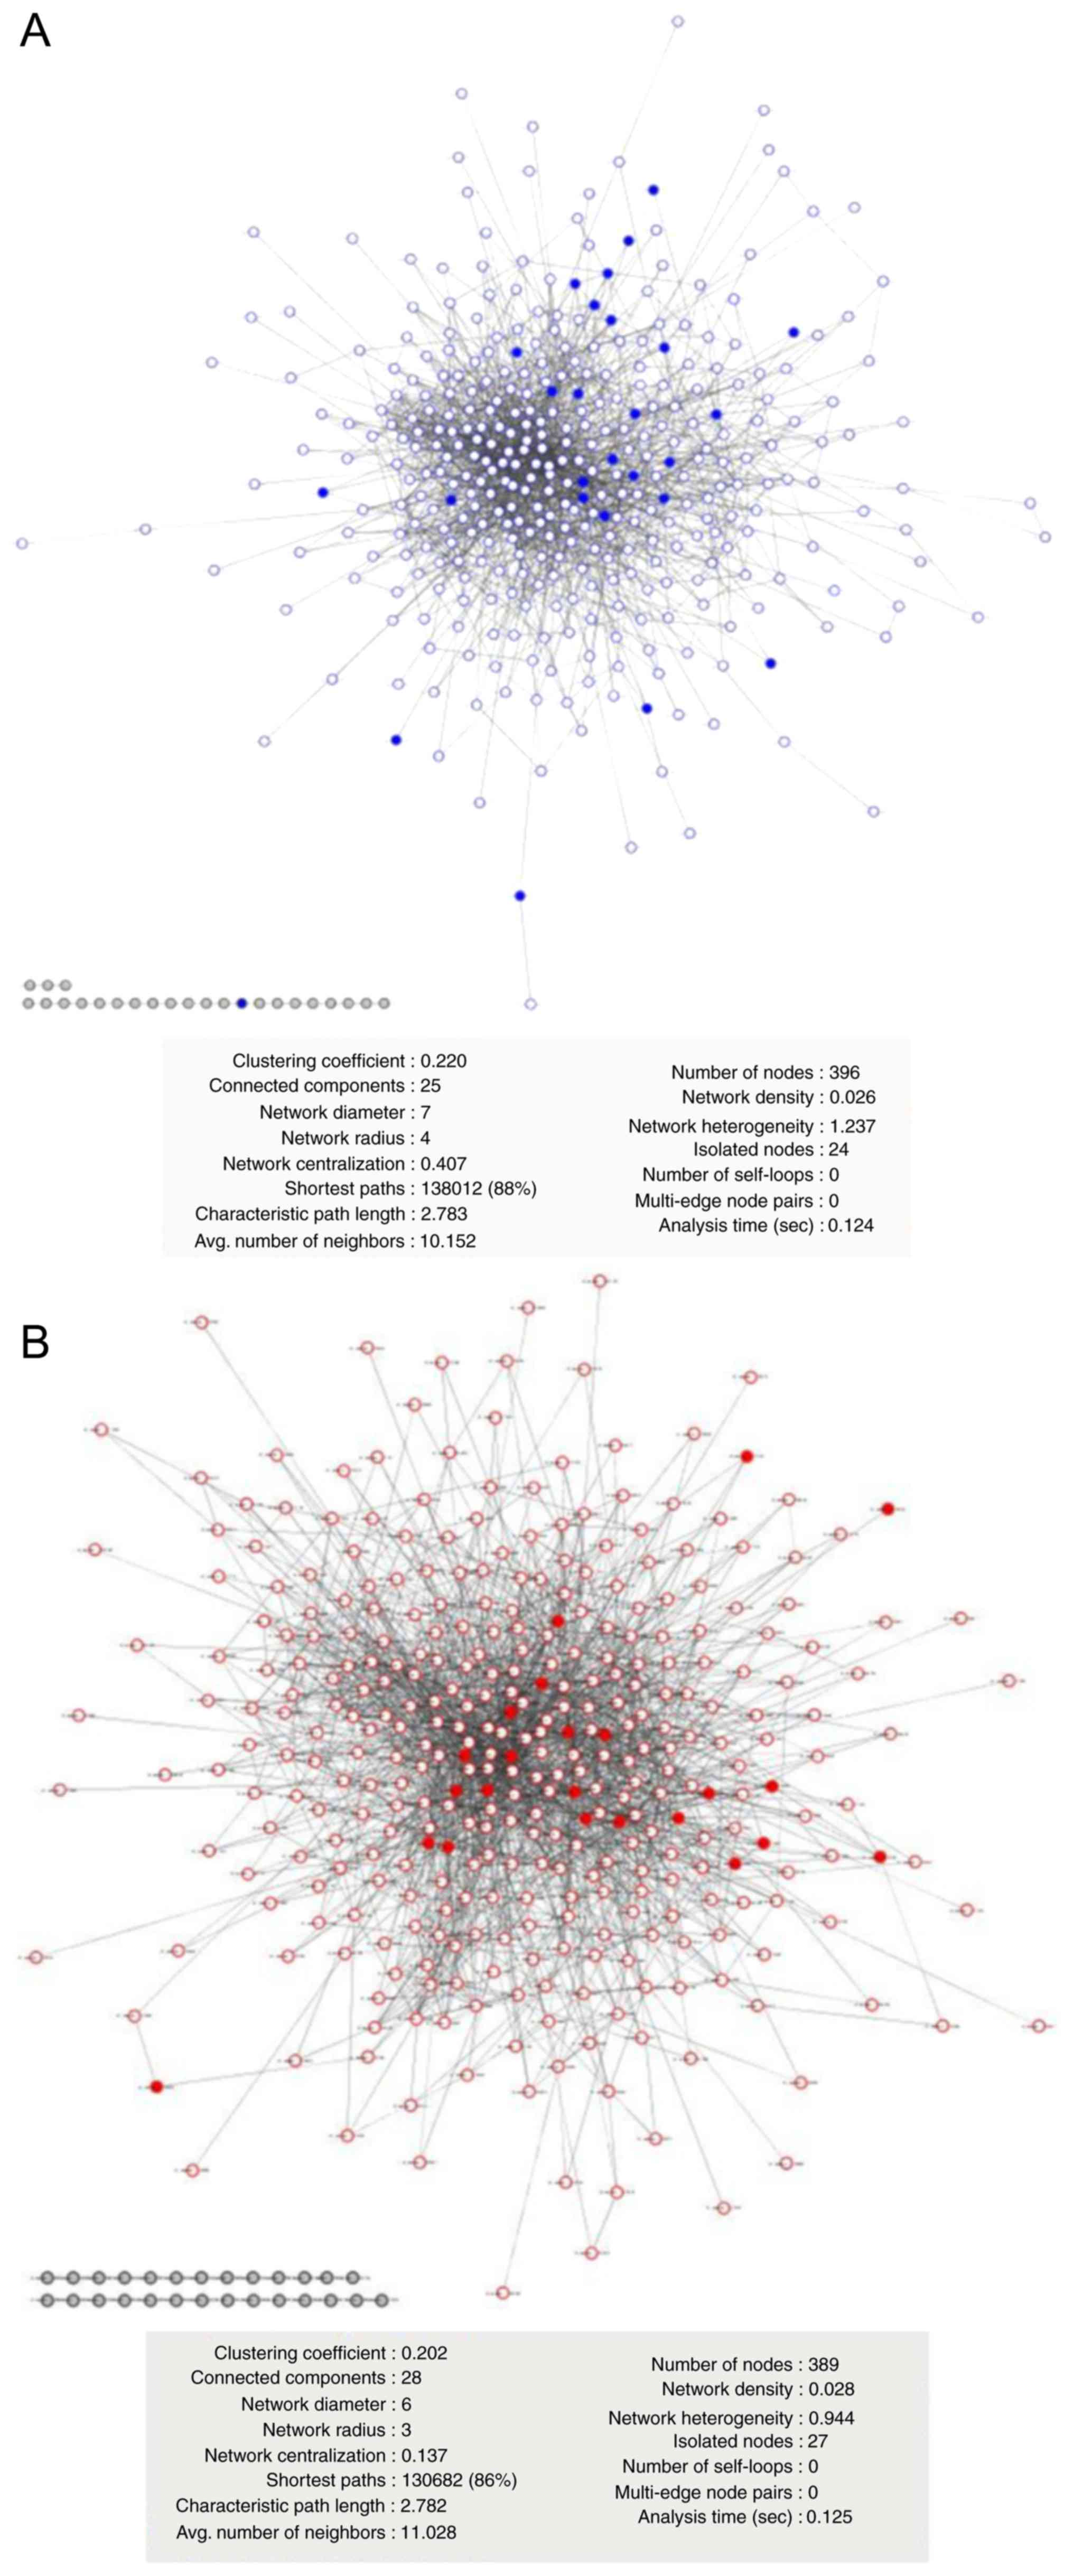
According to LC-MS/MS data analysis, a specific T98G
PPIn (Fig. 4A) was built composed
of 396 proteins (235 from PC1 and 161 specific). The U87MG PPIn
(Fig. 4B) included 389 proteins
(307 from PC1 and 82 specifics). The T98G PPIn had 24
no-interaction nodes, while U87MG had 27; their heterogeneity and
connectivity were similar (Fig. 4A and
B). For 2DE-identified proteins, 51 (77%) were found in PC1
from the LC-MS/MS data and mapped onto the T98G or U87MG LC-MS/MS
PPIn (Fig. 4). As shown in Fig. 4, 2DE proteins were distributed
throughout the T98G (solid blue dots in Fig. 4A) and U87MG (solid red dots in
Fig. 4B) LC-MS/MS networks. The
present results suggested that the proteins obtained from 2DE-PCA
from randomly selected spots were comparable with the proteins from
PCA applied to the LC-MS/MS label-free data.
Overrepresentation analysis
To determine whether 2DE-MALDI-TOF and LC-MS/MS data
were biologically comparable, GO overrepresentation analysis was
performed on the PC1 significant proteins from LC-MS/MS and 2DE.
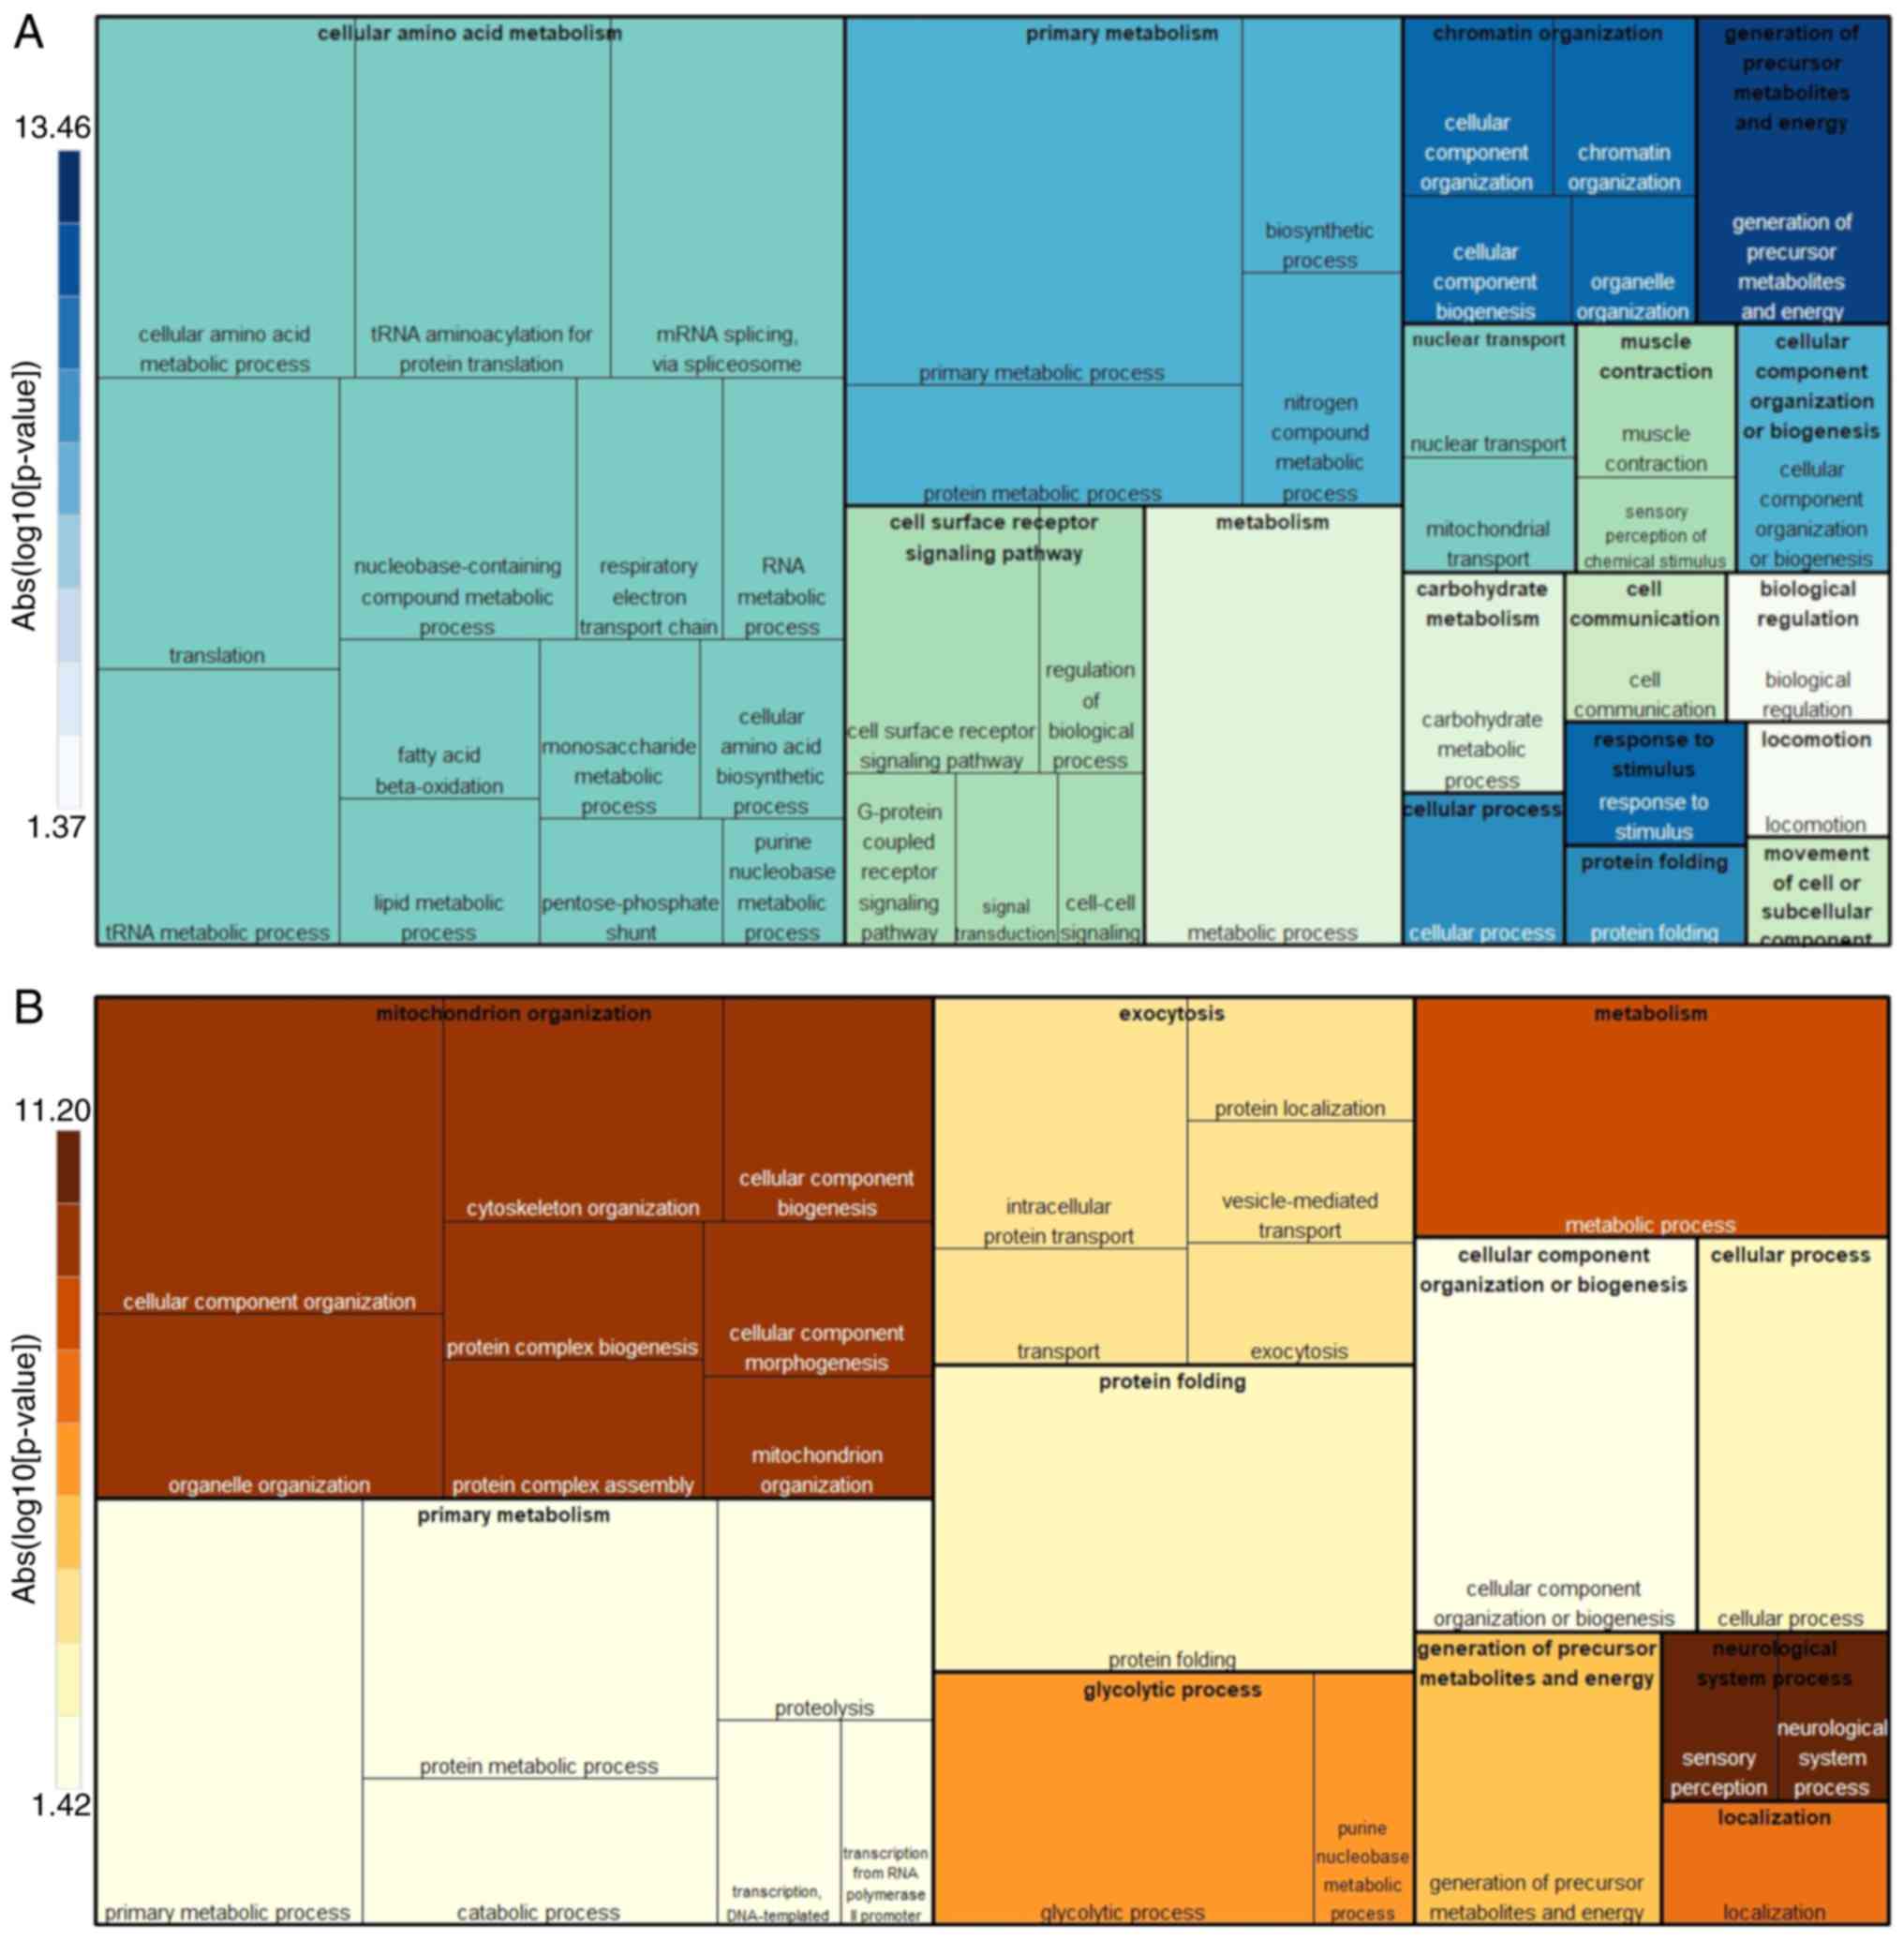
Proteins identified in T98G cells exhibited typical mitochondrial
functions (Fig. 5A): ‘Generation of
precursor metabolites and energy process’ was the main enriched
cellular process, followed by ‘primary metabolism’ and ‘cellular
amino acid metabolism’, which together involve OXPHOS (UCRI, QCR1,
QCR2, NUDS1 and NUDS3 proteins identified by MALDI-TOF),
‘β-oxidation’ (ECI1), and ‘tricarboxylic acid (TCA) cycle’ (ACON,
PCKGM, SDHA, DHE3, SERA and 3HIDH). Notably, other cellular
processes that are less reported for mitochondrial function were
also present: ‘Protein metabolic process’, ‘protein folding’ (TCPQ,
TCPB and HSP7C), ‘translation’ (EF2 and EF1G) and ‘cellular
component organization or biogenesis’ (TOMM40, UQCRC2 and NDUS1).
The minor represented biological processes included ‘cell surface
receptor signaling pathways’, ‘carbohydrate metabolism’ and
‘locomotion’. The present protein ranking provided a close picture
of the mitochondrial function in T98G cells.
On the other hand, U87MG protein classification in
cellular processes (Fig. 5B) was
different compared with the T98G results. The more notable
biological processes identified were associated with cancer. One of
the most obvious was associated with energy metabolism change,
‘glycolytic process’ (ENOA, PGAM1 and TPIS); however, this was
ranked below mitochondrial organization issues such as
‘cytoskeleton organization’ (LMAN2, DYNC1 L12, TPM3 and TPM4) and
‘cellular component morphogenesis’ (CCT2 and CCT8). Notably,
‘exocytosis’ (ACTB, RAB1B and RAB2B) was another cancer-associated
process identified in these cells, and a clear downregulation of
the T98G cellular processes was evident (such as ‘primary
metabolism’ and ‘cellular component organization or biogenesis’),
indicating good biological congruence for the present analysis.
The aforementioned cellular processes were
corroborated through protein spot identification by MALDI-TOF
(Fig. 3), as the proteins
associated with ‘glycolytic process’, ‘vesicle-mediated transport’,
‘protein translation and biomass’ (EF2 and EF1G) or molecular
chaperones (HSP7C, TCPB and TPCQ) were upregulated. The present
U87MG landscape presents mitochondria with modified cellular and
metabolic functions, suggesting that mitochondria readjust their
cellular processes according to different cancer states.
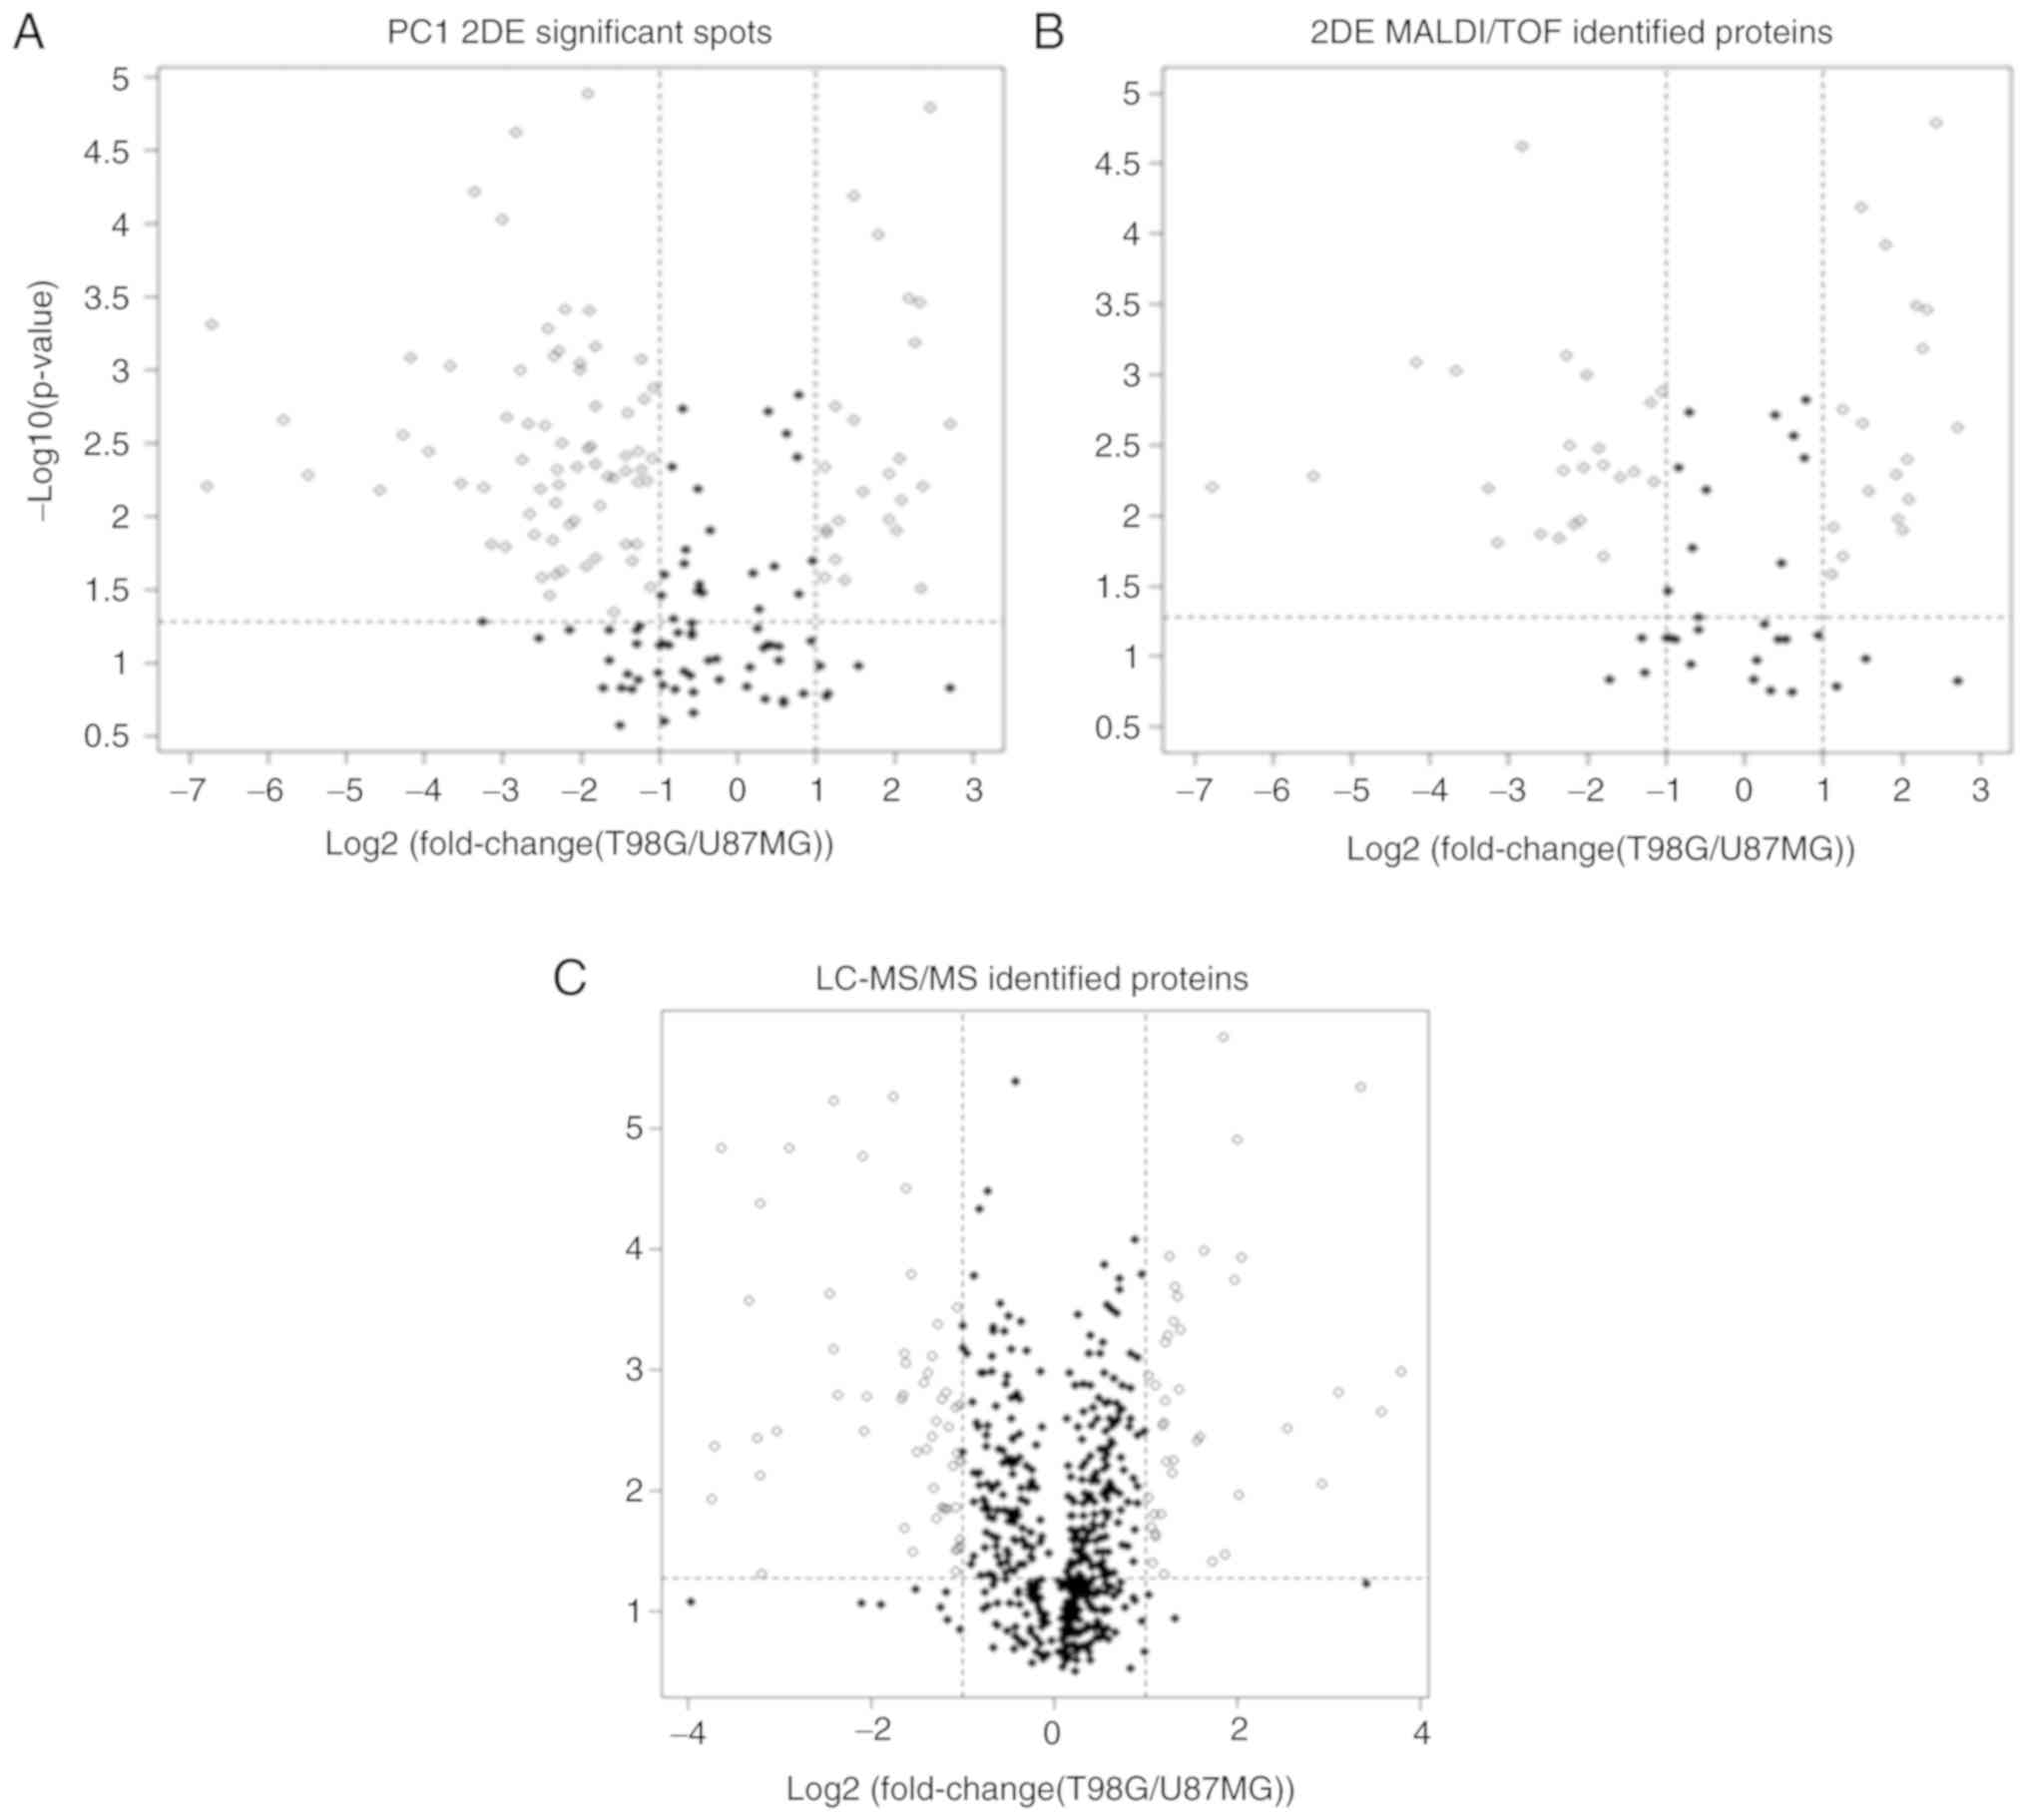
PCA versus fold-change and t-test
Through selection of random 2DE spots followed by
determination of their PCA abundance, 165 spots were obtained as
candidates for identification (Fig.
6A). Ultimately, the log2(fold-change) between −1
and 1 led to discard 31% of these 165 spots (black dots; Fig. 6A), and a t-test removed 30% (black
dots below the horizontal dotted line; Fig. 6A). Following the
log2(fold-change) and the t-test, as commonly performed
to select differentially expressed spots, 43% of the spots were
discarded (black dots; Fig.
6A).
A similar behavior was observed for 89 MALDI-TOF-
identified proteins (Fig. 6B), for
which the log2(fold-change) comparison removed ~35% of
the spots, while the t-test removed 30%. When considering both
tests, 44% of the identified proteins could be discarded (black
dots; Fig. 6B). With respect to the
543 proteins obtained from LC-MS/MS PC1, there was a high number of
removed proteins (black dots; Fig.
6C): The log2(fold-change) and the t-test removed 80
and 35% of proteins, respectively. A total of 18% of proteins were
significant according to the log2(fold-change) and the
t-test, indicating a substantial loss of information and
representativeness.
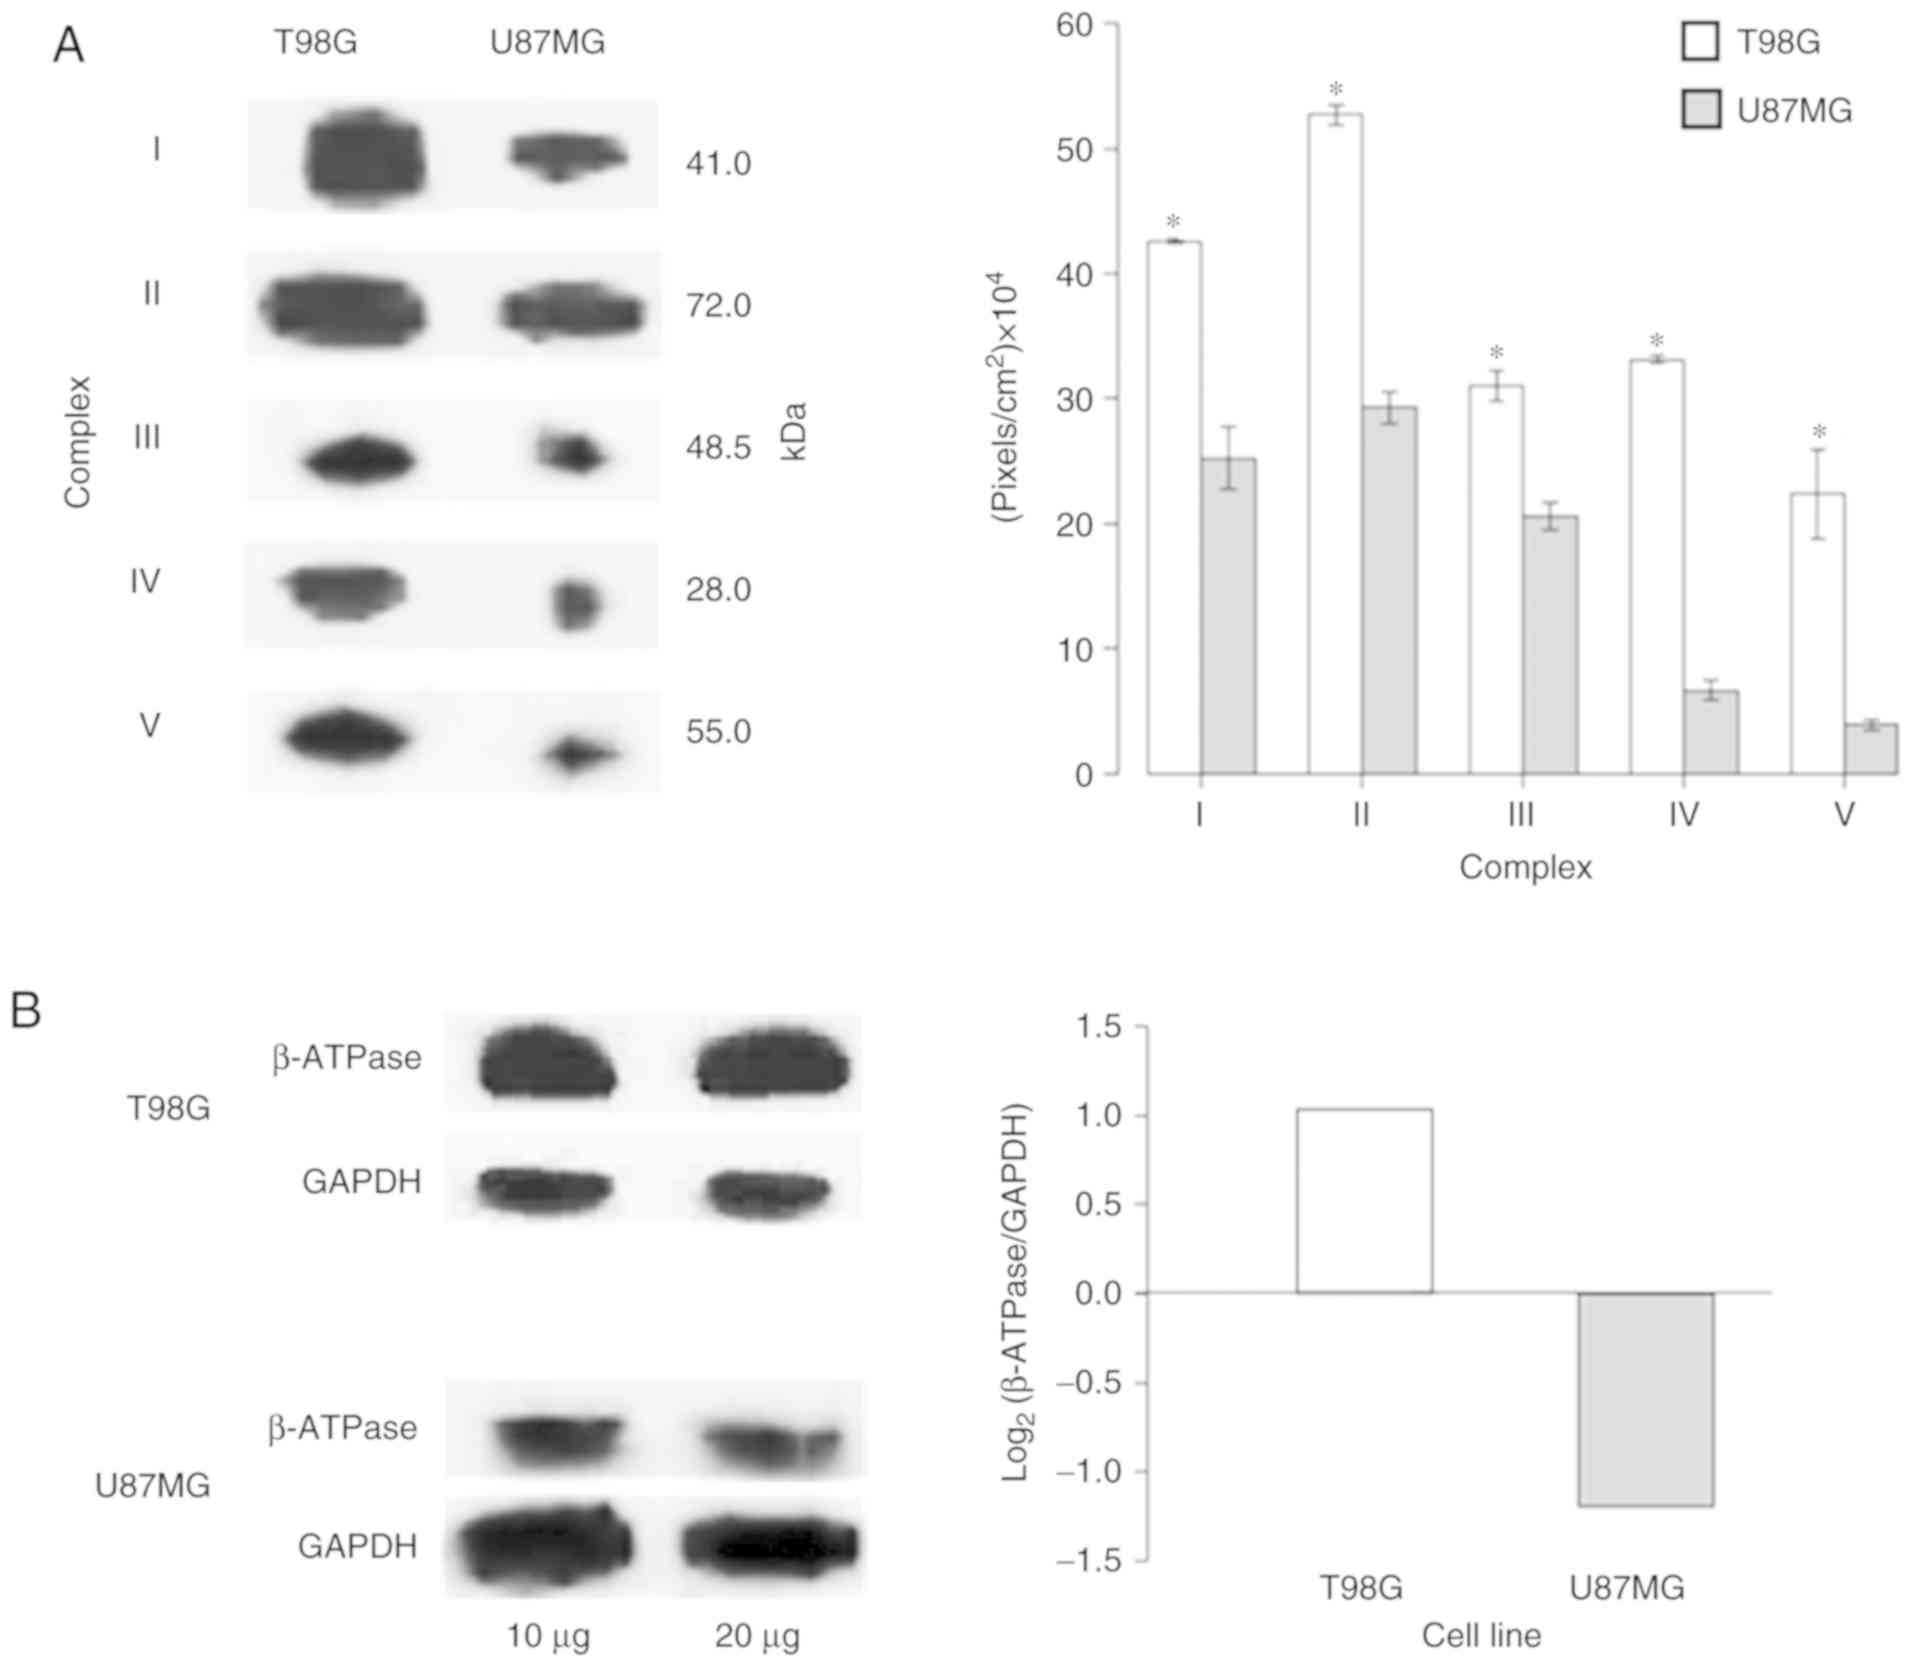
Warburg metabolism
As the ‘generation of precursor metabolites and
energy’ and ‘metabolism’ processes were amongst the most
significantly enriched processes in the T98G (Fig. 5A) and U87MG (Fig. 5B) cell lines, respectively, the
protein expression levels of OXPHOS complexes (CI–V and β-subunit
ATP synthase) were verified on both cell lines via western blot
analysis. The expression levels of the OXPHOS complexes in U87MG
cells were significantly decreased compared with those in T98G
cells (Fig. 7A and Fig. S2). Additionally, as the ‘glycolytic
process’ was one of the most enhanced processes in U87MG (Fig. 5B), the bioenergetic signature
(39) was investigated (Fig. 7B). The results were in accordance
with Warburg's effect, as U87MG cells expressed more glycolytic
proteins compared with T98G cells, where the OXPHOS system was
predominant. The present results suggested that mitochondria may
act as sensor organelles that change with biological states.
Discussion
Previous studies have stated that cancer proteomics
results have an unclear association with various diseases (15–17).
In regard to cancer, there can be a number of reasons for this
unclear association; one of these may be associated with ‘custom’
data analysis focused on protein abundance fold-changes and/or
univariate hypothesis tests. However, numerous proteins exhibit
multiple or moonlighting functions and are involved in different
biological pathways, or as bidirectional enzymes, they are involved
in synthesizing or hydrolyzing according to cell duties. Therefore,
a more sensible statistical approach consistent with the biological
systems under study is required.
Unlike the log2(fold-change) and t-test
approach, PCA does not compare the protein mean abundance by
multiple independent hypothesis tests between groups. Instead, the
PCA summarizes the abundance behavior of whole proteins
simultaneously in all samples to determine abundance patterns, i.e.
proteins changing simultaneously in specific signaling pathways
under certain conditions (40,41).
On the other hand, random sampling on 2D gels is able to obtain
enough representativeness to make reliable inferences (27,42).
LC and 2DE data analysis are in line with
biochemical and proteomic evidence (15,16),
providing an accurate description of T98G and U87MG cells with the
representative biological processes according to each cell line
(19,43–45).
In the present study, mitochondrial proteome PCA of LC-MS/MS and
2DE random spot selection data revealed specific PPIns for each
cell line in which 2D-selected and identified proteins were
included in a larger and improved LC PPIn.
According to the current results, PPIns revealed
that T98G protein groups belonged to well-characterized cellular
processes closer to those of typical mitochondria. The most
represented protein groups according to GO overrepresentation were
associated with ‘generation of precursor metabolites and energy’,
followed by ‘chromatin organization’, ‘primary metabolism’,
‘protein folding’, ‘cellular component organization or biogenesis’
and the major group of proteins for ‘cellular amino acid
metabolism’, where OXPHOS and TCA are implicitly represented.
Additionally, some less reported mitochondrial processes
(‘carbohydrate metabolism’ or ‘locomotion’) or non-typical
mitochondrial functions (‘cell surface receptor signaling pathway’
and ‘cell communication’) associated with cancer were identified.
Therefore, PCA analysis appears to be sufficiently powerful to
detect this ‘extra’ information. All the aforementioned processes
were identified according to 2DE data, which demonstrated enough
resolution power to build a reliable PPIn network skeleton; LC data
detected the same pathways but in more detail.
U87MG cells displayed a more heterogeneous molecular
landscape with more non-mitochondrial processes detected. In these
cells, mitochondrial organization processes (including
‘cytoskeleton organization’, ‘cellular component morphogenesis’,
‘protein complex assembly’ and ‘protein complex biogenesis’)
occupied a central role. Additionally, the canonic energy metabolic
shift was clear, as ‘glycolytic process’ proteins were well
represented and OXPHOS was dysregulated. Notably, other
non-mitochondrial cancer-associated processes were observed,
including ‘exocytosis’ (such as ‘intracellular protein transport’
and ‘vesicle-mediated transport’) and ‘protein folding’. Some of
these cellular processes were also present in T98G cells but its
commitment is different since in U87MG cells, i.e. the ‘generation
of precursor metabolites and energy’ and ‘primary metabolism’
abundance pattern changes are represented mainly by ‘catabolic
process’ or ‘proteolysis’.
PC1 of LC-MS/MS label-free quantification and 2DE
spot abundance data explained 57 and 63% of the total abundance
variation, respectively. Consequently, the proteins with the
greatest contribution values in PC1 could be distinguished between
the T98G and U87MG cell lines due to their abundance patterns.
According to GO overrepresentation analysis of PC1-PPIns, the
biological processes were mainly involved in ‘energy metabolism
shift’ or Warburg effect, with U87MG cells representing an
advanced, invasive and malignant cancer state with promiscuous
interactions between the ER and nucleus, a maintained ‘chaperone
response’, ‘DNA translation to proteins’ and invasion (vesicle
formation, cytoskeleton proteins and proteolysis) compared with
T98G cells. Conversely, T98G cells exhibited typical mitochondrial
functions (‘OXPHOS’, ‘TCA cycle’ and ‘lipid metabolism’), as well
as other cancer-associated processes (‘proliferation’, ‘amino acids
metabolism’ or ‘chaperone response’).
PCA may reveal different cancer states or intervals
of GBM, and may define processes for other types of cancer. In this
way, T98G cells may represent a different cancer process or an
earlier state with a molecular landscape similar to that of
‘oxidative tumors’, where ATP comes from an OXPHOS system fueled by
glutamine synthesis (e.g. ‘lipid and amino acid metabolism’), as
has been reported in glioblastoma (19,46).
U87MG exhibited a different state, where ‘glycolytic process’ was
well represented probably due to the Warburg effect, and a number
of non-mitochondrial but cancer-associated proteins (16,47,48)
were also present. U87MG mitochondria were associated with mobility
or migration events (cytoskeleton and vesicle-associated proteins).
Other less frequent processes associated with a biomass increase or
metabolic energy source (DNA translation proteins and folding
chaperones) were observed.
A notable GBM feature is the chaperone response,
where potential biomarkers (49) or
therapy targets (50) have been
identified. Chaperones such as tumor necrosis factor
receptor-associated protein 1 [heat shock protein (HSP)90
homologous], glucose-regulated protein (GRP)78, GRP75 and HSPB1,
identified in gel spots in the present study, regulate certain
mitochondrial metabolic pathways and stabilize cancer cells through
apoptosis evasion (51) or can be
involved in drug surveillance (44).
Non-mitochondrial protein presence is unsurprising,
as mitochondrial interactions with the nucleus and the endoplasmic
reticulum occur under normoxic conditions. Notably, U87MG
mitochondria are more prone to these phenomena, suggesting a more
promiscuous or heterogenous environment, as expected from an
advanced cancer (14,52). This landscape resembles autophagy,
which is a central process in advanced cancer that enables cell
surveillance due to metabolite and nutrient recycling, such as
amino acid generation by proteolysis, recycling (formation of
metabolic precursors, RAB GTPases) and protein synthesis for
fueling other pathways, such as the TCA cycle when basal or other
metabolites are not available (53,54).
In addition, there are proteins for amino acid and purine
metabolism that could enable phagocytic structures such as
phagosomes (55).
In addition to a metabolic shift, PCA can determine
simultaneous cell processes, unlike other proteomic approaches
based on proteins surpassing significant abundance changes
(56,57). The present data analysis approach
identified a specific proteomic landscape for T98G cells and
another one for U87MG cells that defined concrete cell processes
and temporality. This may allow the identification of targets or
therapeutic tools that may result in reliable and useful
information to help improve diagnosis and risk assessment.
The present data supported the hypothesis of
mitochondria acting as dynamic organelles following and sensing the
molecular events that take place during carcinogenesis (19,58–60).
In conclusion, PCA applied to LC-MS/MS label-free quantified data
was able to describe the most relevant biological processes in each
cell type. Similarly, random sampling of spots and their abundance
PCA from 2DE before protein identification identified proteins that
exhibited the same information as LC, albeit with less resolution;
with this information, a representative mitochondrial proteomic
landscape was built specifically for the T98G and U87MG cell lines,
in which overrepresented biological processes were highlighted with
the identified mitochondrial proteins.
Supplementary Material
Supporting Data
Supporting Data
Supporting Data
Supporting Data
Acknowledgements
Not applicable.
Funding
The present study was supported by the Mexican
Social Security Institute (IMSS) and National Autonomous University
of Mexico (UNAM), by a grant from CONACyT (grant no. 220790), by a
fellowship from the National Council of Science and Technology
(grant no. 375815) and by General Directorate of Academic Staff
Affairs-Support Program for Research and Technological Innovation
Projects (grant nos. IN-207519 and IN-213216).
Availability of data and materials
The datasets used and/or analyzed during the present
study are available from the corresponding authors on reasonable
request.
Authors' contributions
LGC, FMS and SEG conceptualized the research. LGC,
FMS, SEG, AJOL, HRV and AGMB conceived and designed the
experiments. LGC, AJOL and AGMB performed the experiments. LGC
analyzed the data. FMS, SEG and HRV contributed to the design of
the study, acquisition of resources and equipment, and discussion
of alternative experimental approaches. LGC and FMS wrote the
paper. LGC, FMS and SEG revised the manuscript. All authors read
and approved the final manuscript.
Ethics approval and consent to
participate
Not applicable.
Patient consent for publication
Not applicable.
Competing interests
The authors declare that they have no competing
interests.
Glossary
Abbreviations
Abbreviations:
|
GO
|
Gene Ontology
|
|
LC-MS/MS
|
liquid chromatography coupled to
tandem mass spectrometry
|
|
m/z
|
mass/charge
|
|
MALDI-TOF
|
matrix-assisted laser
desorption/ionization- time of flight
|
|
PC
|
principal component
|
|
PCA
|
principal component analysis
|
|
PPIn
|
protein-protein interaction
network
|
References
|
1
|
Luna B, Bhatia S, Yoo C, Felty Q, Sandberg
DI, Duchowny M, Khatib Z, Miller I, Ragheb J, Prasanna J and Roy D:
Proteomic and mitochondrial genomic analyses of pediatric brain
tumors. Mol Neurobiol. 52:1341–1363. 2015. View Article : Google Scholar : PubMed/NCBI
|
|
2
|
Pooladi M, Rezaei-Tavirani M, Hashemi M,
Hesami-Tackallou S, Khaghani-Razi-Abad S, Moradi A, Zali AR,
Mousavi M, Firozi-Dalvand L, Rakhshan A and Zamanian Azodi M:
Cluster and Principal Component Analysis of Human Glioblastoma
Multiforme (GBM) Tumor Proteome. Iran J cancer Prev. 7:87–95.
2014.PubMed/NCBI
|
|
3
|
Fangusaro J: Pediatric high grade glioma:
A review and update on tumor clinical characteristics and biology.
Front Oncol. 2:1052012. View Article : Google Scholar : PubMed/NCBI
|
|
4
|
Batash R, Asna N, Schaffer P, Francis N
and Schaffer M: Glioblastoma multiforme, diagnosis and treatment;
recent literature review. Curr Med Chem. 24:3002–3009. 2017.
View Article : Google Scholar : PubMed/NCBI
|
|
5
|
Kafka A, Tomas D, Lechpammer M, Gabud T,
Pažanin L and Pećina-Šlaus N: Expression Levels and Localizations
of DVL3 and sFRP3 in Glioblastoma. Dis Markers. 2017:9253495. 2017.
View Article : Google Scholar : PubMed/NCBI
|
|
6
|
Hagberg H, Mallard C, Rousset CI and
Thornton C: Mitochondria: Hub of injury responses in the developing
brain. Lancet Neurol. 13:217–232. 2014. View Article : Google Scholar : PubMed/NCBI
|
|
7
|
Raefsky SM and Mattson MP: Adaptive
responses of neuronal mitochondria to bioenergetic challenges:
Roles in neuroplasticity and disease resistance. Free Radic Biol.
102:203–216. 2017. View Article : Google Scholar
|
|
8
|
Son G and Han J: Roles of mitochondria in
neuronal development. BMB Rep. 51:549–556. 2018. View Article : Google Scholar : PubMed/NCBI
|
|
9
|
Hanahan D and Weinberg RA: Hallmarks of
cancer. The next generation. 144:646–674. 2011.
|
|
10
|
Floor SL, Dumont JE, Maenhaut C and Raspe
E: Hallmarks of cancer: Of all cancer cells, all the time? Trends
Mol Med. 18:509–515. 2012. View Article : Google Scholar : PubMed/NCBI
|
|
11
|
Czarnecka AM, Czarnecki JS, Kukwa W,
Cappello F, Ścińska A and Kukwa A: Molecular oncology focus-is
carcinogenesis a ‘mitochondriopathy’? J Biomed Sci. 17:312010.
View Article : Google Scholar : PubMed/NCBI
|
|
12
|
Kroemer G and Pouyssegur J: Tumor cell
metabolism: Cancer's Achilles' heel. Cancer Cell. 13:472–482. 2008.
View Article : Google Scholar : PubMed/NCBI
|
|
13
|
Galluzzi L, Morselli E, Kepp O, Vitale I,
Rigoni A, Vacchelli E, Michaud M, Zischka H, Castedo M and Kroemer
G: Mitochondrial gateways to cancer. Mol Aspects Med. 31:1–20.
2010. View Article : Google Scholar : PubMed/NCBI
|
|
14
|
Vyas S, Zaganjor E and Haigis MC:
Mitochondria and Cancer. Cell. 166:555–566. 2016. View Article : Google Scholar : PubMed/NCBI
|
|
15
|
Petrak J, Ivanek R, Toman O, Cmejla R,
Cmejlova J, Vyoral D, Zivny J and Vulpe CD: Déjà vu in proteomics.
A hit parade of repeatedly identified differentially expressed
proteins. Proteomics. 8:1744–1749. 2008. View Article : Google Scholar : PubMed/NCBI
|
|
16
|
Deighton RF, McGregor R, Kemp J, McCulloch
J and Whittle IR: Glioma pathophysiology: Insights emerging from
proteomics. Brain Pathol. 20:691–703. 2010. View Article : Google Scholar : PubMed/NCBI
|
|
17
|
Valledor L and Jorrín J: Back to the
basics: Maximizing the information obtained by quantitative two
dimensional gel electrophoresis analyses by an appropriate
experimental design and statistical analyses. J Proteomics.
74:1–18. 2011. View Article : Google Scholar : PubMed/NCBI
|
|
18
|
Meehan MC: General system theory:
Foundations, development, applications. JAMA. 208((5)):
87019691969.
|
|
19
|
Obre E and Rossignol R: Emerging concepts
in bioenergetics and cancer research: Metabolic flexibility,
coupling, symbiosis, switch, oxidative tumors, metabolic
remodeling, signaling and bioenergetic therapy. Int J Biochem Cell
Biol. 59:167–181. 2015. View Article : Google Scholar : PubMed/NCBI
|
|
20
|
Tyanova S, Temu T and Cox J: The MaxQuant
computational platform for mass spectrometry-based shotgun
proteomics. Nat Protoc. 11:2301–2319. 2016. View Article : Google Scholar : PubMed/NCBI
|
|
21
|
Stekhoven DJ and Buhlmann P:
MissForest-non-parametric missing value imputation for mixed-type
data. Bioinformatics. 28:112–118. 2012. View Article : Google Scholar : PubMed/NCBI
|
|
22
|
Lê S, Josse J and Husson F: FactoMineR: An
R package for multivariate analysis. J Stat Softw. 1–18.
2008.doi.org/10.18637/jss.v025.i01 PMID: 18676020.
|
|
23
|
Abdi H and Williams LJ: Principal
component analysis. Wiley Interdiscip Rev Comput Stat. 2:433–459.
2010. View Article : Google Scholar
|
|
24
|
Hurkman WJ and Tanaka CK: Solubilization
of plant membrane proteins for analysis by two-dimensional gel
electrophoresis. Plant Physiol. 81:802–806. 1986. View Article : Google Scholar : PubMed/NCBI
|
|
25
|
Salazar E, Díaz-Mejía JJ, Moreno-Hagelsieb
G, Martínez- Batallar G, Mora Y, Mora J and Encarnación S:
Characterization of the Nif A-RpoN regulon in rhizobium etli in
free life and in symbiosis with phaseolus vulgaris. Appl Environ
Microbiol. 76:4510–4520. 2010. View Article : Google Scholar : PubMed/NCBI
|
|
26
|
Mead R, Curnow RN and Hasted AM:
Statistical Methods in Agriculture and Experimental Biology. (3rd).
Chapman and Hall/CRC Press. (New York, NY). 4722003.
|
|
27
|
Cochran WG: Sampling Techniques. (3rd).
Wiley. (New Jersey). 4281977.
|
|
28
|
Perkins DN, Pappin DJ, Creasy DM and
Cottrell JS: Probability-based protein identification by searching
sequence databases using mass spectrometry data. Electrophoresis.
20:3551–3567. 1999. View Article : Google Scholar : PubMed/NCBI
|
|
29
|
The UniProt Consortium: UniProt: The
universal protein knowledge base. Nucleic Acids Res. 45:D158–D169.
2017. View Article : Google Scholar : PubMed/NCBI
|
|
30
|
Montojo J, Zuberi K, Rodriguez H, Kazi F,
Wright G, Donaldson SL, Morris Q and Bader GD: GeneMANIA Cytoscape
plugin: Fast gene function predictions on the desktop.
Bioinformatics. 26:2927–2928. 2010. View Article : Google Scholar : PubMed/NCBI
|
|
31
|
Ashkenazi M, Bader GD, Kuchinsky A,
Moshelion M and States DJ: Cytoscape ESP: Simple search of complex
biological networks. Bioinformatics. 24:1465–1466. 2008. View Article : Google Scholar : PubMed/NCBI
|
|
32
|
Ashburner M, Ball CA, Blake JA, Botstein
D, Butler H, Cherry JM, Davis AP, Dolinski K, Dwight SS, Eppig JT,
et al: Gene ontology: Tool for the unification of biology. The Gene
Ontology Consortium. Nat Genet. 25:25–29. 2000. View Article : Google Scholar : PubMed/NCBI
|
|
33
|
Mi H, Huang X, Muruganujan A, Tang H,
Mills C, Kang D and Thomas PD: PANTHER version 11: Expanded
annotation data from Gene Ontology and Reactome pathways, and data
analysis tool enhancements. Nucleic Acids Res. 45:D183–D189. 2017.
View Article : Google Scholar : PubMed/NCBI
|
|
34
|
Supek F, Bošnjak M, Škunca N and Šmuc T:
Revigo summarizes and visualizes long lists of gene ontology terms.
PLoS One. 6:e218002011. View Article : Google Scholar : PubMed/NCBI
|
|
35
|
R Core Team, . R: A Language and
Environment for Statistical Computing. (Vienna, Austria).
2017.
|
|
36
|
Laemmli UK: Cleavage of structural
proteins during the assembly of the head of bacteriophage T4.
Nature. 227:680–685. 1970. View Article : Google Scholar : PubMed/NCBI
|
|
37
|
Towbin H, Staehelin T and Gordon J:
Electrophoretic transfer of proteins from polyacrylamide gels to
nitrocellulose sheets: Procedure and some applications. Proc Natl
Acad Sci USA. 76:4350–4354. 1979. View Article : Google Scholar : PubMed/NCBI
|
|
38
|
Lowry OH, Rosebrough NJ, Farr AL and
Randall RJ: Protein measurement with the folin phenol reagent. J
Biol Chem. 193:265–275. 1951.PubMed/NCBI
|
|
39
|
Cuezva JM, Krajewska M, de Heredia ML,
Krajewski S, Santamaría G, Kim H, Zapata JM, Marusawa H, Chamorro M
and Reed JC: The Bioenergetic Signature of Cancer: A Marker of
Tumor Progression. Cancer Res. 62:6674–6681. 2002.PubMed/NCBI
|
|
40
|
Hair JF, Anderson RE, Tatham RL and Black
WC: Multivariate Data Analysis. Int J Pharmaceutics. 816:21335075.
1998.
|
|
41
|
Everitt B and Hothorn T: An Introduction
to Applied Multivariate Analysis with R. Springer-Verlag; New York,
NY: 2011, View Article : Google Scholar
|
|
42
|
Heinisch O: An introduction to sampling
theory with application to agriculture. Biom Z. 5:2122017.
View Article : Google Scholar
|
|
43
|
Cuezva JM, Ortega AD, Willers I,
Sánchez-Cenizo L, Aldea M and Sánchez-Aragó M: The tumor suppressor
function of mitochondria: Translation into the clinics. Biochim
Biophys Acta. 1792:1145–58. 2009. View Article : Google Scholar : PubMed/NCBI
|
|
44
|
Siegelin MD, Plescia J, Raskett CM,
Gilbert CA, Ross AH and Altieri DC: Global targeting of subcellular
heat shock protein-90 networks for therapy of glioblastoma. Mol
Cancer Ther. 9:1638–1646. 2010. View Article : Google Scholar : PubMed/NCBI
|
|
45
|
Wolf DA: Is reliance on mitochondrial
respiration a ‘chink in the armor’ of therapy-resistant cancer?
Cancer Cell. 26:788–795. 2014. View Article : Google Scholar : PubMed/NCBI
|
|
46
|
Jose C, Bellance N and Rossignol R:
Choosing between glycolysis and oxidative phosphorylation: A
tumor's dilemma? Biochim Biophys Acta. 1807:552–561. 2011.
View Article : Google Scholar : PubMed/NCBI
|
|
47
|
Pooladi M, Abad SK and Hashemi M:
Proteomics analysis of human brain glial cell proteome by 2D gel.
Indian J Cancer. 51:159–162. 2014. View Article : Google Scholar : PubMed/NCBI
|
|
48
|
Ramão A, Gimenez M, Laure HJ, Izumi C,
Vida RC, Oba-Shinjo S, Marie SK and Rosa JC: Changes in the
expression of proteins associated with aerobic glycolysis and cell
migration are involved in tumorigenic ability of two glioma cell
lines. Proteome Sci. 10:532012. View Article : Google Scholar : PubMed/NCBI
|
|
49
|
Banerjee HN, Mahaffey K, Riddick E,
Banerjee A, Bhowmik N and Patra M: Search for a
diagnostic/prognostic biomarker for the brain cancer glioblastoma
multiforme by 2D-DIGE-MS technique. Mol Cell Biochem. 367:59–63.
2012. View Article : Google Scholar : PubMed/NCBI
|
|
50
|
Karpel-Massler G, Ishida CT, Bianchetti E,
Shu C, Perez-Lorenzo R, Horst B, Banu M, Roth KA, Bruce JN, Canoll
P, Altieri DC and Siegelin MD: Inhibition of mitochondrial matrix
chaperones and antiapoptotic bcl-2 family proteins empower
antitumor therapeutic responses. Cancer Res. 77:3513–3526. 2017.
View Article : Google Scholar : PubMed/NCBI
|
|
51
|
Chae JI, Jeon YJ and Shim JH:
Downregulation of Sp1 is involved in honokiol-induced cell cycle
arrest and apoptosis in human malignant pleural mesothelioma cells.
Oncol Rep. 29:2318–2324. 2013. View Article : Google Scholar : PubMed/NCBI
|
|
52
|
Porporato PE, Filigheddu N, Pedro JMB,
Kroemer G and Galluzzi L: Mitochondrial metabolism and cancer. Cell
Res. 28:265–280. 2018. View Article : Google Scholar : PubMed/NCBI
|
|
53
|
White E: Deconvoluting the
context-dependent role for autophagy in cancer. Nat Rev Cancer.
12:401–410. 2012. View Article : Google Scholar : PubMed/NCBI
|
|
54
|
Giatromanolaki A, Sivridis E, Mitrakas A,
Kalamida D, Zois CE, Haider S, Piperidou C, Pappa A, Gatter KC,
Harris AL and Koukourakis MI: Autophagy and lysosomal related
protein expression patterns in human glioblastoma. Cancer Biol
Ther. 15:1468–1478. 2014. View Article : Google Scholar : PubMed/NCBI
|
|
55
|
Sica V, Galluzzi L, Bravo-San Pedro JM,
Izzo V, Maiuri MC and Kroemer G: Organelle-Specific Initiation of
Autophagy. Mol Cell. 59:522–539. 2015. View Article : Google Scholar : PubMed/NCBI
|
|
56
|
Gautam P, Nair SC, Gupta MK, Sharma R,
Polisetty RV, Uppin MS, Sundaram C, Puligopu AK, Ankathi P, Purohit
AK, et al: Proteins with altered levels in plasma from glioblastoma
patients as revealed by iTRAQ-based quantitative proteomic
analysis. PLoS One. 7:e461532012. View Article : Google Scholar : PubMed/NCBI
|
|
57
|
Locasale JW, Melman T, Song S, Yang X,
Swanson KD, Cantley LC, Wong ET and Asara JM: Metabolomics of human
cerebrospinal fluid identifies signatures of malignant glioma. Mol
Cell Proteomics. 11:M111.014688. 2012. View Article : Google Scholar : PubMed/NCBI
|
|
58
|
Iwadate Y, Sakaida T, Hiwasa T, Nagai Y,
Ishikura H, Takiguchi M and Yamaura A: Molecular classification and
survival prediction in human gliomas based on proteome analysis.
Cancer Res. 64:2496–2501. 2004. View Article : Google Scholar : PubMed/NCBI
|
|
59
|
Ordys BB, Launay S, Deighton RF, McCulloch
J and Whittle IR: The role of mitochondria in glioma
pathophysiology. Mol Neurobiol. 42:64–75. 2010. View Article : Google Scholar : PubMed/NCBI
|
|
60
|
Collet B, Guitton N, Saïkali S, Avril T,
Pineau C, Hamlat A, Mosser J and Quillien V: Differential analysis
of glioblastoma multiforme proteome by a 2D-DIGE approach. Proteome
Sci. 9:162011. View Article : Google Scholar : PubMed/NCBI
|