Introduction
Retroperitoneal soft tissue sarcoma (RPS) is a rare
type of tumor, accounting for 12–15% of all soft tissue sarcomas
and 1% of all solid tumors, with an average incidence rate of 2.7
cases per million individuals in the United States in 2005
(1). Retroperitoneal liposarcoma
(RLPS) is the most common type of retroperitoneal soft tissue
sarcoma, accounting for 45% of RPS cases and 0.07–0.2% of all
tumors (2). Chemoradiotherapy has a
limited effect on RLPS, and surgical resection is the most
effective treatment for RLPS (3).
However, it is difficult to achieve complete surgical resection and
local recurrence is common (4–6).
Therefore, it is essential to identify the regulatory factors and
to further elucidate the mechanisms underlying RLPS progression, to
assist in the development of effective interventions.
Gene expression analysis of microarrays is a useful
method to extensively examine the pathogenesis of diseases by
investigating the differences in gene expression and the activity
of functional signaling pathways between patients and healthy
donors using bioinformatics analysis, which may highlight potential
targets for treatment of various diseases (7–9). High
content screening (HCS) is a high-throughput process for automatic
analysis of biological behaviors such as proliferation and for
identification of drug targets (10).
In the present study, the aforementioned two methods
were combined to facilitate the selection of therapeutic targets.
Specifically, potential driver genes of LPS were identified using
bioinformatics analysis based on the results of a microarray
performed by Barretina et al (11). Furthermore, the effects of the
identified genes on biological behavior was assessed using HCS to
elucidate potential markers for use in future targeted
therapies.
Materials and methods
Microarray data
The Gene Expression Omnibus (GEO) (https://www.ncbi.nlm.nih.gov/pmc/) is an open
database, which provides high-throughput data for biological
research. The GSE21122 dataset is based on the Affymetrix Human
Genome U133A Array (HG-U133A) GPL96 platform and includes a variety
of soft-tissue sarcoma specimens (11). The dataset contained data on 89
liposarcoma specimens (46 dedifferentiated liposarcoma specimens,
20 myxoid liposarcoma specimens and 23 pleomorphic liposarcoma
specimens) and 9 NF specimens, which were downloaded for further
analysis.
Data processing and identification of
differentially expressed genes (DEGs)
The original file was parsed to obtain the signal
intensity of each probe. The dataset and the signal intensity
values of each probe set were acquired using the robust multi-array
average algorithm (12). Due to the
design principle of the chip itself, and the artificial or other
unavoidable factors in the experimental process, there were a large
number of unqualified or invalid detection points in the chip raw
data. The probe sets in the lowest 20% of the signal intensity
order of all the probe sets in the two sample groups were filtered
and considered as background noise. Subsequently, the variable
coefficient of the same probe group in the same sample group was
calculated using the coefficient of variation method (a method for
comparing the discreteness of two sets of data), and the probe
groups with a coefficient of variation >25% in both groups were
filtered out. The limma package in R v3.4.3 (13) was used to identify DEGs and a linear
model based on the empirical Bayesian distribution was used to
calculate the significant difference level (P-value). The
Benjamini-Hochberg method (14) was
used to correct the significant difference level and to obtain the
false discovery rate (FDR). An FDR<0.05 and |log FC|>1 were
used as the cut-off criteria for DEGs, wherein a |log FC|<0 was
considered as a downregulated gene and a |log FC|>0 was
considered as an upregulated gene. The volcano map and heatmap were
developed using the ggplot2 package and pheatmap package in R
version 3.4.3, respectively (15).
RNA extraction and reverse
transcription quantitative-PCR (RT-qPCR)
Total RNA was extracted from cell lines and frozen
tissues using TRIzol® reagent (cat. no. 15596026; Thermo
Fisher Scientific, Inc.) according to the manufacturer's protocol.
RT was performed using 5X All-In-One RT MasterMix kit (cat. no.
G490; Applied Biological Materials, Inc.) according to the
manufacturer's instruction. The procedure for RT was: 25°C for 10
min, 42°C for 15 min and 85°C for 5 min. qPCR was performed using
EvaGreen 2X qPCR MasterMix (cat. no. Master Mix-LR; Applied
Biological Materials, Inc.) on an ABI 7500 fast real-time PCR
Detection system (Thermo Fisher Scientific, Inc.) according to the
manufacturer's protocol. The thermocycling conditions for qPCR
were: Pre-denaturation at 95°C for 10 min; followed by 40 cycles of
denaturation at 95°C for 15 sec, annealing at 60°C for 1 min and
extension at 72°C for 30 sec. Primers were designed with Primer
v6.0 (Thermo Fisher Scientific, Inc.). GAPDH was used as an
internal reference gene. All reactions were performed in
triplicate. The specificity of qPCR was confirmed by melting-curve
analysis. The relative expression was calculated and analyzed using
the 2−ΔΔCq method (16).
The primer sequences are shown in Table SI.
Screening of genes that affect cell
proliferation based on the HCS method
Short hairpin RNA (shRNA) was used to construct the
gene knockdown vector (cat. no. GV115; Shanghai GeneChem Co.,
Ltd.). Three RNA interference targets were designed for each gene
(Table SII), and three plasmids
carrying different targets were mixed in equal proportions for
lentivirus packaging. The 94T778 cells were infected with
lentivirus containing the shRNAs using X-tremeGENE HP DNA Transf.
Reag. 1.0 ml (cat. no. 6366236001; Roche Pharmaceutical, Ltd.). The
cells were imaged using a Celigo® Image Cytometer
(Nexcelom Bioscience) with a fluorescence microscope. For each
experimental well of a 96-well plate, Celigo® Image
Cytometer scanned four fields of view at each time point
(magnification, ×40), and the cells were counted in the images with
the corresponding analysis software in the Celigo® Image
Cytometer to obtain the number of cells in the experimental
well.
Patients and samples
All specimens of RLPS and NF tissues were obtained
from patients who underwent surgical resection between March 2015
and January 2018 at the Peking University Cancer Hospital Sarcoma
Center (Beijing, China). None of the patients received chemotherapy
or radiotherapy prior to surgery. A total of 47 RLPS tissues (from
27 males and 20 females, with age range between 20 and 80 years,
and the mean age was 55.3±10.7 years) were formalin-fixed
immediately after resection, and embedded in paraffin prior to
immunohistochemical analysis. The detailed clinicopathological
characteristics of the 47 patients with RLPS are presented in
Table I. The histopathological
analysis of tumor tissues was performed by two pathologists,
independently. For qPCR, 21 RLPS tissues (12 males and 9 females,
the mean age was 55.0±8.5 years old) and 10 NF tissues (6 males and
4 females, the mean age was 57.4±8.4 years old) were snap-frozen in
liquid nitrogen immediately after resection and transferred to
−80°C freezer for long-term storage. The present study was approved
by the Ethics Committee of Peking University Cancer Hospital
(approval no. 2019KT19) and written informed consent was obtained
from each participant.
 | Table I.Clinicopathological characteristics
of the 47 patients with RLPS. |
Table I.
Clinicopathological characteristics
of the 47 patients with RLPS.
| Clinicopathological
characteristics | N (%) |
|---|
| Sex |
|
|
Male | 27 (57.4) |
|
Female | 20 (42.6) |
| Age, years |
|
|
<55 | 31 (66.0) |
|
≥55 | 16 (34.0) |
| Tumor number |
|
|
Single | 37 (78.7) |
|
Multiple | 10 (21.3) |
| Tumor size, cm |
|
|
<15 | 7 (14.9) |
|
15-30 | 26 (55.3) |
|
≥30 | 14 (29.8) |
| Histological
subtypea |
|
|
Well-differentiated | 14 (29.8) |
|
Dedifferentiated | 23 (48.9) |
|
Myxoid/round cell | 5 (10.6) |
|
Pleomorphic | 5 (10.6) |
| Gradeb |
|
|
Low-grade | 14 (29.8) |
|
High-grade | 33 (70.2) |
Immunohistochemistry (IHC)
The 4-µm-thick slices were heated for 1 h at 72°C
and then dewaxed in xylene (cat. no. 10023418; Sinopharm Chemical
Reagent Co., Ltd.) for 30 min at room temperature, and hydrated in
100, 95 and 85% ethanol solutions (cat. no. 10009259; Sinopharm
Chemical Reagent Co., Ltd.) for 5 min at room temperature,
respectively. The slices were incubated in 3% hydrogen peroxide for
15 min at room temperature to block endogenous peroxidase activity.
Heat-mediated antigen retrieval was performed using EDTA buffer
(cat. no. ZLI-9069; pH=9.0; OriGene Technologies, Inc.), after the
pressure valve of the pressure cooker is exhausted for the first
time, the firepower is reduce and the high pressure is continue for
2 min and 30 sec. Goat serum (cat. no. ZLI-9056; OriGene
Technologies, Inc.) was used to block slices at 37°C for 1 h, after
cooling to room temperature. Subsequently, the slices were
incubated with the thymidylate synthase (TYMS) antibody (1:100;
cat. no. ab108995; Abcam) overnight at 4°C. The following day, the
slices were incubated with the goat anti-mouse/rabbit IgG-HRP
conjugated antibody secondary antibody (at working solution; cat.
no. PV-6000; OriGene Technologies, Inc.). The slices were
visualized at room temperature using DAB (Dako; Agilent
Technologies, Inc.) containing hydrogen peroxide for staining
specific protein, when the specific staining is strong and the
background color is shallow, the slice can be washed, and then
using hematoxylin (cat. no. HK100-9K; Biogenex) for staining
nucleus for 1 min at room temperature. Following TYMS staining,
semi-quantitative classification of TYMS staining was performed
according to the percentage of positive cells (PP) and staining
intensity (SI) by two pathologists, who were blinded to the
clinical information. The PP was scored as: 0, negative; 1, <25;
2, 25–75%; and 3, >75%. SI was scored as: 0, negative; 1, weak;
2, moderate; and 3, strong. The immunoreactivity score (IRS) was
defined as PP multiplied by SI, where IRS=0 was considered as
‘negative’, and IRS>0 was considered as ‘positive’.
Survival analysis
Gene Expression Profiling Interactive Analysis
(GEPIA) database (http://gepia.cancer-pku.cn/?from=
timeline&isappinstalled=0) was used to analyze the
association between TYMS expression and the overall survival (OS)
and disease-free survival (DFS) of patients with sarcoma.
Cell lines and cell culture
The human RLPS cell lines 93T449, 94T778 and SW872
were purchased from American Type Culture Collection and cultured
in RPMI-1640 medium (Gibco; Thermo Fisher Scientific, Inc.)
containing 10% FBS, 100 µg/ml penicillin, and 100 µg/ml
streptomycin. Cells were maintained in a humidified incubator at
37°C with 5% CO2.
Western blot analysis
Total protein was extracted using RIPA lysis buffer
(cat. no. CW2333S; CWBIO) and supplemented with a protease and
phosphatase inhibitor cocktail (cat. nos. CW2200S and CW2383S;
CWBIO). A BCA Protein assay kit (cat. no. CW0014S; CWBIO) was used
to quantify extracted proteins. Equivalent quantities of protein (5
µg) were separated by 8 or 10% SDS-PAGE and then transferred onto
PVDF membranes. The membranes were blocked with 5% skimmed milk for
1 h at room temperature and then incubated with a series of primary
antibodies at 4°C overnight. The following day, the membranes were
incubated with secondary anti-rabbit or anti-mouse antibody for 1 h
at room temperature. For detection of protein bands, Immobilon
Western HRP Substrate Luminol Reagent (cat. no. WBKLS0500; EMD
Millipore) and an enhanced chemiluminescence detection system
(Amersham Imager 600; GE Healthcare) were used. The loading control
used was β-actin. Image J software version 1.8.0 (National
Institutes of Health) was used to analyze the intensities of
western blot bands for the phosphorylated and non-phosphorylated
proteins. All primary and secondary antibodies are listed in
Table SIII.
Immunofluorescence staining
All three cell lines were seeded (3.5×10⁵
for 93T449 cells; 1.5×10⁵ for 94T778 cells;
3.0×10⁵ for SW872 cells) on tissue culture (TC)-treated
glass coverslips (cat. no. YA0351; Beijing Solarbio Science &
Technology Co., Ltd.) for 24 h, then fixed with 4% paraformaldehyde
for 20 min at room temperature, and incubated with a TYMS antibody
(1:50; cat. no. 9045; Cell Signaling Technology, Inc.) at 4°C
overnight. After washing, the cells were incubated with the goat
anti-rabbit IgG-FITC conjugated antibody (1:100; cat. no. ZF-0311;
OriGene Technologies, Inc.) for 30 min at room temperature, and the
nucleus was stained with DAPI solution in the dark for 10 min at
room temperature (0.5 µg/ml; cat. no. D523; Dojindo Molecular
Technologies, Inc.). Images were acquired using a Multiphoton Laser
Scanning Microscope (magnification, ×630; LSM780; Carl Zeiss
Inc.).
shRNA-mediated knockdown of TYMS
shRNA, targeting TYMS, was constructed, packaged and
purified by Shanghai GeneChem Co., Ltd. The lentiviral vector (cat.
no. GV493; Shanghai GeneChem Co., Ltd.) containing non-silencing
shRNA (Lenti-shCtrl) was used as the negative control. The stably
transfected cells were selected using 1 µg/ml puromycin for 93T449
and 94T778, and 2 µg/ml puromycin for SW872. After lentivirus
infection for 72–96 h, and screening by puromycin for 48 h, the
cells were used for subsequent experiments. The efficiency of
knockdown was confirmed using qPCR and western blot analysis.
Cell proliferation assay
A Cell Counting Kit-8 (CCK-8; Dojindo Molecular
Technologies, Inc.) assay was performed to evaluate cell
proliferation. Cells were plated in 96-well plates
(3×10³ per well for 93T449; 1.5×10³ per well
for 94T778 and SW872 cells), 10 µl of CCK-8 solution was added to
each well, followed by the measurement of absorbance at 450 nm
using a microplate reader (iMark; Bio-Rad Laboratories, Inc.) after
24, 48, 72, 96 or 120 h.
Colony-formation assay
Cells were plated in 6-well plates at a density of
300 cells per well. The cells were cultured at 37°C for three
weeks. Subsequently, colonies were fixed with 4% paraformaldehyde
(cat. no. P1110; Beijing Solarbio Science & Technology Co.,
Ltd.) for 20 min at room temperature and stained with 0.1% crystal
violet for 15 min (cat. no. G1063; Beijing Solarbio Science &
Technology Co., Ltd.) at room temperature. The number of colonies
were imaged and counted using the Promega Colony Counter software
version 10 (Promega Corporation).
TUNEL assay for cell apoptosis
analysis
All three cell lines were cultured on 96-well plates
(4.0×10⁴ cells per well for 93T449; 2.0×10⁴
cells per well for 94T778; 3.0×10⁴ cells per well for
SW872) for 24 h, then fixed with 4% paraformaldehyde (as
aforementioned), and subjected to cell apoptosis analysis using a
TUNEL cell apoptosis assay kit (cat. no. T2190; Beijing Solarbio
Science & Technology Co., Ltd.) according to the manufacturer's
protocol. The nucleus was stained using DAPI solution (0.5 µg/ml;
cat. no. D523; Dojindo Molecular Technologies, Inc.) in the dark
for 10 min at room temperature, and images were acquired using a
Multiphoton Laser Scanning Microscope (magnification, ×630; LSM780;
Carl Zeiss Inc.). The number of TUNEL-positive cells were counted
using the Promega Colony Counter software version 10 (Promega
Corporation).
Cell cycle analysis
Cells were collected for cell cycle analysis. First,
cells were digested with trypsin and washed with PBS, followed by
overnight fixation at 4°C with 75% ice-cold ethanol. On the second
day, the fixed cells were centrifuged at 250 × g, and washed with
PBS at room temperature, followed by incubation for 15 min at room
temperature in the dark with 300–500 µl PI/RNase Staining Buffer
(cat. no. 550825; BD Pharmingen; BD Biosciences). BD Accuri C6 flow
cytometry (Becton, Dickinson and Company) was used for cell
collection and the ModFit LT software version 3.2 (Verity Software
House, Inc.) was used for cell cycle analysis of the samples.
Migration and invasion assays
In the migration and invasion assays, chambers
(migration assay, cat. no. 3422; invasion assay, cat. no. 354480;
Corning, Inc.) were hydrated in serum-free RPMI-1640 medium (Gibco;
Thermo Fisher Scientific, Inc.) for at least 2 h at 37°C. A total
of 1×10⁵ 93T449 cells, 3×10⁴ 94T778 cells or
3×10⁴ SW872 cells were mixed in serum-free medium with a
total volume of 200 µl for migration or 500 µl for invasion. Cells
were added to the upper chamber, and 500 µl RPMI-1640 medium,
containing 20% FBS, was added to the lower compartment of the
chamber. After 24 h of incubation for migration and 48 h for
invasion, the cells in the upper chamber were removed. The cells
that had invaded/migrated were fixed with 4% paraformaldehyde for
20 min at room temperature and stained with 0.1% crystal violet for
15 min at room temperature. The stained cells were imaged in five
randomly selected fields using an optical microscope
(magnification, ×400), and the number of cells was calculated using
ImageJ version 1.52t (National Institutes of Health).
Protein microarray analysis
Protein microarray analysis was performed using a
Proteome Profiler™ Array-Human Phospho-Kinase Array kit (cat. no.
ARY003B; R&D Systems, Inc.) according to the manufacturer's
protocol.
Statistical analysis
Statistical analysis was performed using SPSS
version 20.0 (IBM Corp.) and GraphPad Prism version 7.0 (GraphPad
Software, Inc.). A two-tailed χ2 test and Fisher's exact
test were used to evaluate the association between TYMS expression
and clinicopathological characteristics of patients with RLPS.
Survival analysis was performed using Kaplan-Meier survival
analysis and a log-rank test. An independent samples t-test was
performed to compare two groups of quantitative data, and one-way
ANOVAs with post-hoc Tukey's tests was performed to compare
multiple groups of quantitative data. Results are presented as the
mean ± standard deviation. P<0.05 was considered to indicate a
statistically significant difference.
Results
Identification of DEGs in LPS
The microarray data of GSE21122 contained 89 LPS
samples and 9 NF samples. The cut-off criteria for a gene to be
considered as significantly differentially expressed were an
FDR<0.05 and |logFC|>1. A total of 855 DEGs were extracted
from GSE21122, of which 334 genes were upregulated and 521 genes
were downregulated (Fig. S1;
Table SIV). Fig. 1A shows the expression of DEGs in LPS
and NF samples, and Fig. 1B shows
the percentage of upregulated and downregulated genes.
 | Figure 1.DEGs identified between LPS and NF
samples and the functional genes screened from RLPS cells. (A)
Representative heatmap of DEGs between LPS and NF samples.
Hierarchical clustering analysis was performed using the expression
profiles of DEGs with |log FC|>1 and an FDR<0.05. Each column
represents a sample, and each row represents a DEG. Red, green and
black indicate that the expression levels of the gene was
upregulated, downregulated or was not significantly changed,
respectively. (B) Percentage of upregulated and downregulated DEGs.
(C) Suppression of 16 genes resulted in decreased proliferation of
94T778 cell. The results are presented as the fold increase in cell
growth relative to the first day. Cell proliferation was determined
using the high content screening method. After the target genes
were knocked down, cells exhibited reduced proliferative capacity
compared with the control cells. *P<0.05.
▲P<0.001. DEG, differentially expressed gene; FDR,
false discovery rate; LPS, liposarcoma; NF, normal fatty; FC, fold
change; sh, short hairpin. |
Gene expression in RLPS cells
To screen for functional genes which promoted the
occurrence of RLPS, RT-qPCR was used to determine the expression of
40 genes that were considered to be upregulated in the RLPS cell
line, 94T778, none of which have been previously studied in RLPS,
to the best of our knowledge (Table
SV). In 94T778 cells, 30 of the 40 examined genes exhibited
higher expression compared with the other 10 genes (Table SVI), suggesting that expression of
these 30 genes was relatively high in 94T778 cells and were thus
more likely to serve a role in the development of RLPS.
Knockdown of 16 genes significantly
reduces proliferation of 94T778 cells
Lentivirus-mediated shRNA was used to infect 94T778
cells and knockdown the 30 genes with high expression.
Subsequently, the effect of these genes on proliferation of 94T778
cells was evaluated using the HCS method. The results showed that
following knockdown, 16 of the 30 genes, including TYMS, KIF20A,
BUB1B, TMSB15A, KIAA0101, SNAI2, LMNB1, TIA1, TPX2, RRM2, PKM,
PTTG1, CKS2, ZWINT, MELK and RACGAP1, significantly slowed down the
proliferation of 94T778 cells (Table
SVII; Fig. 1C). Based on the
results of HCS, knockdown of the TYMS gene had the most notable
effect on the proliferative capacity of RLPS cells, and thus was
selected to further explore its effect on the biological behaviors
and the potential mechanisms involved in RLPS cells.
Expression of TYMS in RLPS
tissues
mRNA expression of TYMS in 21 RLPS tissues and 10 NF
tissues was assessed using qPCR. Relative mRNA expression of TYMS
was notably higher in RLPS tissues compared with the NF tissues
(P<0.001; Fig. S2A).
Furthermore, in the immunohistochemical assay, TYMS was expressed
in 35 of the 47 RLPS tissues (74.5%). IHC showed that TYMS was
predominantly localized in the cytoplasm (Fig. S2B).
Association of TYMS expression with
clinicopathological characteristics and survival of patients with
RLPS
As shown in Table
II, TYMS expression was 42.9, 91.3, 80.0 and 80.0% positive in
well-differentiated, dedifferentiated, myxoid/round cell and
pleomorphic subtypes, respectively (P=0.009). TYMS expression was
significantly higher in patients with high-grade RLPS compared with
patients with low-grade RLPS (low-grade vs. high-grade: 42.9% vs.
87.9%; P=0.003).
| Table II.Association between TYMS expression
and clinicopathological characteristics of patients with RLPS. |
Table II.
Association between TYMS expression
and clinicopathological characteristics of patients with RLPS.
| Clinicopathological
characteristics | Positive (%) | Negative (%) | P-value |
|---|
| Sex |
|
| 0.154 |
|
Male | 18 (66.7) | 9 (33.3) |
|
|
Female | 17 (85.0) | 3 (15.0) |
|
| Age, years |
|
| 0.505 |
|
<55 | 22 (71.0) | 9 (29.0) |
|
|
≥55 | 13 (81.2) | 3 (18.8) |
|
| Tumor number |
|
| 0.700 |
|
Single | 28 (75.7) | 9 (24.3) |
|
|
Multiple | 7 (70.0) | 3 (30.0) |
|
| Tumor size, cm |
|
| 0.723 |
|
<15 | 6 (85.7) | 1 (14.3) |
|
|
15-30 | 18 (69.2) | 8 (30.8) |
|
| ≥0 | 11 (78.6) | 3 (21.4) |
|
| Histological
subtype |
|
| 0.009 |
|
Well-differentiated | 6 (42.9) | 8 (57.1) |
|
|
Dedifferentiated | 21 (91.3) | 2 (8.7) |
|
|
Myxoid/Round cell | 4 (80.0) | 1 (20.0) |
|
|
Pleomorphic | 4 (80.0) | 1 (20.0) |
|
| Grade |
|
| 0.003 |
|
Low-grade | 6 (42.9) | 8 (57.1) |
|
|
High-grade | 29 (87.9) | 4 (12.1) |
|
In the survival analysis, five patients were lost to
follow-up, and in the remaining 42 cases, the median OS time was
29.21±24.68 months in the TYMS-positive patients and 38.72±10.16
months in TYMS-negative patients. The median DFS was 26.20±23.53
months in TYMS-positive patients and 35.58±9.83 months in
TYMS-negative patients. Kaplan-Meier survival analysis and a
log-rank test showed that TYMS expression was negatively associated
with both OS and DFS time of patients with RLPS (Fig. S2C and D; OS, P=0.024; DFS,
P=0.030). Furthermore, survival analysis of TYMS and sarcoma using
GEPIA database showed that patients with sarcoma and TYMS-high
expression had lower OS and DFS time compared with those with
TYMS-low expression (Fig. S3A and
B; OS, P=0.0065; DFS, P=0.019). The aforementioned results
showed that high TYMS expression was associated with progression of
RLPS or sarcoma.
Expression of TYMS in RLPS cell
lines
Protein expression of TYMS was evaluated by western
blotting in three human RLPS cell lines (93T449, 94T778 and SW872).
The TYMS protein levels were considerably high in all three RLPS
cell lines, particularly in the 93T449 and SW872 (Fig. S4A). TYMS was found to be localized
in the cytoplasm in all three human RLPS cell lines (Fig. S4B). Therefore, all three cell lines
were used for subsequent experiments.
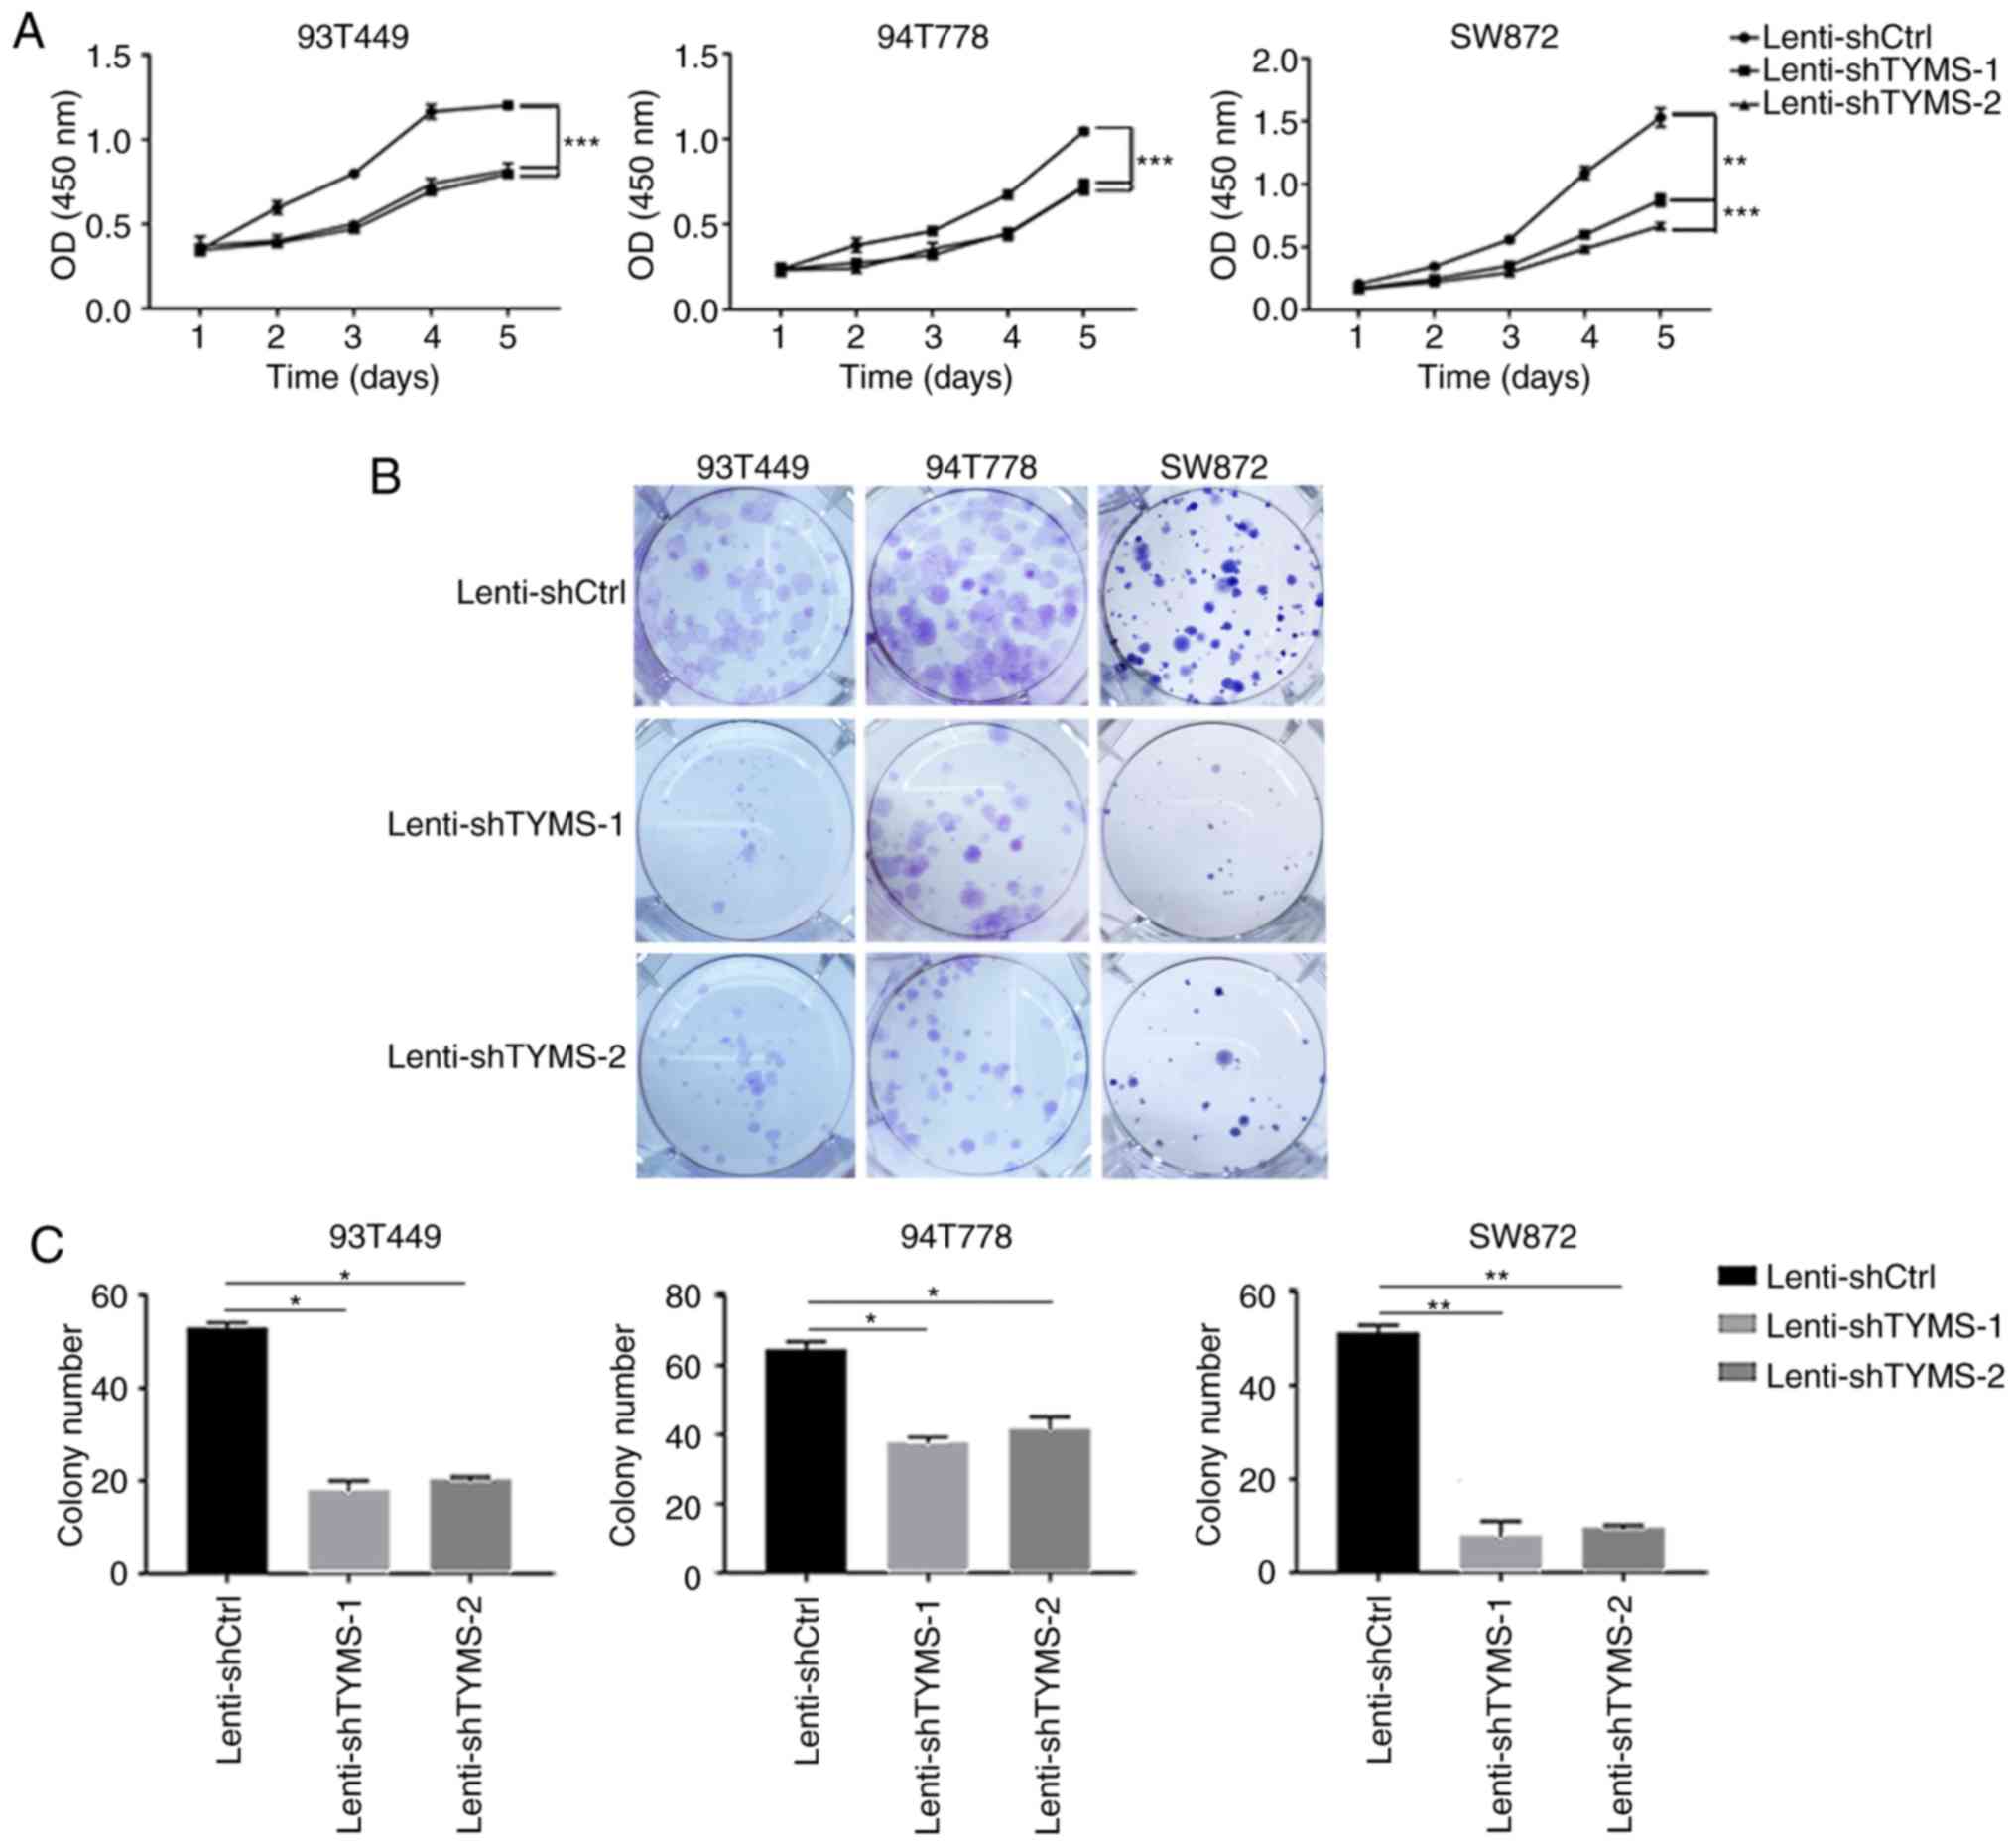
Knockdown of TYMS expression reduces
RLPS cell proliferation and colony formation, and promotes
apoptosis
To examine the role of TYMS in RLPS cells, 93T449,
94T778 and SW872 cells were transfected with lentiviral vectors
containing non-specific shRNA (Lenti-shCtrl) and shRNAs targeting
TYMS (Lenti-shTYMS-1 and Lenti-shTYMS-2). The transfection
efficiency was confirmed using RT-qPCR and western blotting
(Fig. S4C and D). The results of a
CCK-8 assay showed that TYMS downregulation significantly reduced
cell viability (Fig. 2A; P<0.01)
and decreased colony-forming capacity (Fig. 2B and C; P<0.05) in all three RLPS
cell lines. To evaluate the apoptotic status of cell lines
following knockdown of TYMS, TUNEL staining was performed on the
RLPS cell lines. Lenti-shTYMS cells showed a significant increase
in apoptosis compared with the Lenti-shCtrl transfected cells
(Fig. S5).
Knockdown of TYMS promotes progression
of the cell cycle from G1 to S phase
TYMS downregulation decreased cell proliferation,
therefore, cycle cell distribution was assessed to determine
whether this attenuation was associated with cell cycle arrest.
Flow cytometry analysis demonstrated that TYMS knockdown promoted
progression of the cell cycle from G1 to S phase. As
shown in Fig. 3A and B, in 93T449
cells, the proportion of cells in the G1 phase decreased
significantly, from 88.05±1.01% in Lenti-shCtrl cells to
84.64±0.42% and 84.79±0.40% in Lenti-shTYMS-1 and Lenti-shTYMS-2
cells, respectively (both P<0.05). The proportion of S phase
cells increased significantly. Similar results were observed in the
94T778 and SW872 cells. These results suggest that TYMS
downregulation arrests the cell cycle at the S phase.
 | Figure 3.TYMS knockdown promotes progression
of the cell cycle from the G1 phase to the S phase. (A)
Cell cycle analysis showed that the proportion of G1
phase cells decreased and the proportion of S phase cells increased
significantly in cells infected with Lenti-shTYMS compared with the
control cells. (B) Quantitative analysis of cell cycle
distribution. In 93T449 cells, the proportion of cells at the
G1 phase decreased significantly from 88.05±1.01% in
Lenti-shCtrl cells to 84.64±0.42% and 84.79±0.40% in Lenti-shTYMS-1
and Lenti-shTYMS-2 cells, respectively. *P<0.05. The proportion
of S phase cells increased significantly from 9.52±0.86% in
Lenti-shCtrl cells to 12.75±1.17% and 11.91±0.12% in Lenti-shTYMS-1
and Lenti-shTYMS-2 cells, respectively. *P<0.05. In 94T778
cells, the proportion of cells at the G1 phase decreased
significantly from 86.76±1.22% in Lenti-shCtrl cells to 79.90±0.67%
and 83.10±0.48% in Lenti-shTYMS-1 and Lenti-shTYMS-2 cells,
respectively. *P<0.05. The proportion of S phase cells increased
significantly from 7.39±0.13% in Lenti-shCtrl cells to 13.68±0.8%
and 10.47±0.53% in Lenti-shTYMS-1 and Lenti-shTYMS-2 cells,
respectively. *P<0.05. **P<0.01. In SW872 cells, the
proportion of cells at the G1 phase decreased
significantly from 86.65±0.32% in Lenti-shCtrl cells to 81.87±0.59%
and 83.72±0.91% in Lenti-shTYMS-1 and Lenti-shTYMS-2 cells,
respectively. *P<0.05. The proportion of S phase cells increased
significantly from 6.39±0.12% in Lenti-shCtrl cells to 14.00±0.22%
and 9.87±0.45% in Lenti-shTYMS-1 and Lenti-shTYMS-2 cells,
respectively. **P<0.01. ***P<0.001. TYMS, thymidylate
synthase; sh, short hairpin. |
Downregulation of TYMS expression
inhibits migration and invasion of RLPS cells
In order to determine the effect of TYMS expression
on cell migration and invasion, Transwell migration and invasion
assays were performed. As shown in Fig.
4, in 93T449 cells, the number of migrated cells per field was
95±35 in shTYMS-1 cells (P<0.001) and 102±10 in shTYMS-2 cells
(P<0.001) vs. 1,234±114 in the control cells; the number of
invaded cells per field was 118±11 in shTYMS-1 cells (P<0.001)
and 124±21 in shTYMS-2 cells (P<0.001) vs. 849±71 in control
cells. Similar results were obtained in 94T778 and SW872 cells. The
results showed that TYMS knockdown significantly decreased both the
migration and invasive capacities of RLPS cells, thereby indicating
that TYMS downregulation may inhibit RLPS progression.
TYMS knockdown may result in reduced
activity of the JAK/STAT signaling pathway in RLPS cells
The aforementioned results suggest that TYMS serves
an important role in the development and progression of RLPS;
however, the mechanism is unclear. Thus the possible mechanisms of
TYMS in RLPS cells (94T778 and SW872) were assessed using protein
microarray analysis. The results showed that phospho-STAT3
(Ser727), phospho-STAT5 (Y694) and phospho-STAT6 (Y641) were
downregulated in Lenti-shTYMS transfected 94T778 and SW872 cells
(Fig. S6). Therefore, it was
hypothesized that TYMS knockdown may have resulted in decreased
activity of the JAK/STAT signaling pathway. Western blotting was
used to assess the expression levels of major proteins associated
with the JAK/STAT signaling pathway in Lenti-shCtrl and
Lenti-shTYMS cells, including total Jak1-3 and Tyk2 of the JAK
family and the corresponding phosphorylated proteins, as well as
the expression levels of total STAT1, STAT3, STAT5 and STAT6, and
the corresponding phosphorylated proteins of the STAT family. The
results showed that TYMS knockdown resulted in downregulation of
the expression of phosphorylated Tyk2 in Lenti-shTYMS cells
compared with the control cells, and the expression of
phosphorylated Jak1, total Jak2, phosphorylated Jak2, total Jak3
and phosphorylated Jak3 were not detected. Meanwhile,
phosphorylated STAT1 (Tyr701), phosphorylated STAT3 (Ser727),
phosphorylated STAT5 (Y694) and phosphorylated STAT6 (Y641) in the
STAT family were significantly downregulated in Lenti-shTYMS cells,
consistent with the results of protein microarray analysis
(Fig. 5; Fig. S7). These results suggest that TYMS
knockdown may downregulate the activity of the JAK/STAT signaling
pathway in RLPS cells, thereby inhibiting the progression of
RLPS.
 | Figure 5.The JAK/STAT signaling pathway is
downregulated after TYMS knockdown in RLPS cells. (A) Phospho-Tyk2
expression, in the JAK family, was downregulated in Lenti-shTYMS
cells compared with control cells. (B) Phospho-STAT1 (Tyr701) and
phospho-STAT3 (Ser727) expression, in the STAT family, were
downregulated in Lenti-shTYMS cells (C) Phospho-STAT5 (Y694) and
phospho-STAT6 (Y641) expression, in the STAT family, were
downregulated in Lenti-shTYMS cells. TYMS, thymidylate synthase;
sh, short hairpin; RLPS, retroperitoneal soft tissue sarcoma;
JAK/STAT, Janus kinase/signal transducers and activators of
transcription. |
Discussion
Complete surgical resection is the most effective
treatment for RLPS (3). However,
local recurrence is frequently observed, and ~70% of
RLPS-associated deaths occur without distant metastasis despite
surgical resection, highlighting the need for effective therapeutic
targets and combinative treatments (4). In the present study, the microarray
expression data between LPS and NF samples were compared, and 855
DEGs were identified (334 upregulated and 521 downregulated genes).
Subsequently, HCS was used to evaluate the effect of the genes that
exhibited high expression on the proliferative ability of RLPS
cells to determine the functional genes with a strong influence on
the progression of RLPS. Since HCS is a preliminary screening tool,
separate transfection controls were not performed for each gene
presented in Fig. 1C, and this is
the usual practice when using the HCS technology. Among the DEGs
that were assessed in the HCS experiments, TYMS showed the most
notable effect, and was thus used for all subsequent experiments in
RLPS tissues and in vitro.
TYMS is an essential enzyme involved in DNA
replication and repair, which serves an important role in the
biosynthesis of deoxythymidine monophosphate (dTMP) (17). The association between TYMS and
tumors has been reported previously. TYMS overexpression is
associated with poor disease-specific survival, poor local
recurrence-free survival and other adverse clinical behaviors in
various solid tumors, such as nasopharyngeal carcinoma (18), lung cancer (19), gastric cancer (20), mesothelioma (21) and prostate cancer (22). TYMS can be a useful biomarker for
predicting 5-fluorouracil (5-FU) resistance, if expression is
analyzed in circulating tumor cells, and the expression levels of
intra-tumoral TYMS mRNA (paraffin-embedded tissue) can
independently predict the survival of patients with metastatic
colorectal cancer treated with 5-FU and oxaliplatin (23). In addition, TYMS is a malignant
tumor marker with a high degree of specificity and sensitivity for
the metastasis of low-grade glioma (24). In HLA-A2(+) colon cancer, TYMS may
serve as an appropriate target for specific immunotherapy (25).
In the present study, relative mRNA expression of
TYMS was notably higher in RLPS tissues compared with NF tissues.
TYMS protein expression was assessed in RLPS samples and the
results showed its expression was present in the majority of
samples (74.5%). For patients with well-differentiated,
dedifferentiated, myxoid/round cell and pleomorphic subtypes, TYMS
was 42.9, 91.3, 80.0 and 80.0% positive, respectively (P=0.009).
The expression of TYMS was higher in patients with high-grade RLPS
(P=0.003). Additionally, survival analysis showed a significant
negative association between TYMS expression and survival (OS and
DFS) of patients with RLPS. Furthermore, survival analysis of TYMS
and sarcoma using GEPIA database also showed that patients with
sarcoma and TYMS-high expression had poorer survival (OS and DFS)
compared with those with TYMS-low expression, consistent with the
results of tissue expression analysis, together suggesting that
high expression of TYMS may be an adverse factor for post-operative
survival of patients with RLPS or sarcoma.
CCK-8 and colony-formation assays demonstrated that
downregulation of TYMS may inhibit the proliferation of RLPS in
vitro. Consistent with the present study, several studies also
reported that downregulation or inhibition of TYMS reduced
proliferation, such as in mesothelioma, bladder cancer, colorectal
cancer and glioblastoma (21,26–28).
Ligabue et al (29), showed that inhibition of TYMS
significantly interfered with cell cycle progression in ovarian
cystadenocarcinoma cells, resulting in the accumulation of cells in
the S phase and a substantial decrease in cells in the
G0-G1 phase and G2-M phases. The
findings of the present study showed that downregulation of TYMS
promoted cell transition from G1 to S phase, consistent
with the study by Ligabue et al (29). Furthermore, migration and invasion
of cells with TYMS expression knocked down was decreased compared
with the control cells. Together, the results suggest that TYMS
inhibition may slow down the progression of RLPS.
Following TYMS knockdown, protein microarray
analysis was performed. Since protein microarray analysis is a
preliminary tool for pathway study, it is the usual practice for
not analyzing the respective non-phosphorylated proteins of
phosphorylated proteins. From the protein microarray analysis
results, it was shown that activity of the JAK/STAT signaling
pathway was downregulated in RLPS cells. Cytokines bind to their
cytokine receptors and induce conformational changes, resulting in
receptor dimerization-JAK tyrosine phosphorylation. This effect
generates docking sites for STATs, leading to STAT phosphorylation
with the phosphorylated dimers acting as transcription factors. The
JAK/STAT pathway is one of the major signaling cascades, which
mediates cytokine receptor-derived signaling, and serves a role in
hematopoietic cell proliferation and differentiation. Multiple
hematological malignancies exhibit inappropriate activation of the
JAK signaling pathway, as a result of a variety of mechanisms,
including the downregulation of negative regulators, activating
mutations and fusions (30).
Activation of the JAK/STAT pathway is a major carcinogenic event in
human liver cancer (31). The
results of the present study showed that downregulation of TYMS
expression may result in the downregulation of the activity of
JAK/STAT signaling pathway in RLPS cells. In agreement with this,
it was previously reported that inhibition of the JAK/STAT pathway
reduced cell proliferation and induced apoptosis in cutaneous
T-cell lymphomas (32). In
addition, small molecule inhibitors targeting the JAK/STAT pathway
effectively decreased cell proliferation in Akt/β-catenin-driven
HCC (31).
The results of the protein microarray analysis
showed increased expression of phosphorylated P53 following TYMS
knockdown. Two previous studies demonstrated that the p53-dependent
response limited the viability of mammalian haploid cells, likely
by increasing cell apoptosis, and p53 deletion increased the
viability and proliferation of the haploid cells (33,34).
This suggests that decreased RLPS cell viability and increased
apoptosis, following TYMS knockdown may be associated with an
increase in P53. Thus, future studies are required to explore the
association between P53 and TYMS.
In the present study, shRNA mediated knockdown of
TYMS did not result in a complete silencing of TYMS expression at
the protein level. Knocking out target genes in haploid embryonic
stem cells not only results in complete silencing at the mRNA
level, but also guarantees that mutations, which only affected one
set of chromosomes carried by haploid cells, are represented in the
corresponding phenotypes (35).
Thus, in future studies, the functions of TYMS and the role of
JAK/STAT pathway using haploid cells and more robust gene knockout
techniques will be assessed.
To the best of our knowledge, the present study is
the first to examine the effects of TYMS on the biological
behaviors of RLPS cells and the underlying mechanisms.
Additionally, it was demonstrated that downregulation of TYMS
decreased biological behaviors of RLPS cells, likely through
downregulation of the JAK/STAT signaling pathway activity. However,
there are still some limitations in the present study.
Overexpression of TYMS in TYMS knockdown cell lines and their
effect on rescuing the results should be conducted in order to
further verify the role of TYMS in RLPS. Additionally, the deeper
mechanisms underlying the effect of TYMS on the JAK/STAT signaling
pathway in RLPS will be further investigated in vitro and
in vivo. As many other genes were screened, it is intended
to examine their effects more extensively in future studies, in
order to fully elucidate the pathogenesis of RLPS.
In conclusion, the results of the present study
showed that TYMS was overexpressed in RLPS tissues, and
downregulation of TYMS inhibited tumor progression, likely through
downregulation of the JAK/STAT signaling pathway in RLPS, using
bioinformatics analysis and biological verification. Therefore,
TYMS may be used as a potential effective therapeutic target for
the treatment of RLPS by using specific inhibitors. In addition,
targeting the JAK/STAT pathway may also serve as a promising
strategy for the treatment of RLPS.
Supplementary Material
Supporting Data
Acknowledgements
Not applicable.
Funding
This study was supported by Beijing Municipal
Administration of Hospital's Ascent Plan (grant no. DFL20181104);
Beijing Municipal Natural Science Foundation (grant no. Z190022 and
7153161); Beijing Municipal Administration of Hospitals' Youth
Programme (grant no. QML20181104); Beijing Municipal Administration
of Hospitals Clinical Medicine Development of Special Funding
Support (grant no. XMLX201708); the Capital Health Research and
Development of Special Funds (grant no. 2020-1-1021); and the
National Natural Science Funding (grant no. 31770836).
Availability of data and materials
The datasets used and/or analyzed during the present
study are available from the corresponding author on reasonable
request.
Authors' contributions
SZ performed the experimental operation, data
collection, data analysis and was a major contributor in writing
the manuscript. CYH and XYT conceived the study and revised the
manuscript. LY, CC and ZW performed acquisition and analysis of
data. JHW and XYG collected the specimens used in the study. MZ and
BD prepared and visualized the slices. All authors read and
approved the final manuscript. All authors read and approved the
final version of the manuscript.
Ethics approval and consent to
participate
This study was approved by the Ethics Committee of
Peking University Cancer Hospital (approval no. 2019KT19) and
written informed consent was obtained from each participant.
Patient consent for publication
Not applicable.
Competing interests
The authors declare that they have no competing
interests.
Glossary
Abbreviations
Abbreviations:
|
DEG
|
differentially expressed gene
|
|
DFS
|
disease-free survival
|
|
HCS
|
high content screening
|
|
JAK/STAT
|
Janus kinase/signal transducers and
activators of transcription
|
|
NF
|
normal fatty
|
|
OS
|
overall survival
|
|
RLPS
|
retroperitoneal liposarcoma
|
|
RPS
|
retroperitoneal soft tissue
sarcoma
|
|
TYMS
|
thymidylate synthase
|
References
|
1
|
Messiou C, Moskovic E, Vanel D, Morosi C,
Benchimol R, Strauss D, Miah A, Douis H, van Houdt W and Bonvalot
S: Primary retroperitoneal soft tissue sarcoma: Imaging
appearances, pitfalls and diagnostic algorithm. Eur J Surg Oncol.
43:1191–1198. 2017. View Article : Google Scholar : PubMed/NCBI
|
|
2
|
Vijay A and Ram L: Retroperitoneal
liposarcoma: A comprehensive review. Am J Clin Oncol. 38:213–219.
2015. View Article : Google Scholar : PubMed/NCBI
|
|
3
|
Paloyo SR, Ramirez AD, David-Paloyo FP and
Dofitas RB: Wide excision of a retroperitoneal liposarcoma with en
bloc ureterectomy and renal salvage by autotransplantation. Case
Rep Transplant. 2019:97251692019.PubMed/NCBI
|
|
4
|
Bagaria SP, Gabriel E and Mann GN:
Multiply recurrent retroperitoneal liposarcoma. J Surg Oncol.
117:62–68. 2018. View Article : Google Scholar : PubMed/NCBI
|
|
5
|
Molina G, Hull MA, Chen YL, DeLaney TF, De
Amorim Bernstein K, Choy E, Cote G, Harmon DC, Mullen JT and Haynes
AB: Preoperative radiation therapy combined with radical surgical
resection is associated with a lower rate of local recurrence when
treating unifocal, primary retroperitoneal liposarcoma. J Surg
Oncol. 114:814–820. 2016. View Article : Google Scholar : PubMed/NCBI
|
|
6
|
Mansfield SA, Pollock RE and Grignol VP:
Surgery for abdominal well-differentiated liposarcoma. Curr Treat
Options Oncol. 19:12018. View Article : Google Scholar : PubMed/NCBI
|
|
7
|
Cheng W, Ren X, Zhang C, Cai J, Liu Y, Han
S and Wu A: Bioinformatic profiling identifies an immune-related
risk signature for glioblastoma. Neurology. 86:2226–2234. 2016.
View Article : Google Scholar : PubMed/NCBI
|
|
8
|
Lin H, Zhang Q, Li X, Wu Y, Liu Y and Hu
Y: Identification of key candidate genes and pathways in hepatitis
B virus-associated acute liver failure by bioinformatical analysis.
Medicine (Baltimore). 97:e96872018. View Article : Google Scholar : PubMed/NCBI
|
|
9
|
Guo Y, Bao Y, Ma M and Yang W:
Identification of key candidate genes and pathways in colorectal
cancer by integrated bioinformatical analysis. Int J Mol Sci.
18:7222017. View Article : Google Scholar
|
|
10
|
Lee S and Howell BJ: High-content
screening: Emerging hardware and software technologies. Methods
Enzymol. 414:468–483. 2006. View Article : Google Scholar : PubMed/NCBI
|
|
11
|
Barretina J, Taylor BS, Banerji S, Ramos
AH, Lagos-Quintana M, Decarolis PL, Shah K, Socci ND, Weir BA, Ho
A, et al: Subtype-specific genomic alterations define new targets
for soft-tissue sarcoma therapy. Nat Genet. 42:715–721. 2010.
View Article : Google Scholar : PubMed/NCBI
|
|
12
|
Irizarry RA, Hobbs B, Collin F,
Beazer-Barclay YD, Antonellis KJ, Scherf U and Speed TP:
Exploration, normalization, and summaries of high density
oligonucleotide array probe level data. Biostatistics. 4:249–264.
2003. View Article : Google Scholar : PubMed/NCBI
|
|
13
|
Wettenhall JM and Smyth GK: limmaGUI: A
graphical user interface for linear modeling of microarray data.
Bioinformatics. 20:3705–3706. 2004. View Article : Google Scholar : PubMed/NCBI
|
|
14
|
Benjamini Y and Hochberg Y: Controlling
the false discovery rate: A practical and powerful approach to
multiple testing. J R Stat Soc B (Methodological). 57:289–300.
1995. View Article : Google Scholar
|
|
15
|
Tang S, Jing H, Huang Z, Huang T, Lin S,
Liao M and Zhou J: Identification of key candidate genes in
neuropathic pain by integrated bioinformatic analysis. J Cell
Biochem. 121:1635–1648. 2020. View Article : Google Scholar : PubMed/NCBI
|
|
16
|
Livak KJ and Schmittgen TD: Analysis of
relative gene expression data using real-time quantitative PCR and
the 2(-Delta Delta C(T)) method. Methods. 25:402–408. 2001.
View Article : Google Scholar : PubMed/NCBI
|
|
17
|
Balboa-Beltrán E, Duran G, Lamas MJ,
Carracedo A and Barros F: Long survival and severe toxicity under
5-fluorouracil-based therapy in a patient with colorectal cancer
who harbors a germline codon-stop mutation in TYMS. Mayo Clin Proc.
90:1298–1303. 2015. View Article : Google Scholar : PubMed/NCBI
|
|
18
|
Lee SW, Chen TJ, Lin LC, Li CF, Chen LT,
Hsing CH, Hsu HP, Tsai CJ, Huang HY and Shiue YL: Overexpression of
thymidylate synthetase confers an independent prognostic indicator
in nasopharyngeal carcinoma. Exp Mol Pathol. 95:83–90. 2013.
View Article : Google Scholar : PubMed/NCBI
|
|
19
|
Lam SK, Mak JC, Zheng CY, Li YY, Kwong YL
and Ho JC: Downregulation of thymidylate synthase with arsenic
trioxide in lung adenocarcinoma. Int J Oncol. 44:2093–2102. 2014.
View Article : Google Scholar : PubMed/NCBI
|
|
20
|
Formentini A, Henne-Bruns D and Kornmann
M: Thymidylate synthase expression and prognosis of patients with
gastrointestinal cancers receiving adjuvant chemotherapy: A review.
Langenbecks Arch Surg. 389:405–413. 2004. View Article : Google Scholar : PubMed/NCBI
|
|
21
|
Lam SK, Li YY, Zheng CY and Ho JC:
Downregulation of thymidylate synthase and E2F1 by arsenic trioxide
in mesothelioma. Int J Oncol. 46:113–122. 2015. View Article : Google Scholar : PubMed/NCBI
|
|
22
|
Burdelski C, Strauss C, Tsourlakis MC,
Kluth M, Hube-Magg C, Melling N, Lebok P, Minner S, Koop C, Graefen
M, et al: Overexpression of thymidylate synthase (TYMS) is
associated with aggressive tumor features and early PSA recurrence
in prostate cancer. Oncotarget. 6:8377–8387. 2015. View Article : Google Scholar : PubMed/NCBI
|
|
23
|
Abdallah EA, Fanelli MF, Buim ME, Machado
Netto MC, Gasparini Junior JL, Souza E, Silva V, Dettino AL,
Mingues NB, Romero JV, et al: Thymidylate synthase expression in
circulating tumor cells: A new tool to predict 5-fluorouracil
resistance in metastatic colorectal cancer patients. Int J Cancer.
137:1397–1405. 2015. View Article : Google Scholar : PubMed/NCBI
|
|
24
|
Ding B, Gao M, Li Z, Xu C, Fan S and He W:
Expression of TYMS in lymph node metastasis from low-grade glioma.
Oncol Lett. 10:1569–1574. 2015. View Article : Google Scholar : PubMed/NCBI
|
|
25
|
Shichijo S, Azuma K, Komatsu N, Ito M,
Maeda Y, Ishihara Y and Itoh K: Two proliferation-related proteins,
TYMS and PGK1, could be new cytotoxic T lymphocyte-directed
tumor-associated antigens of HLA-A2+ colon cancer. Clin Cancer Res.
10:5828–5836. 2004. View Article : Google Scholar : PubMed/NCBI
|
|
26
|
Mpindi JP, Sara H, Haapa-Paananen S,
Kilpinen S, Pisto T, Bucher E, Ojala K, Iljin K, Vainio P, Björkman
M, et al: GTI: A novel algorithm for identifying outlier gene
expression profiles from integrated microarray datasets. PLoS One.
6:e172592011. View Article : Google Scholar : PubMed/NCBI
|
|
27
|
Abu Lila AS, Moriyoshi N, Fukushima M,
Huang CL, Wada H and Ishida T: Metronomic S-1 dosing and
thymidylate synthase silencing have synergistic antitumor efficacy
in a colorectal cancer xenograft model. Cancer Lett. 400:223–231.
2017. View Article : Google Scholar : PubMed/NCBI
|
|
28
|
Ide H, Kikuchi E, Hasegawa M, Hattori S,
Yasumizu Y, Miyajima A and Oya M: Therapeutic enhancement of S-1
with CPT-11 through down-regulation of thymidylate synthase in
bladder cancer. Cancer Med. 2:488–495. 2013. View Article : Google Scholar : PubMed/NCBI
|
|
29
|
Ligabue A, Marverti G, Liebl U and
Myllykallio H: Transcriptional activation and cell cycle block are
the keys for 5-fluorouracil induced up-regulation of human
thymidylate synthase expression. PLoS One. 7:e473182012. View Article : Google Scholar : PubMed/NCBI
|
|
30
|
Maude SL, Dolai S, Delgado-Martin C,
Vincent T, Robbins A, Selvanathan A, Ryan T, Hall J, Wood AC,
Tasian SK, et al: Efficacy of JAK/STAT pathway inhibition in murine
xenograft models of early T-cell precursor (ETP) acute
lymphoblastic leukemia. Blood. 125:1759–1767. 2015. View Article : Google Scholar : PubMed/NCBI
|
|
31
|
Toh TB, Lim JJ, Hooi L, Rashid M and Chow
EK: Targeting Jak/Stat pathway as a therapeutic strategy against
SP/CD44+ tumorigenic cells in Akt/β-catenin-driven hepatocellular
carcinoma. J Hepatol. 72:104–118. 2020. View Article : Google Scholar : PubMed/NCBI
|
|
32
|
Yang H, Ma P, Cao Y, Zhang M, Li L, Wei J,
Tao L and Qian K: ECPIRM, a potential therapeutic agent for
cutaneous T-cell lymphoma, inhibits cell proliferation and promotes
apoptosis via a JAK/STAT pathway. Anticancer Agents Med Chem.
18:401–411. 2018. View Article : Google Scholar : PubMed/NCBI
|
|
33
|
Olbrich T, Mayor-Ruiz C, Vega-Sendino M,
Gomez C, Ortega S, Ruiz S and Fernandez-Capetillo O: A
p53-dependent response limits the viability of mammalian haploid
cells. Proc Natl Acad Sci USA. 114:9367–9372. 2017. View Article : Google Scholar : PubMed/NCBI
|
|
34
|
Peng K, Li X, Wu C, Wang Y, Yu J, Zhang J,
Gao Q, Zhang W, Zhang Q, Fan Y, et al: Derivation of haploid
trophoblast stem cells via conversion in vitro. iScience.
11:508–518. 2019. View Article : Google Scholar : PubMed/NCBI
|
|
35
|
Li Y and Shuai L: A versatile genetic
tool: Haploid cells. Stem Cell Res Ther. 8:1972017. View Article : Google Scholar : PubMed/NCBI
|
|
36
|
Fletcher CDM, Bridge JA, Hogendoorn P and
Mertens F: World Health Organization, International Agency for
Research on Cancer. WHO classification of tumours of soft tissue
and bone. (4th). (Lyon). IARC Press. 2013.
|
|
37
|
Trojani M, Contesso G, Coindre JM, Rouesse
J, Bui NB, de Mascarel A, Goussot JF, David M, Bonichon F and
Lagarde C: Soft-tissue sarcomas of adults; study of pathological
prognostic variables and definition of a histopathological grading
system. Int J Cancer. 33:37–42. 1984. View Article : Google Scholar : PubMed/NCBI
|