Introduction
Esophageal cancer (EC), including esophageal
squamous cell carcinoma (ESCC) and esophageal adenocarcinoma (EAC)
(1), is one of the most lethal and
common types of cancers associated with a high morbidity and
mortality, posing a public health issue (2–4). The
factors involved in ESCC are complex, and include age, sex, stages
and body mass index (5–7). In the majority of cases, patients are
diagnosed at advanced stages of disease, and thus have passed the
point at which treatment may be effective. Even with the assistance
of surgery and several other adjuvant therapies, such as
chemoradiotherapy, radiotherapy and molecular-targeted therapy,
patients with EC have a 5-year survival of 20–25% (8,9).
Although a number of genes are related to the development of ESCC,
early diagnosis, treatment and prognosis assessment of ESCC are
difficult (10). Therefore, it is
of utmost importance to identify novel molecular markers for the
early diagnosis and prognosis of ESCC.
Previously, high-throughput microarray analysis,
which has yielded numerous clinical data, was considered an
efficient tool for determining underlying molecular mechanisms and
genetic alterations in cancer progression (11,12). A
large portion of these data are freely accessible to researchers
and the public; bioinformatics has a number of powerful algorithms,
software and databases (13,14).
RNA microarrays have been widely applied in cancer diagnosis,
metastasis and cancer through gene expression profiling, available
in the Gene Expression Omnibus (GEO) database (15). GEO is an open genomics data database
which provides clues to the molecular mechanisms underlying the
initiation and evolution of ESCC. In the present study, four
microarray datasets (GSE63941, GSE26886, GSE17351 and GSE77861)
were downloaded from GEO and the shared differentially expressed
genes (DEGs) involved in ESCC were investigated using the GEO2R
online analysis tool (16).
Protein-protein interaction (PPI), Gene Ontology (GO) and Kyoto
Encyclopedia of Genes and Genomes (KEGG) analysis were used to
preliminary comprehend the molecular mechanisms behind the core
genes. Oncomine, Gene Expression Profiling Interactive Analysis
(GEPIA) and UALCAN were used to validate the expression levels and
prognostic value of MCM6 in ESCC. The results may provide new
insight into potential biomarkers for ESCC. Finally, the role of
MCM6 in ESCC cell lines was examined.
Maintenance complex components (MCMs) have been
identified to play an important role in eukaryotic genome
replication (17). During the late
M to early G1 phase of the cell cycle, the MCM2-7 complex binds to
the origin of DNA replication (18). In eukaryotic cells, the complex
plays the role of replicative helicase, which is essential for the
initiation and elongation of DNA replication (19,20).
MCM6 is a member of the MCM protein complex; a number of studies
have verified the abnormal expression of MCM6 and its tumorigenic
role in various types of cancer, such as meningiomas, non-small
cell lung carcinoma, chondrosarcoma, endometrioid endometrial
adenocarcinoma, colorectal cancer (21–25).
An elevated MCM6 level has also been reported in serum in
hepatocellular carcinoma (26,27).
Furthermore, an elevated MCM6 expression has been shown to be
associated with a high risk of recurrence in meningioma, which
suggests that MCM6 is a promising prognostic marker (21). However, little is known regarding
its role in ESCC.
The aim of the present study was to use
bioinformatics methods obtained from the GEO database to identify
hub genes involved in the progression of ESCC. Subsequently, its
expression and molecular functions were validated by performing a
series of experiments.
Materials and methods
Extraction of microarray gene
expression profiles from the GEO database
In total, 4 microarray datasets (GSE63941, GSE26886,
GSE17351 and GSE77861), which were related to ESCC based on the
platform of GPL570 Affymetrix Human Genome U133 Plus 2.0 Array,
were extracted from the GEO database (http://www.ncbi.nlm.nih.gov/gds). The screening
criteria for the datasets were as follows: i) Available comparison
datasets between ESCC tumor tissues or cell lines and the normal
control; ii) pre-operative treatment without esophageal resection
and cell lines without drug stimulation; iii) the number of samples
in datasets >5; iv) datasets included RNA-Seq data. The 4
datasets comprised 78 samples, which included 22 ESCC cell lines,
31 ESCC tissues and 25 normal controls. The present study used data
based on the GEO database and thus did not require ethics
approval.
Data processing and identification of
DEGs
GEO2R, which is an R programming language-based
online analysis tool, was used in the 4 profiles, respectively, to
identify the DEGs (https://www.ncbi.nlm.nih.gov/geo/geo2r/) (15). The criteria of selection were
adjusted P-values <0.05, P<0.05 and |log2FC(fold change) |≥1.
Online Venn diagram software (http://bioinformatics.psb.ugent.be/webtools/Venn/) was
used to obtain the intersection of the DEGs of the 4 datasets,
which was used for the subsequent analysis (28). In addition, genes with multiple
probes were averaged or removed.
PPI network and module analysis of
DEGs
The search tool for the retrieval of interacting
genes (STRING) (http://string-db.org/), an online
tool for searching the association between various proteins, was
used to extract interacting genes (29,30).
DEGs with co-expression coefficients >0.4 were extracted from
STRING. The associations among these genes were visualized using
Cytoscape software (31). The
plugin Molecular Complex Detection (MCODE) was designed to extract
key modules (k-core=2), in which the core genes have the highest
connectivity degree with other genes.
GO and KEGG pathway enrichment
analysis of the core genes
The Database for Annotation, Visualization, and
Integrated Discovery (DAVID) (https://david.ncifcrf.gov/), an online platform for
annotation, visualization and integrated discovery, was used to
investigate the functions and mechanism of the DEGs (32). The analyses in DAVID included GO,
which was used to annotate the functions, such as molecular
function (MF), cellular component (CC) and biological process (BP)
(33), and the KEGG pathway, which
is a sophisticated database for genomic information and high-order
functional information (34). The
threshold values were P<0.05, and the most enrichment GO
annotation and KEGG pathway were listed.
Oncomine analysis of gene
expression
Oncomine (https://www.oncomine.org/resource/main.html), a
platform for collecting, analyzing and delivering cancer data,
including 264 independent datasets, was used to analyze the DNA or
RNA sequences for biomedical research (35). Oncomine was used to analyze the
expression level of MCM6 in various tumors and different subtypes
of EC. For MCM6 expression in subtypes of EC, the terms queried
were set as follows: 1, Gene: MCM6; 2, analysis type: Esophageal
Cancer vs. Normal Analysis; 3, Data Type: mRNA.
GEPIA analysis of gene expression
GEPIA (http://gepia.cancer-pku.cn/index.html), a newly
developed online software, is based on the RNA sequences from
Genotype Tissue Expression (GTEx) data and The Cancer Genome Atlas
(TCGA) programs, including 9,736 cancer and 8,587 normal samples,
and used to explore the expression differences (36). In the present study, GEPIA was used
to explore the mRNA expression level with regards to MCM6 between
the ESCC and normal esophagus samples, and was also used to examine
MCM6 expression in different types of cancer. We entered the gene
(e.g., MCM6) in the ‘Enter gene name’ field and clicked the
‘GoPIA’ button, which generated the expression profile of MCM6 in
all tumors and the corresponding normal tissues. The given gene
(MCM6) expression in ESCA was presented in Expression DIY
(in the Boxplot tab) with log2FC>1 and P-value<0.01 were the
cut-off criteria.
UALCAN analysis of gene
expression
UALCAN (http://ualcan.path.uab.edu/analysis.html), an
interactive resource, can be used to analyze gene transcriptional
levels compared to normal samples with relative clinicopathological
parameters from the TCGA database, including 31 cancer types with
clinical data (37). In the present
study, UALCAN was used to examine MCM6 expression in ESCC tissues
and its association with clinicopathological parameters. We entered
the gene (MCM6) in ‘Scan by genes’ and selected the TCGA
datasets which was the cancer type of interest (e.g., esophageal
cancer) and clicked the ‘Explore’ button. The expression and
survival information of entered gene were listed in new links. The
expression analysis results provided the relative expression level
of interested gene in normal tissues and its subgroups. The
survival analysis showed multiple KM-plots which revealed the
association of gene expression level and the clinical parameters,
such as tumor grade, patient's race and sex.
Patient tissues and cell lines
A total of 68 ESCC tissues and 30 paraffin-embedded
normal tissues were collected from the Pathology Laboratory of the
First Affiliated Hospital of Zhengzhou University from September,
2018 to February, 2019. The detailed clinicopathological parameters
are listed in Table I. The 30
normal tissues were obtained from the corresponding adjacent normal
tissues of 68 ESCC tissues diagnosed by routine post-surgery
histological examination. Because of missing of part adjacent
normal control samples and part clinicopathological parameters, the
number of ESCC tissues and normal tissues were not paired
completely. Thus, each sample was treated as a separate individual.
None of the patients had received any radiotherapy and other
treatments prior to surgical resection, and all the patients had
signed written informed consent forms. All tissues were diagnosed
as ESCC by a post-surgery histological examination.
 | Table I.Association between the
clinicopathological parameters and MCM6 expression. |
Table I.
Association between the
clinicopathological parameters and MCM6 expression.
|
|
| MCM6
expression |
|
|---|
|
|
|
|
|
|---|
| Clinicopathological
parameter | No. | Positive
(n=53) | Negative
(n=15) | P-value |
|---|
| Age |
|
|
| 0.416 |
| <60
years | 30 | 22 | 8 |
|
| ≥60
years | 38 | 31 | 7 |
|
| Sex |
|
|
| 0.111 |
|
Male | 33 | 23 | 10 |
|
|
Female | 35 | 30 | 5 |
|
| TNM stage |
|
|
| 0.179 |
|
I/II | 50 | 41 | 9 |
|
|
III/IV | 18 | 12 | 6 |
|
| Lymphatic
metastasis |
|
|
| 0.049a |
| No | 46 | 39 | 7 |
|
|
Yes | 22 | 14 | 8 |
|
| Infiltration
depth |
|
|
| 0.003a |
|
Submucosal/superficial
layer | 48 | 42 | 6 |
|
| Deep
muscle/outer layer | 20 | 11 | 9 |
|
The present study was approved by the Ethics
Committee of the First Affiliated Hospital of Zhengzhou University.
Human ESCC cell lines (EC109 and KYSE30) and a normal esophageal
epithelial cell line (Het-1A) were purchased from the Shanghai
Institute of Life Sciences Cell Bank Center (Shanghai).
Immunohistochemistry
A total of 68 paraffin-embedded cancer tissue
sections and 30 corresponding normal tissues, which were cut into
4-µm sections and fixed using 4% paraformaldehyde for 48 h at room
temperature, were selected for immunohistochemical staining. The
sections were deparaffinized in xylene and graded alcohols (100,
95, 90, 75 and 70%), followed by antigen retrieval in citrate
buffer. After endogenous peroxidase activity was exhausted with 3%
hydrogen peroxide, the sections were blocked in 10% goat serum
(Sangon Biotech Co., Ltd.) to prevent non-specific staining for 30
min at room temperature and then washed with phosphate-buffered
saline (PBS). Subsequently, anti-MCM6 primary polyclonal antibodies
(1:4,000, cat. no. 201683, Abcam) were added overnight at 4°C, and
the sections were then incubated with HRP-labeled goat anti-rabbit
secondary antibody (1:100, cat. no. A0208, Beyotime Institute of
Biotechnology) at room temperature for 1 h the following day. The
slides were then visualized with 3,3′-diaminobenzidine (DAB) and
counterstained with hematoxylin for 3 min at room temperature.
Following dehydrating in alcohols (70, 75, 90, 95 and 100%) for min
each, xylene for 15 min, all at room temperature, the slides were
covered with neutral gum. The number of positive cells that
exhibited brown color were assessed by two independent pathologists
from the Pathology Laboratory of the First Affiliated Hospital of
Zhengzhou University (Zhengzhou, China) with no prior knowledge of
the patient clinical details, under a light microscope
(magnification, ×100) and both the staining intensity and extent
were considered using Image J software (version 1.8.0; National
Institutes of Health). The final staining quantification was
performed by multiplying the intensity scored from 0 to 3 and the
extent score from 0 to 100%. The protein expression was classified
as positive if the final score was >1.5, and negative if the
score was <1.5 or 1.5. The antibody used was MCM6 (1:4,000, cat.
no. 201683, Abcam). Additionally, the clinical significance was
analyzed based on the clinical parameters.
Cell culture
ESCC cell lines and normal esophageal epithelial
cells were cultured in Roswell Park Memorial Institute-1640
(RPMI-1640, HyClone; GE Healthcare Life Sciences) supplemented with
10% fetal bovine serum (FBS, Gibco; Thermo Fisher Scientific,
Inc.). For routine culture, the cells were grown in 5%
CO2 at 37°C. After cell recovery and adherence, cells
were passaged every 2 days, and maintained in the logarithmic phase
growth. The cells at exponential phase growth were digested with
trypsin (Sangon Biotech), and diluted into a suspension of
4×10⁵ cells/l in a 6-well plate (EC109) or
2.5×10⁵ cells/l (KYSE30) with RPMI-1640 medium with
serum (Sangon Biotech Co., Ltd.). After cell adherence for 12 h,
the cells were used for subsequent experiments.
Cell transfection
Small interfering RNAs (siRNAs) targeting MCM6 and
siRNA negative control were purchased from RiboBio Co. Ltd. siRNAs
were transfected into cells using riboFECT transfection reagent
(Changzhou Bio-Generating Biotechnologies Co., Ltd.) according to
the manufacturer's protocol. The sequences of the siRNAs used in
the present study were as follows: si-MCM6#1, GGCGCATAGTAGATTTGCA;
and si-MCM6#2, GAAGGAAGCTTTCCGGTTA. After transfection for 24–72 h,
the transfection efficiency was confirmed by RT-qPCR and western
blot analysis, and transfected cells were collected for further
analysis.
RNA extraction and RT-qPCR
Total RNA was extracted from the Het-1A, EC109 and
KYSE30 cell lines and transfected cell lines using an RNA isolater
(Vazyme, Biotech Co., Ltd.). cDNA was synthesized through a 20 µl
reverse transcription system containing 1 µg total RNA with a
PrimeScript™ RT reagent kit with gDNA Eraser (Takara Biotechnology
Co., Ltd.) according to the manufacturer's protocols.
SYBR® Premix Ex Taq™ II (Takara Biotechnology Co., Ltd.)
was employed for qPCR on a LightCycler 480 II Real-Time PCR System
(Roche Diagnostics) with GAPDH as an internal control. The PCR
cycling conditions were as follows: Pre-denaturation at 95°C for 30
sec for 1 cycle, then at 95°C for 5 sec, 60°C for 30 sec for 40
cycles, followed by the melting curve and cooling stage (at 65°C
for 15 sec). mRNA levels were determined via the 2−ΔΔCq
method, with GAPDH used for normalization (38). Each extracted sample was placed in 3
wells, and independent experiments were repeated 3 times. The
primers used in the present study were: MCM6 forward,
5′-AAGACCTGCCTACCAGACACAA-3′ and reverse,
5′-TGACAGTCCAAGCACAGAAAAGT-3′; GAPDH forward,
5′-GAACGGGAAGCTCACTGG-3′ and reverse,
5′-GCCTGCTTCACCACCTTCT-3′.
Protein isolation and western blot
analysis
Total proteins were collected from the cells using
radioimmunoprecipitation assay lysis buffer (RIPA, Beyotime
Institute of Biotechnology), which were supplemented with protease
inhibitors on ice for 30 min and then centrifuged at 12,000 × g for
10 min at 4°C to harvest the supernatant. The protein concentration
of the cell lysates was measured using a bicinchoninic acid kit
(BCA, Beyotime Institute of Biotechnology). The proteins (15
µg/lane) were then separated by sodium dodecyl sulfate
polyacrylamide gel electrophoresis (SDS-PAGE) on 10% gels and
transfected to a polyvinylidene fluoride (PVDF) membrane. The PVDF
membrane was blocked for 2 h in 5% non-fat milk, and then incubated
overnight at 4°C with primary antibodies and HRP-labeled goat
anti-rabbit secondary antibodies (1:5,000, cat. no. A0208, Beyotime
Institute of Biotechnology) for 1 h at room temperature. The
protein bands were visualized by chemiluminescence with an imaging
system (EMD Millipore) and then analyzed with ImageJ (version
1.8.0; National Institutes of Health) software. The antibodies were
specific for MCM6 (1:2,000, cat. no. 13347-2-AP, ProteinTech Group,
Inc.) and GAPDH (1:5,000, cat. no. D110016, Sangon Biotech Co.,
Ltd.).
Cell Counting Kit-8 (CCK-8) cell
proliferation assay
An enhanced Cell Counting Kit-8 (CCK-8, BIOSS) was
used to measure the cell proliferative ability. Transfected cells
at a density of 3,000 cells/well were inoculated into 96-well
plates (Corning, Inc.) which contained 100 µl RPMI-1640 with 10%
FBS for 4 days. CCK-8 reagent was added (10 µl/well) to the wells
followed by incubation for 2 h at 37°C, and the absorbance at 450
nm was then detected using a microplate reader (SpectraMax M5,
Molecular Devices, LLC).
Flow cytometry
Cells transfected with siMCM6 for 48 h were digested
with trypsin without ethylene diamine tetra-acetic acid (EDTA) and
the cell suspension was collected and washed with PBS twice. For
cell apoptosis analysis, the cell suspension was subjected to
Annexin V-APC/7-AAD double staining (KeyGen Biotech) and incubated
for 15 min. Apoptotic cells were evaluated within 1 h by flow
cytometry (FACScan; BD Biosciences) according to the manufacturer's
instructions. For assessment of the results, mechanically damaged
cells were in the upper left quadrant and negative normal cells
were in the lower left quadrant; the early apoptotic cells were in
the lower right quadrant and late apoptotic cells were in the
uppper right quadrant. For cell cycle detection, the cells were
fixed with 95% pre-cold ethanol for 2 h, and then washed with PBS
twice. The cells were supplemented with 2 µl RNase A (2.5 mg/ml)
and 15 µl propidium iodide (PI, 15X) (KeyGen Biotech), followed by
detection with flow cytometry at 488 nm.
Wound-healing assay
Transfected cells were grown into 6-well plates
until 90–100% confluency at 37°C 5% CO2. Artificial
wound tracks were created using a 200 µl pipette tube. The cells
were then washed by PBS and supplemented with serum-free medium.
Cells migrating into the wound area were assessed to compare cell
motility every 24 h.
Transwell assay
The Transwell wells (24-well with pore diameter of
0.8 µm) were covered with Matrigel (BD Biosciences) at 37°C for 2 h
for cell invasion assay, and without Matrigel for cell migration
assays. Transfected cells were collected and resuspended with 200
µl medium without serum, and seeded into the upper chamber of a
Transwell plate at a density of 1×10⁵/well. The
basolateral chamber was supplemented with 650 µl medium with 20%
FBS. Following incubation for 36 h at 37°C and 5% CO2,
the cells were fixed with 4% paraformaldehyde for 10 min at room
temperature and then stained with crystal violet for 30 min at room
temperature. The cells remaining in the upper chamber were removed
and the transmembrane cells were quantified using a light
microscope (magnification, ×100).
Statistical analysis
SPSS 21.0 software and GraphPad Prism 5 were used
for statistical analysis. The experiments were repeated ≥3 times,
and the results are presented as the means ± standard deviation
(SD). The MCM6 expression between tumor tissues and normal control
esophageal tissues were statistically analyzed using an independent
sample Student's t-test. The associations between MCM6 expression
and the patient clinicopathological parameters were assessed by
Pearson's χ2 test. The differences between two
independent groups were analyzed using a Student's t-test, those
between >2 groups were analyzed by one-way analysis variance and
followed by LSD (Least Significant Difference) post hoc test.
Survival analysis was examined by a log-rank test. P<0.05 was
considered to indicate a statistically significant difference.
Results
Extraction of DEGs in ESCC from 4 GEO
datasets
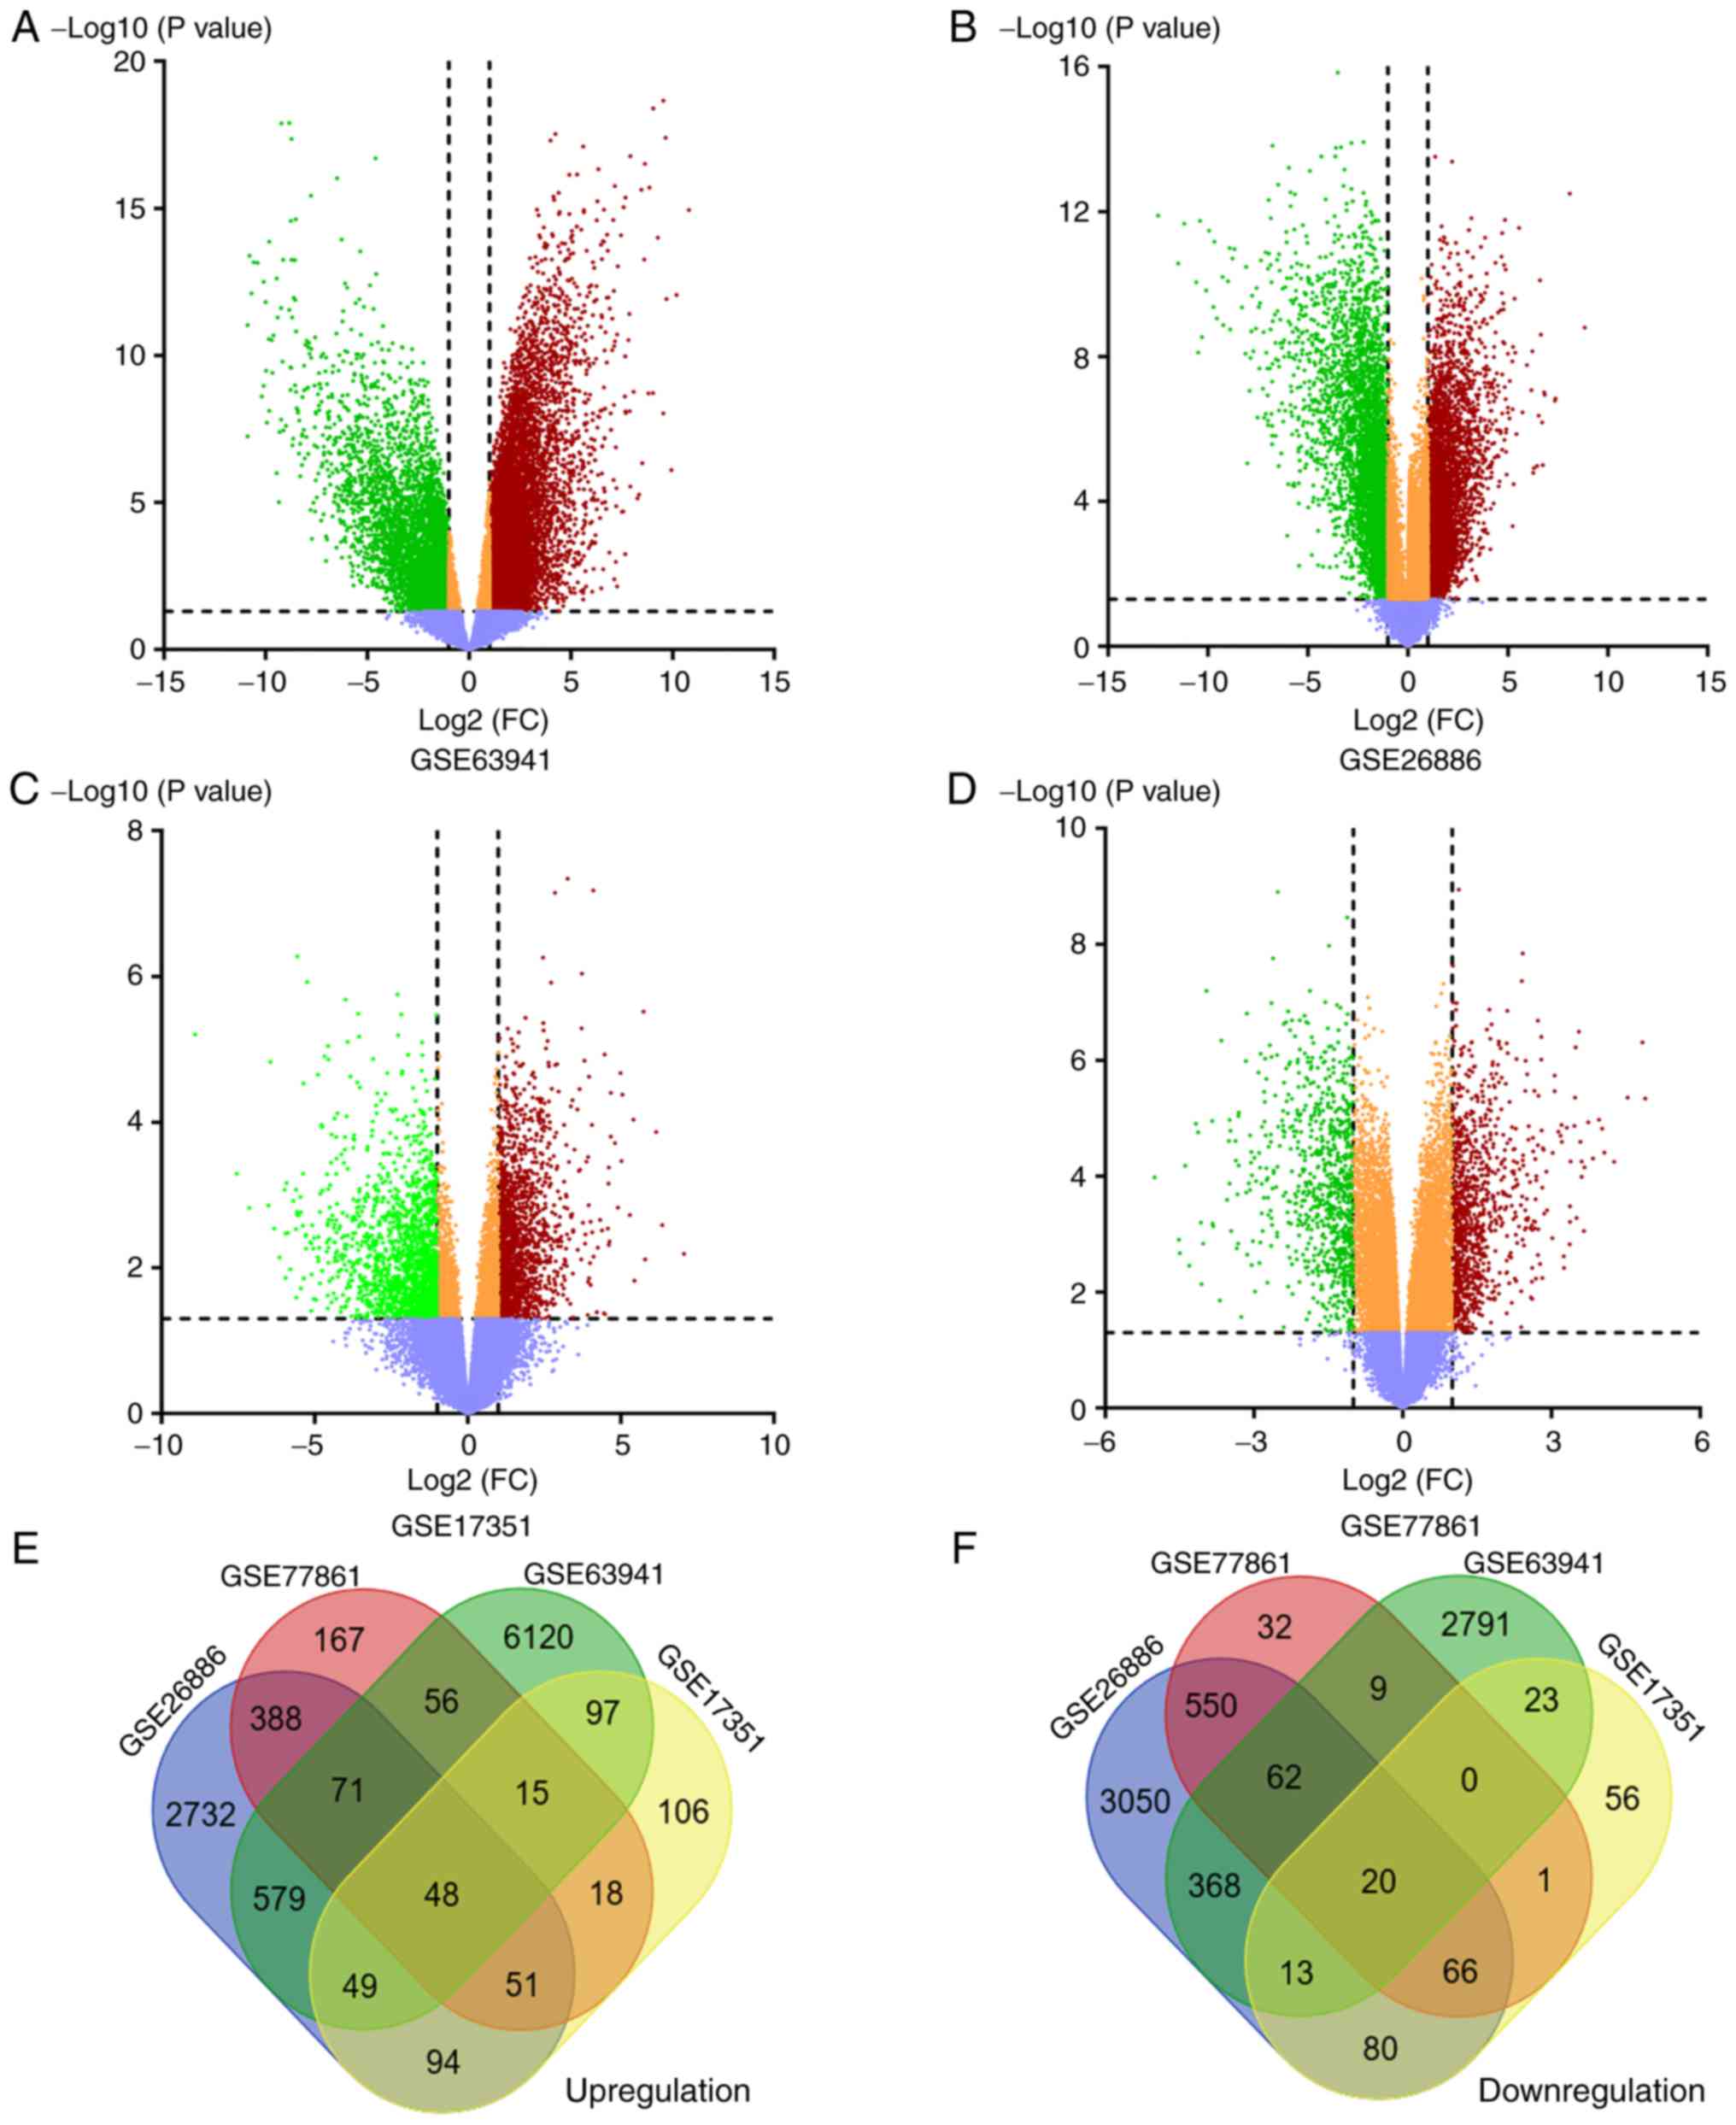
Four datasets (GSE63941, GSE26886, GSE17351 and
GSE77861) were selected from the GEO database. The characteristics
of the 4 datasets are presented in Table II. The up- and downregulated genes
in each dataset were then determined. According to the threshold of
adjusted P-values of <0.05, P<0.05 and |log2-fold change|≥1,
7,035 upregulated and 3,286 downregulated genes were identified
from GSE63941 (Fig. 1A), 4,012
upregulated and 4,209 downregulated genes were identified from
GSE26886 (Fig. 1B), 478 upregulated
and 259 downregulated genes were identified from GSE17351 (Fig. 1C), and 814 upregulated and 740
downregulated genes were identified from GSE77861 (Fig. 1D), as summarized in Table III. The overlapping DEGs were
identified by creating a Venn diagram. A total of 68 genes,
including 48 upregulated genes (Fig.
1E) and 20 downregulated genes (Fig. 1F) were shared in the 4
microarrays.
| Table II.Detailed information of the
datasets. |
Table II.
Detailed information of the
datasets.
| Dataset | Samples | Case/control | Year | Region | Platform | Organism | Contributor |
|---|
| GSE63941 | Cell lines | 22/4 | 2014 | Japan | GPL570 | Homo sapiens | Saito (46) |
| GSE26886 | Tissues | 19/9 | 2013 | Germany | GPL570 | Homo sapiens | Wang (47) |
| GSE17351 | Tissues | 5/5 | 2009 | USA | GPL570 | Homo sapiens | Lee (48) |
| GSE77861 | Tissues | 7/7 | 2016 | USA | GPL570 | Homo sapiens | Erkizan (49) |
| Table III.Number of DEGs in each expression
dataset. |
Table III.
Number of DEGs in each expression
dataset.
| Dataset | Upregulated
genes | Downregulated
genes | Total |
|---|
| GSE63941 | 7,035 | 3,286 | 10,321 |
| GSE26886 | 4,012 | 4,209 | 8,221 |
| GSE17351 | 478 | 259 | 737 |
| GSE77861 | 814 | 740 | 1,554 |
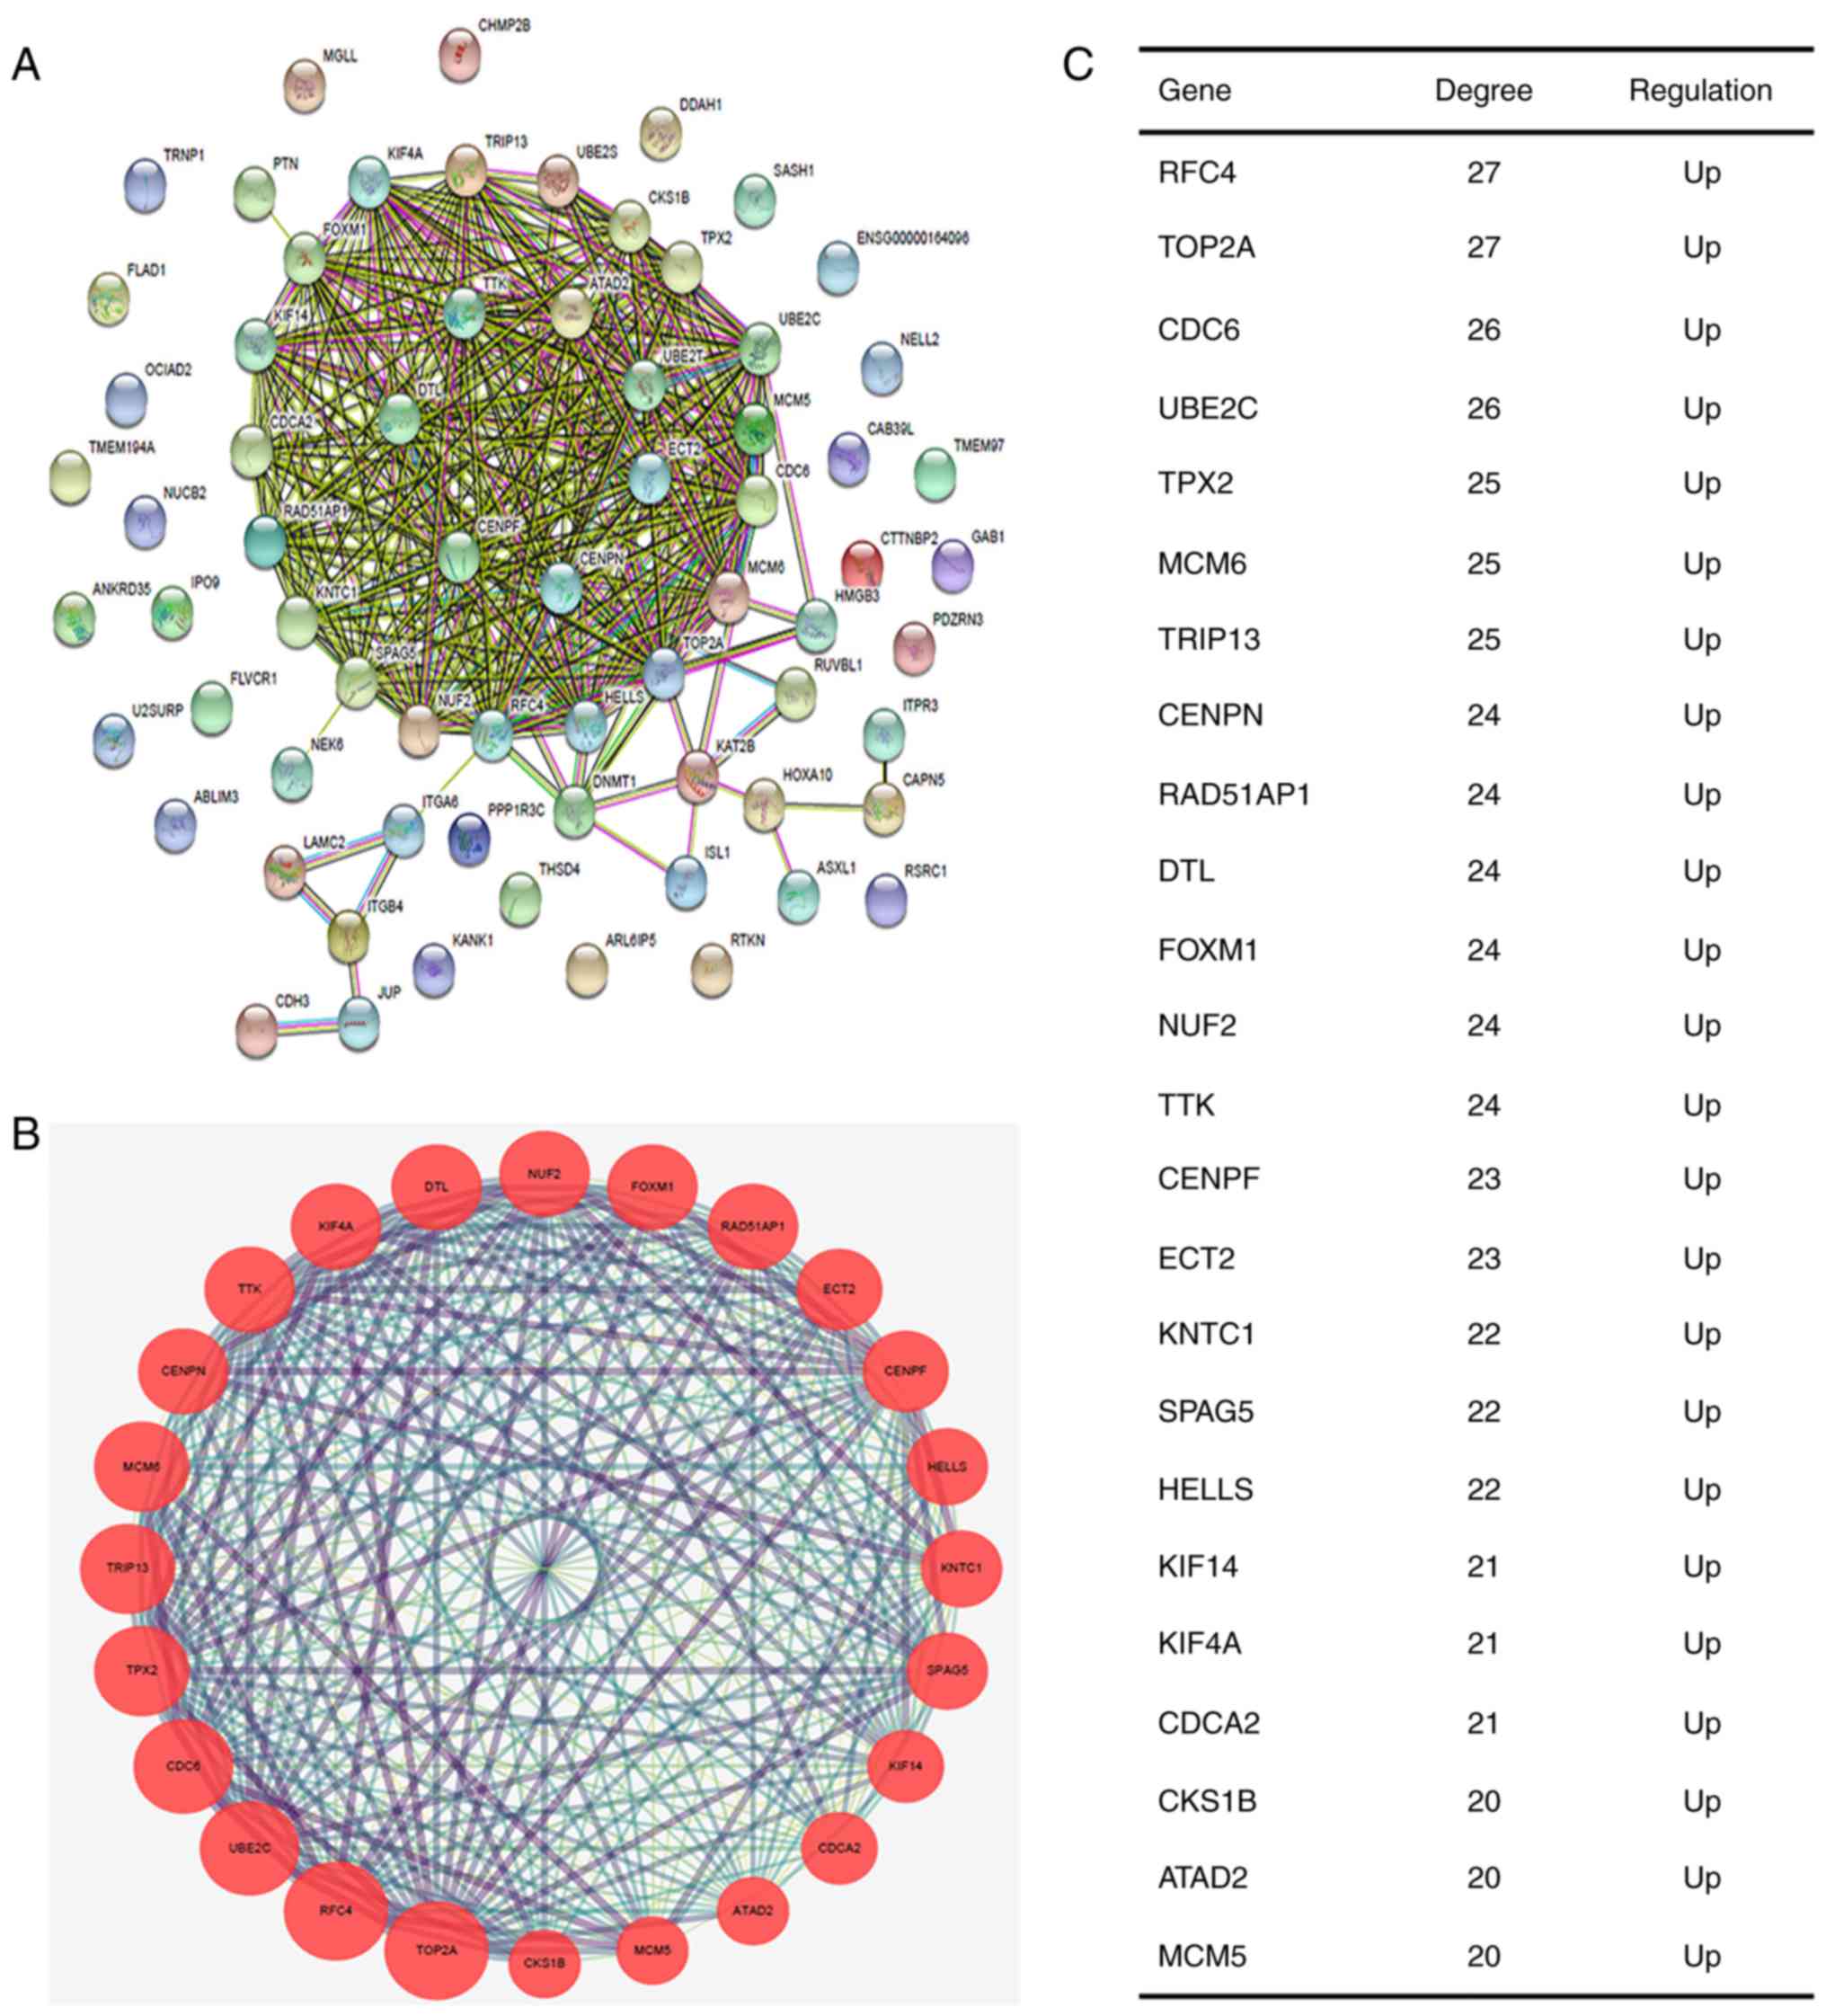
Subsequently, the protein-protein associations
between the 68 genes were analyzed using STRING (Fig. 2A) and then visualized using
Cytoscape software. The plugin MCODE was used to screen significant
modules from the PPI network. The module of the highest score
(22.783) was used for the subsequent analysis (Fig. 2B). A total of 24 nodes and 262 edges
were visualized in the module. The hub genes were annotated and are
listed in Fig. 2C and Table IV. All 24 genes were upregulated
and were used for further enrichment analysis.
| Table IV.Annotation of DEGs. |
Table IV.
Annotation of DEGs.
| From | To | Species | Gene name | Degree | Regulation |
|---|
| RFC4 | 5984 | Homo sapiens | Replication factor
C subunit 4 | 27 | Up |
| TOP2A | 7153 | Homo sapiens | Topoisomerase (DNA)
II alpha | 27 | Up |
| CDC6 | 990 | Homo sapiens | Cell division cycle
6 | 26 | Up |
| UBE2C | 11065 | Homo sapiens | Ubiquitin
conjugating enzyme E2 C | 26 | Up |
| TPX2 | 22974 | Homo sapiens | TPX2, microtubule
nucleation factor | 25 | Up |
| MCM6 | 4175 | Homo sapiens | Minichromosome
maintenance complex component 6 | 25 | Up |
| TRIP13 | 9319 | Homo sapiens | Thyroid hormone
receptor interactor 13 | 25 | Up |
| CENPN | 55839 | Homo sapiens | Centromere protein
N | 24 | Up |
| RAD51AP1 | 10635 | Homo sapiens | RAD51-associated
protein 1 (RAD51AP1) | 24 | Up |
| DTL | 51514 | Homo sapiens | Denticleless E3
ubiquitin protein ligase homolog | 24 | Up |
| FOXM1 | 2305 | Homo sapiens | Forkhead box
M1 | 24 | Up |
| NUF2 | 83540 | Homo sapiens | NUF2, NDC80
kinetochore complex component | 24 | Up |
| TTK | 7272 | Homo sapiens | TTK protein
kinase | 24 | Up |
| CENPF | 1063 | Homo sapiens | Centromere protein
F | 23 | Up |
| ECT2 | 1894 | Homo sapiens | Epithelial cell
transforming 2 | 23 | Up |
| KNTC1 | 9735 | Homo sapiens |
Kinetochore-associated 1 | 22 | Up |
| SPAG5 | 10615 | Homo sapiens | Sperm-associated
antigen 5 | 22 | Up |
| HELLS | 3070 | Homo sapiens | Helicase,
lymphoid-specific | 22 | Up |
| KIF14 | 9928 | Homo sapiens | Kinesin family
member 14 | 21 | Up |
| KIF4A | 24137 | Homo sapiens | Kinesin family
member 4A | 21 | Up |
| CDCA2 | 157313 | Homo sapiens | Cell division
cycle-associated 2 | 21 | Up |
| CKS1B | 1163 | Homo sapiens | CDC28 protein
kinase regulatory subunit 1B | 20 | Up |
| ATAD2 | 29028 | Homo sapiens | ATPase family, AAA
domain containing 2 | 20 | Up |
| MCM5 | 4174 | Homo sapiens | Minichromosome
maintenance complex component 5 | 20 | Up |
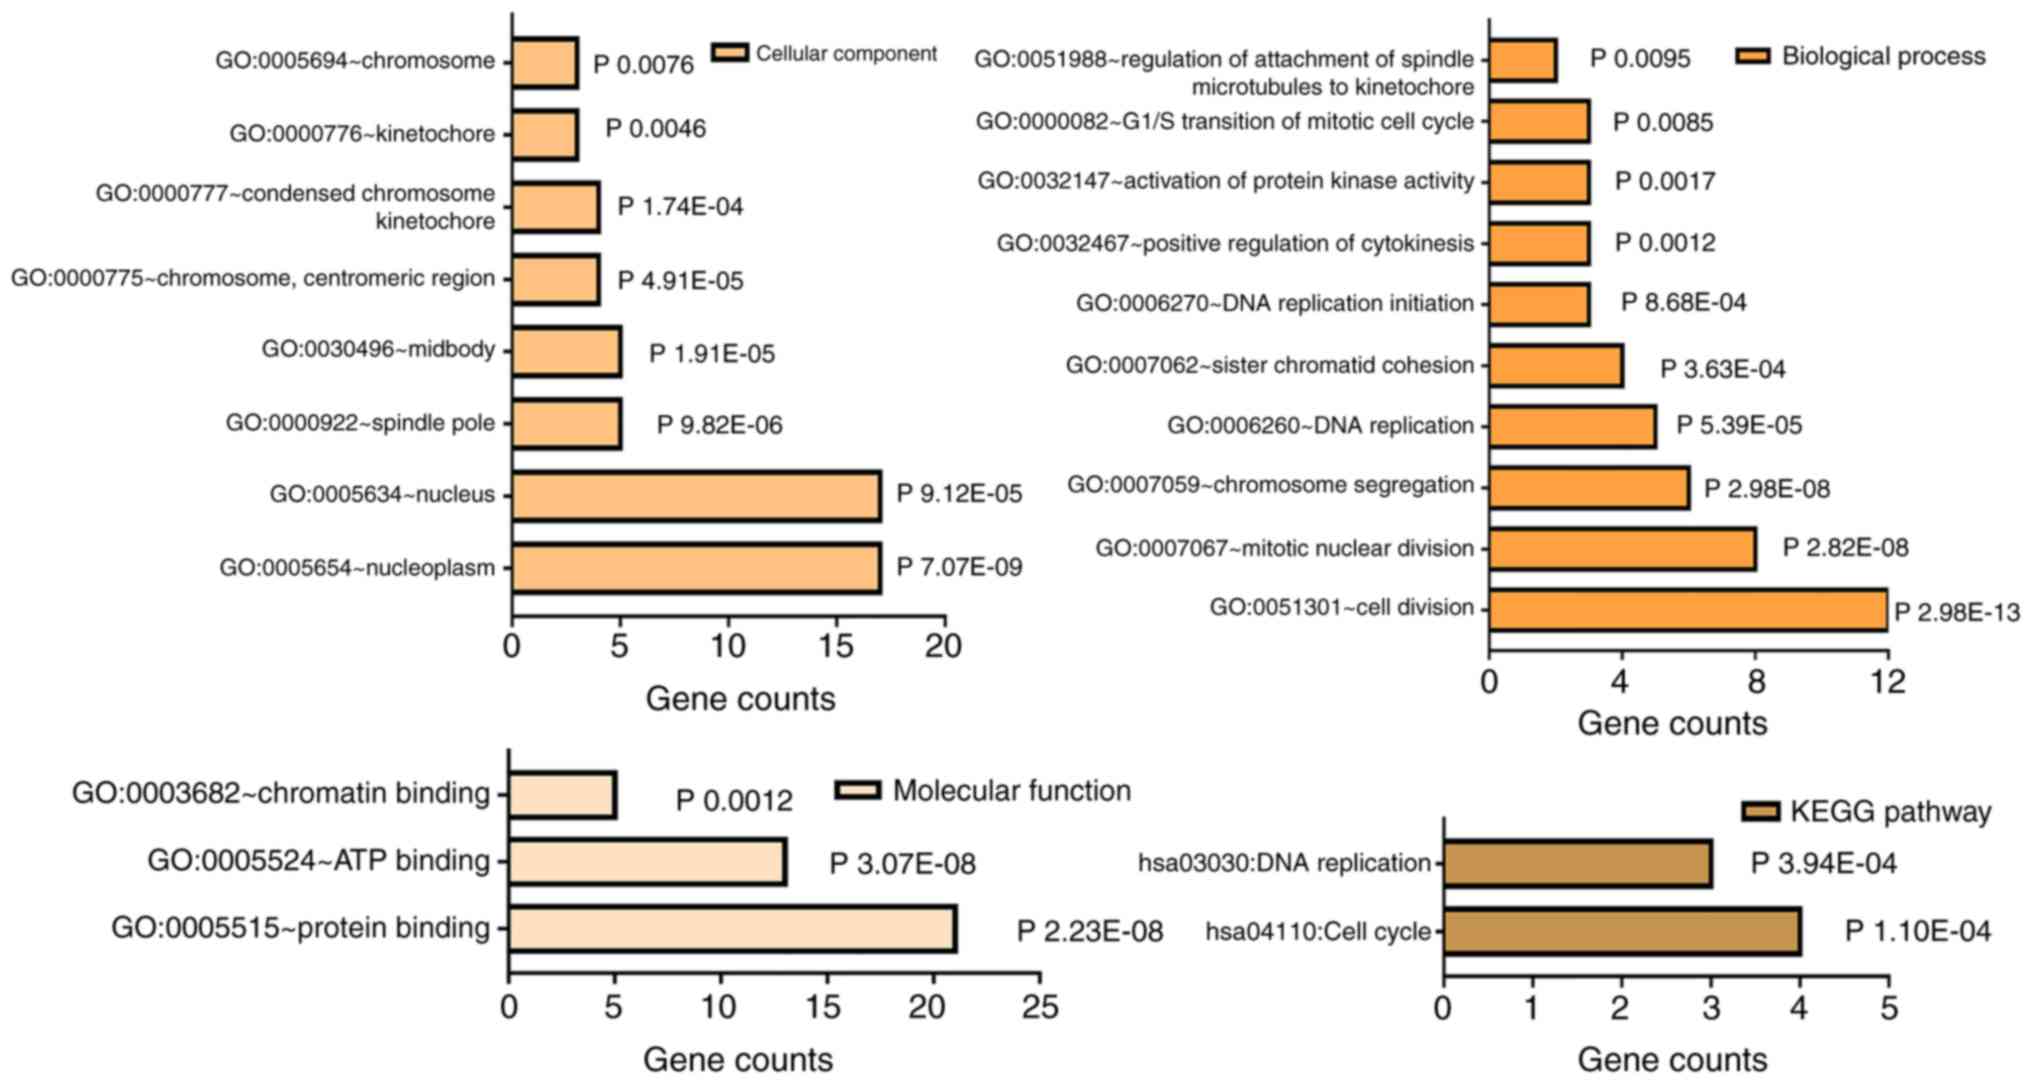
GO and KEGG pathway enrichment
analysis
As for the 24 genes, GO annotation and KEGG pathway
analysis were performed in DAVID. As shown in Table V and Fig. 3, GO analysis revealed that the DEGs
were mainly enriched in BPs, including GO:0051301-cell division,
GO:0007067-mitotic nuclear division, GO:0007059-chromosome
segregation, GO:0006260-DNA replication and GO:0007062-sister
chromatid cohesion. As for cellular component, the genes were
mainly enriched in nucleoplasm and nucleus, and for molecular
function, they were enriched in protein, ATP and chromatin binding.
KEGG signal analysis demonstrated that the hub genes were
significantly enriched in hsa04110: Cell cycle and hsa03030: DNA
replication. More importantly, MCM6 was significantly associated
with DNA replication and cell cycle, and was selected for further
experimental validation.
| Table V.Enriched functions analysis of the 24
core genes. |
Table V.
Enriched functions analysis of the 24
core genes.
| Category | Term | Count | P-value | Genes |
|---|
|
GOTERM_BP_DIRECT | GO:0051301~cell
division | 12 | 2.98E-13 | KIF14, CKS1B, CDC6,
SPAG5, KNTC1, NUF2, TPX2, CDCA2, CENPF, UBE2C, MCM5, HELLS |
|
GOTERM_BP_DIRECT | GO:0007067~mitotic
nuclear division | 8 | 2.82E-08 | CENPN, CDC6, KNTC1,
NUF2, TPX2, CDCA2, CENPF, HELLS |
|
GOTERM_BP_DIRECT |
GO:0007059~chromosome segregation | 6 | 2.98E-08 | CENPN, SPAG5, NUF2,
CDCA2, CENPF, TOP2A |
|
GOTERM_BP_DIRECT | GO:0006260~DNA
replication | 5 | 5.39E-05 | CDC6, RFC4, DTL,
MCM5, MCM6 TOP2A |
|
GOTERM_BP_DIRECT | GO:0007062~sister
chromatid cohesion | 4 | 3.63E-04 | CENPN, KNTC1, NUF2,
CENPF |
|
GOTERM_CC_DIRECT |
GO:0005654~nucleoplasm | 17 | 7.07E-09 | CDC6, CENPN, CKS1B,
KIF4A, RAD51AP1, DTL, FOXM1, TPX2, ATAD2, CENPF, UBE2C, MCM5, MCM6,
RFC4, SPAG5, CDCA2, TOP2A |
|
GOTERM_CC_DIRECT |
GO:0005634~nucleus | 17 | 9.12E-05 | KIF14, CDC6,
RAD51AP1, DTL, FOXM1, NUF2, KNTC1, TPX2, ATAD2, CENPF, ECT2, MCM5,
MCM6, SPAG5, TOP2A, HELLS, TRIP13 |
|
GOTERM_CC_DIRECT |
GO:0005737~cytoplasm | 12 | 0.039863 | CDC6, KIF4A, DTL,
SPAG5, FOXM1, KNTC1, CDCA2, CENPF, TTK, UBE2C, ECT2, TOP2A |
|
GOTERM_CC_DIRECT |
GO:0005829~cytosol | 10 | 0.015112 | KIF14, CENPN, CDC6,
KIF4A, KNTC1, NUF2, TPX2, CENPF, UBE2C, ECT2 |
|
GOTERM_MF_DIRECT | GO:0005515~protein
binding | 21 | 2.23E-05 | KIF14, CDC6, CKS1B,
KIF4A, RAD51AP1, DTL, FOXM1, TPX2, NUF2, KNTC1, TTK, CENPF, UBE2C,
ECT2, MCM5, MCM6, RFC4, SPAG5, TOP2A, HELLS, TRIP13 |
|
GOTERM_MF_DIRECT | GO:0005524~ATP
binding | 13 | 3.07E-08 | KIF14, CDC6, KIF4A,
RFC4, TPX2, ATAD2, TTK, UBE2C, TOP2A, MCM5, HELLS, TRIP13,
MCM6 |
|
GOTERM_MF_DIRECT |
GO:0003682~chromatin binding | 5 | 0.001241 | CENPF, ATAD2,
TOP2A, MCM5, HELLS |
| KEGG_PATHWAY | hsa04110:Cell
cycle | 4 | 1.10E-04 | CDC6, TTK, MCM5,
MCM6 |
| KEGG_PATHWAY | hsa03030:DNA
replication | 3 | 3.94E-04 | RFC4, MCM5,
MCM6 |
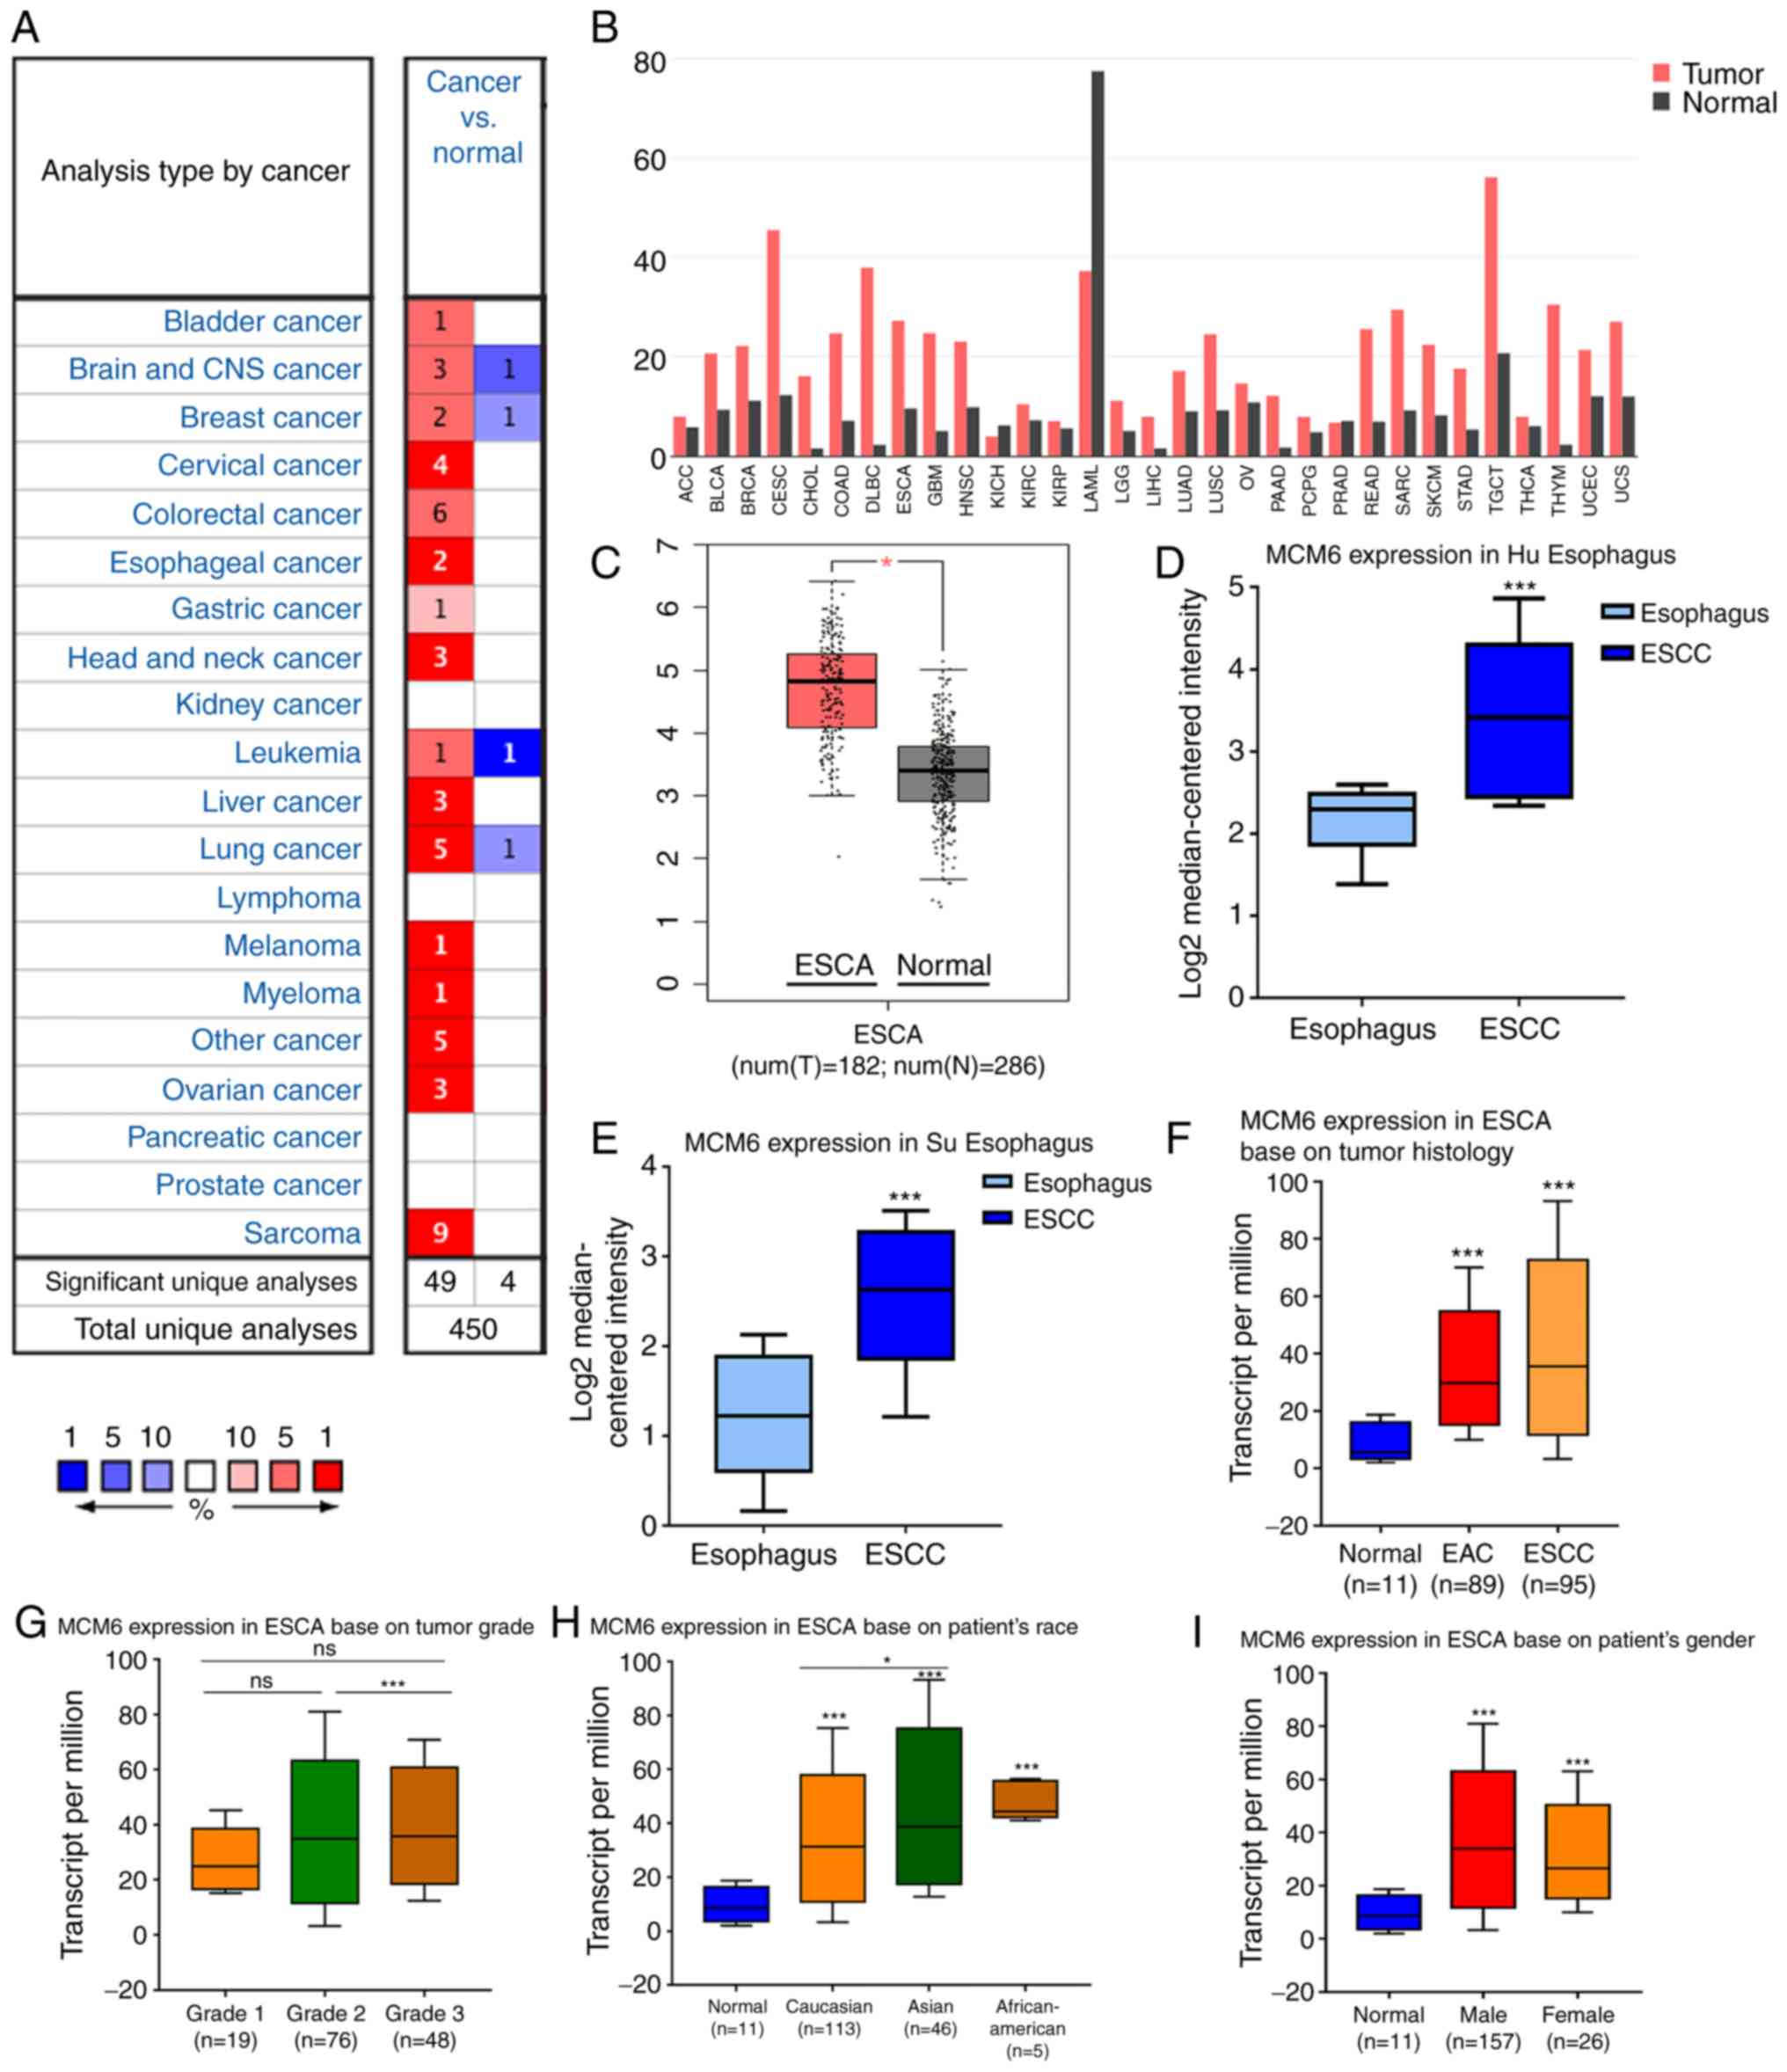
Aberrant MCM6 upregulation in human
cancers in GEPIA and Oncomine
MCM6 expression was analyzed in various human
cancers using the Oncomine database, and the results revealed that
MCM6 was upregulated in the majority of solid tumors, including
breast, liver, bladder and lung cancer (Fig. 4A). Another analysis in GEPIA also
revealed similar results, with the exception of kidney chromophobe
and acute myeloid leukemia (Fig.
4B). Both analyses in GEPIA (Fig.
4C) and Oncomine (Fig. 4D and
E) revealed upregulated MCM6 expression in ESCC compared with
that in normal esophagus tissues.
Additionally, the expression of MCM6 in subtypes of
EC, including ESCC, EAC and Barrett's esophagus, were explored.
Although the results differed according to the subtype, the higher
expression of MCM6 in ESCC was consistent with our bioinformatics
analysis (Table SI).
Validation of MCM6 expression in
UALCAN
To avoid the limitation of the low number of samples
and the short follow-up time, the transcription level of MCM6 was
also explored using the UALCAN website, which was based on 31
cancer types of the TCGA database, including 95 squamous cell
carcinoma, 89 adenocarcinoma and 11 normal tissues for multivariate
regression analysis. The MCM6 mRNA level was significantly elevated
in EC tissues compared to normal tissues in the UALCAN website
(Fig. 4F). Moreover, no significant
association was found between MCM6 expression and the sex of the
patients (Fig. 4I). Of note,
patients with grade 2 and 3 disease exhibited a higher MCM6
expression than patients with grade 1 disease, although the
differences between grade 1 and grade 2 or 3 were not significant
(P>0.05); however, significant differences were observed between
grades 2 and 3 (P<0.05) (Fig.
4G). Moreover, the results revealed that MCM6 expression in all
fields, Caucasian, Asian and African-American, was higher in tumor
compared to normal tissues, and the MCM6 level in Asians was higher
than that of Caucasians (P<0.05) (Fig. 4H).
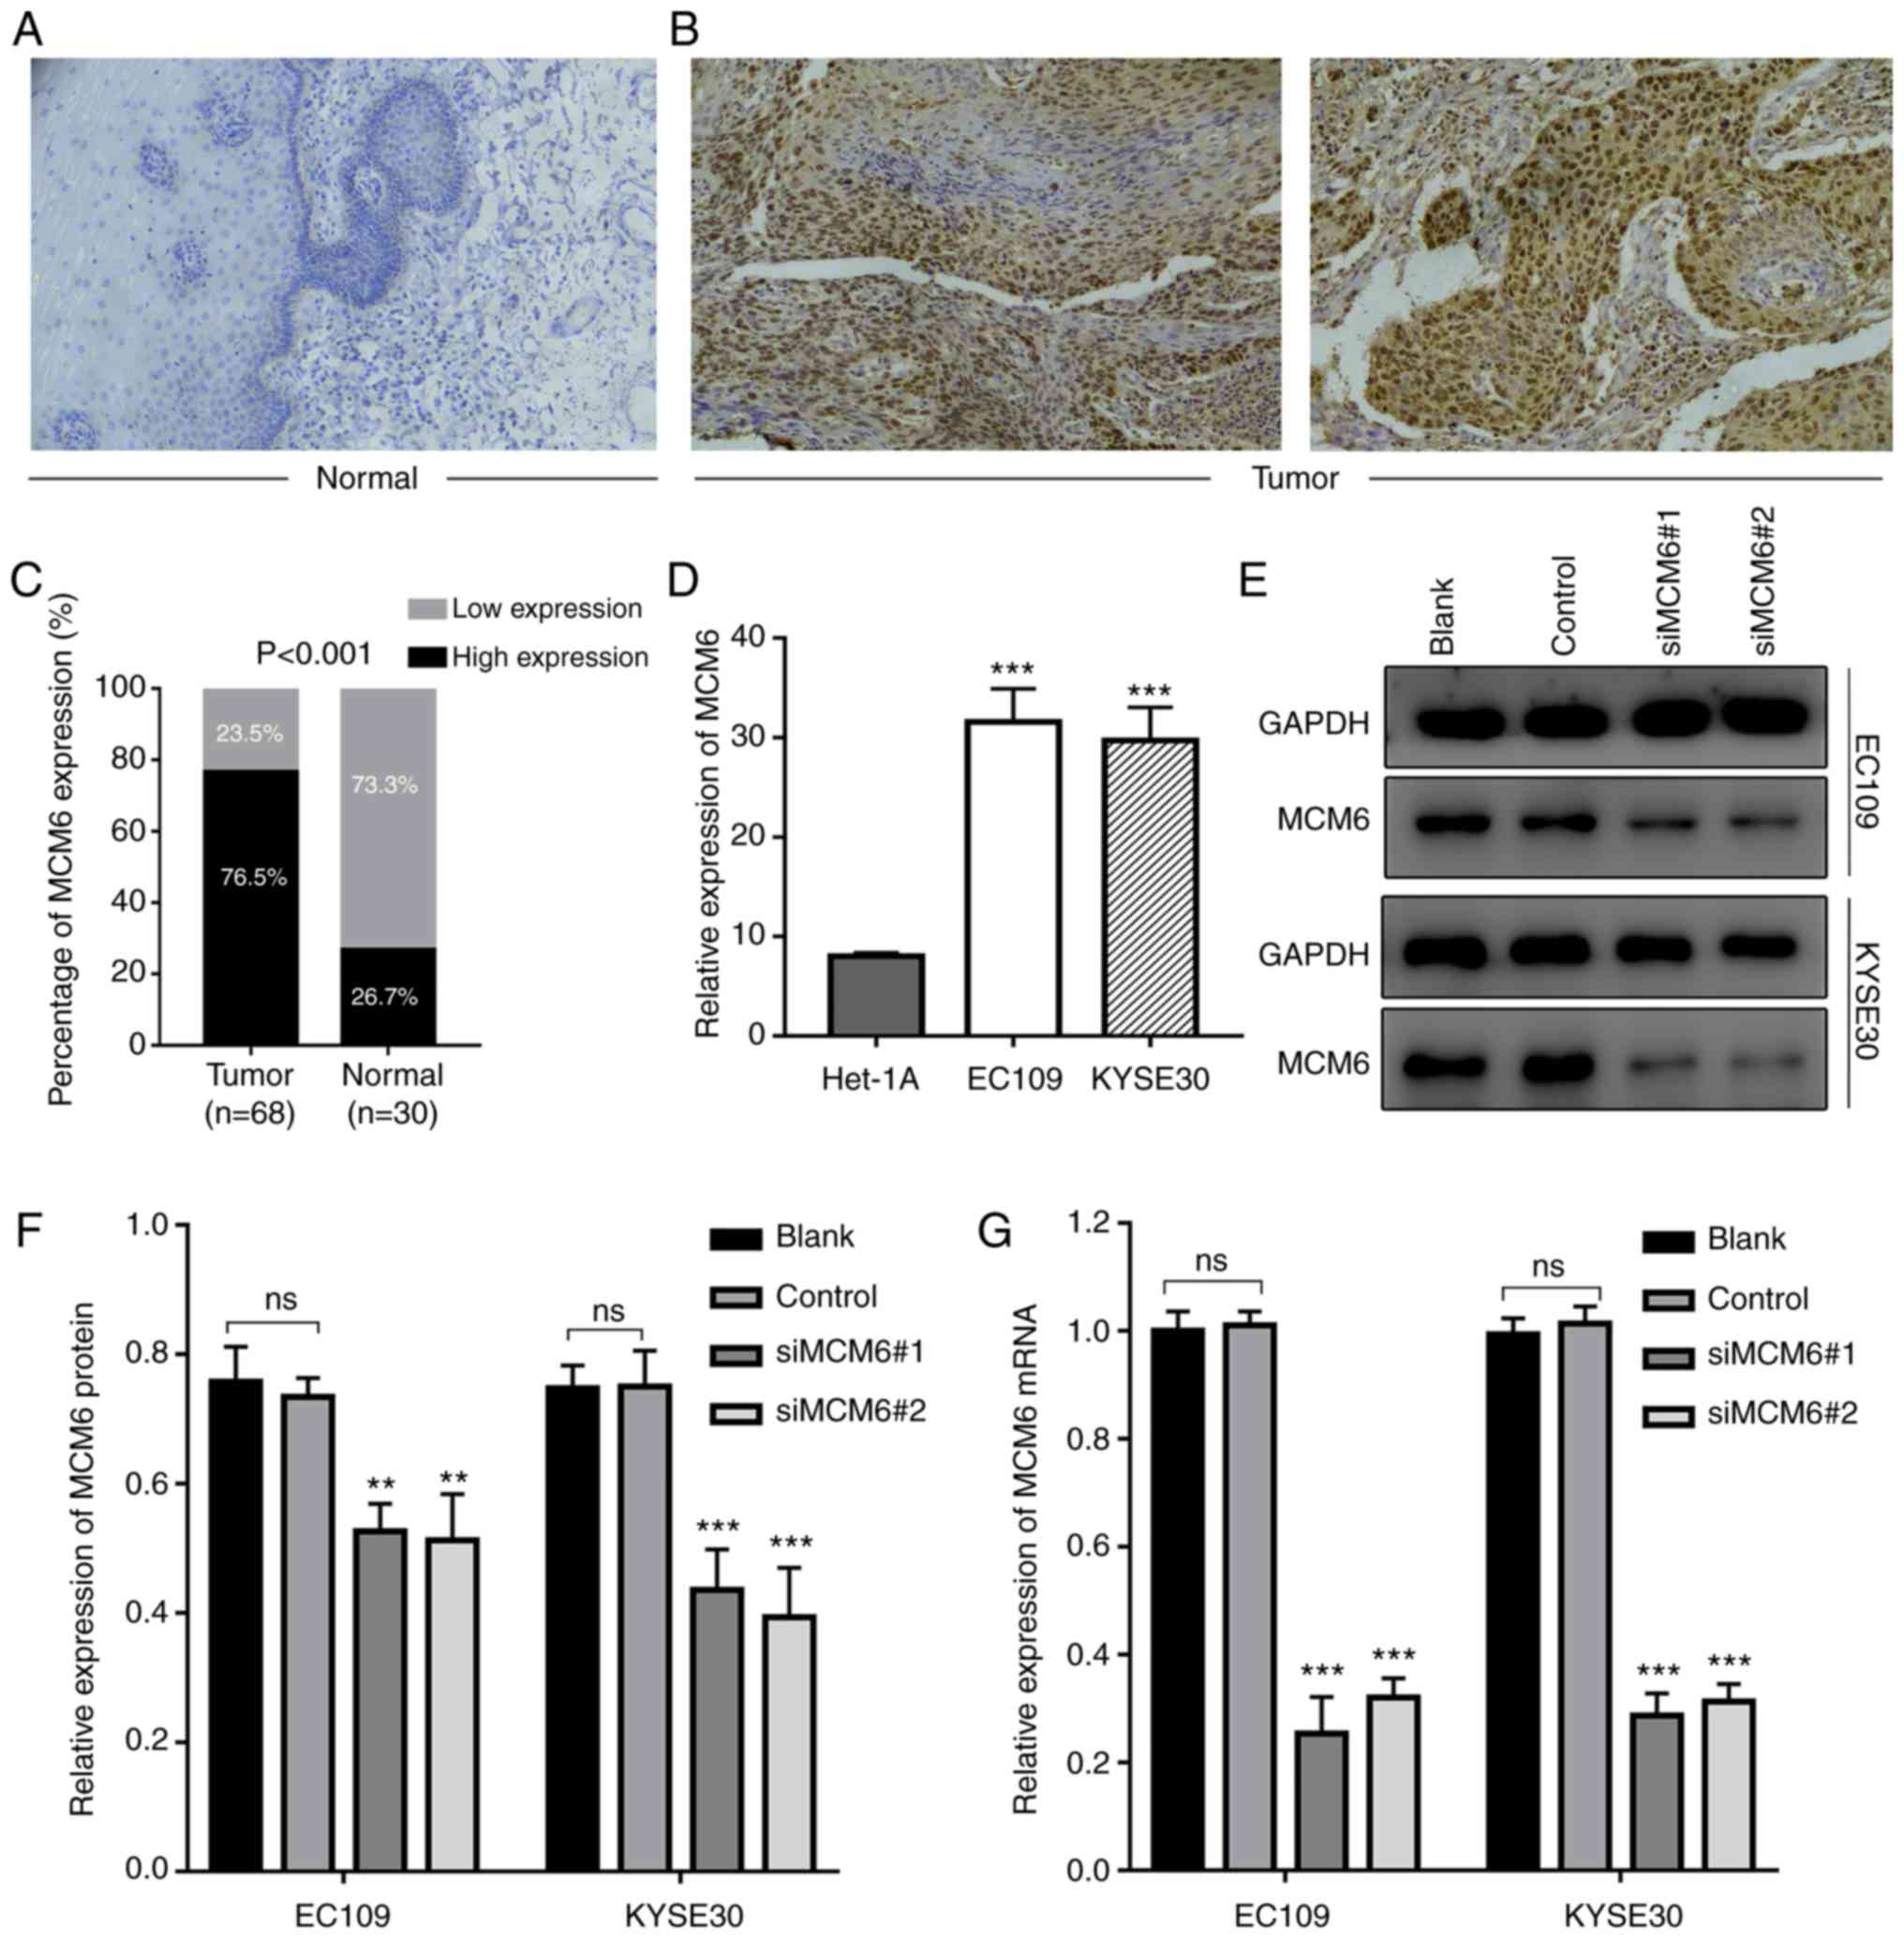
MCM6 expression is upregulated in ESCC
tissues and cell lines as shown by IHC and RT-qPCR
To further validate the expression level of MCM6,
the MCM6 protein level was examined in ESCC tissues by IHC
(Fig. 5A). Similar to the results
of bioinformatics analysis, the MCM6 protein level in ESCC tissues
was significantly higher than that of matched normal tissues
(Fig. 5B). IHC revealed that MCM6
was mainly localized in the nucleus. A higher positive ratio was
also detected in ESCC tissues (76.5%) compared to adjacent
non-tumor tissues (26.7%) (P<0.001; Fig. 5C).
Additionally, the association between the MCM6
expression status and ESCC clinicopathological features was
explored, and statistical analysis revealed that the positive
staining ratio of MCM6 was significantly associated with lymphatic
metastasis and infiltration depth (Table I). However, the association between
MCM6 expression and age, sex and TNM stage exhibited no
significance (P>0.05).
In order to further verify MCM6 expression in ESCC
cell lines, EC109 and KYSE30 were introduced. A high increase in
the MCM6 mRNA level was observed in ESCC cells compared to normal
esophageal epithelial cells (Het-1A) (Fig. 5D). The results of RT-qPCR revealed
that the change in MCM6 mRNA expression was similar to the IHC
results and the former bioinformatics analysis.
Silencing of MCM6 decreases cell
survival
To explore the possible effects of MCM6 on the cell
phenotype, two siRNAs specifically targeting MCM6 were designed,
and transfected into EC109 and KYSE30 cells. Cells were collected,
and total RNA and protein were isolated for RT-qPCR and western
blot analysis to detect the silencing efficiency. Results of the
western blot analysis revealed that the MCM6 protein expression
level decreased compared with the blank and negative groups
(Fig. 5E and F). The results of
RT-qPCR revealed a similar tendency in the mRNA expression level
(Fig. 5G).
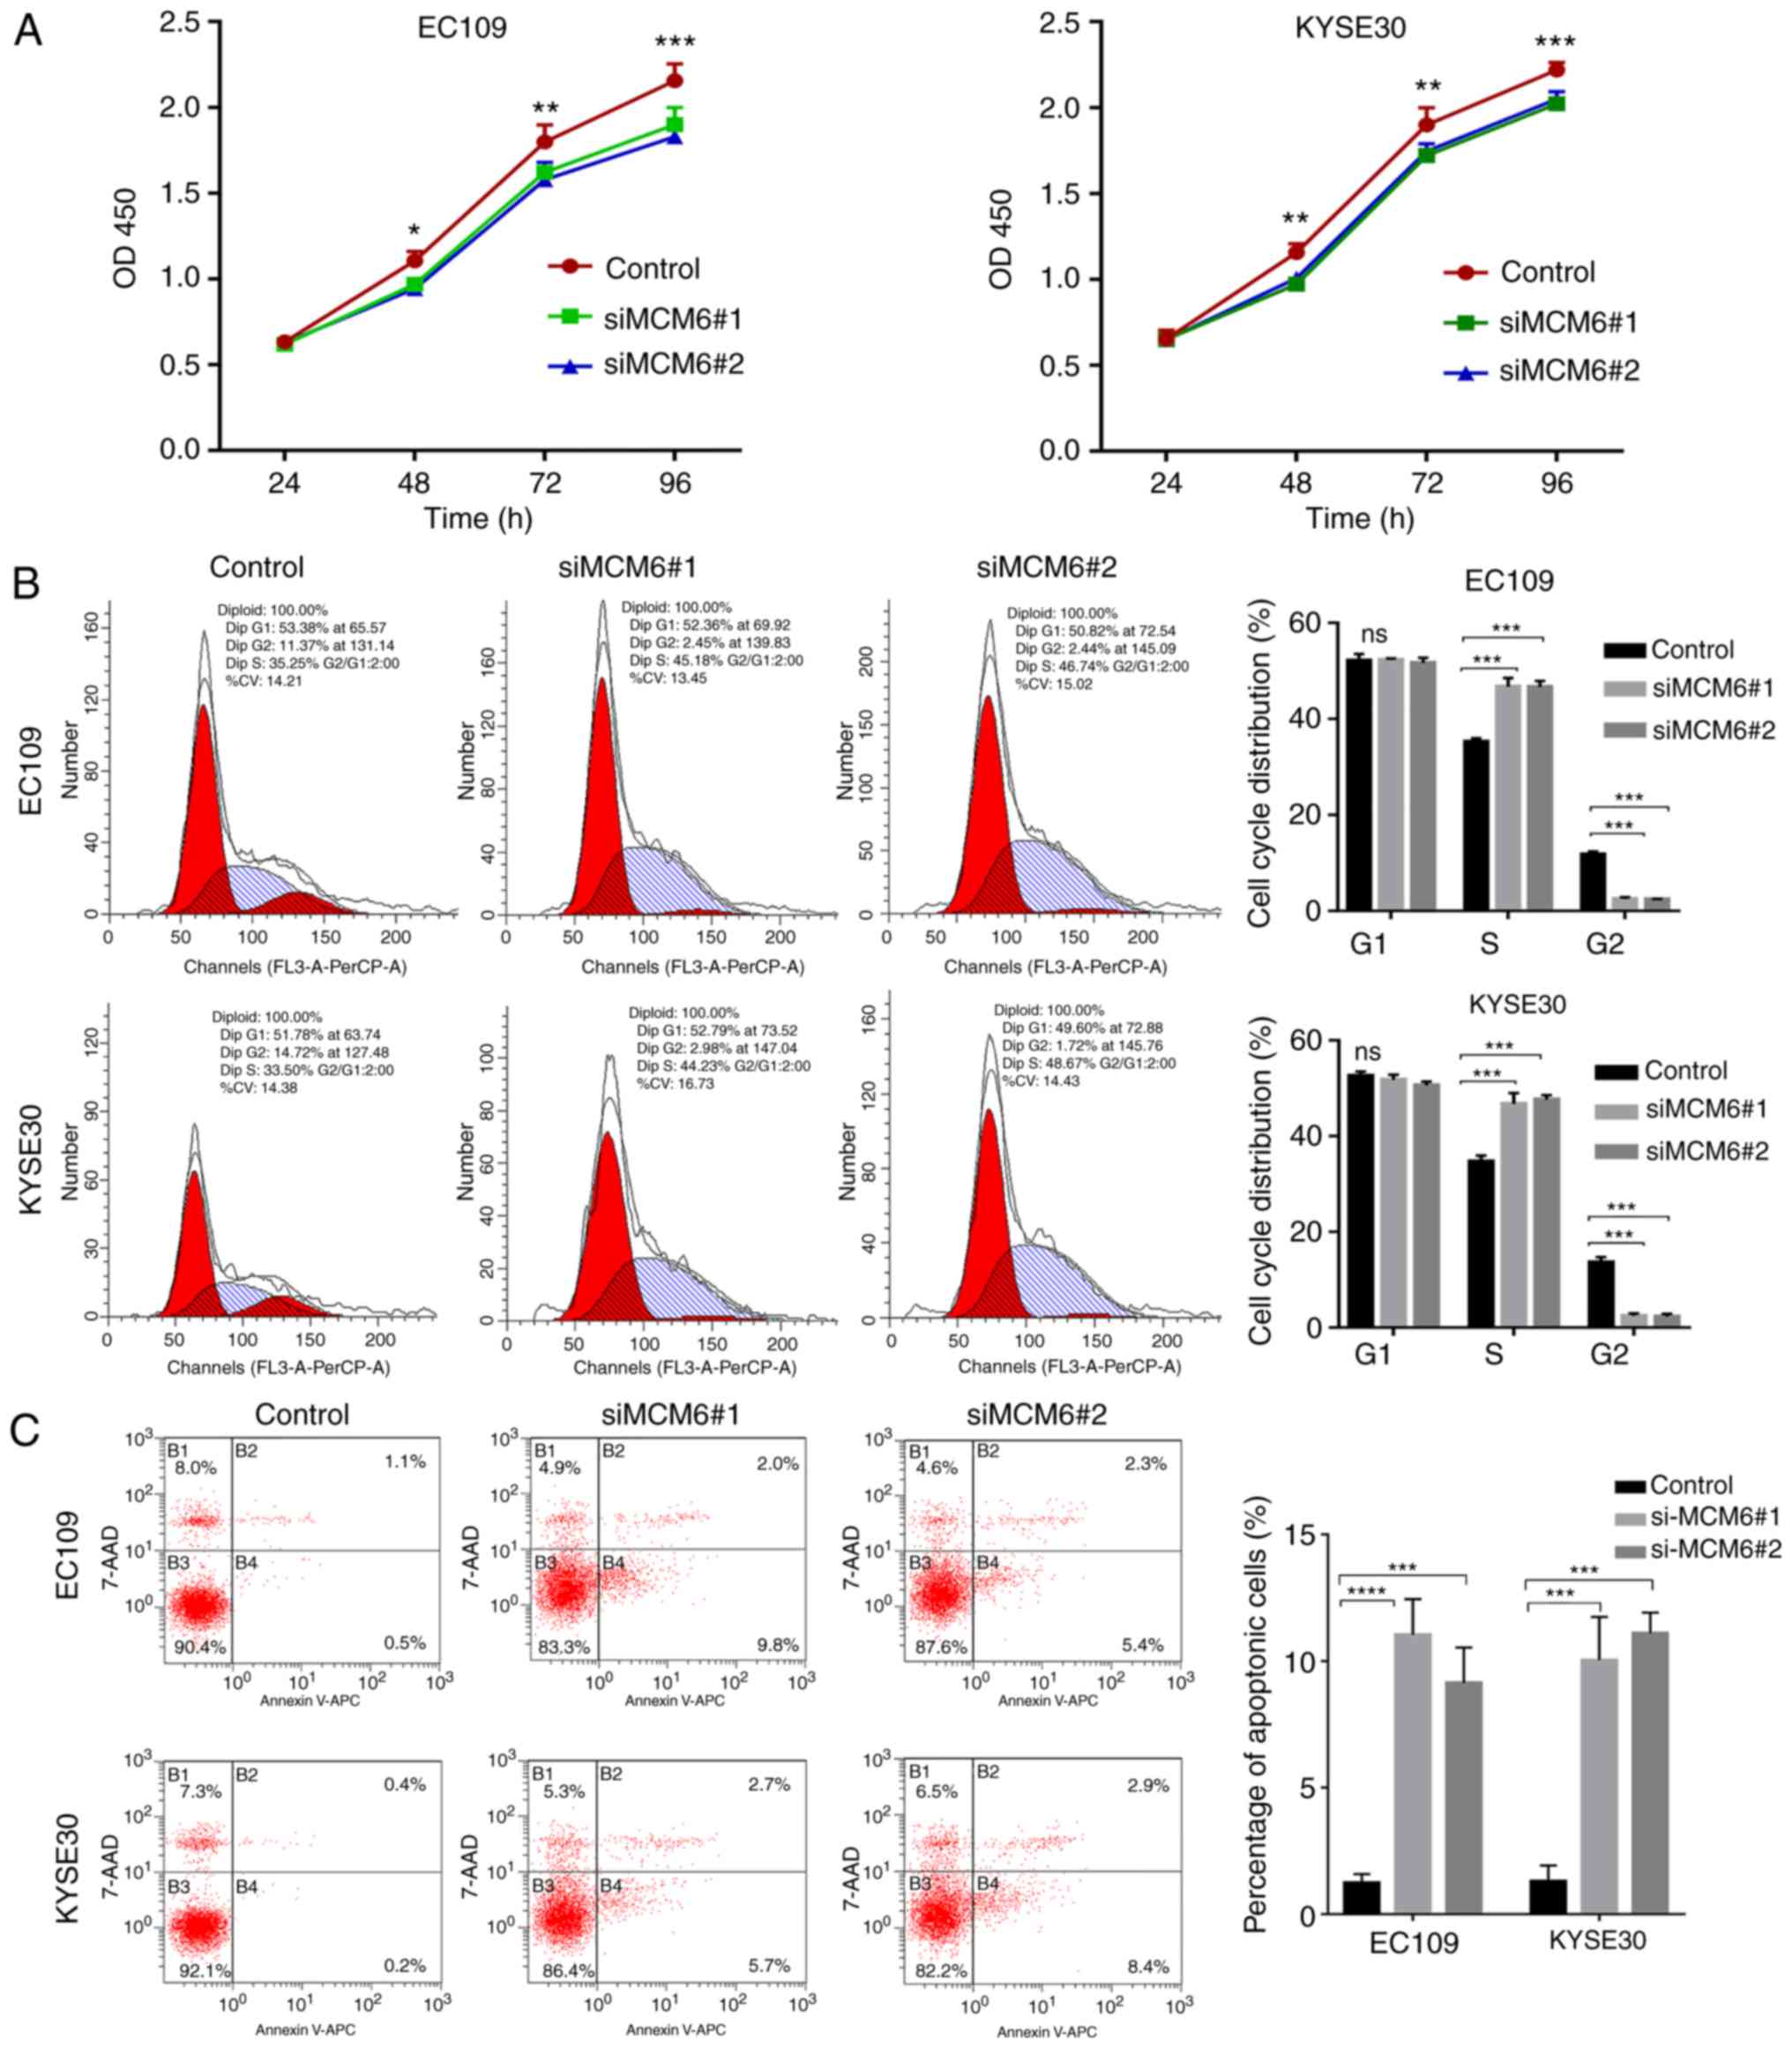
To determine the effect of MCM6 on cell
proliferation, the CCK-8 assay was performed. The proliferation
rate of the cells transfected with siMCM6#1 and siMCM6#2 was
decreased compared with the control group, suggesting that the
downregulation of MCM6 inhibited the cell proliferation rate
(P<0.05) (Fig. 6A). The cell
cycle distribution in each group was detected by flow cytometry,
and the results showed that the number of cells in the S stage were
increased and those in the G2 stage decreased in the siMCM6#1 and
siMCM6#2 groups (P<0.05); however, no differences were observed
in the number of cells in the G1 stage in each group. The results
confirmed that cells were arrested in the S stage following siMCM6
transfection, which indicated that the knockdown of MCM6 inhibited
DNA reduplication activity, thereby inhibiting cell proliferation
(Fig. 6B).
The apoptotic rates in the siMCM6#1 and siMCM6#2
groups increased relative to the negative control group. The
results revealed that the knockdown of MCM6 promoted the apoptosis
of ESCC cells (Fig. 6C).
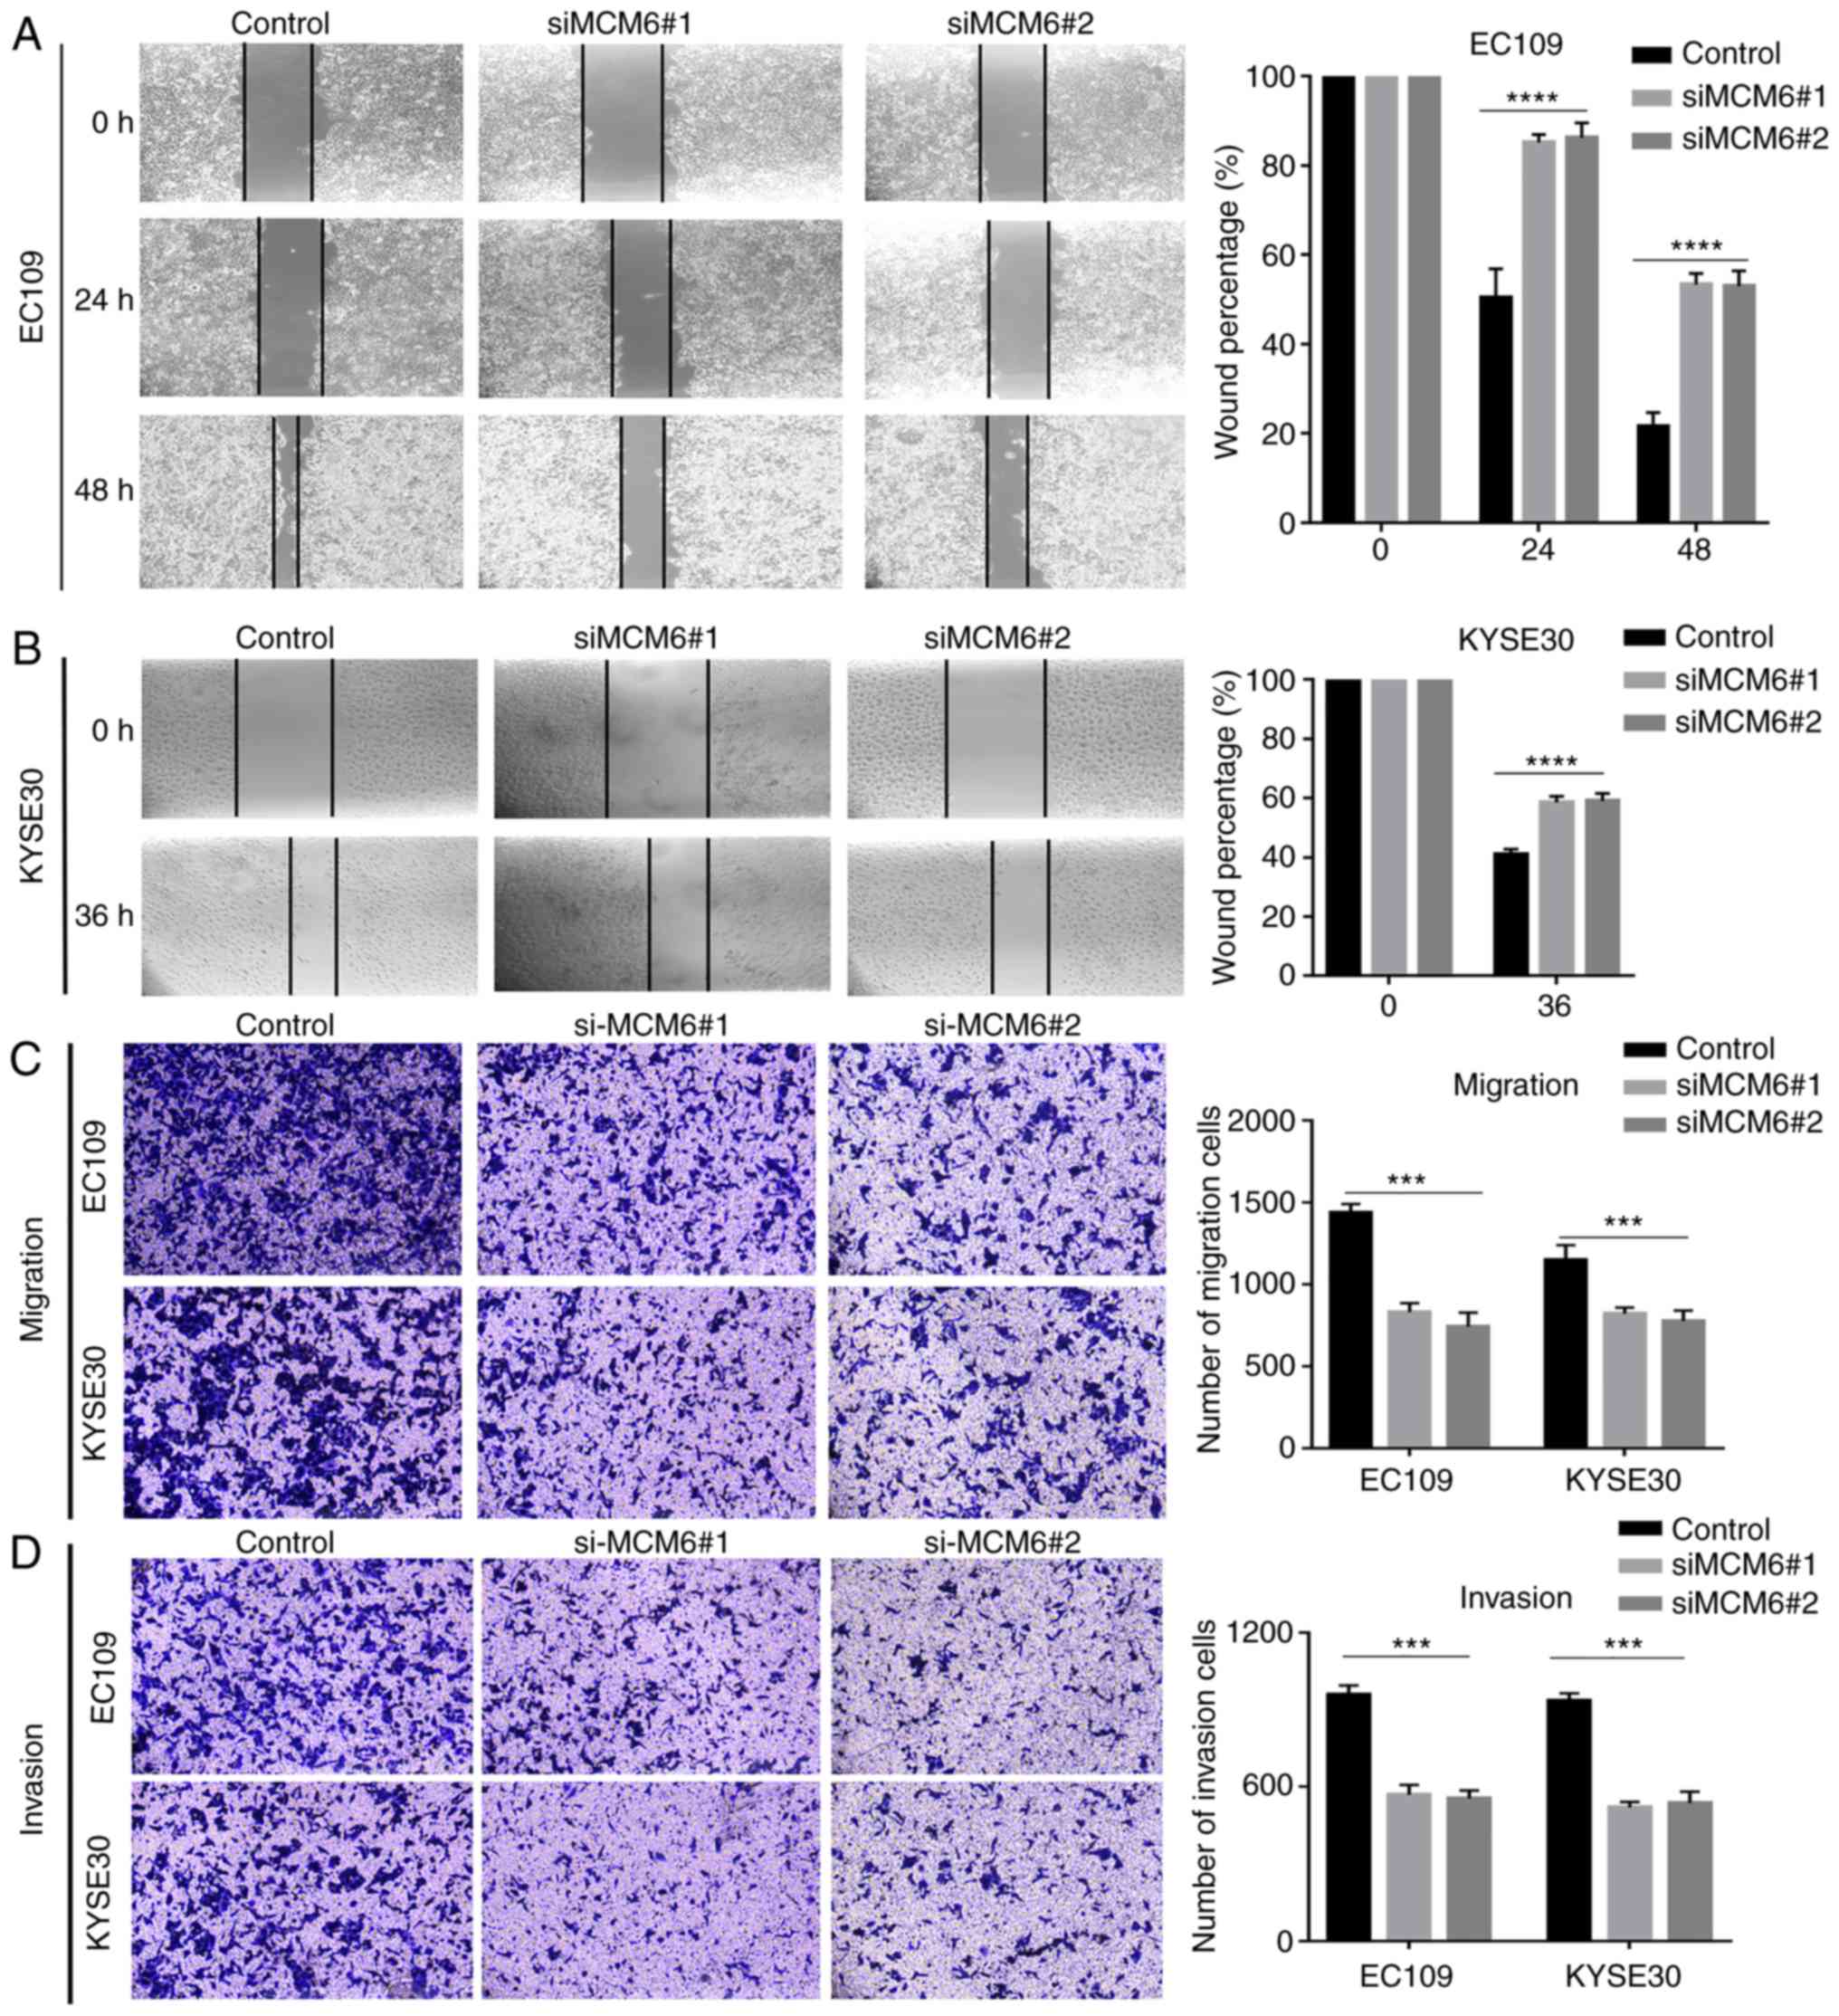
Downregulation of MCM6 inhibits cell
motility
Cell motility, including cell migration and
invasion, was evaluated using wound-healing and Transwell assays.
The wound-healing assay revealed that the negative control cells
exhibited a more rapid wound closure rate than the knockdown group,
suggesting that the migratory ability was significantly suppressed
after MCM6 was silenced (Fig. 7A and
B). Similarly, as shown by Transwell assay, the number of
migrating (Matrigel-uncoated) (Fig.
7C) or invading (Matrigel-coated) (Fig. 7D) cells in the bottom chamber
evidently decreased compared to the negative control group
following the knockdown of MCM6. These results suggested that the
knockdown of MCM6 significantly inhibited ESCC cell migration and
invasion.
Discussion
ESCC is associated with an extremely poor prognosis
attributed to its invasive and metastatic tendency. Due to the lack
of effective therapeutic strategies, it is imperative to develop a
therapeutic target to improve the survival rate. Although current
molecular targeted therapies have shown promise for the treatment
of ESCC, patient prognosis remains poor (8). The aim of the present study was to
identify novel biomarkers and therapeutic targets for ESCC using
bioinformatics analysis.
Bioinformatics, which combines computer science and
life science, aids in the elucidation of underlying molecular
mechanisms using the theories of computer science, statistics and
biological science, and reduces time and experimental expense
(39,40). High-throughput gene chip
technologies are widely used to elucidate the mechanisms underlying
the progression of ESCC, which provides an effective and innovative
approach for the diagnosis, treatment and prevention of ESCC. The
GEO database, which can be downloaded for free, is an open dataset,
and provides the webpage analysis tool (GEO2R) for the screening of
DEGs by GEO query and Limma package. In the present study, 4 mRNA
datasets were extracted, including 22 ESCC cell lines, 31 ESCC
tissues and 25 normal controls, and 68 core genes were identified
(48 upregulated and 20 downregulated genes) shared among the 4 GEO
datasets on ESCC by GEO2R. The 68 DEGs were then explored using
STRING and Cytoscape and PPI network was generated, which comprised
a key clustering module using the MCODE plugin. The module
consisted of 24 genes with the highest score (22.783), and the top
24 genes (which have the highest number of connections with
surrounding genes), included RFC4, TOP2A, CDC6, UBE2C, TPX2, MCM6,
TRIP13, CENPN, RAD51AP1, DTL, FOXM1, NUF2, TTK, CENPF, ECT2, KNTC1,
SPAG5, HELLS, KIF14, KIF4A, CDCA2, CKS1B, ATAD2 and MCM5. MCM6
exhibited great connectivity with other genes. Functional GO
annotation revealed that the genes were enriched in cell division,
mitotic nuclear division, chromosome segregation, DNA replication
and sister chromatid cohesion. KEGG enrichment analysis revealed a
significant association with cell cycle and DNA replication. These
results suggested that the genes may affect ESCC progression by
regulating cell division, mitotic nuclear division and DNA
replication, and the DEGs may be linked to ESCC progression through
the cell cycle pathway. Numerous gene chips and studies on ESCC
have aimed to elucidate the genes involved in ESCC progression.
Previous findings have also validated key transcription factors
involved in the development of ESCC, including cell cycle and DNA
replication (41,42), which also suggest that MCM6 exhibits
elevated expression and good connectivity with surrounding
genes.
MCM6 is a highly conserved MCM protein that is
essential for the initiation of eukaryotic genome replication and
may be involved in the recruitment of other DNA replication-related
proteins. It has been reported that MCM6 is upregulated in various
types of cancer, such as non-small cell lung carcinoma,
hepatocellular carcinoma and meningiomas (21,22,26).
Liu et al (26) verified the
upregulated expression of MCM6 in hepatocellular carcinoma and its
association with tumor number, early recurrence and liver
cirrhosis. However, the expression of MCM6 in ESCC remains obscure.
In the present study, MCM6 expression was investigated in ESCC
using bioinformatics analysis.
Firstly, in order to further validate aberrant MCM6
expression in EC using bioinformatics tools, Oncomine, UALCAN and
GEPIA were also utilized to examine the expression level of MCM6.
The results revealed the elevated expression of MCM6 in ESCC
compared to normal tissues, which was consistent with the former
bioinformatics analysis. TCGA data indicated that the expression of
MCM6 was associated with the grade of the disease and the ethnicity
of the patients with ESCC. IHC staining, which was conducted on 68
ESCC samples also confirmed the gain of expression of MCM6 in ESCC
tissues, and a high expression ratio (76.5%) in ESCC was observed
vs. the low ratio (26.75%) in normal tissues. Moreover, analysis of
the clinical parameters revealed that MCM6 expression was
associated with lymphatic metastasis and infiltration depth, which
was inconsistent with our bioinformatics analysis due to different
patient samples. Subsequently, RT-qPCR analysis of ESCC cell lines
also confirmed the gain of expression of MCM6. It was thus revealed
that MCM6 may be a diagnostic and therapeutic biomarker for
ESCC.
Cell proliferation, migration and invasion, as well
as apoptosis are the basic life activities of cells during the
process of development. Once the balance between these processes is
disrupted, a number of diseases may then develop (43). Malignant tumor cells exhibit
excessive proliferation, as well as abnormal migratory and invasive
ability and apoptosis (44,45). Therefore, the identification of
targeted genes associated with these processes are of utmost
importance. According to GO annotation, MCM6 plays a key role in
DNA replication initiation and in the G1/S transition of the
mitotic cell cycle, which were validated in later experiments
(18). In the present study,
following transfection of the EC109 and KYSE30 cells with
siRNA-MCM6#1 and siRNA-MCM6#2, CCK8, wound-healing and Transwell
assays (with or without Matrigel) and flow cytometry were performed
to determine the cell proliferative, migratory and invasive
ability, as well as cell apoptosis and the progression of the cell
cycle. The results indicated that the knockdown of MCM6 inhibited
the cell proliferative, migratory and invasive ability, and
promoted cell apoptosis; the cell cycle assay also revealed that
the cells were arrested at the S stage. These results suggested
that MCM6 affected the proliferation, migration and invasion, and
the apoptosis of EC cells.
In conclusion, the present study identified 24 DEGs
between ESCC and normal esophagus tissues by bioinformatics
analysis, and MCM6 was identified as the most important gene
in the network. Several other websites also validated the elevated
MCM6 expression, and IHC and RT-qPCR experimental validation also
confirmed the upregulation in ESCC, compared with normal tissues or
cell lines. Additionally, cell proliferation, cell migration and
invasion, and cell apoptosis assays suggested that MCM6 plays an
important role in the progression of ESCC.
Supplementary Material
Supporting Data
Acknowledgements
We acknowledge the researchers for providing their
GEO database information online and their contributions to the
database.
Funding
The study was supported by the Henan Provincial
Department of Education Key Science and Technology Project (grant
no. 18A320007), the Ministry of Health and Welfare Committee (grant
no. SBGJ2018013) and Key Medical Science and Technology Project of
Health Department (grant no. 201503008).
Availability of data and materials
The datasets used and/or analyzed during the current
study are available in this published article.
Authors' contributions
XL and JG designed the study, and XL wrote the
manuscript and contributed to the analysis or interpretation of the
data. ZR, CX and CL participated in the experiment performing and
the revision of the manuscript. YL provided the design of the study
and analysis of the data. CR provided the laboratory support,
analysis and interpretation of data and the direction of experiment
performing. As the corresponding author, HL was responsible for the
design of the experiments, the revision of the manuscript and final
decision to submit the article for publication and also accountable
for all aspects of the work. All authors have read and approved the
final manuscript.
Ethics approval and consent to
participate
This study was approved by the Ethics Committee of
the First Affiliated Hospital of Zhengzhou University. All patients
have signed informed consents.
Patient consent for publication
Not applicable.
Competing interests
The authors declare that they have no competing
interests.
Glossary
Abbreviations
Abbreviations:
|
EC
|
esophageal cancer
|
|
ESCC
|
esophageal squamous cell carcinoma
|
|
EAC
|
esophageal adenocarcinoma
|
|
MCM6
|
minichromosome maintenance 6
|
|
GEO
|
Gene Expression Omnibus
|
|
STRING
|
the search tool for the retrieval of
interacting genes
|
|
TCGA
|
The Cancer Genome Atlas
|
|
MCODE
|
molecular complex detection
|
|
DAVID
|
Database for Annotation,
Visualization, and Integrated Discovery
|
|
PPI
|
protein-protein interaction
|
|
GO
|
Gene Ontology
|
|
BP
|
biological process
|
|
CC
|
cellular component
|
|
MF
|
molecular function
|
|
KEGG
|
Kyoto Encyclopedia of Genes and
Genomes
|
|
GEPIA
|
Gene Expression Profiling Interactive
Analysis
|
|
GTEx
|
genotype tissue expression
|
|
CI
|
confidence intervals
|
|
HR
|
hazard ratios
|
|
DEGs
|
differentially expressed genes
|
References
|
1
|
Siewert JR and Ott K: Are squamous and
adenocarcinomas of the esophagus the same disease? Semin Radiat
Oncol. 17:38–44. 2007. View Article : Google Scholar : PubMed/NCBI
|
|
2
|
Chen W, Zheng R, Baade PD, Zhang S, Zeng
H, Bray F, Jemal A, Yu XQ and He J: Cancer statistics in China,
2015. CA Cancer J Clin. 66:115–132. 2016. View Article : Google Scholar : PubMed/NCBI
|
|
3
|
Jemal A, Center MM, DeSantis C and Ward
EM: Global patterns of cancer incidence and mortality rates and
trends. Cancer Epidemiol Biomarkers Prev. 19:1893–1907. 2010.
View Article : Google Scholar : PubMed/NCBI
|
|
4
|
Zeng H, Zheng R, Zhang S, Zuo T, Xia C,
Zou X and Chen W: Esophageal cancer statistics in China, 2011:
Estimates based on 177 cancer registries. Thorac Cancer. 7:232–237.
2016. View Article : Google Scholar : PubMed/NCBI
|
|
5
|
Xing D, Tan W and Lin D: Genetic
polymorphisms and susceptibility to esophageal cancer among Chinese
population (review). Oncol Rep. 10:1615–1623. 2003.PubMed/NCBI
|
|
6
|
Domper Arnal MJ, Ferrández Arenas Á and
Lanas Arbeloa Á: Esophageal cancer: Risk factors, screening and
endoscopic treatment in Western and Eastern countries. World J
Gastroenterol. 21:7933–743. 2015. View Article : Google Scholar : PubMed/NCBI
|
|
7
|
Wang L, Xiong Y, Sun Y, Fang Z, Li L, Ji H
and Shi T: HLungDB: An integrated database of human lung cancer
research. Nucleic Acids Res. 38((Database Issue)): D665–D669. 2010.
View Article : Google Scholar : PubMed/NCBI
|
|
8
|
Hirano H and Kato K: Systemic treatment of
advanced esophageal squamous cell carcinoma: Chemotherapy,
molecular-targeting therapy and immunotherapy. Jpn J Clin Oncol.
49:412–420. 2019. View Article : Google Scholar : PubMed/NCBI
|
|
9
|
Deng HY, Wang WP, Wang YC, Hu WP, Ni PZ,
Lin YD and Chen LQ: Neoadjuvant chemoradiotherapy or chemotherapy?
A comprehensive systematic review and meta-analysis of the options
for neoadjuvant therapy for treating oesophageal cancer. Eur J
Cardiothorac Surg. 51:421–431. 2017.PubMed/NCBI
|
|
10
|
Talukdar FR, di Pietro M, Secrier M,
Moehler M, Goepfert K, Lima SSC, Pinto LFR, Hendricks D, Parker MI
and Herceg Z: Molecular landscape of esophageal cancer:
Implications for early detection and personalized therapy. Ann N Y
Acad Sci. 1434:342–359. 2018. View Article : Google Scholar : PubMed/NCBI
|
|
11
|
Aibar S, Abaigar M, Campos-Laborie FJ,
Sánchez-Santos JM, Hernandez-Rivas JM and De Las Rivas J:
Identification of expression patterns in the progression of disease
stages by integration of transcriptomic data. BMC Bioinformatics.
17 (Suppl 15):S4322016. View Article : Google Scholar
|
|
12
|
Golding GB: DNA and the revolutions of
molecular evolution, computational biology, and bioinformatics.
Genome. 46:930–935. 2003. View
Article : Google Scholar : PubMed/NCBI
|
|
13
|
Larson RS: Bioinformatics and drug
discovery. Second. Mathods Mol Biol; 910. 2012, PubMed/NCBI
|
|
14
|
Gaulton A, Bellis LJ, Bento AP, Chambers
J, Davies M, Hersey A, Light Y, McGlinchey S, Michalovich D,
Al-Lazikani B and Overington JP: ChEMBL: A large-scale bioactivity
database for drug discovery. Nucleic Acids Res. 40((Database
Issue)): D1100–D1107. 2012. View Article : Google Scholar : PubMed/NCBI
|
|
15
|
Tanya B, Troup DB, Wilhite SE, Ledoux P,
Evangelista C, Kim IF, Tomashevsky M, Marshall KA, Phillippy KH,
Sherman PM, et al: NCBI GEO: Archive for functional genomics data
sets-10 years on. Nucleic Acids Res. 39((Database Issue)):
D1005–D1010. 2011.PubMed/NCBI
|
|
16
|
Edgar R, Domrachev M and Lash AE: Gene
expression omnibus: NCBI gene expression and hybridization array
data repository. Nucleic Acids Res. 30:207–210. 2002. View Article : Google Scholar : PubMed/NCBI
|
|
17
|
Tye BK: MCM proteins in DNA replication.
Annu Rev Biochem. 68:649–686. 1999. View Article : Google Scholar : PubMed/NCBI
|
|
18
|
Forsburg SL: Eukaryotic MCM proteins:
Beyond replication initiation. Microbiol Mol Biol Rev. 68:109–131.
2004. View Article : Google Scholar : PubMed/NCBI
|
|
19
|
Fitch MJ, Donato JJ and Tye BK: Mcm7, a
subunit of the presumptive MCM helicase, modulates its own
expression in conjunction with Mcm1. J Biol Chem. 278:25408–25416.
2003. View Article : Google Scholar : PubMed/NCBI
|
|
20
|
Chong JP, Mahbubani HM, Khoo CY and Blow
JJ: Purification of an MCM-containing complex as a component of the
DNA replication licensing system. Nature. 375:418–421. 1995.
View Article : Google Scholar : PubMed/NCBI
|
|
21
|
Gauchotte G, Vigouroux C, Rech F,
Battaglia-Hsu SF, Soudant M, Pinelli C, Civit T, Taillandier L,
Vignaud JM and Bressenot A: Expression of minichromosome
maintenance MCM6 protein in meningiomas is strongly correlated with
histologic grade and clinical outcome. Am J Surg Pathol.
36:283–291. 2012. View Article : Google Scholar : PubMed/NCBI
|
|
22
|
Vigouroux C, Casse JM, Battaglia-Hsu SF,
Brochin L, Luc A, Paris C, Lacomme S, Gueant JL, Vignaud JM and
Gauchotte G: Methyl(R217)HuR and MCM6 are inversely correlated and
are prognostic markers in non small cell lung carcinoma. Lung
Cancer. 89:189–196. 2015. View Article : Google Scholar : PubMed/NCBI
|
|
23
|
Helfenstein A, Frahm SO, Krams M, Drescher
W, Parwaresch R and Hassenpflug J: Minichromosome maintenance
protein (MCM6) in low-grade chondrosarcoma: Distinction from
enchondroma and identification of progressive tumors. Am J Clin
Pathol. 122:912–918. 2004. View Article : Google Scholar : PubMed/NCBI
|
|
24
|
Hotton J, Agopiantz M, Leroux A,
Charra-Brunaud C, Marie B, Busby-Venner H, Morel O, Guéant JL,
Vignaud JM, Battaglia-Hsu SF and Gauchotte G: Minichromosome
maintenance complex component 6 (MCM6) expression correlates with
histological grade and survival in endometrioid endometrial
adenocarcinoma. Virchows Arch. 472:623–633. 2018. View Article : Google Scholar : PubMed/NCBI
|
|
25
|
Hendricks A, Gieseler F, Nazzal S, Bräsen
JH, Lucius R, Sipos B, Claasen JH, Becker T, Hinz S, Burmeister G,
et al: Prognostic relevance of topoisomerase II α and
minichromosome maintenance protein 6 expression in colorectal
cancer. BMC Cancer. 19:4292019. View Article : Google Scholar : PubMed/NCBI
|
|
26
|
Liu M, Hu Q, Tu M, Wang X, Yang Z, Yang G
and Luo R: MCM6 promotes metastasis of hepatocellular carcinoma via
MEK/ERK pathway and serves as a novel serum biomarker for early
recurrence. J Exp Clin Cancer Res. 37:102018. View Article : Google Scholar : PubMed/NCBI
|
|
27
|
Zheng T, Chen M, Han S, Zhang L, Bai Y,
Fang X, Ding SZ and Yang Y: Plasma minichromosome maintenance
complex component 6 is a novel biomarker for hepatocellular
carcinoma patients. Hepatol Res. 44:1347–1356. 2014. View Article : Google Scholar : PubMed/NCBI
|
|
28
|
Shade A and Handelsman J: Beyond the Venn
diagram: The hunt for a core microbiome. Environ Microbiol.
14:4–12. 2012. View Article : Google Scholar : PubMed/NCBI
|
|
29
|
Szklarczyk D, Morris JH, Cook H, Kuhn M,
Wyder S, Simonovic M, Santos A, Doncheva NT, Roth A, Bork P, et al:
The STRING database in 2017: Quality-controlled protein-protein
association networks, made broadly accessible. Nucleic Acids Res.
45(D1): D362–D368. 2017. View Article : Google Scholar : PubMed/NCBI
|
|
30
|
Szklarczyk D, Franceschini A, Wyder S,
Forslund K, Heller D, Huerta-Cepas J, Simonovic M, Roth A, Santos
A, Tsafou KP, et al: STRING v10: Protein-protein interaction
networks, integrated over the tree of life. Nucleic Acids Res.
43((Database Issue)): D447–D452. 2015. View Article : Google Scholar : PubMed/NCBI
|
|
31
|
Shannon P, Markiel A, Ozier O, Baliga NS,
Wang JT, Ramage D, Amin N, Schwikowski B and Ideker T: Cytoscape: A
software environment for integrated models of biomolecular
interaction networks. Genome Res. 13:2498–2504. 2003. View Article : Google Scholar : PubMed/NCBI
|
|
32
|
Huang da W, Sherman BT and Lempicki RA:
Systematic and integrative analysis of large gene lists using DAVID
bioinformatics resources. Nat Protoc. 4:44–57. 2009. View Article : Google Scholar : PubMed/NCBI
|
|
33
|
Gene Ontology Consortium: The gene
ontology (GO) project in 2006. Nucleic Acids Res. 34((Database
Issue)): D322–D326. 2006. View Article : Google Scholar : PubMed/NCBI
|
|
34
|
Kanehisa M and Goto S: KEGG: Kyoto
encyclopaedia of genes and genomes. Nucleic Acids Res. 28:27–30.
2000. View Article : Google Scholar : PubMed/NCBI
|
|
35
|
Rhodes DR, Kalyana-Sundaram S, Mahavisno
V, Varambally R, Yu J, Briggs BB, Barrette TR, Anstet MJ,
Kincead-Beal C, Kulkarni P, et al: Oncomine 3.0: Genes, pathways,
and networks in a collection of 18,000 cancer gene expression
profiles. Neoplasia. 9:166–180. 2007. View Article : Google Scholar : PubMed/NCBI
|
|
36
|
Tang Z, Li C, Kang B, Gao G, Li C and
Zhang Z: GEPIA: A web server for cancer and normal gene expression
profiling and interactive analyses. Nucleic Acids Res. 45((W1)):
W98–W102. 2017. View Article : Google Scholar : PubMed/NCBI
|
|
37
|
Chandrashekar DS, Bashel B, Balasubramanya
SAH, Creighton CJ, Ponce-Rodriguez I, Chakravarthi BVSK and
Varambally S: UALCAN: A portal for facilitating tumor subgroup gene
expression and survival analyses. Neoplasia. 19:649–658. 2017.
View Article : Google Scholar : PubMed/NCBI
|
|
38
|
Livak KJ and Schmittgen TD: Analysis of
relative gene expression data using real-time quantitative PCR and
the 2(-Delta Delta C(T)) method. Methods. 25:402–408. 2001.
View Article : Google Scholar : PubMed/NCBI
|
|
39
|
do Valle ÍF, Menichetti G, Simonetti G,
Bruno S, Zironi I, Durso DF, Mombach JCM, Martinelli G, Castellani
G and Remondini D: Network integration of multi-tumour omics data
suggests novel targeting strategies. Nat Commun. 9:45142018.
View Article : Google Scholar : PubMed/NCBI
|
|
40
|
Hashemifar S, Neyshabur B, Khan AA and Xu
J: Predicting protein-protein interactions through sequence-based
deep learning. Bioinformatics. 34:i802–i810. 2018. View Article : Google Scholar : PubMed/NCBI
|
|
41
|
He W, Chen L, Yuan K, Zhou Q, Peng L and
Han Y: Gene set enrichment analysis and meta-analysis to identify
six key genes regulating and controlling the prognosis of
esophageal squamous cell carcinoma. J Thorac Dis. 10:5714–5726.
2018. View Article : Google Scholar : PubMed/NCBI
|
|
42
|
Zhang Y, Xu Y, Li Z, Zhu Y, Wen S, Wang M,
Lv H, Zhang F and Tian Z: Identification of the key transcription
factors in esophageal squamous cell carcinoma. J Thorac Dis.
10:148–161. 2018. View Article : Google Scholar : PubMed/NCBI
|
|
43
|
Ahmed AA, Mohamed AD, Gener M, Li W and
Taboada E: YAP and the hippo pathway in pediatric cancer. Mol Cell
Oncol. 4:e12951272017. View Article : Google Scholar : PubMed/NCBI
|
|
44
|
Hanahan D and Weinberg RA: Hallmarks of
cancer: The next generation. Cell. 144:646–674. 2011. View Article : Google Scholar : PubMed/NCBI
|
|
45
|
Hanahan D and Weinberg RA: The hallmarks
of cancer. Cell. 100:57–70. 2000. View Article : Google Scholar : PubMed/NCBI
|
|
46
|
Saito S, Morishima K, Ui T, Hoshino H,
Matsubara D, Ishikawa S, Aburatani H, Fukayama M, Hosoya Y, Sata N,
et al: The role of HGF/MET and FGF/FGFR in fibroblast-derived
growth stimulation and lapatinib-resistance of esophageal squamous
cell carcinoma. BMC Cancer. 15:822015. View Article : Google Scholar : PubMed/NCBI
|
|
47
|
Wang Q, Ma C and Kemmner W: Wdr66 is a
novel marker for risk stratification and involved in
epithelial-mesenchymal transition of esophageal squamous cell
carcinoma. BMC Cancer. 13:1372013. View Article : Google Scholar : PubMed/NCBI
|
|
48
|
Lee JJ, Natsuizaka M, Ohashi S, Wong GS,
Takaoka M, Michaylira CZ, Budo D, Tobias JW, Kanai M, Shirakawa Y,
et al: Hypoxia activates the cyclooxygenase-2-prostaglandin E
synthase axis. Carcinogenesis. 31:427–434. 2010. View Article : Google Scholar : PubMed/NCBI
|
|
49
|
Erkizan HV, Johnson K, Ghimbovschi S,
Karkera D, Trachiotis G, Adib H, Hoffman EP and Wadleigh RG:
African-American esophageal squamous cell carcinoma expression
profile reveals dysregulation of stress response and detox
networks. BMC Cancer. 17:4262017. View Article : Google Scholar : PubMed/NCBI
|
|
50
|
Su H, Hu N, Yang HH, Wang C, Takikita M,
Wang QH, Giffen C, Clifford R, Hewitt SM, Shou JZ, et al: Global
gene expression profiling and validation in esophageal squamous
cell carcinoma and its association with clinical phenotypes. Clin
Cancer Res. 17:2955–2966. 2011. View Article : Google Scholar : PubMed/NCBI
|
|
51
|
Hu N, Clifford RJ, Yang HH, Wang C,
Goldstein AM, Ding T, Taylor PR and Lee MP: Genome wide analysis of
DNA copy number neutral loss of heterozygosity (CNNLOH) and its
relation to gene expression in esophageal squamous cell carcinoma.
BMC Genomics. 11:5762010. View Article : Google Scholar : PubMed/NCBI
|
|
52
|
Kimchi ET, Posner MC, Park JO, Darga TE,
Kocherginsky M, Karrison T, Hart J, Smith KD, Mezhir JJ,
Weichselbaum RR and Khodarev NN: Progression of Barrett's
metaplasia to adenocarcinoma is associated with the suppression of
the transcriptional programs of epidermal differentiation. Cancer
Res. 65:3146–3154. 2005. View Article : Google Scholar : PubMed/NCBI
|
|
53
|
Wang S, Zhan M, Yin J, Abraham JM, Mori Y,
Sato F, Xu Y, Olaru A, Berki AT, Li H, et al: Transcriptional
profiling suggests that Barrett's metaplasia is an early
intermediate stage in esophageal adenocarcinogenesis. Oncogene.
25:3346–3356. 2006. View Article : Google Scholar : PubMed/NCBI
|
|
54
|
Hao Y, Triadafilopoulos G, Sahbaie P,
Young HS, Omary MB and Lowe AW: Gene expression profiling reveals
stromal genes expressed in common between Barrett's esophagus and
adenocarcinoma. Gastroenterology. 131:925–933. 2006. View Article : Google Scholar : PubMed/NCBI
|
|
55
|
Kim SM, Park YY, Park ES, Cho JY, Izzo JG,
Zhang D, Kim SB, Lee JH, Bhutani MS, Swisher SG, et al: Prognostic
biomarkers for esophageal adenocarcinoma identified by analysis of
tumor transcriptome. PLoS One. 5:e150742010. View Article : Google Scholar : PubMed/NCBI
|