Introduction
Over the past 4 decades, there has been a sharp
increase in the number of cases of thyroid cancer, and it is
recognized as the most frequent endocrine malignancy worldwide
(1,2). In the USA, thyroid cancer is the fifth
most common type of cancer among women, and the most frequently
diagnosed malignancy in individuals aged <30 years in China
(1,3). In addition, in 2016, it was reported
that 64,300 individuals were diagnosed with thyroid cancer in the
USA (4). The incidence rate of
thyroid cancer in China is 6.6 per 100,000 individuals (5). Papillary thyroid cancer (PTC) accounts
for ~80% of all cases of thyroid cancer (6). Patients with PTC have a more favorable
prognosis, which is attributed to improvements in radiotherapy,
endocrine replacement therapy and complete thyroidectomy (7). However, >25% of patients experience
recurrence during long-term follow-up (8). Therefore, the identification of novel
diagnostic and prognostic biomarkers is crucial for patients with
PTC.
It has been demonstrated that PTC is associated with
mutations, such as point mutations in B-Raf proto-oncogene,
serine/threonine kinase (BRAF) and RAS GTPase (RAS)
or gene rearrangements in either ret proto-oncogene (RET),
neurotrophic receptor tyrosine kinase 1 (NTRK1) and
anaplastic lymphoma kinase (ALK) (9–12). In
addition, long non-coding RNAs (lncRNAs), have been found to be
important contributors to the oncogenesis of PTC (13,14).
lncRNAs do not possess protein-coding capacities and usually
consist of >200 nucleotides, and can be categorized into
antisense, sense, bidirectional, intronic and intergenic lncRNAs
according to their genomic context (15). lncRNAs can regulate gene expression
and are involved in numerous biological processes, such as cell
invasion and migration, apoptosis and proliferation, cell cycle and
cell proliferation (13), and were
initially observed to be aberrantly expressed during tumorigenesis
(16). For example, several lncRNAs
function as tumor promoters in PTC, such as nuclear paraspeckle
assembly transcript 1 (NEAT1) (17), LOC100507661 (18), colon cancer-associated transcript 1
(CCAT1) (19) and AFAP1 antisense
RNA 1 (AFAP1-AS1) (20), while
other lncRNAs function as tumor suppressors for example, papillary
thyroid cancer susceptibility candidate 3 (PTCSC3) (21), maternally expressed 3 (MEG3)
(22) and long intergenic
non-coding RNA 271 (LINC00271) (23). In addition, H19 has been reported to
function as both a suppressor and promoter of tumorigenesis in
different PTC cell lines (24,25).
Despite recent progress in the understanding of the functions of
lncRNAs, their functional roles remain elusive. In particular, the
involvement of lncRNAs in thyroid tumorigenesis has not yet been
fully explored.
The present study aimed to explore differentially
expressed lncRNAs in PTC tissue and paired adjacent normal tissue
samples using a lncRNA microarray and to identify the functional
role of LINC02454 in PTC oncogenesis.
Materials and methods
Tissue acquisition
A total of 104 thyroid cancer tissue and paired
adjacent normal samples were obtained from patients with thyroid
cancer who received a thyroidectomy at the Second Affiliated
Hospital of Nanjing Medical University between 2015 and 2017. Each
specimen was immediately flash-frozen in liquid nitrogen before
storage at −80°C until further experimentation. The following
criteria were used for patient selection: No previous treatment and
a diagnosis of PTC confirmed by histopathological examination. The
8th edition of the American Joint Committee on Cancer
classification system was used for tumor-node-metastasis (TNM)
staging (26). The study protocols
were reviewed and approved by the Ethics Committee of the Second
Affiliated Hospital of Nanjing Medical University (no. 2014 KY no.
054). All patients provided written informed consent prior to
participation.
Hematoxylin and eosin staining
The pathological tissues were obtained by surgery,
and fixed with 10% formaldehyde and then embedded in paraffin and
sliced at a thickness of 4 µm. For hematoxylin and eosin
(H&E) staining, paraffin-embedded thyroid tissue sections were
deparaffinized with xylene for 5 min (this process was repeated
once), 100% ethanol for 5 min, 90% ethanol for 2 min, 80% ethanol
for 2 min, 70% ethanol for 2 min, and washed with distilled water
for 2 min. The sections (4-µm-thick) were stained with hematoxylin
stain (Beyotime Institute of Biotechnology, Inc.) for 5 min and
washed with distilled water for 10 min at room temperature. The
sections were differentiated with acid alcohol slow differentiation
solution (Beyotime Institute of Biotechnology, Inc.) for 30 sec and
soaked in distilled water for 15 min. The sections were stained
with eosin stain (Beyotime Institute of Biotechnology, Inc.) for 2
min at room temperature. Slides were viewed with a Nikon Eclipse
80i microscope equipped with a digital camera (DS-Ri1; Nikon
Corp.).
Microarray profiling
RNA was isolated from 4 thyroid cancer tissues and 4
paired adjacent normal tissues and used for integrated lncRNA/mRNA
microarray analysis (CapitalBio Technology, Inc.). RNA preparation
and hybridization of the arrays were performed with minor
alterations to the manufacturer's protocols. Firstly, mRNA was
purified to remove ribosomal RNA with the mRNA-ONLY Eukaryotic mRNA
Isolation kit (Epicentre; Illumina, Inc.). Fluorescent cRNAs were
produced using amplification and transcription of the whole
transcriptome, to avoid 3′bias. The arrays were subsequently
processed using an Agilent scanner and the images were analyzed
using the Agilent Feature Extraction software (version 11.0.1.1),
while the GeneSpring GX v12.0 software package was used to
normalize quantiles and for subsequent data processing (all Agilent
Technologies, Inc.). lncRNAs and mRNAs that possessed tags of
present or marginal (All Targets Value) in the 4 samples following
quartile normalization of the raw data were subjected to additional
analyses. Hierarchical clustering was used to illustrate patterns
of lncRNA and mRNA expression.
Cell lines and cell culture
The 2 PTC cell lines used in the present study (TPC1
and IHH4) were a gift from Dr Chao Liu of Nanjing University of
Chinese Medicine. The cells were cultured with RPMI-1640 medium
(Invitrogen; Thermo Fisher Scientific, Inc.) supplemented with 1%
penicillin/streptomycin and 10% fetal bovine serum (Gibco; Thermo
Fisher Scientific, Inc) at 37°C in a humidified incubator with 5%
CO2.
RNA isolation, cDNA synthesis and
reverse transcription-quantitative PCR (RT-qPCR)
RNA was extracted from cell lines, tumor tissues,
and adjacent normal tissues using TRIzol® reagent
(Invitrogen; Thermo Fisher Scientific, Inc.). The RevertAid First
Strand cDNA synthesis kit (Thermo Fisher Scientific, Inc.) was used
to synthesize cDNA according to the manufacturer's instructions. An
ABI 7500 Real-Time PCR system was used with SYBR-Green Real-Time
PCR master mix (Toyobo Life Science) to determine the mRNA
expression levels of LINC02454 using the recommended protocols. The
PCR reactions were repeated for 40 cycles under the following
conditions: 95°C for 15 sec, 60°C for 15 sec and 72°C for 45 sec.
Relative expression levels were determined using the ΔCt method,
and GAPDH expression was used as the internal control. The
following primers were used, which were synthesized by Invitrogen
(Thermo Fisher Scientific, Inc.): LINC02454 forward,
5′-GCTTGAACATCGTCCTCCTC-3′ and reverse, 5′-TGTTCTCTGTGGGAATGCAA-3′;
GAPDH forward, 5′-GAAGGTGAAGGTCGGAGTC-3′ and reverse,
5′-GAAGATGGTGATGGGATTTC-3′.
The Cancer Genome Atlas (TCGA)
analysis
RNA sequencing data for 502 thyroid tumor samples
and 58 normal tissue samples were retrieved from TCGA (https://portal.gdc.cancer.gov/). Clinical
information, such as lymph node count, TNM stage and pathological
stage was also downloaded. Information regarding the BRAF mutation
status, as well as the status and time of disease-free survival
were collected from the cBioPortal for Cancer Genomics (http://www.cbioportal.org/). A total of 484 patients
had complete survival information. The limma package (27) of R was used to identify
differentially expressed lncRNAs between PTC and adjacent normal
samples. P<0.05 and a fold change (FC) >2 were selected as
cut-off values. The expression levels of LINC02254 was also
investigated for an association with different clinical traits. For
association analysis, only the tumor samples were used.
Kaplan-Meier survival analysis was performed to examine the
potential impact of the expression level of LINC02454 on the
prognostic survival of patients with PTC. Receiver operating
characteristic (ROC) curve analysis was used to examine the powers
of the levels of LINC02454 expression for disease-free survival
diagnosis. The Youden index was set as the cut-off point to
estimate sensitivity, specificity and positive diagnostic
likelihood ratio. The high and low levels of LINC02454 expression
groups were set up based on the Youden index. Kaplan-Meier survival
analyses were performed to examine the potential effects of the
expression level of LINC02454 on the prognostic survival of the 484
patients with PTC. Additionally, the association of the
disease-free survival time of the patients with PTC with clinical
traits was also analyzed.
Verification of LINC02254 expression
in PTC using the GEO dataset
The lncRNA expression profiles of 5 pairs of PTC and
paired adjacent non-cancerous thyroid tissue samples were
downloaded from GEO (Accession no. GSE66783). The probe
CUST_4297_PI429285431 corresponds to a transcript of the LINC02454,
which is ENST00000539116.1.
Identification of LINC02454-associated
genes and protein-protein interaction (PPI) network
The 502 PTC samples downloaded from TCGA were
divided into 2 groups based on the median expression level of
LINC02454. The differentially expressed mRNAs between the low and
high LINC02454 expression groups were identified using the limma
package in R (27). An adjusted
P-value (adj. P) <0.01 and |logFC| >1 were used as the
cut-off values. The differentially expressed genes were determined
to be LINC02454-associated genes and subsequently used for PPI
analysis. The Search Tool for the Retrieval of Interacting
Genes/Proteins (STRING) database (http://string-db.org/) contains PPIs (28), and was used to construct a PPI
network of LINC02454-associated genes. The network was subsequently
visualized using Cytoscape (29).
Functional enrichment analysis
The Gene Ontology (GO) (http://www.geneontology.org) database consists of 3
categories: Molecular function (MF), cellular component (CC) and
biological process (BP) (30).
Systemic, chemical and genomic information was obtained from the
KEGG (http://www.genome.ad.jp/kegg/)
database (31). Significantly
enriched GO terms and KEGG pathways were identified using the
Database for Annotation, Visualization and Integrated Discovery
online tool (https://david.ncifcrf.gov/) with a threshold of
P<0.05 (32).
Small interfering (si)RNA
transfection
LINC02454 siRNA (si-LINC02454) and a negative
control (si-NC) were purchased from Shanghai GenePharma Co., Ltd.
The siRNA sequences are presented in Table I. Lipofectamine® 2000
(Invitrogen; Thermo Fisher Scientific, Inc.) was used to transfect
both si-LINC02454 and si-NC into the TPC1 cells, which were
incubated in 6-well plates. The TPC1 cells were grown to 50–70%
confluency and transfected with 100 nmol/l si-LINC02454 or si-NC
following the manufacturer's protocols. The knockdown efficiency of
si-LINC02454 was determined using RT-qPCR at 48 h following
transfection.
 | Table I.siRNA sequences. |
Table I.
siRNA sequences.
| si-RNA | Primer
sequences |
|---|
| si-LINC02454-1 | Sense:
5′-GCUUCCAAGGUCAUGCCUUTT-3′ |
|
| Antisense:
5′-AAGGCAUGACCUUGGAAGCTT-3′ |
| si-LINC02454-2 | Sense:
5′-GCCAGUUUCCUAAAUCAAATT-3′ |
|
| Antisense:
5′-UUUGAUUUAGGAAACUGGCTT-3′ |
| si-LINC02454-3 | Sense:
5′-GGCUUGGAGAUCCUCAUUUTT-3′ |
|
| Antisense:
5′-AAAUGAGGAUCUCCAAGCCTT-3′ |
| siRNA-NC | Sense:
5′-UUCUCCGAACGUGUCACGUTT-3′ |
|
| Antisense:
5′-ACGUGACACGUUCGGAGAATT-3′ |
Cell viability assay
The Cell Counting kit-8 (CCK-8; Dojindo Molecular
Technologies, Inc.) assay was used to determine the rate of
cellular viability. First, TPC1 cells (1,000 cells/well) were
seeded into 96-well plates and transfected with siRNA. Following
transfection for 24, 48, 72 and 96 h, 10 µl CCK-8 reagent were
added to each well. The cells were incubated for a further 2–4 h
before the absorbance was measured at 450 nm. Each assay was
performed 3 times.
Colony formation assay
Transfected TPC1 cells (500 cells/well) were seeded
in 6-well plates to evaluate monolayer colony formation. The cells
were cultured were cultured with RPMI-1640 medium (Invitrogen;
Thermo Fisher Scientific, Inc.) at 37°C for 6 days, and the culture
medium was changed at regular time intervals. After 6 days, the
adherent cells were washed twice with PBS and fixed with 4%
paraformaldehyde for 30 min at room temperature. The colonies were
stained for 15 min with 0.1% crystal violet (Chengdu Kelong
Chemical Co., Ltd.) at room temperature before being rinsed with
water and air-dried. Light microscopy was used to count the cell
colonies (>50 cells per colony). Each experiment was repeated 3
times.
Cell cycle and cell apoptosis
assays
To determine the proportion of cells in each phase
of the cell cycle, the TPC1 cells were fixed overnight at 4°C with
cold 70% ethanol for 48 h following transfection with siRNA. A
total of 100 µl RNase A reagent (Nanjing KeyGen Biotech, Co., Ltd.)
was used to the treat cells prior to incubation at 37°C for 30 min.
Lastly, 400 µl propidium iodide reagent (Nanjing KeyGen Biotech,
Co., Ltd.) was used to stain the cells. DNA content was measured at
488 nm using a FACSCanto II flow cytometer (Becton-Dickinson and
Company). For cell apoptosis analysis, TPC1 cells transfected with
si-NC or si-LINC02454 were harvested 48 h following transfection,
washed twice and stained with an Annexin V/PI apoptosis detection
kit (Nanjing KeyGen Biotech, Co., Ltd.). Flow cytometry (FACSCanto
II; BD Biosciences) was used to analyze apoptotic cells in early
and late apoptosis. Each experiment was repeated 3 times.
Statistical analysis
SPSS v23.0 (IBM Corp.), GraphPad Prism v6.0
(GraphPad, Inc.) and R (version 3.5.1) (https://www.r-project.org/) were used to analyze all
data. The one-sample Kolmogorov-Smirnov test was used for normality
testing of continuous data, and data are presented as the means ±
standard deviation (SD) for normally distributed data or median
(interquartile range, IQR) for skewed distribution. Error bars in
the scatter plots and the bar graphs represent SD or IQR.
Significance between groups was determined using the Student's
t-test and Mann-Whitney tests. The comparisons among ≥3 groups were
firstly performed by one-way ANOVA and Tukey's post hoc test if the
variance between groups was comparable. When the data exhibited a
skewed distribution, comparisons were performed using the
non-parametric Kruskal-Wallis test with the Mann Whitney U post hoc
test with Bonferroni's correction applied. Categorical data were
reported as the count and percentage. The χ2 tests were
used as appropriate for comparison of categorical data between
groups. P<0.05 (two-tailed) was considered to indicate a
statistically significant difference. A ROC curve was generated by
the package ‘Optimal Cutpoints’ (33) in R. Disease-free survival analysis
was performed using the Kaplan-Meier survival curve and the
log-rank test in the ‘survival’ (34) package of R (version 3.5.1).
Results
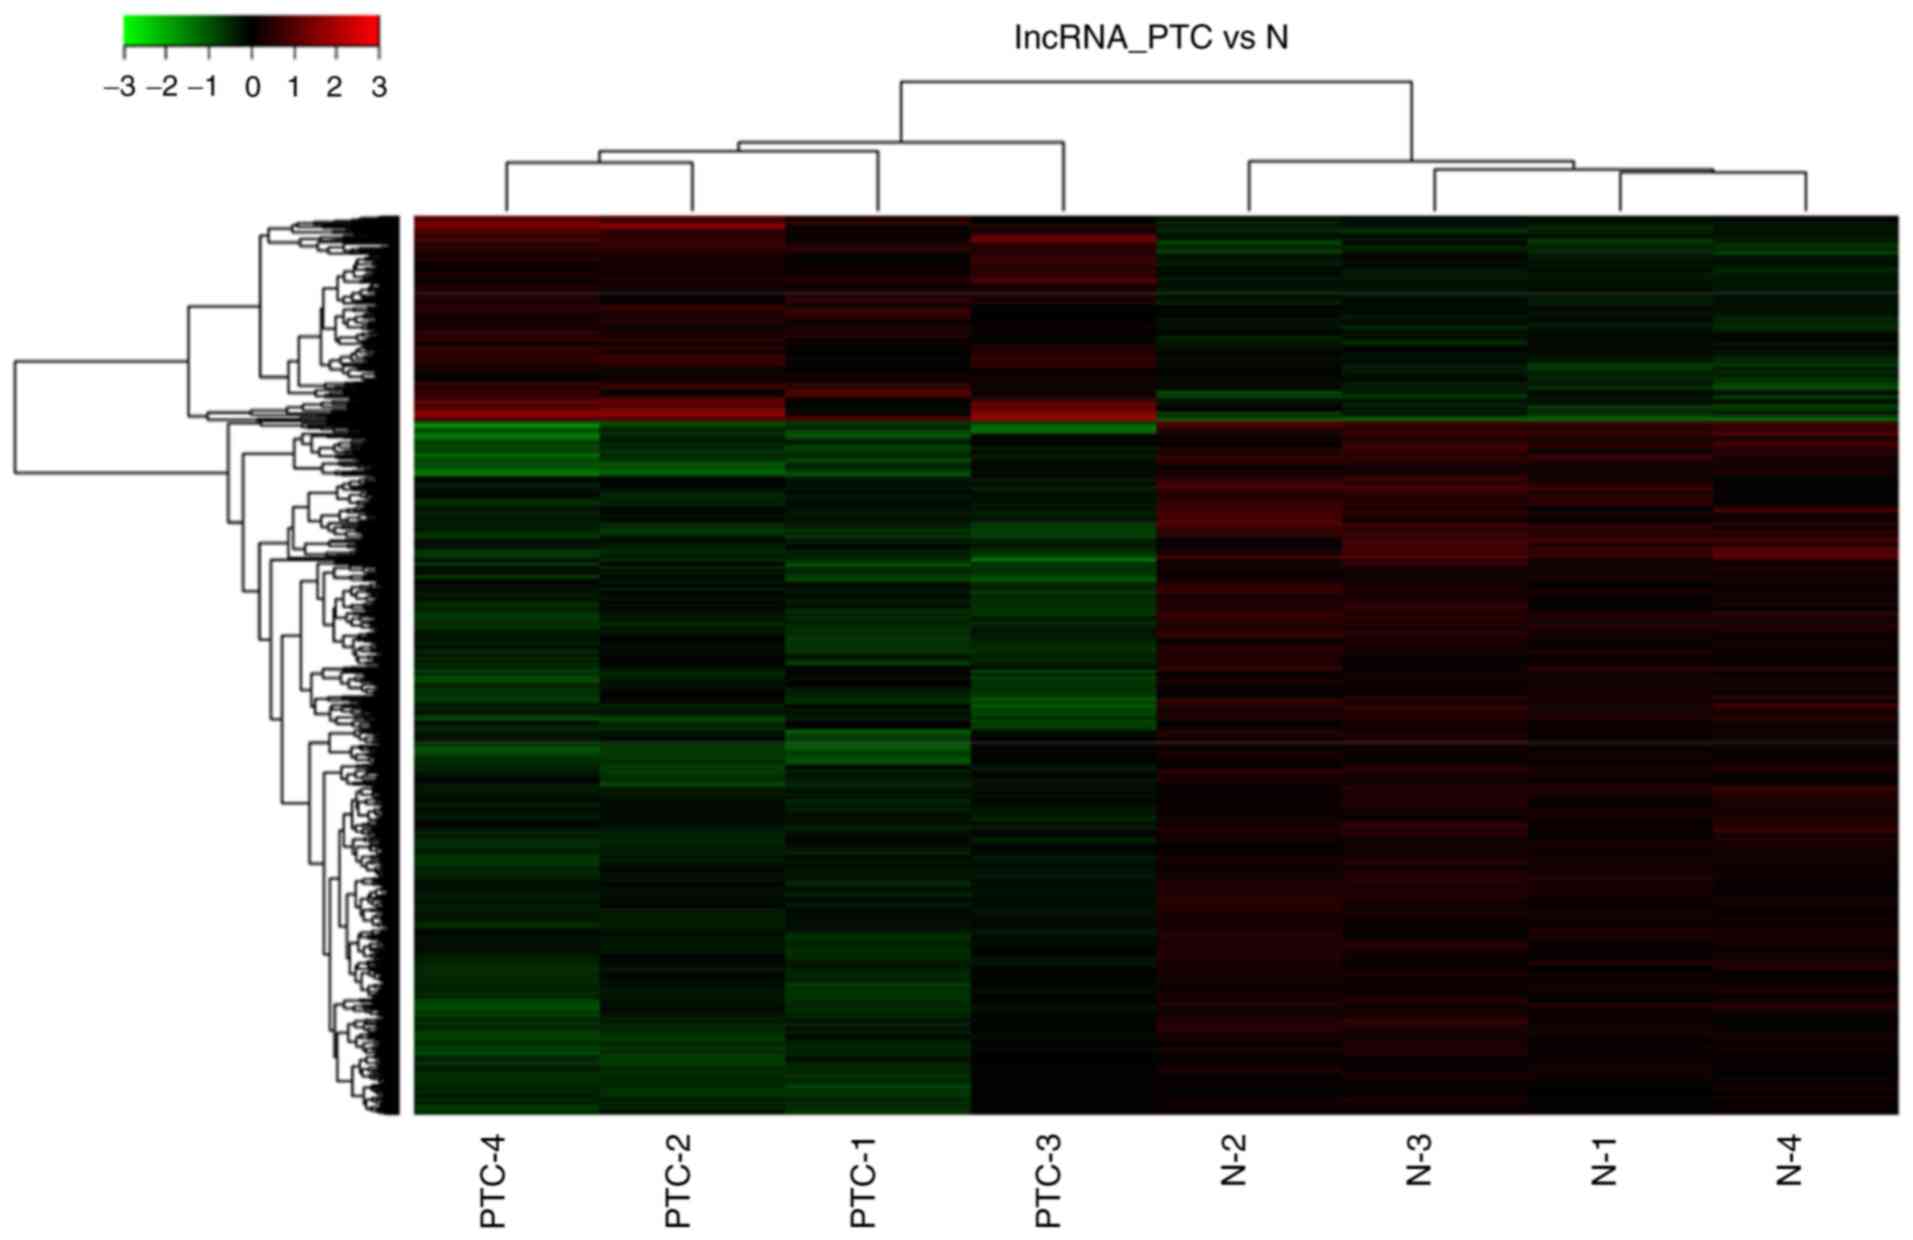
Overview of lncRNA expression
profiles
Microarray expression profiling of 4 PTC tissues and
paired normal tissues was performed to identify differentially
expressed lncRNAs in PTC compared with normal tissues. A heatmap
was generated to identify significantly differentially expressed
lncRNAs (Fig. 1). The top 10 most
significantly upregulated differentially expressed lncRNAs are
presented in Table SI. In total, 6
of the top 10 lncRNAs (ENST00000417422.1, ENST00000457989.1,
TCONS_00020761, ENST00000539116.1, ENST00000539653.1 and
ENST00000563933.1) were also markedly upregulated in the PTC
samples compared with the normal samples from the TCGA database
(Fig. S1), which were selected for
further analysis by RT-qPCR to confirm the expression levels in 54
paired PTC and adjacent normal thyroid tissues. These results
revealed that all 6 lncRNAs were upregulated in the PTC tissues
compared with the normal adjacent tissues, which is consistent with
the expression levels in the lncRNA microarray. The levels of
ENST00000417422.1, ENST00000457989.1, ENST00000539116.1, and
ENST00000539653.1 were markedly higher in the PTC tissues compared
with the normal adjacent tissues (logFC>2; P<0.05) (Fig. S2), while 3 of these lncRNAs
(ENST00000539653, ENST00000417422.1 and ENST00000457989.1) have
also been reported to be involved in PTC in a previous study
(35). However, the biological
function of ENST00000539116.1 (a transcript of LINC02454) has not
been previously reported, at least to the best of our knowledge;
therefore, LINC02454 was selected for further investigation.
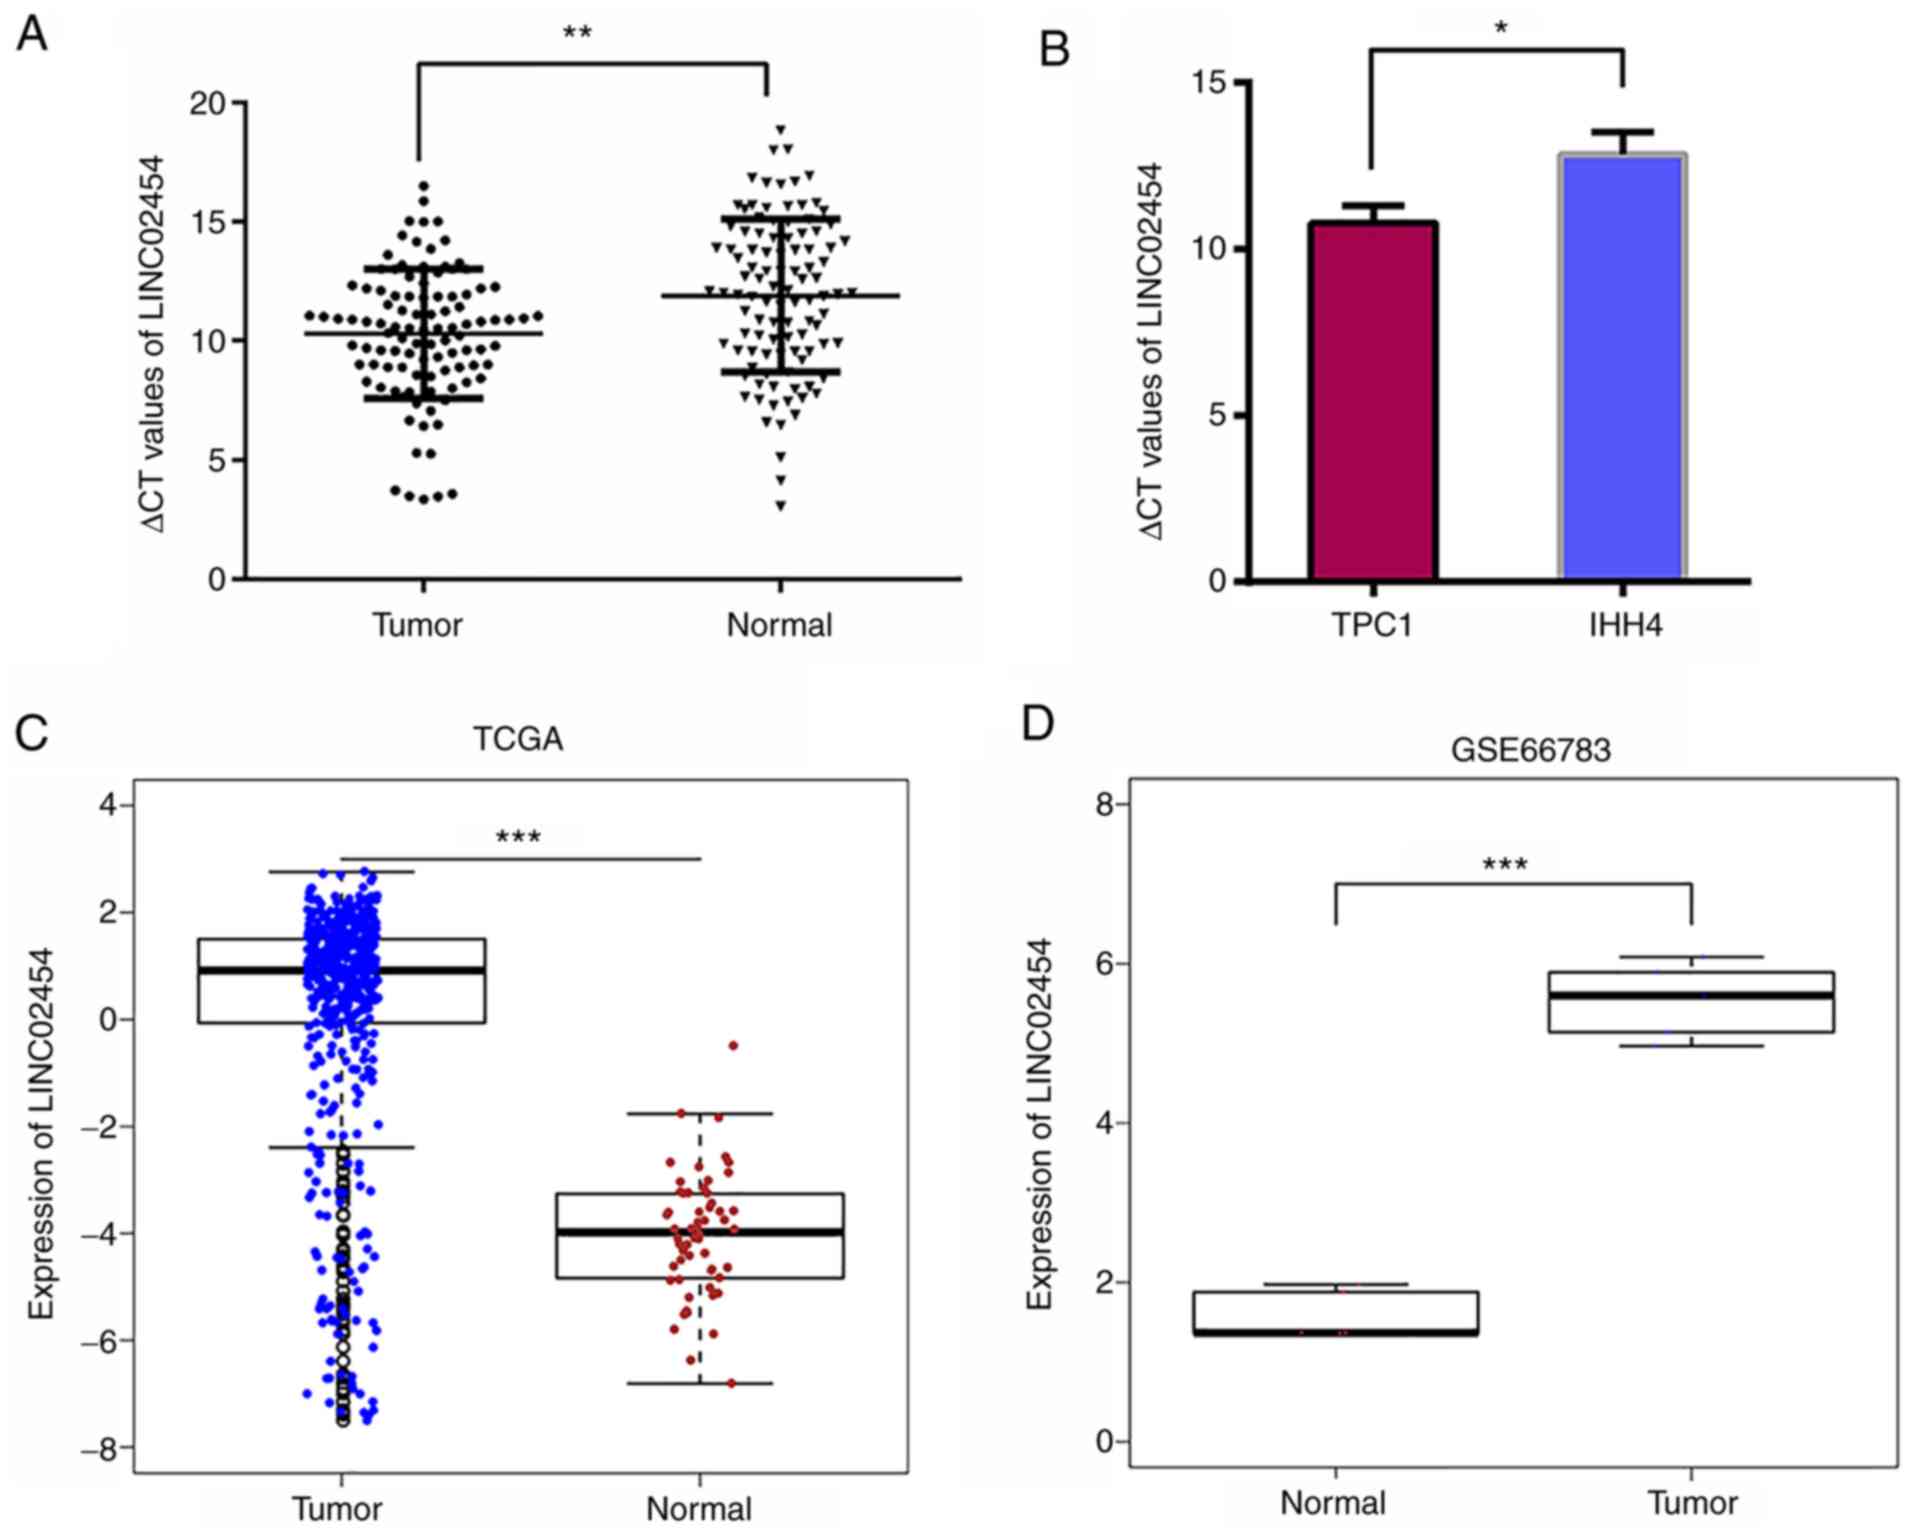
Expression of LINC02454 in PTC
To explore the expression level of LINC02454 in PTC
cell lines and tissues, RT-qPCR was performed in 104 paired tumor
and normal control samples. A total of 4 representative
pathological images of PTC and normal control samples are shown in
Fig. S3. The LINC02454 expression
level was significantly increased in the tumor tissues compared
with the normal control samples (P=0.0011; Fig. 2A). In addition, the LINC02454 levels
were also examined in the TPC1 and IHH4 cell lines. A strong
expression of LINC02454 was detectable in both cell lines, while
the expression level was higher in the TPC1 cell line (the lower
the ΔCt value, the higher the expression); therefore, it was
selected for further functional analysis (P=0.0136; Fig. 2B). As shown in Fig. 2C, LINC02454 was significantly
upregulated in PTC (n=502) with a logFC of 4.16 and a
P=5.5×10⁻²⁹ compared with the normal samples (n=58) in
the TCGA database. The LINC02254 expression level was also verified
in PTC with the GEO dataset. It was found that ENST00000539116.1
was significantly upregulated in the cancer samples (n=5) compared
with the matched non-cancerous samples (P=2.64×10⁻⁵)
(Fig. 2D), which is consistent with
the results obtained from TCGA database and the microarray
data.
LINC02454 expression and
clinicopathological characteristics
The clinical significance of LINC02454 was
investigated by analyzing the association of LINC02454 expression
in 104 patients with clinicopathological characteristics, including
sex, age, tumor size, multimodality, lymph node metastasis (LNM),
extra-thyroidal extension (ETE), T stage and TNM stage.
Subsequently, 104 patients with PTC were categorized into 2 groups
(LINC02454 high and low expression groups) according to the median
relative LINC02454 expression value (ΔCt=10.283). The LINC02454
high expression group was significantly associated with a larger
tumor volume, higher T stage, a more advanced TNM stage and a
higher number of lymph node metastasis (P<0.05; Table II), but not with sex, age,
multimodality, or extrathyroidal extension (ETE) (P>0.05;
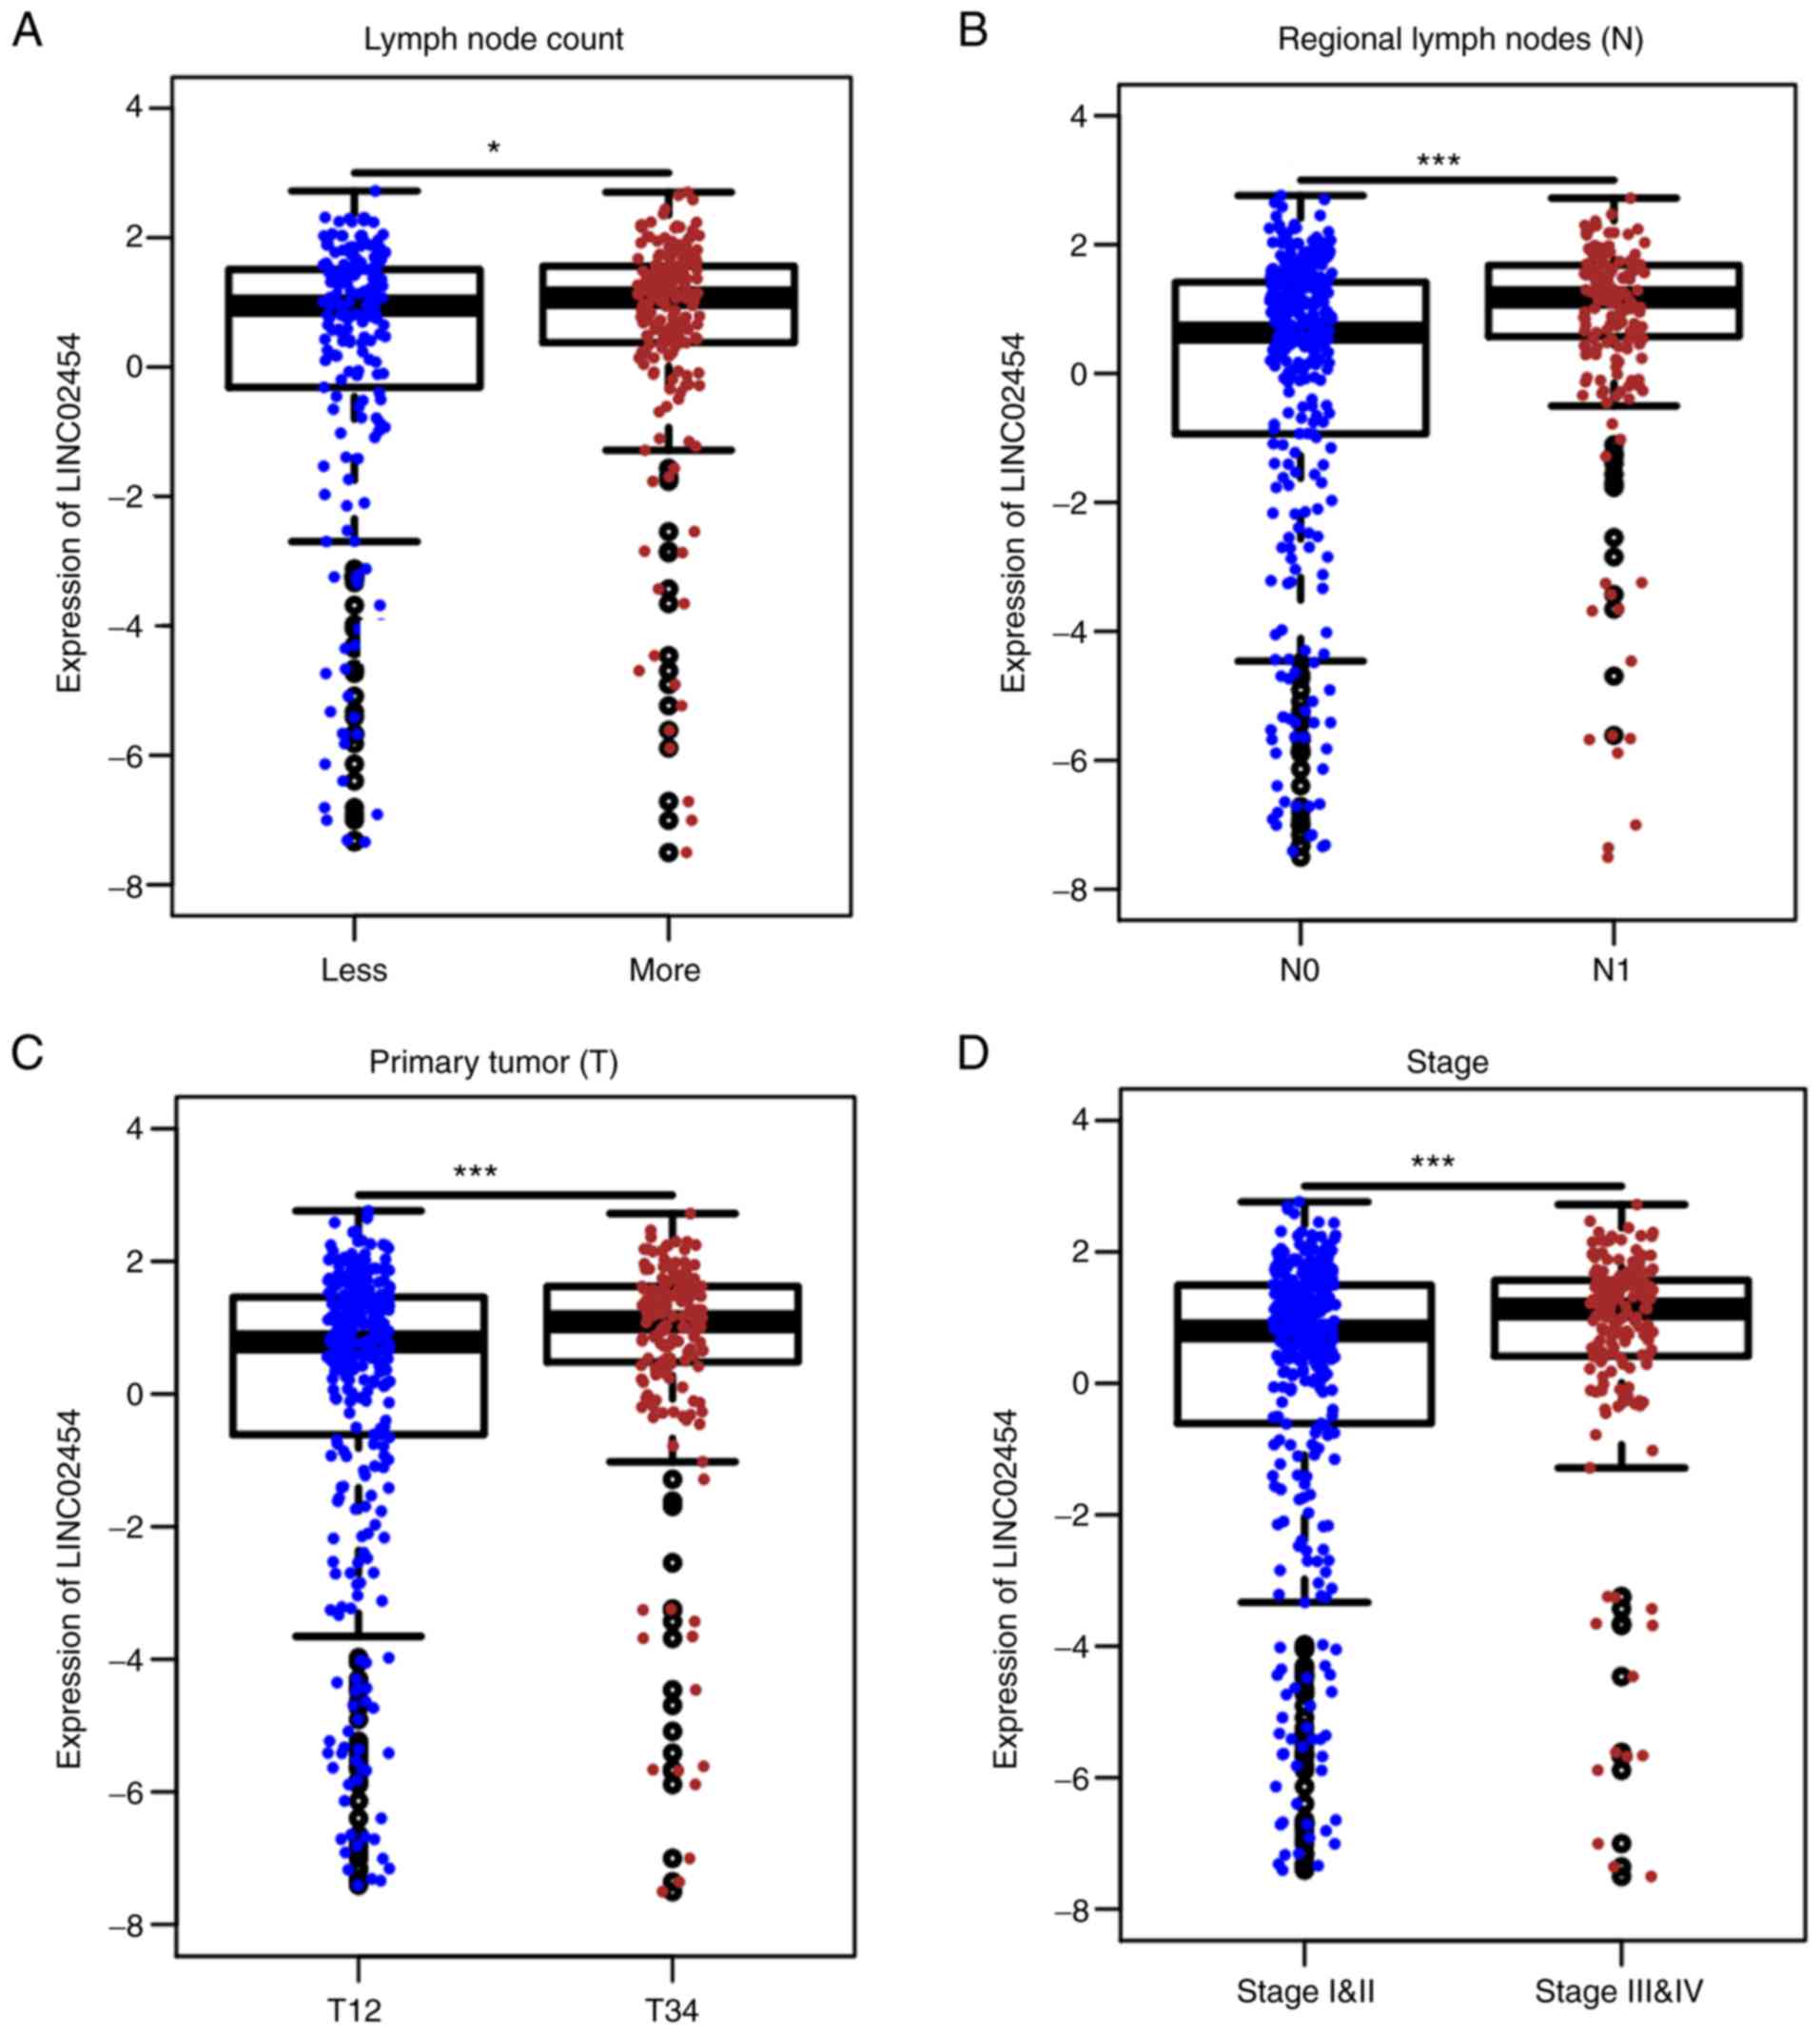
Table II). From the analysis of
the TCGA data, the expression level of LINC02454 was significantly
associated with clinical traits, such as lymph node count,
pathological stage and TNM stage (Fig.
3). The median value of lymph node count was used to divide the
samples into the high (n=190) and low (n=198) lymph nodes groups.
LINC02454 was significantly upregulated in the high lymph node
group (P=0.01836; Fig. 3A). In
addition, LINC02454 was significantly upregulated in N1 stage
(n=223) (P=3.843×10⁻¹²) compared with N0 stage (n=229)
(Fig. 3B). The groups T1 and T2
were combined into one group (n=307), while T3 and T4 was combined
into another group (n=193). LINC02454 was significantly upregulated
in stages T3 and 4 (P=0.0003377) (Fig.
3C). Stages I and II were also combined into one group (n=333),
while stages III and IV where also combined into another group
(n=167). LINC02454 was significantly upregulated in stages III and
IV (P=0.00083355) (Fig. 3D). The
findings from TCGA database were consistent with the results from
RT-qPCR.
| Table II.Association between the LINC02454
expression level and patient clinicopathological
characteristics. |
Table II.
Association between the LINC02454
expression level and patient clinicopathological
characteristics.
|
| LINC02454
subgroupa |
|
|---|
|
|
|
|
|---|
| Variables | Low [n (%)] | High [n (%)] |
P-valueb |
|---|
| All cases | 52 | 52 |
|
| Age (years) |
|
| 0.163 |
|
<55 | 43 (53.8) | 37 (46.3) |
|
|
≥55 | 9 (37.5) | 15 (62.5) |
|
| Sex |
|
| 0.365 |
|
Male | 15 (57.7) | 11 (42.3) |
|
|
Female | 37 (47.4) | 41 (52.6) |
|
| Maximum size tumor
(cm) |
|
| 0.031c |
|
<2 | 30 (61.2) | 19 (38.8) |
|
| ≥2 | 22 (40.0) | 33 (60.0) |
|
| Multifocality |
|
| 0.168 |
|
Unifocal | 32 (56.1) | 25 (43.9) |
|
|
Multifocal | 20 (42.6) | 27 (57.4) |
|
| ETE |
|
| 0.116 |
| No | 28 (58.3) | 20 (41.7) |
|
|
Yes | 24 (42.9) | 32 (57.1) |
|
| T stage |
|
| 0.006d |
|
T1-T2 | 32 (64.0) | 18 (36.0) |
|
|
T3-T4 | 20 (37.0) | 34 (63.0) |
|
| LNM |
|
| 0.020c |
| N0 | 22 (66.7) | 11 (33.3) |
|
| N1 | 30 (42.3) | 41 (57.7) |
|
| TNM stage |
|
| 0.046c |
|
I–II | 50 (53.2) | 44 (46.8) |
|
|
III–IV | 2 (20.0) | 8 (80.0) |
|
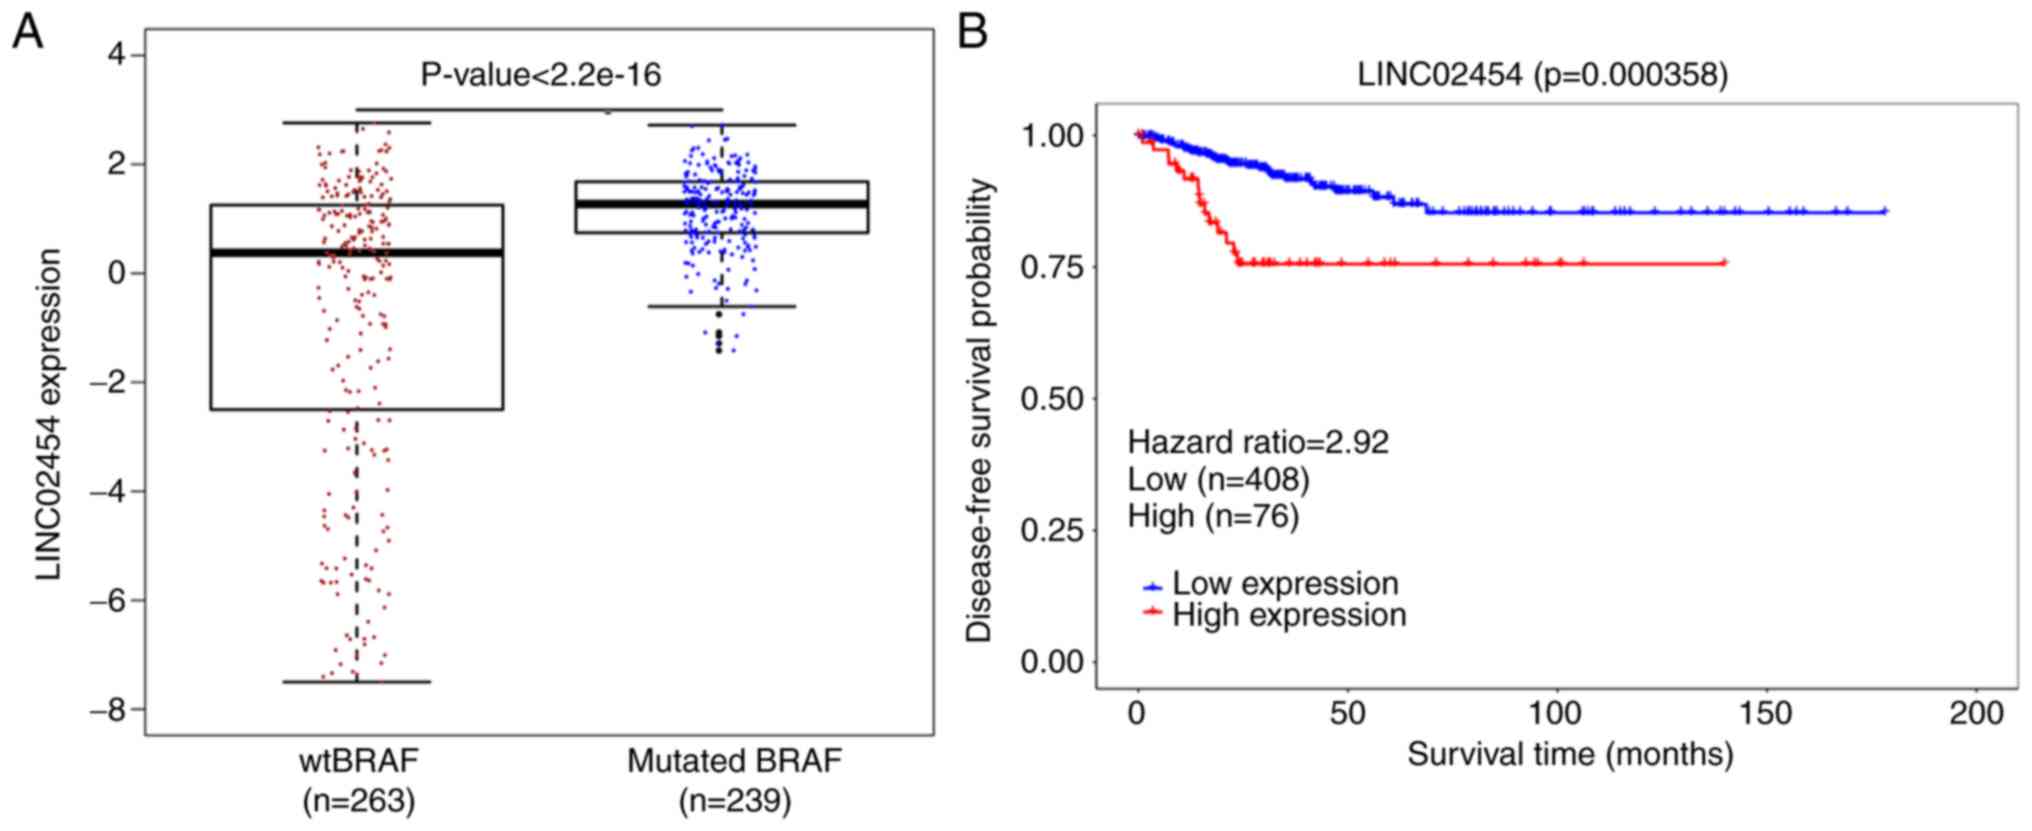
High LINC02454 expression is
associated with BRAF mutation and a poorer disease-free survival in
the TCGA PTC cohort
It was also found that LINC02454 was significantly
upregulated in patients with BRAF mutations (n=239) compared with
patients without BRAF mutations (n=263) (P<0.001; Fig. 4A). As shown in Fig. S4, based on the ROC, an optimal
threshold of 1.742 for LINC02454 expression level was obtained by
optimizing the Youden's index. A total of 484 PTC patients were
classified into 2 groups (408 high and 76 low levels of LINC02454
expression groups) based on the Youden's index. The sensitivity,
specificity, and positive diagnostic likelihood ratio of 1.742 for
disease-free survival diagnosis were 34.8%, 86.1% and 2.498,
respectively, with an area under the curve at 0.596 (95% CI,
0.505–0.687). In addition, high expression levels of LINC02454 were
significantly associated with a poorer disease-free survival
(P=0.000358) (Fig. 4B). In
addition, as shown in Fig. S5, the
poor disease-free survival time of patients with PTC was associated
with an advanced N stage (P=0.03860), advanced T stage (P=0.00205)
and an advanced pathological stage (P=0.000827). No significant
associations were observed between the disease-free survival time
of patients with PTC and lymph node count (P=0.53400).
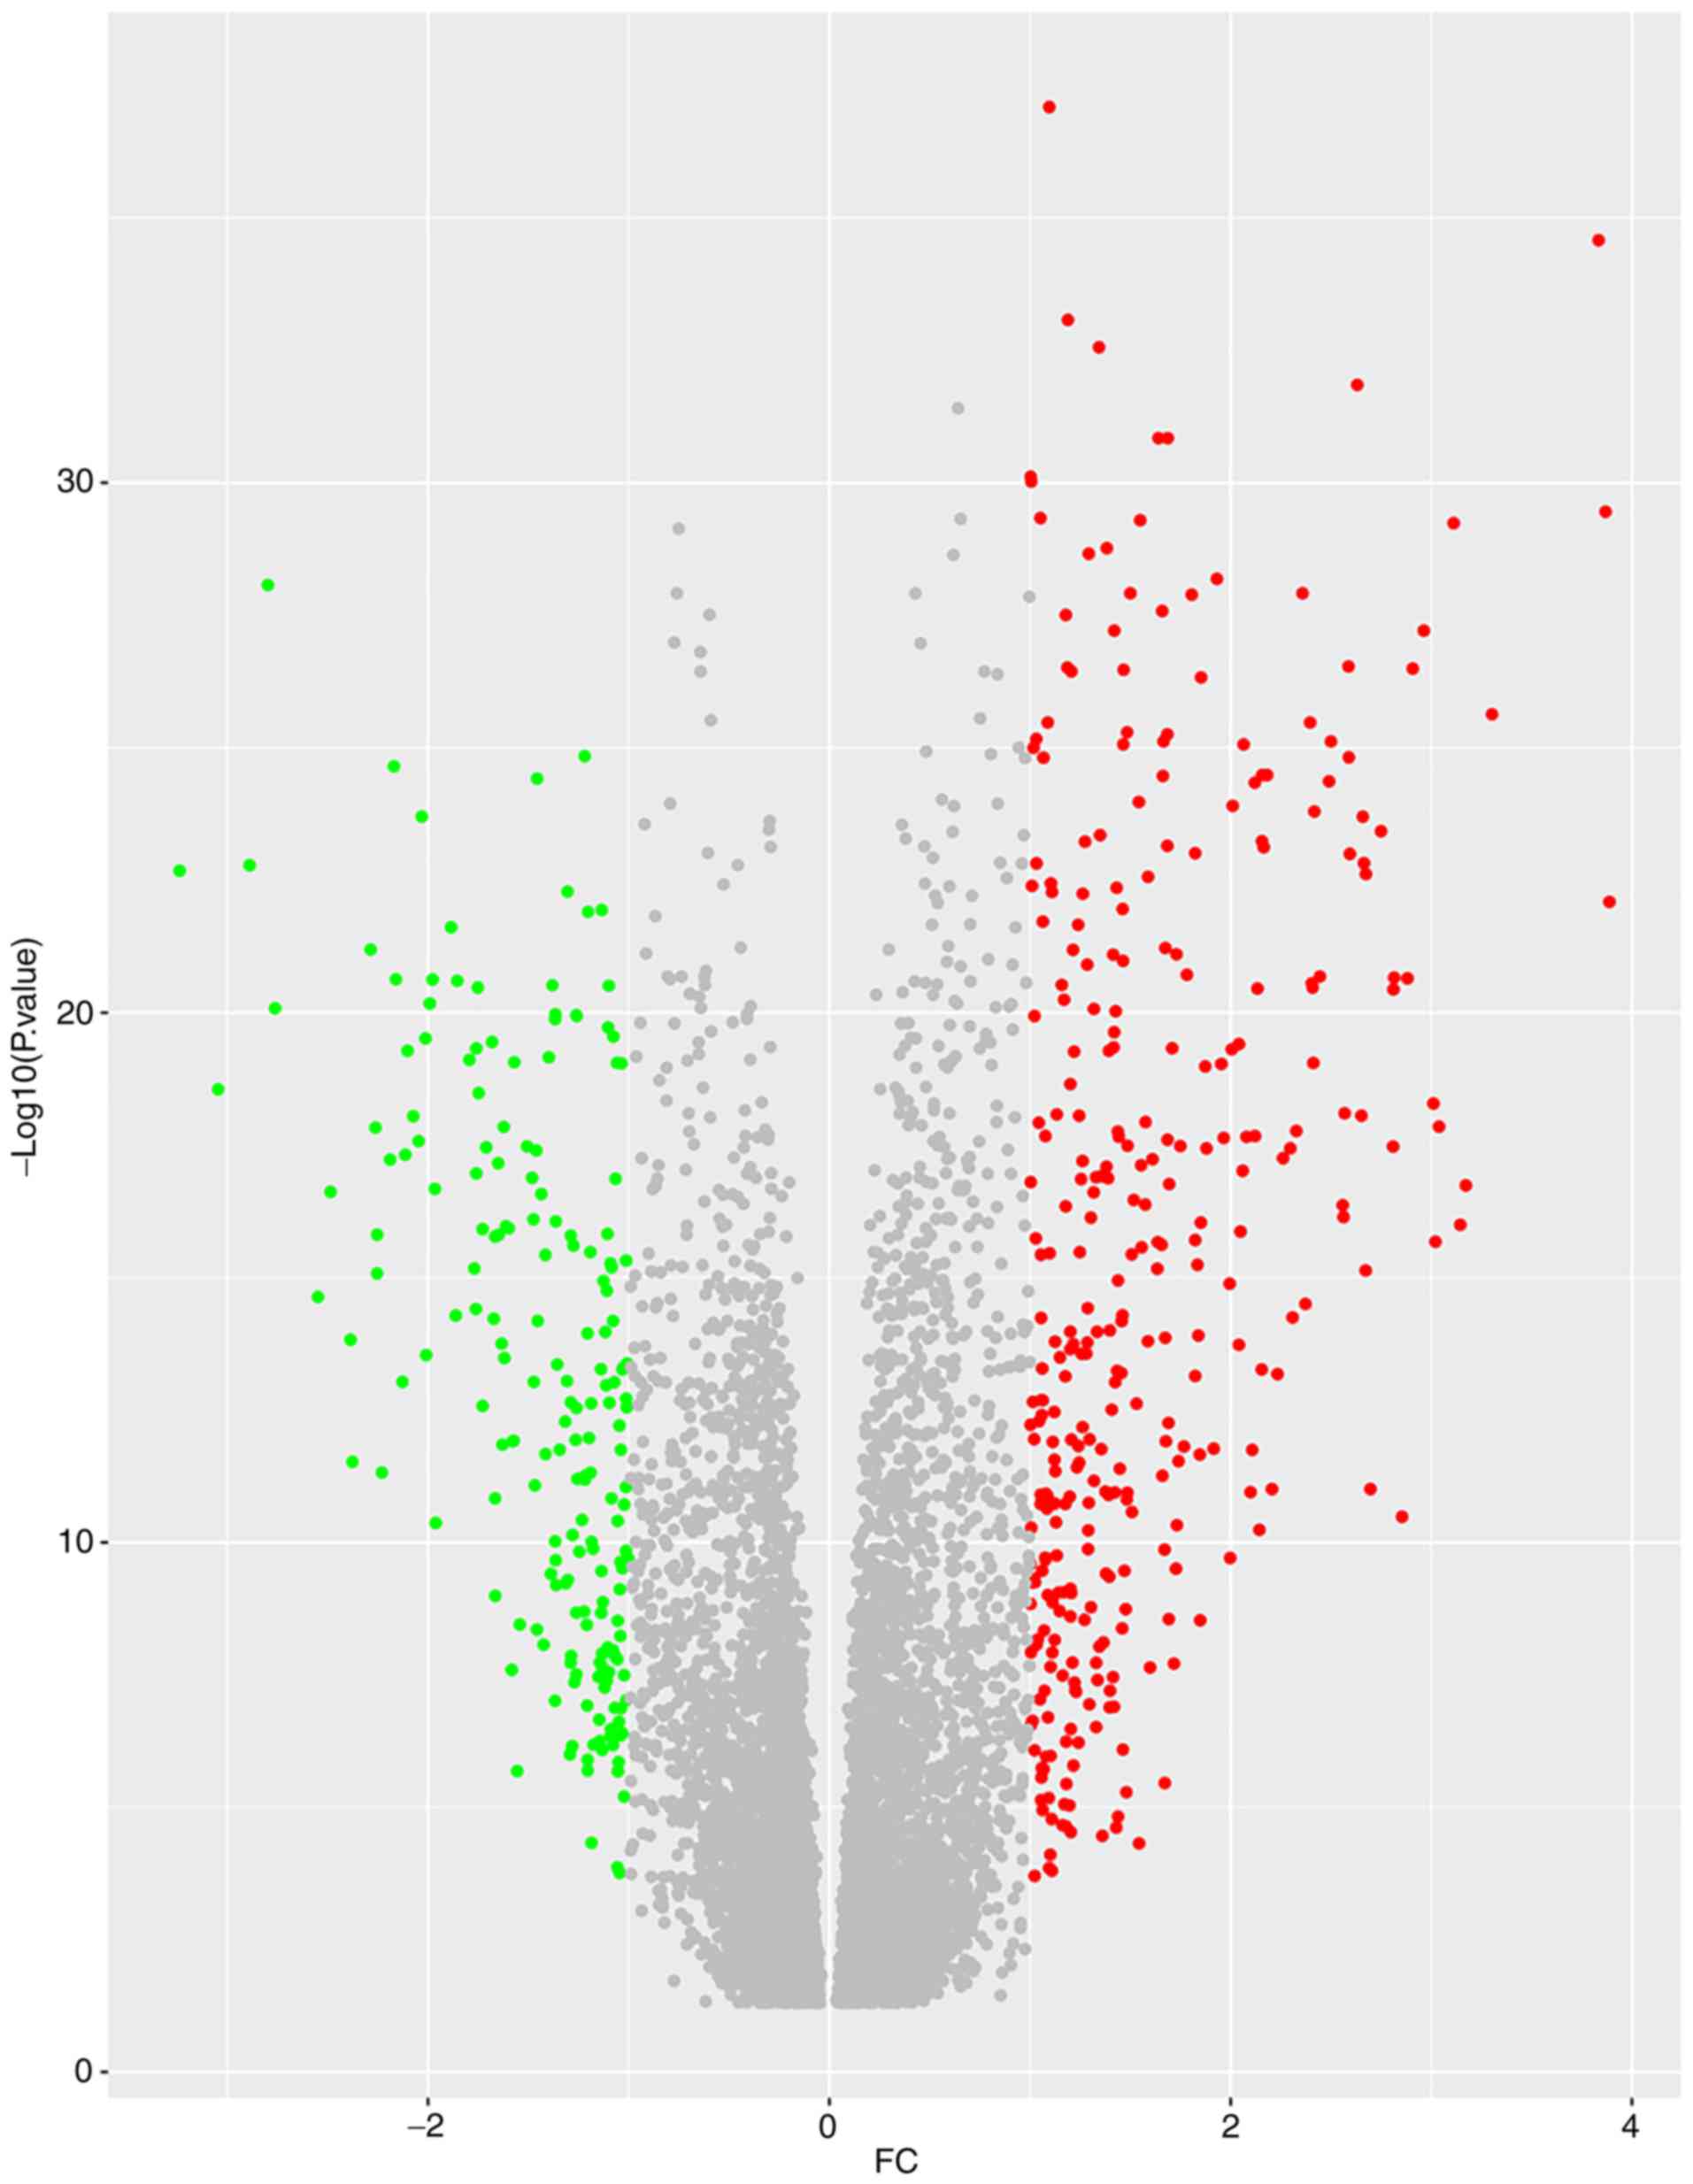
Identification of biological functions
of LINC02454-related genes
To reveal the biological properties of LINC02454,
502 PTC samples from TCGA were divided into the high and low
expression groups based on the median LINC02454 expression levels
(3.151). Subsequently, 531 differentially expressed genes were
identified, which included 194 down- and 337 upregulated genes in
the LINC02454 high expression group compared with the LINC02454 low
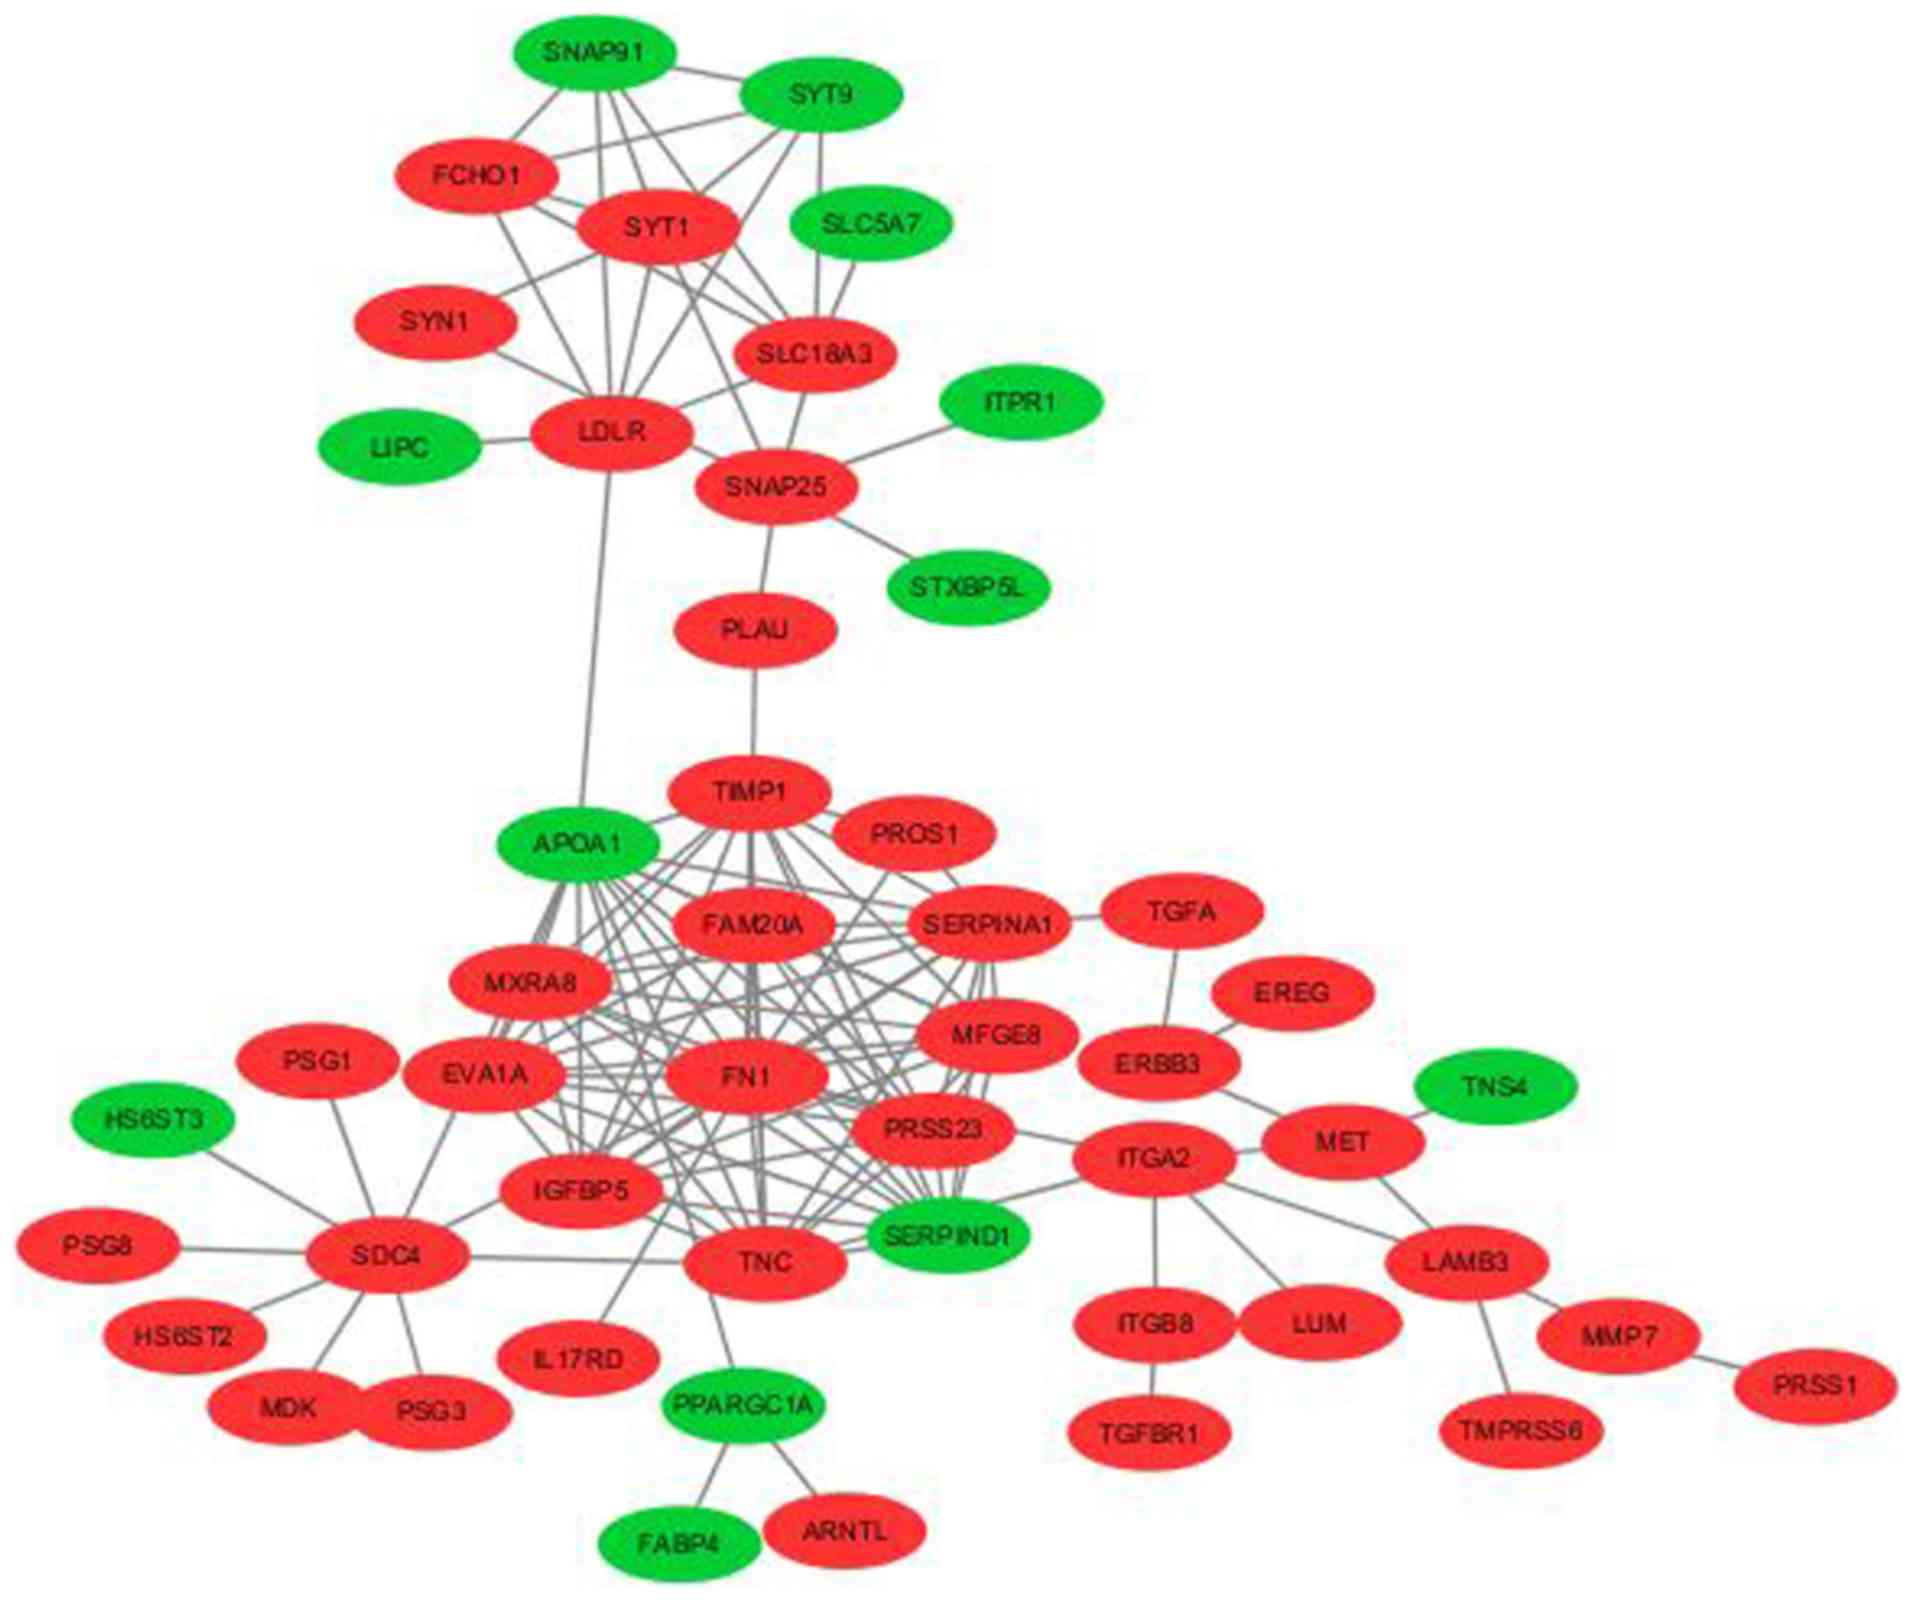
expression group (Fig. 5). The PPI
network consisted of 50 nodes and 124 edges, which included 22
down- and 98 upregulated genes (Fig.
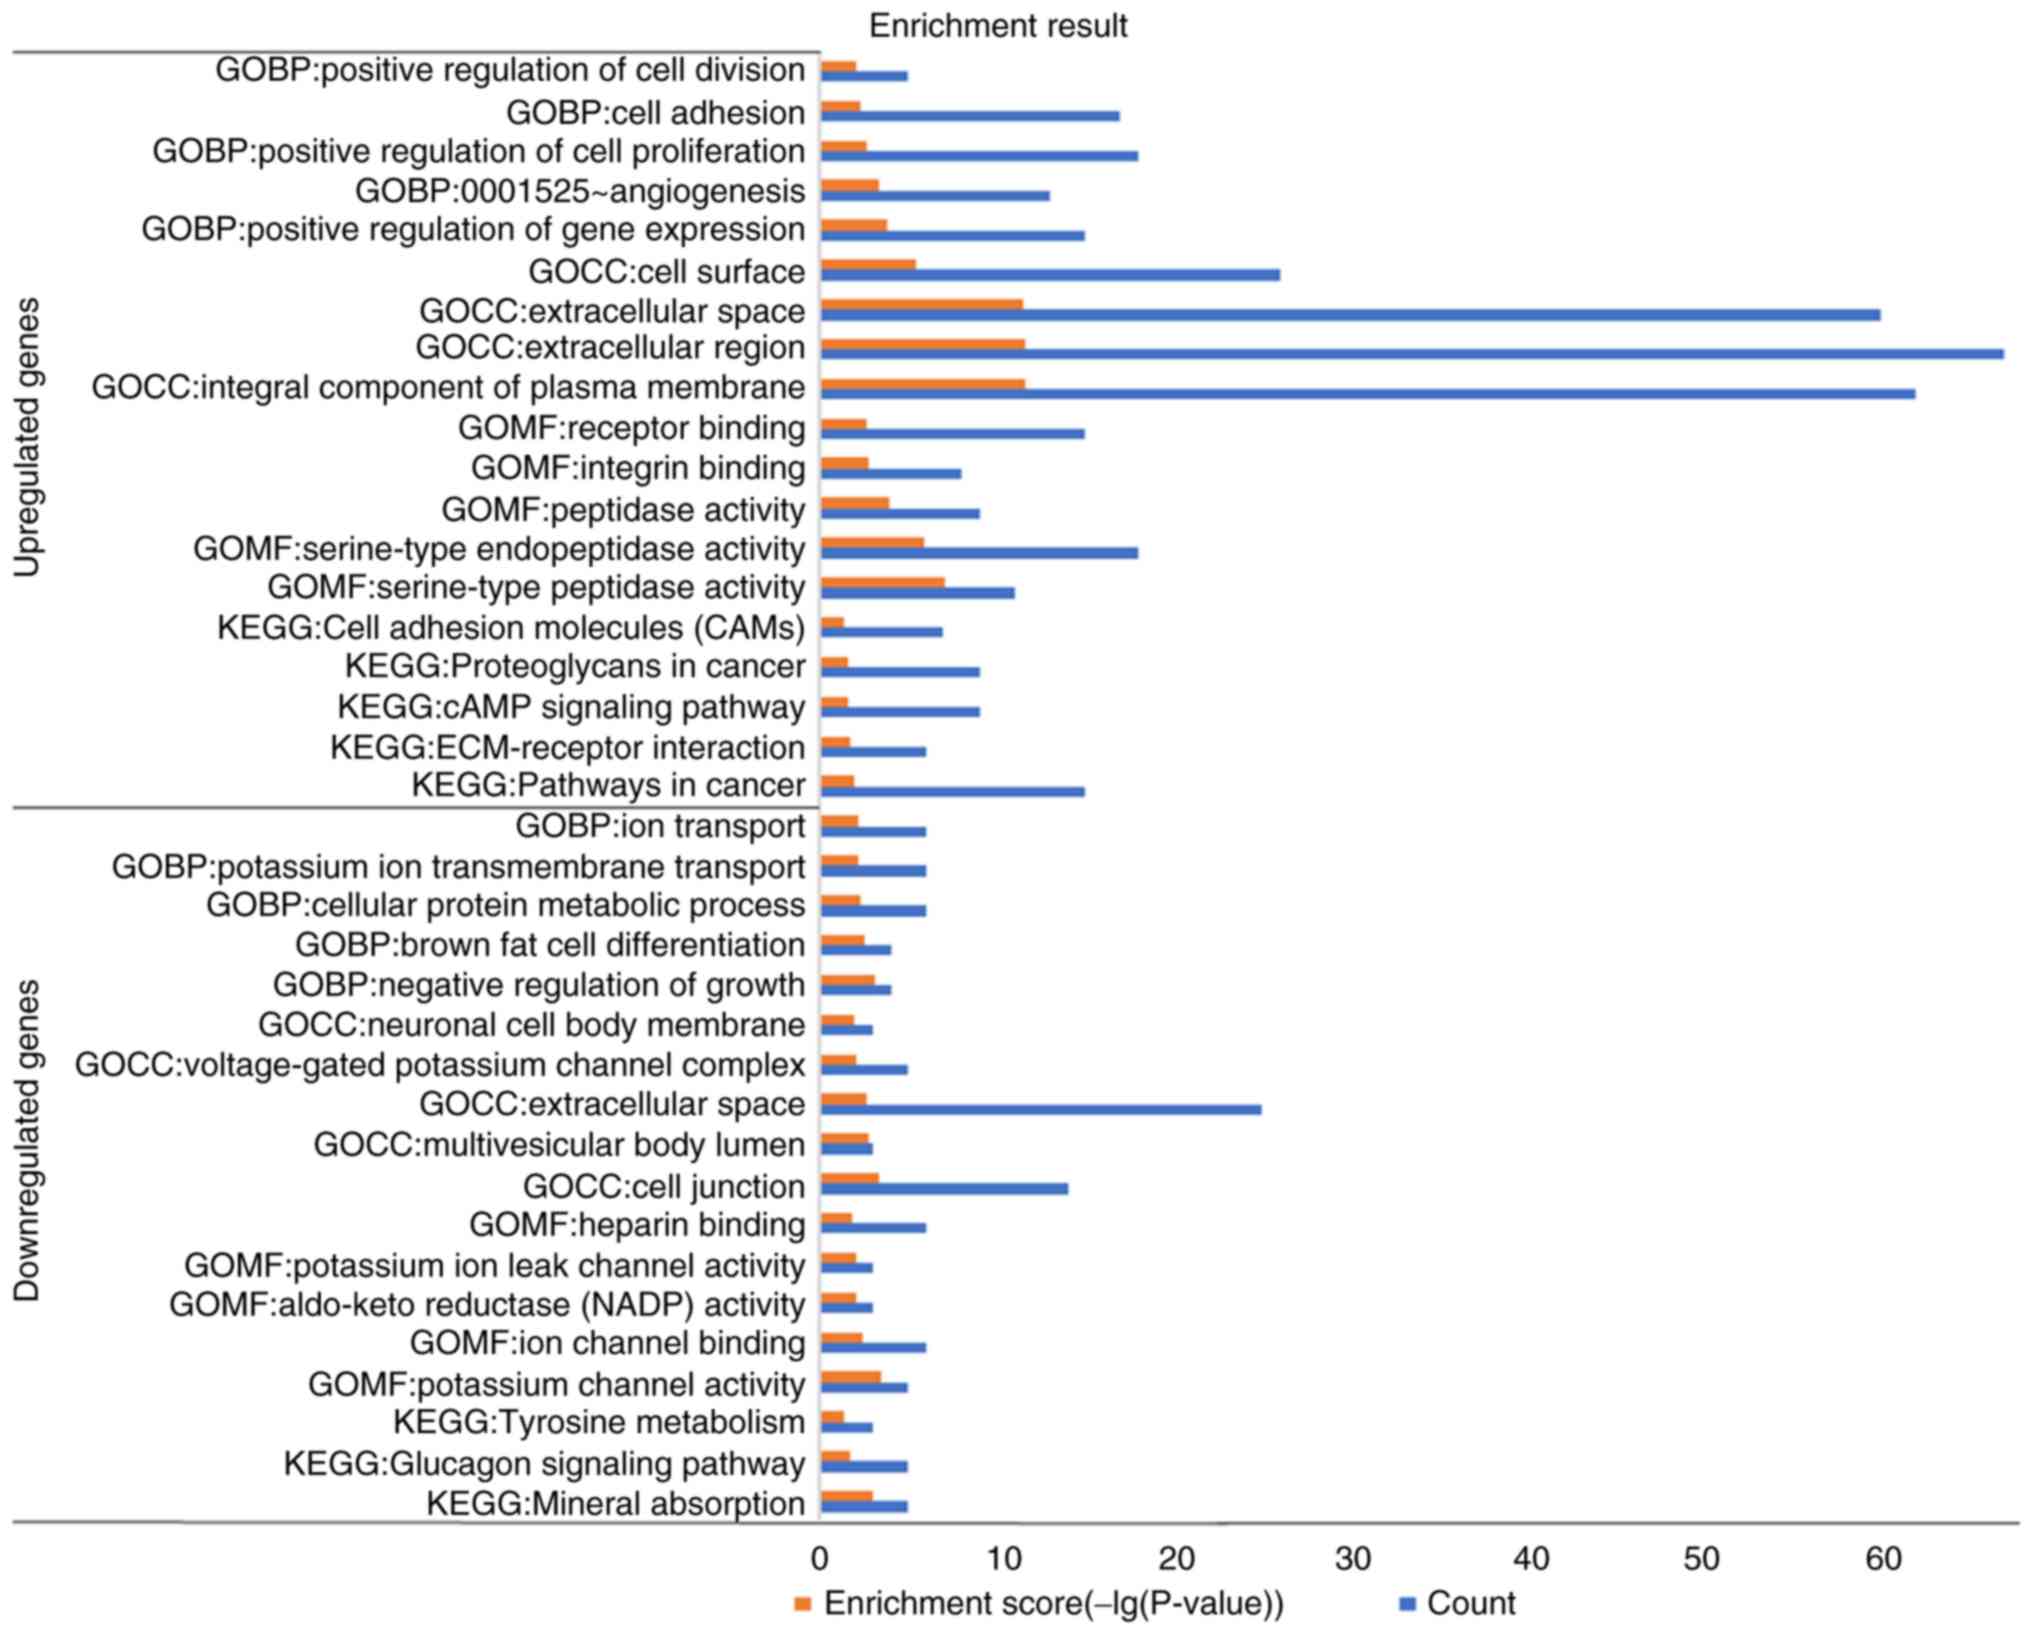
6). Following which, functional enrichment analyses was
performed using the LINC02454-related genes, which revealed that
the upregulated genes were primarily enriched in the KEGG pathways,
such as ‘pathways in cancer’, ‘proteoglycans in cancer’ and
‘ECM-receptor interaction’ and in the GO BP terms, such as
‘positive regulation of gene expression’, ‘angiogenesis’, ‘positive
regulation of cell proliferation’, ‘cell adhesion’ and ‘positive
regulation of cell division’, while the downregulated genes were
primarily enriched in the metabolic pathways (Fig. 7). The following enriched terms were
subsequently investigated: Cell proliferation, cell division and
pathways in cancer.
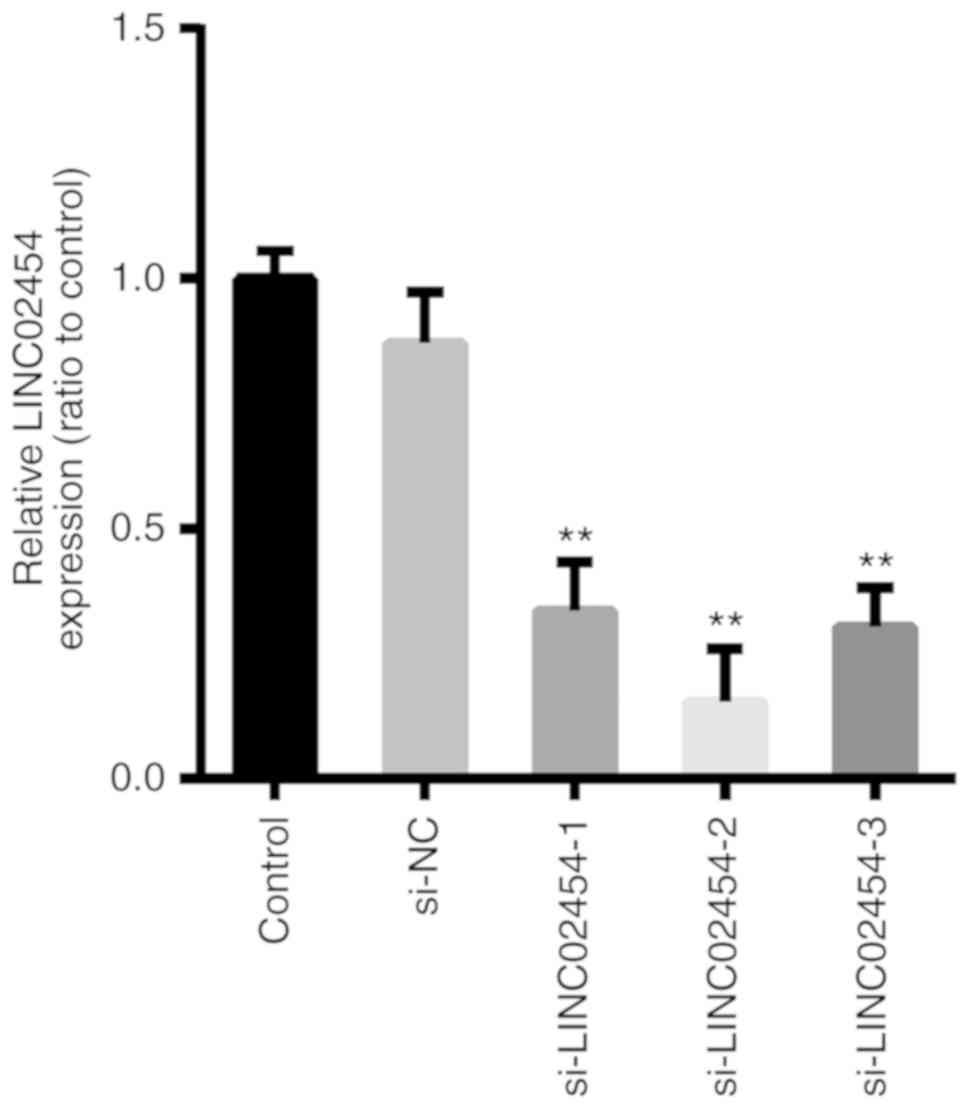
Interference efficiency of LINC02454
siRNAs in TPC1 cells
To investigate the potential biological functions of
LINC02454, it was knocked down using 3 siRNAs and a negative
control in the TPC1 cell line (Table
I). The expression level of LINC02454 in the TPC1 cells was
quantified by RT-qPCR at 48 h following siRNA transfection. When
compared to the cells transfected with siRNA-NC, the expression
levels of LINC02454 in the si-LINC02454-1- (P<0.01),
si-LINC02454-2- (P<0.01) and si-LINC02454-3-transfected
(P<0.01) TPC1 cells were decreased (Fig. 8). The interference efficiency of
si-LINC02454 was successfully achieved (65–85%), with the highest
efficiency found with si-LINC02454-2. Therefore, it was selected
for further use in knockdown experiments.
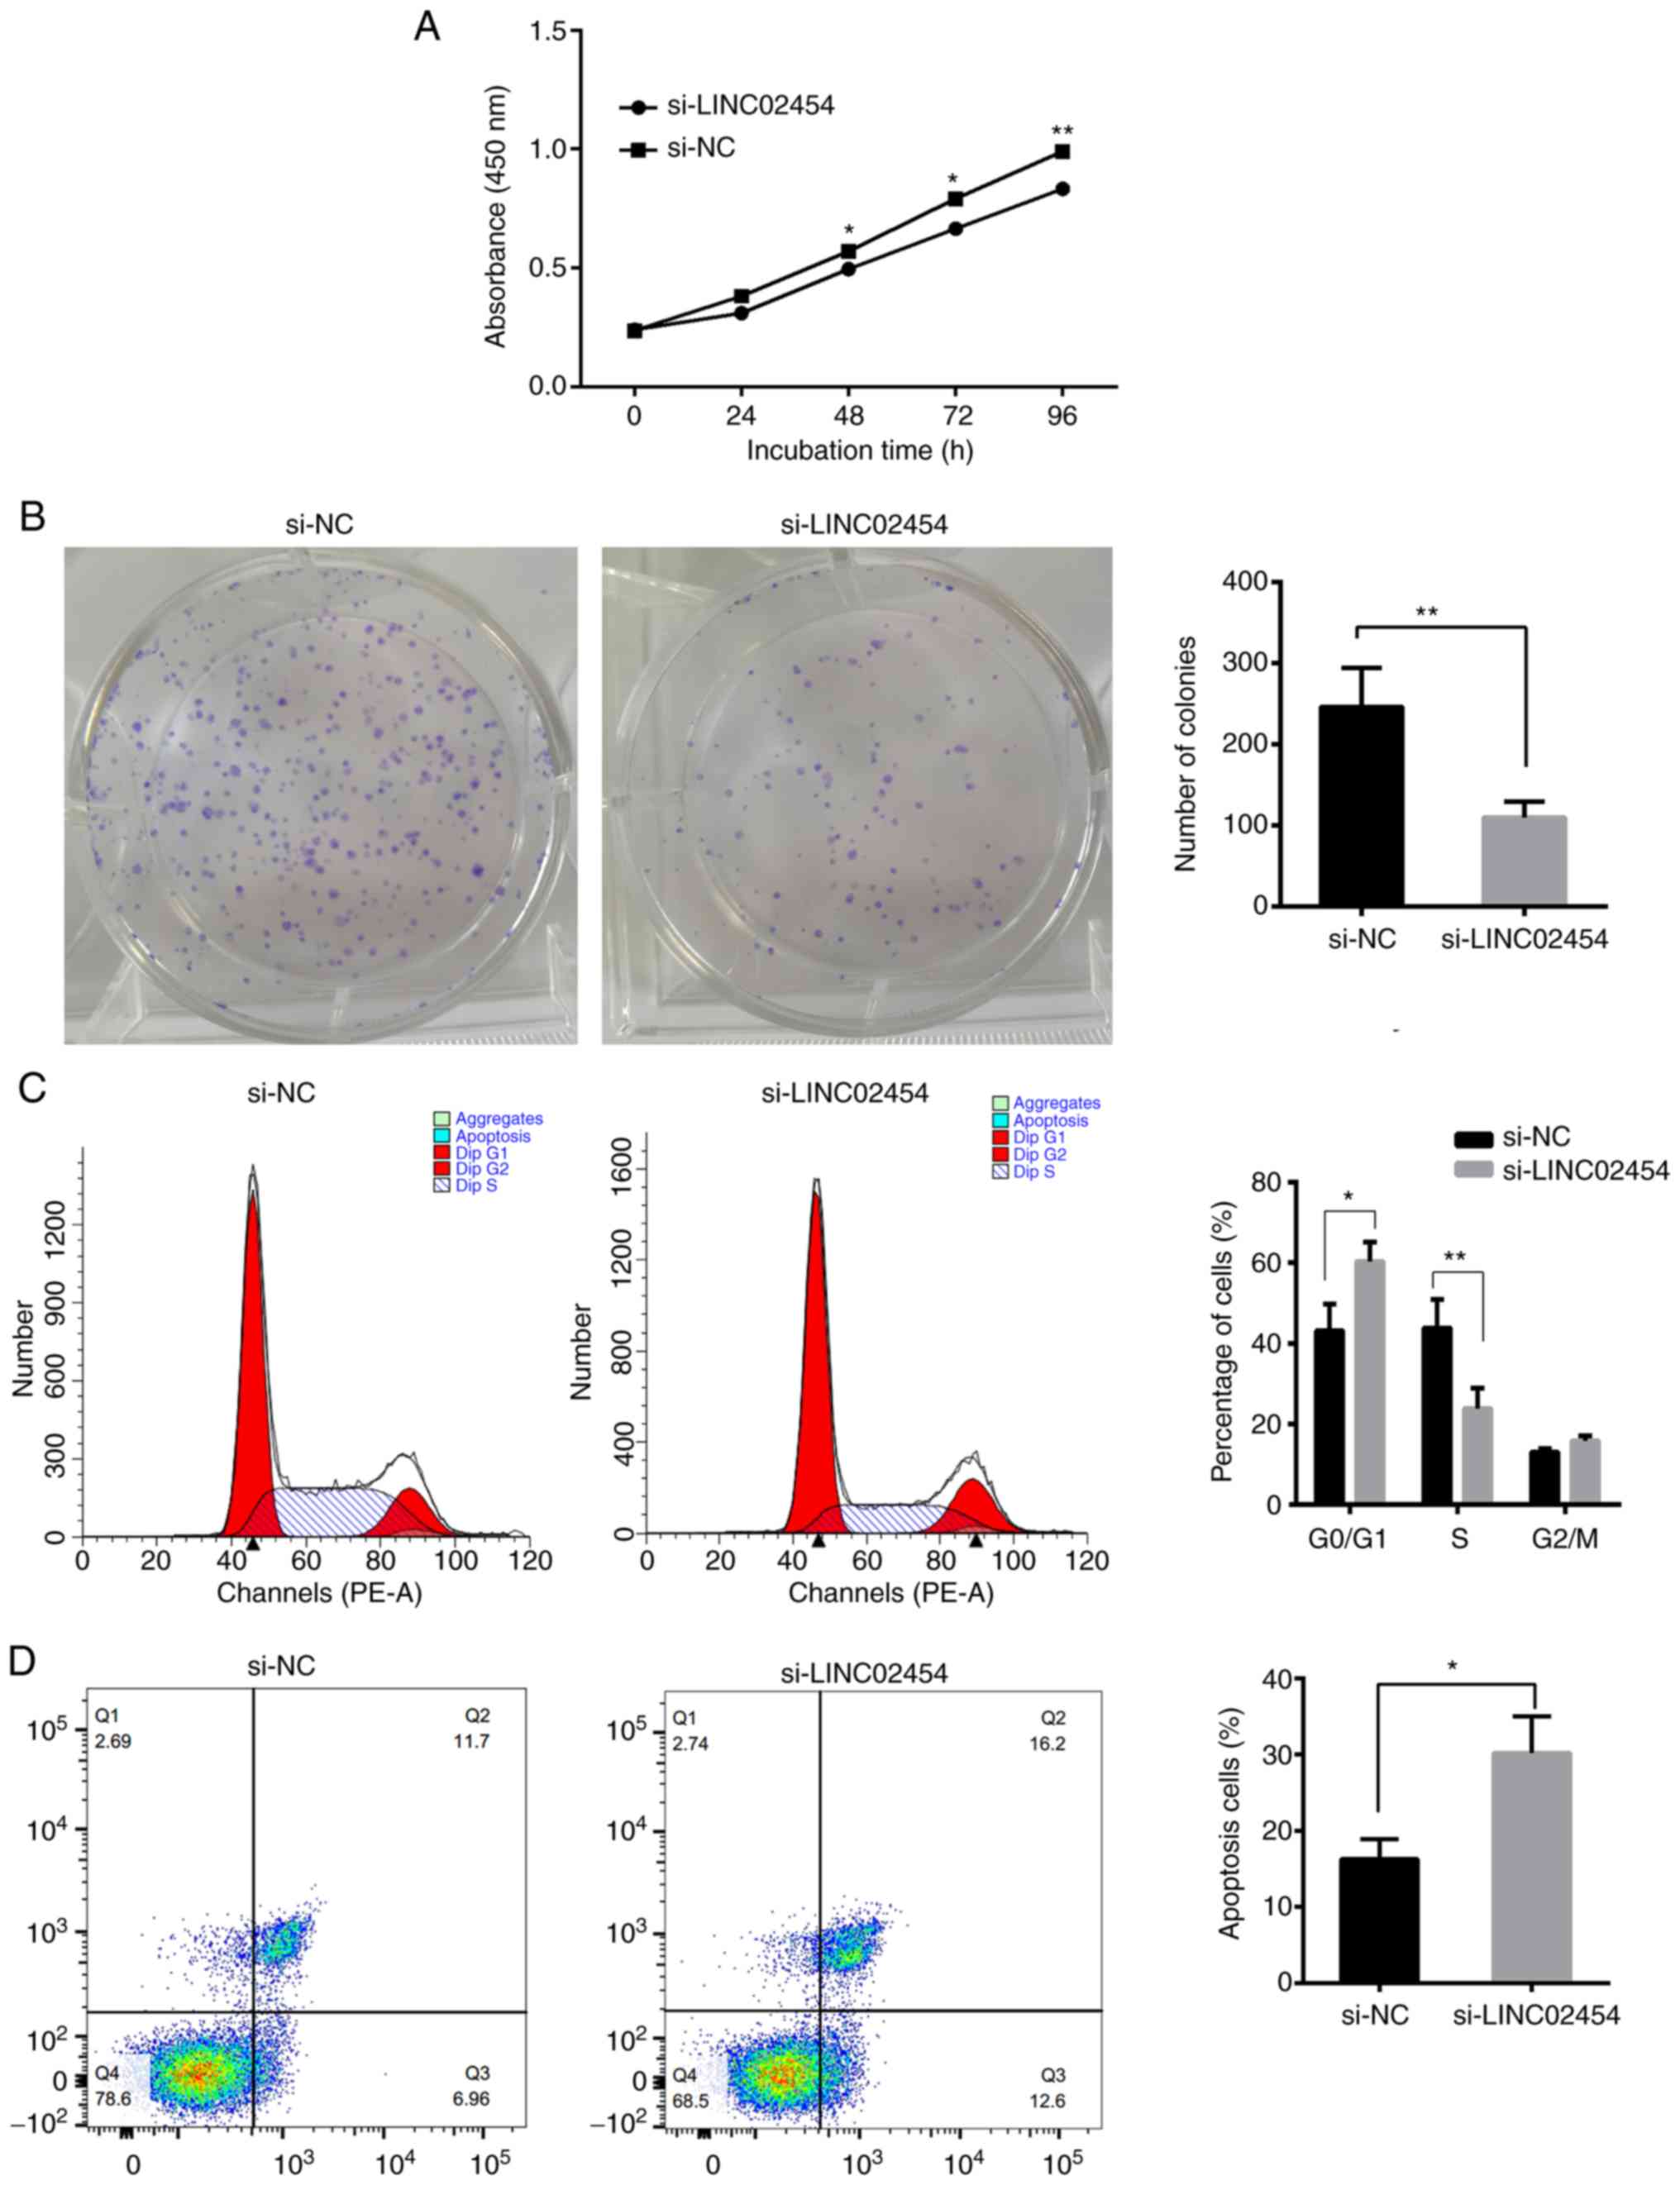
Effect of LINC02454 on in vitro TPC1
cell production
To investigate the in vitro effect of
LINC02454 on cell proliferation, the TPC1 cells were subjected to
colony formation and CCK-8 assays following transfection with
si-LINC02454-2 and si-NC. The proliferation of the TPC1 cells was
significantly decreased following transfection with si-LINC02454-2
compared with that of the si-NC-transfected cells (P<0.05;
Fig. 9A). In addition, the
silencing of LINC02454 significantly reduced colony numbers
compared with the NC group (P<0.01; Fig. 9B). Based on these findings, it was
hypothesized that LINC02454 may play a critical role in regulating
PTC cell growth and proliferation.
Effect of LINC02454 on the cell cycle
of TPC1 cell lines in vitro
To investigate whether LINC02454 affects the
distribution of TPC1 cells in the cell cycle in vitro, the
cell cycle profile of TPC1 cells was determined at 48 h following
transfection with si-LINC02454-2 and si-NC by flow cytometric
analysis. The results revealed that there was a decrease in cell
numbers in the S phase and an increase in cells in
G0/G1 in cells transfected with
si-LINC02454-2 compared with the cells transfected with si-NC
(P<0.05 and P<0.01; Fig.
9C).
Effect of LINC02454 on the apoptosis
of TPC1 cell lines in vitro
The effect of LINC02454 on TPC1 cell apoptosis was
investigated using an apoptosis assay and flow cytometry. Apoptotic
cells were considered to consist of early and late apoptotic cells.
There was a significant increase in the percentages of apoptotic
cells in the si-LINC02454-transfected cells compared with the
si-NC-transfected TPC1 cells (P<0.05; Fig. 9D), which suggests that LINC02454 is
involved in regulating TPC1 cell cycle progression and
apoptosis.
Discussion
Over the past few decades, several lncRNAs have been
demonstrated to be significant regulators of thyroid tumorigenesis.
Moreover, abnormal expression levels of cancer-related lncRNAs have
led to the conclusion that such lncRNAs can be either tumor
promoters or suppressors, that can exert various effects on their
target genes. In the present study, by lncRNA expression microarray
profiling, it was shown that LINC02454 was significantly
upregulated in PTC tissues compared with normal control tissues.
LINC02454, a 589 bp RNA located on 12q14.3, is a novel gene
LINCRNA, that has not been fully researched. In the present study,
the biological roles of LINC02454 in PTC were explored.
Firstly, in the present study, PTC tissues had a
significantly higher LINC02454 expression level compared with that
in control tissue samples. An extensive overlapping compared to
normal tissue was also found; however, there was a marked increase
in LINC02454 expression in the TCGA and GEO cohort data. There are
3 reasons to account for this. One is the different methods used to
calculate the expression of LINC02454 in the 3 cohort data. In the
present study, the ΔCt method (2)
was used to calculate the relative expression levels of LINC02454.
In the TCGA database, the expression of LINC02454 was obtained by
normalizing the counts of the gene using the zoom method. In the
GEO 66783 database, the expression of LINC02454 was directly
obtained from the GSE66783_series_matrix.txt (GEO database) file.
Another reason is different racial types. The present study was
based on an Asian population. In the TCGA cohort, the study
subjects were Caucasians, African Americans and Asians. The third
is the different experimental methods. RT-qPCR was used to detect
the expression of LINC02454 in the present study, RNA-seq
sequencing in the TCGA cohort, and Chip technology in the GSE66783
cohort. Therefore, LINC02454 may be a beneficial diagnostic marker
in PTC. The expression levels of LINC02454 were associated with
clinical characteristics and a poor disease-free survival of
patients with PTC. It was hypothesized that LINC02454 may be an
oncogene for PTC. Thus, to investigate the role of LINC02454 in
PTC, functional assays were performed. First, functional enrichment
analysis of LINC02454-related genes revealed that these genes were
enriched in pathways, such as ‘pathways in cancer’, ‘cell
proliferation’ and ‘cell division’, indicating that LINC02454 may
play a critical role in cell proliferation and the cell cycle.
Hence, cell proliferation and apoptosis assays were performed to
investigate whether LINC02454 affects the proliferation processes
of PTC cell lines. The results indicated that the knockdown of
LINC02454 resulted in an increase in apoptosis, while decreasing
cellular proliferation rates in vitro. These findings
suggest that LINC02454 may act as an oncogene in the development of
PTC.
In addition, the underlying mechanisms of the
association between LINC02454 expression levels and aggressive
clinical outcomes and a poor disease-free survival of patients with
PTC was investigated. PTC is the second most common type of cancer
following melanoma with the BRAFV600E mutation. Previous studies
have demonstrated that BRAF (V600E) mutations are associated with
lymph node and distant tumor metastasis, and the survival of
patients with PTC (36,37). In the present study, it was found
that patients with the BRAF (V600E) mutation had significantly
increased expression levels of LINC02454 in the TCGA cohort,
suggesting that LINC02454 may be one of the BRAF (V600E)-related
lncRNAs, and may be possibly involved in BRAF (V600E)-induced PTC
development. The BRAF (V600E) mutation is the most frequently
mutated gene that activates the MAPK signaling pathway (38,39).
Thyroid tumorigenesis is highly dependent on the MAPK pathway,
which is a critical transduction pathway. The aberrant activation
of this cascade affects cell proliferation, differentiation,
migration, senescence and apoptosis (40,41).
In addition, a previous study found that the AKT/mTOR pathway was
overactivated in PTC, and harbored the BRAF (V600E) mutation
(42). In addition, novel BRAF
mutation-related genes have been identified in PTC (e.g., MMD,
ITPR3, AACS, LAD1, PVRL3, ALDH3B1 and RASA1), which will be used as
a basis for future research (43).
In conclusion, to the best of our knowledge, this is
the first study to demonstrate that LINC02454 is highly expressed
in thyroid cancer tissues and functions as an oncogene in PTC.
Furthermore, it was found to be associated with an aggressive
clinical outcome and a poor disease-free survival of patients with
PTC. The findings of the present study provides insight into the
applications of LINC02454 for the diagnosis, prognosis or treatment
of PTC. However, the present study only performed in vitro
studies; therefore, further investigations are required to discover
the underlying mechanisms involved in the suppression of growth and
increase in apoptosis following knockdown of LINC02454 in TPC1
cells.
Supplementary Material
Supporting Data
Acknowledgements
The authors gratefully acknowledge the assistance of
Dr Chao Liu of Nanjing University of Chinese Medicine, who provided
the valuable papillary thyroid cancer cell lines used in the
present study. The authors also owe a special debt of gratitude to
Ross Ihaka and Robert Gentleman of the Statistics Department of the
University of Auckland, who created the R programming language.
Funding
The present study was supported in part by the Key
Research and Development Project of Jiangsu Province (BE2015723),
Six Talent Peak Funding Plan (WSN-061), the Technology Development
Fund of Nanjing Medical University (NMUB2018144) and the Municipal
Science and Technology Plan Project of Huai'an.
Availability of data and materials
The datasets used during the present study are
available from the corresponding author upon reasonable
request.
Authors' contributions
YL, XY and JT designed the study. JT, LL, TC, BS, DD
and ZZ collected the data and performed the analysis. YL, XY and DD
supervised the study, and contributed to the drafting of the
manuscript. JT drafted the manuscript. All authors read and
approved the final manuscript.
Ethics approval and consent to
participate
Study protocols were reviewed and pre-approved by
the Ethics Committee of the Second Affiliated Hospital of Nanjing
Medical University (no. 2014 KY No. 054). All patients provided
written informed consent prior to participation in this study.
Patient consent for publication
Not applicable.
Competing interests
The authors declare that they have no competing
interests.
References
|
1
|
Bray F, Ferlay J, Soerjomataram I, Siegel
RL, Torre LA and Jemal A: Global cancer statistics 2018: GLOBOCAN
estimates of incidence and mortality worldwide for 36 cancers in
185 countries. CA Cancer J Clin. 68:394–424. 2018. View Article : Google Scholar : PubMed/NCBI
|
|
2
|
Pusztaszeri M and Auger M: Update on the
cytologic features of papillary thyroid carcinoma variants. Diagn
Cytopathol. 45:714–730. 2017. View
Article : Google Scholar : PubMed/NCBI
|
|
3
|
Chen W, Zheng R, Baade PD, Zhang S, Zeng
H, Bray F, Jemal A, Yu XQ and He J: Cancer statistics in China,
2015. CA Cancer J Clin. 66:115–132. 2016. View Article : Google Scholar : PubMed/NCBI
|
|
4
|
Liyanarachchi S, Li W, Yan P, Bundschuh R,
Brock P, Senter L, Ringel MD, de la Chapelle A and He H:
Genome-wide expression screening discloses long noncoding RNAs
involved in thyroid carcinogenesis. J Clin Endocrinol Metab.
101:4005–4013. 2016. View Article : Google Scholar : PubMed/NCBI
|
|
5
|
Chen W, Zheng R, Zeng H, Zhang S and He J:
Annual report on status of cancer in China, 2011. Chin J Cancer
Res. 27:2–12. 2015. View Article : Google Scholar : PubMed/NCBI
|
|
6
|
Roman BR, Morris LG and Davies L: The
thyroid cancer epidemic, 2017 perspective. Curr Opin Endocrinol
Diabetes Obes. 24:332–336. 2017. View Article : Google Scholar : PubMed/NCBI
|
|
7
|
Karadaghy OA, Kallogjeri D and Piccirillo
JF: Development of a new clinical severity staging system for
patients with nonmetastatic papillary thyroid carcinoma. JAMA
Otolaryngol Head Neck Surg. 143:1173–1180. 2017. View Article : Google Scholar : PubMed/NCBI
|
|
8
|
Grogan RH, Kaplan SP, Cao H, Weiss RE,
Degroot LJ, Simon CA, Embia OM, Angelos P, Kaplan EL and Schechter
RB: A study of recurrence and death from papillary thyroid cancer
with 27 years of median follow-up. Surgery. 154:1436–1447. 2013.
View Article : Google Scholar : PubMed/NCBI
|
|
9
|
Giordano TJ, Kuick R, Thomas DG, Misek DE,
Vinco M, Sanders D, Zhu Z, Ciampi R, Roh M, Shedden K, et al:
Molecular classification of papillary thyroid carcinoma: Distinct
BRAF, RAS, and RET/PTC mutation-specific gene expression profiles
discovered by DNA microarray analysis. Oncogene. 24:6646–6656.
2005. View Article : Google Scholar : PubMed/NCBI
|
|
10
|
Adeniran AJ, Zhu Z, Gandhi M, Steward DL,
Fidler JP, Giordano TJ, Biddinger PW and Nikiforov YE: Correlation
between genetic alterations and microscopic features, clinical
manifestations, and prognostic characteristics of thyroid papillary
carcinomas. Am J Surg Pathol. 30:216–222. 2006. View Article : Google Scholar : PubMed/NCBI
|
|
11
|
Greco A, Miranda C and Pierotti MA:
Rearrangements of NTRK1 gene in papillary thyroid carcinoma. Mol
Cell Endocrinol. 321:44–49. 2010. View Article : Google Scholar : PubMed/NCBI
|
|
12
|
Ellis RJ, Wang Y, Stevenson HS, Boufraqech
M, Patel D, Nilubol N, Davis S, Edelman DC, Merino MJ, He M, et al:
Genome-wide methylation patterns in papillary thyroid cancer are
distinct based on histological subtype and tumor genotype. J Clin
Endocrinol Metab. 99:E329–E337. 2014. View Article : Google Scholar : PubMed/NCBI
|
|
13
|
Murugan AK, Munirajan AK and Alzahrani AS:
Long noncoding RNAs: Emerging players in thyroid cancer
pathogenesis. Endocr Relat Cancer. 25:R59–R82. 2018. View Article : Google Scholar : PubMed/NCBI
|
|
14
|
Sui F, Ji M and Hou P: Long non-coding
RNAs in thyroid cancer: Biological functions and clinical
significance. Mol Cell Endocrinol. 469:11–22. 2018. View Article : Google Scholar : PubMed/NCBI
|
|
15
|
Wei MM and Zhou GB: Long Non-coding RNAs
and their roles in Non-small-cell lung cancer. Genomics Proteomics
Bioinformatics. 14:280–288. 2016. View Article : Google Scholar : PubMed/NCBI
|
|
16
|
Bartonicek N, Maag JL and Dinger ME: Long
noncoding RNAs in cancer: Mechanisms of action and technological
advancements. Mol Cancer. 15:432016. View Article : Google Scholar : PubMed/NCBI
|
|
17
|
Li JH, Zhang SQ, Qiu XG, Zhang SJ, Zheng
SH and Zhang DH: Long non-coding RNA NEAT1 promotes malignant
progression of thyroid carcinoma by regulating miRNA-214. Int J
Oncol. 50:708–716. 2017. View Article : Google Scholar : PubMed/NCBI
|
|
18
|
Kim D, Lee WK, Jeong S, Seol MY, Kim H,
Kim KS, Lee EJ, Lee J and Jo YS: Upregulation of long noncoding RNA
LOC100507661 promotes tumor aggressiveness in thyroid cancer. Mol
Cell Endocrinol. 431:36–45. 2016. View Article : Google Scholar : PubMed/NCBI
|
|
19
|
Yang T, Zhai H, Yan R, Zhou Z, Gao L and
Wang L: lncRNA CCAT1 promotes cell proliferation, migration, and
invasion by down-regulation of miR-143 in FTC-133 thyroid carcinoma
cell line. Braz J Med Biol Res. 51:e70462018. View Article : Google Scholar : PubMed/NCBI
|
|
20
|
Dai W, Tian Y, Jiang B and Chen W:
Down-regulation of long non-coding RNA AFAP1-AS1 inhibits tumor
growth, promotes apoptosis and decreases metastasis in thyroid
cancer. Biomed Pharmacother. 99:191–197. 2018. View Article : Google Scholar : PubMed/NCBI
|
|
21
|
Zheng H, Wang M, Jiang L, Chu H, Hu J,
Ning J, Li B, Wang D and Xu J: BRAF-activated long noncoding RNA
modulates papillary thyroid carcinoma cell proliferation through
regulating thyroid stimulating hormone receptor. Cancer Res Treat.
48:698–707. 2016. View Article : Google Scholar : PubMed/NCBI
|
|
22
|
Wang C, Yan G, Zhang Y, Jia X and Bu P:
Long non-coding RNA MEG3 suppresses migration and invasion of
thyroid carcinoma by targeting of Rac1. Neoplasma. 62:541–549.
2015. View Article : Google Scholar : PubMed/NCBI
|
|
23
|
Ma B, Liao T, Wen D, Dong C, Zhou L, Yang
S, Wang Y and Ji Q: Corrigendum: Long intergenic non-coding RNA 271
is predictive of a poorer prognosis of papillary thyroid cancer.
Sci Rep. 7:423212017. View Article : Google Scholar : PubMed/NCBI
|
|
24
|
Lan X, Sun W, Dong W, Wang Z, Zhang T, He
L and Zhang H: Downregulation of long noncoding RNA H19 contributes
to the proliferation and migration of papillary thyroid carcinoma.
Gene. 646:98–105. 2018. View Article : Google Scholar : PubMed/NCBI
|
|
25
|
Liu L, Yang J, Zhu X, Li D, Lv Z and Zhang
X: Long noncoding RNA H19 competitively binds miR-17-5p to regulate
YES1 expression in thyroid cancer. FEBS J. 283:2326–2339. 2016.
View Article : Google Scholar : PubMed/NCBI
|
|
26
|
Tam S, Boonsripitayanon M, Amit M, Fellman
BM, Li Y, Busaidy NL, Cabanillas ME, Dadu R, Sherman S, Waguespack
SG, et al: Survival in differentiated thyroid cancer: Comparing the
AJCC cancer staging seventh and eighth editions. Thyroid.
28:1301–1310. 2018. View Article : Google Scholar : PubMed/NCBI
|
|
27
|
Ritchie ME, Phipson B, Wu D, Hu Y, Law CW,
Shi W and Smyth GK: Limma powers differential expression analyses
for RNA-sequencing and microarray studies. Nucleic Acids Res.
43:e472015. View Article : Google Scholar : PubMed/NCBI
|
|
28
|
Szklarczyk D, Franceschini A, Kuhn M,
Simonovic M, Roth A, Minguez P, Doerks T, Stark M, Muller J, Bork
P, et al: The STRING database in 2011: Functional interaction
networks of proteins, globally integrated and scored. Nucleic Acids
Res. 39:D561–D568. 2011. View Article : Google Scholar : PubMed/NCBI
|
|
29
|
Smoot ME, Ono K, Ruscheinski J, Wang PL
and Ideker T: Cytoscape 2.8: New features for data integration and
network visualization. Bioinformatics. 27:431–432. 2011. View Article : Google Scholar : PubMed/NCBI
|
|
30
|
Gene Ontology Consortium: Gene ontology
consortium: Going forward. Nucleic Acids Res. 43:D1049–D1056. 2015.
View Article : Google Scholar : PubMed/NCBI
|
|
31
|
Kanehisa M, Sato Y, Kawashima M, Furumichi
M and Tanabe M: KEGG as a reference resource for gene and protein
annotation. Nucleic Acids Res. 44:D457–D462. 2016. View Article : Google Scholar : PubMed/NCBI
|
|
32
|
Dennis G Jr, Sherman BT, Hosack DA, Yang
J, Gao W, Lane HC and Lempicki RA: DAVID: Database for annotation,
visualization, and integrated discovery. Genome Biol. 4:P32003.
View Article : Google Scholar : PubMed/NCBI
|
|
33
|
Ogluszka M, Orzechowska M, Jedroszka D,
Witas P and Bednarek AK: Evaluate cutpoints: Adaptable continuous
data distribution system for determining survival in Kaplan-Meier
estimator. Comput Methods Programs Biomed. 177:133–139. 2019.
View Article : Google Scholar : PubMed/NCBI
|
|
34
|
Kartsonaki C: Survival analysis. Diagnos
Histopathol. 22:263–270. 2016. View Article : Google Scholar
|
|
35
|
Song B, Li R, Zuo Z, Tan J, Liu L, Ding D,
Lu Y and Hou D: LncRNA ENST00000539653 acts as an oncogenic factor
via MAPK signalling in papillary thyroid cancer. BMC Cancer.
19:2972019. View Article : Google Scholar : PubMed/NCBI
|
|
36
|
Xing M, Alzahrani AS, Carson KA, Viola D,
Elisei R, Bendlova B, Yip L, Mian C, Vianello F, Tuttle RM, et al:
Association between BRAF V600E mutation and mortality in patients
with papillary thyroid cancer. JAMA. 309:1493–1501. 2013.
View Article : Google Scholar : PubMed/NCBI
|
|
37
|
Moon S, Song YS, Kim YA, Lim JA, Cho SW,
Moon JH, Hahn S, Park DJ and Park YJ: Effects of coexistent
BRAF(V600E) and TERT promoter mutations on poor clinical outcomes
in papillary thyroid cancer: A Meta-analysis. Thyroid. 27:651–660.
2017. View Article : Google Scholar : PubMed/NCBI
|
|
38
|
Fahiminiya S, de Kock L and Foulkes WD:
Biologic and clinical perspectives on thyroid cancer. N Engl J Med.
375:2306–2307. 2016. View Article : Google Scholar : PubMed/NCBI
|
|
39
|
Xing M: Molecular pathogenesis and
mechanisms of thyroid cancer. Nat Rev Cancer. 13:184–199. 2013.
View Article : Google Scholar : PubMed/NCBI
|
|
40
|
Xie J, Fan Y and Zhang X: Molecular
mechanisms in differentiated thyroid cancer. Front Biosci (Landmark
Ed). 21:119–129. 2016. View
Article : Google Scholar : PubMed/NCBI
|
|
41
|
Sun Y, Liu WZ, Liu T, Feng X, Yang N and
Zhou HF: Signaling pathway of MAPK/ERK in cell proliferation,
differentiation, migration, senescence and apoptosis. J Recept
Signal Transduct Res. 35:600–604. 2015. View Article : Google Scholar : PubMed/NCBI
|
|
42
|
Faustino A, Couto JP, Populo H, Rocha AS,
Pardal F, Cameselle-Teijeiro JM, Lopes JM, Sobrinho-Simões M and
Soares P: mTOR pathway overactivation in BRAF mutated papillary
thyroid carcinoma. J Clin Endocrinol Metab. 97:E1139–E1149. 2012.
View Article : Google Scholar : PubMed/NCBI
|
|
43
|
Rusinek D, Swierniak M, Chmielik E, Kowal
M, Kowalska M, Cyplinska R, Czarniecka A, Piglowski W, Korfanty J,
Chekan M, et al: BRAFV600E-associated gene expression profile:
Early changes in the transcriptome, based on a transgenic mouse
model of papillary thyroid carcinoma. PLoS One. 10:e01436882015.
View Article : Google Scholar : PubMed/NCBI
|