Introduction
Epithelial ovarian cancer is the most lethal
gynecological cancer and the seventh most commonly diagnosed cancer
among females worldwide (1).
Worldwide, a total of 230,000 females are diagnosed and 150,000 die
from the disease (2). The main
reasons for failure in the treatment of ovarian cancer are late
presentation, high recurrence and drug resistance (3). Many patients with stage III or IV
ovarian cancer who show complete response to frontline treatment
eventually show high recurrence rates (3). Several studies have focused on
lowering the high recurrence and drug-resistance rates and
improving survival of patients with ovarian cancer (4,5). The
Cancer Genome Atlas project has analyzed mRNA expression, microRNA
expression, promoter methylation and DNA copy number in high-grade
serous ovarian cancer tissues, and pathway analyses suggested that
forkhead box protein M1 (FOXM1) signaling is involved in serous
ovarian cancer pathophysiology (4).
This project determined that the FOXM1 transcription factor network
was significantly altered in 87% of cases and FOXM1 and its
proliferation-related target genes were consistently overexpressed.
The transcription factor FOXM1 binds to sequence-specific motifs on
DNA through its DNA-binding domain and activates proliferation- and
differentiation-associated genes (6). Aberrant overexpression of FOXM1 plays
an important role in cancer progression and oncogenesis (7). Decreased FOXM1 expression by inhibitor
activity significantly inhibited ovarian cancer cell
migration/invasion and tumor growth in vitro and in
vivo (8).
The major obstacle in the management of ovarian
cancer is drug resistance, and compensatory adaptive response is
one of the mechanisms that cause drug resistance (5,9). This
response in cancer cells modulated the cell signaling pathway
related to cell survival and activates the drug resistance process,
which ultimately can lead to the survival of cancer cells during
drug therapy. Thus, the addition of a secondary drug that can
hinder the compensatory adaptive response may increase the
effectiveness of ovarian cancer treatment by reducing the viability
of cancer cells. Previously, we confirmed that pS6 is activated by
the compensatory adaptive response to paclitaxel in HeyA8 and SKOV3
ovarian cancer cells and inhibiting pS6 increased the efficacy of
paclitaxel in reducing the survival of cancer cells (5). Inhibition of FOXM1 may decrease
ovarian cancer growth, however, the compensatory adaptive response
induced by FOXM1 inhibition interrupts effective treatment. In
addition to FOXM1, the inhibition of compensatory adaptive response
induced by FOXM1 inhibitor may be more effective in the treatment
of ovarian cancer.
Normal epithelial cells form well-organized cell
layers with the help of the extracellular matrix, and additional
supplements from the extracellular matrix are required to regulate
the normal process of epithelial cell proliferation,
differentiation and survival (10).
Since two-dimensional cell culture is not optimal to explain the
mechanisms by which cancer cells survive and proliferate,
three-dimensional (3D) cell culture models, which mimic the in
vivo environment more accurately compared with two-dimensional
cell cultures, are used in epithelial tumor cell studies to assess
the consecutive processes of cancer initiation and cancer cell
proliferation (10–12).
The present study used 3D cell cultures to analyze
the compensatory signaling pathway to FOXM1 inhibition in ovarian
cancer cells and assessed the additional effectiveness of
inhibition of FOXM1 in decreasing the survival of ovarian cancer
cells. Forkhead domain inhibitor-6 (FDI-6) was selected as the
FOXM1 inhibitor. FDI-6 binds directly to FOXM1 to displace FOXM1
from its genomic targets and induce concomitant transcriptional
downregulation (6).
Materials and methods
Cells
HeyA8, CAOV3, OVCAR3 and SKOV3 ovarian cancer cell
lines derived from humans were used. CAOV3 (cat. no. 30075), OVCAR3
(cat. no. 30161) and SKOV3 (cat. no. 30077) cells were purchased
from the Korean Cell Line Bank. CAOV3, OVCAR3 and SKOV3 cells were
derived from a human ovarian adenocarcinoma. HeyA8 cells were a
kind gift from a laboratory of the Department of Systems Biology,
MD Anderson Cancer Center, Houston, TX, USA. The HeyA8 cells
originated from a human ovarian cancer xenograft (HX-62) that was
developed from a peritoneal metastatic mass of a patient with
moderately differentiated papillary cystadenocarcinoma of the ovary
(13).
Cell culture
All cancer cell lines were maintained in RPMI-1640
medium (Gibco; Thermo Fisher Scientific, Inc.) containing 10% FBS
(Gibco; Thermo Fisher Scientific, Inc.), streptomycin (10,000
µg/ml), penicillin (10,000 U/ml) and amphotericin B (25 µg/ml) at
37°C in humidified atmosphere with 5% CO2. For the 3D
culture, each well of a 96- or 12-well plate were coated with
thawed Matrigel (Growth Factor Reduced Matrigel; Corning Inc.) and
seeded with ovarian cancer cells. A total of 1×10⁴
HeyA8, CAOV3, and OVCAR3 cells/well were seeded in a 12-well plate
coated with Matrigel, and the 3D structures attained 80% confluence
after 4 days of incubation. During the FDI-6 (Axon Medchem)
treatment, the FBS content of the medium was changed to 2%. The
plates were kept inside an incubator at 37°C for 24 h for western
blot analysis, cell viability assay and RPPA analysis. Inhibitors
of proteins involved in the compensatory signaling pathway were
simultaneously supplied with FDI-6 to the ovarian cancer cells.
N-Ras, phosphoprotein kinase C-delta (p-PKCδ) (S664), and HER3 were
selected as proteins involved in the compensatory adaptive
response. The present study used tipifarnib (Cayman Chemical
Company) for N-Ras inhibition, rottlerin (Abcam) for p-PKCδ (S664)
inhibition and sapitinib (Selleck Chemicals) for HER3 inhibition.
Tipifarnib, a farnesyl transferase inhibitor interferes with Ras
function by inhibition of farnesyl transferase, the enzyme coupling
a 15-carbon isoprenyl group to Ras proteins (14). Rottlerin is a protein kinase
inhibitor and inhibits PKCδ by interacting with its ATP-binding
site (15). Sapitinib is an
EGFR/ErbB family inhibitor, which induces apoptosis in the
sensitive cell lines and suppresses phosphorylated (p)-EGFR and its
downstream pathways in a dose-dependent manner (16). HER3 possesses impaired kinase
activity and preferably heterodimerizes with HER2. HER3-HER2
heterodimerization activates downstream signaling pathways that
regulate several cellular processes including cell proliferation,
cell survival, apoptosis, tumor growth, and metastasis (17).
Cell viability assay
Cell viability was analyzed using Cell Counting
Kit-8 (CCK-8; Dojindo Molecular Technologies, Inc.) according to
the manufacturer's instructions. A total of 1×10³ HeyA8
and CAOV3 cells and 1×10⁴ SKOV3 cells were seeded into a
96-well plate for the cell viability assay. FDI-6 was added to each
cell culture on day 4. The culture medium was removed and 100 µl
fresh medium containing 10 µl CCK-8 solution was added to each
well. The cells were then placed in a 37°C incubator for 4 h. The
optical density values were determined in triplicate at a
wavelength of 450 nm. The cell viability was analyzed in ovarian
cancer cells after treatment with FDI-6 alone (0, 3 and 10 µM) with
one inhibitor of N-Ras, p-PKCδ (S664), and HER3 (0, 3 and 10 µM)
and with the combination of FDI-6 and an inhibitor.
RPPA analysis
RPPA analysis was performed to identify proteins
involved in the compensatory adaptive response induced by FDI-6 in
HeyA8 cells. RPPA analysis is a high-throughput method that allows
the measurement of protein expression levels in a large number of
samples simultaneously using >200 validated antibodies. A total
of 1×10⁴ HeyA8 cells/well were seeded in a 12-well plate
for RPPA analysis. FDI-6 was added to each cell culture on day 6.
HeyA8 cells were treated with FDI-6 at concentrations of 1, 10 and
20 µl on day 6. All tests were performed in duplicate. After
thawing Matrigel by adding 800 µl 1X Hank's balanced salt solution
with 5 mM ethylenediaminetetraacetic acid to each well, the cells
were lysed by mixing 30–100 µl lysis buffer [1% Triton X-100, 50 mM
HEPES (pH 7.4), 150 mM NaCl, 1.5 mM MgCl2, 1 mM EGTA,
100 mM NaF 10 mM Na pyrophosphate, 1 mM Na3VO4, 10%
glycerol] with the cell pellet followed by centrifugation at 18,470
× g and 4°C for 10 min. The bicinchoninate method was used to
measure protein concentration. A total of 10 µl SDS sample buffer
[40% glycerol, 8% SDS, 0.25 M Tris-HCl (pH 6.8) and
β-mercaptoethanol) was added to 30 µl supernatant and heated to
95°C for 5 min. Protein lysate concentrations were adjusted to 1
µg/µl, and a serial dilution of five concentrations was prepared,
with 10% of the samples replicated for quality control (2470
Arrayer; Aushon Biosystems Inc.) on nitrocellulose-coated slides
(Grace Bio-Labs). Immunostaining was performed using a
DakoCytomation-catalyzed system (Dako; Agilent Technologies, Inc.)
and diaminobenzidine colorimetric reaction. Spot intensities were
analyzed and quantified using MicroVigene software (version 3.0,
VigeneTech Inc.) to generate spot signal intensities. Data from the
RPPA analysis were rearranged by the rank sum score method and are
expressed in a heat map in which green indicates downregulation and
red indicates upregulation of protein expression. The heat map was
generated using Cluster 3.0 (http://bonsai.hgc.jp/~mdehoon/software/cluster/software.htm)
as a hierarchical cluster using Pearson's correlation coefficient
and a center metric.
Western blot analysis
A total of 1×10⁴ HeyA8, CAOV3, and OVCAR3
cells/well and 1×10⁵ SKOV3 cells/well were seeded in a
12-well plate for western blot analysis. FDI-6 was added to each
cell culture on day 4. Ovarian cancer cell lysates were prepared
using RIPA buffer (Thermo Fisher Scientific, Inc.). Protein
concentration was determined through the Lowry method using a DC
protein assay kit (Bio-Rad Laboratories, Inc.) following the
manufacturer's protocol. Protein samples (5 µg) were separated
using 8–12% SDS-PAGE and transferred to a polyvinylidene difluoride
membrane (Amersham; Cytiva). The membrane was pre-incubated with 5%
skimmed milk in TBS for 1 h at room temperature. Membranes were
incubated with primary antibodies against FOXM1 (cat. no. 5436;
Cell Signaling Technology, Inc.), HER3 (cat. no. 12708; Cell
Signaling Technology, Inc.), N-Ras (cat. no. sc-31; Santa Cruz
Biotechnology, Inc.), p-PKCδ (S664) (cat. no. sc-365463; Santa Cruz
Biotechnology, Inc.), PKCδ (cat. no. ab18216; Abcam), and β-actin
(cat. no. A5441; Sigma-Aldrich; Merck KGaA) were diluted 1:1,000 in
TBS with 0.1% Tween-20 (TBS-T) overnight at 4°C and then washed
three times with TBS-T. Following which, membranes were incubated
with HRP-conjugated goat anti-rabbit IgG antibody (1:5,000; cat.
no. BR170-6515; Bio-Rad Laboratories, Inc.) or goat anti-mouse IgG
antibody (1:5,000; cat. no. BR170-6516; Bio-Rad Laboratories, Inc.)
for 1 h at room temperature. The membrane was washed in TBS-T, and
hybridized bands were detected using an ECL clarity detection kit
(Bio-Rad Laboratories, Inc.) and ChemiDoc XR analyzer software
Image Lab 5.1 (Bio-Rad Laboratories, Inc.).
Chromatin isolation
HeyA8 cells were grown in 100-mm dishes to 80%
confluence prior to FDI-6 (1, 3 and 10 µM) or 0.1% DMSO control
treatment for 24 h. For chromatin isolation, cells were harvested
using a chromatin extraction kit (Abcam) according to the
manufacturer's protocol. First, cells were cross-linked with 1%
formaldehyde in 10 ml culture media by rocking at 50 rpm for 10 min
at room temperature and added to 1.1 ml of 1.25 M glycine.
Subsequently, cells were harvested by scraping into cold PBS and
centrifuged at 20,500 × g for 5 min at 4°C. Cell pellets were lysed
sequentially with lysis buffer and resuspended in extraction buffer
containing protease inhibitors. Samples were homogenized on ice
using a Q125 sonicator (Qsonica; Misonix, Inc.) for 2 min at medium
power with a pulse of 20 sec on/30 sec off and centrifuged at
13,570 × g for 10 min at 4°C. The supernatant was collected and
dialyzed in chromatin buffer at a 1:1 ratio. Protein concentration
was measured using a DC protein assay kit (Bio-Rad Laboratories,
Inc.) according to the manufacturer's protocol. Protein samples (5
µg) were separated using 8–10% SDS-PAGE and further analyzed using
western blot analysis. Incubation with primary antibody against
FOXM1 (1:1,000), histone H3 (1:5,000; cat. no. ab1791; Abcam) and
GAPDH (cat. no. A9545; Sigma-Aldrich; Merck KGaA) was performed
overnight at 4°C.
ATP measurement
HeyA8 cells were seeded in 12-well plates and
treated with 0, 3 and 10 µM rottlerin for 24 h. Cells were washed
with cold PBS and total ATP levels were measured in cell lysates
using a Colorimetric ATP Assay kit (cat. no. ab83355; Abcam)
according to the manufacturer's protocol. Briefly, cells were
resuspended in 100 µl ATP assay buffer, centrifuged at 13,000 × g
for 5 min at 4°C and protein was removed from the supernatant using
Deproteinizing Sample Preparation kit (cat. no. ab204708; Abcam). A
total of 40 µl deproteinated samples were added to the ATP reaction
mix in 96-well clear plates and incubated at room temperature for
30 min in the dark. The absorbance of samples was measured using a
VersaMax microplate reader (Molecular Devices, LLC) at a wavelength
of 570 nm and the results were calculated relative to the standard
curve.
Microscopic imaging analysis
Images of ovarian cancer cells following treatment
with FDI-6 and inhibitors for 24 h were captured under ×100
magnification using an inverted microscopy (CKX41; Olympus
Corporation).
Statistical analysis
One-way ANOVA and Tukey's Honest Significant
Difference test was applied to evaluate the differences in cell
viability and protein expression. All statistical analyses were
performed using SPSS (version 20; IBM Corp.). P<0.05 was
considered to indicate a statistically significant difference.
Results
Protein expression after FOXM1
inhibition on ovarian cancer cells
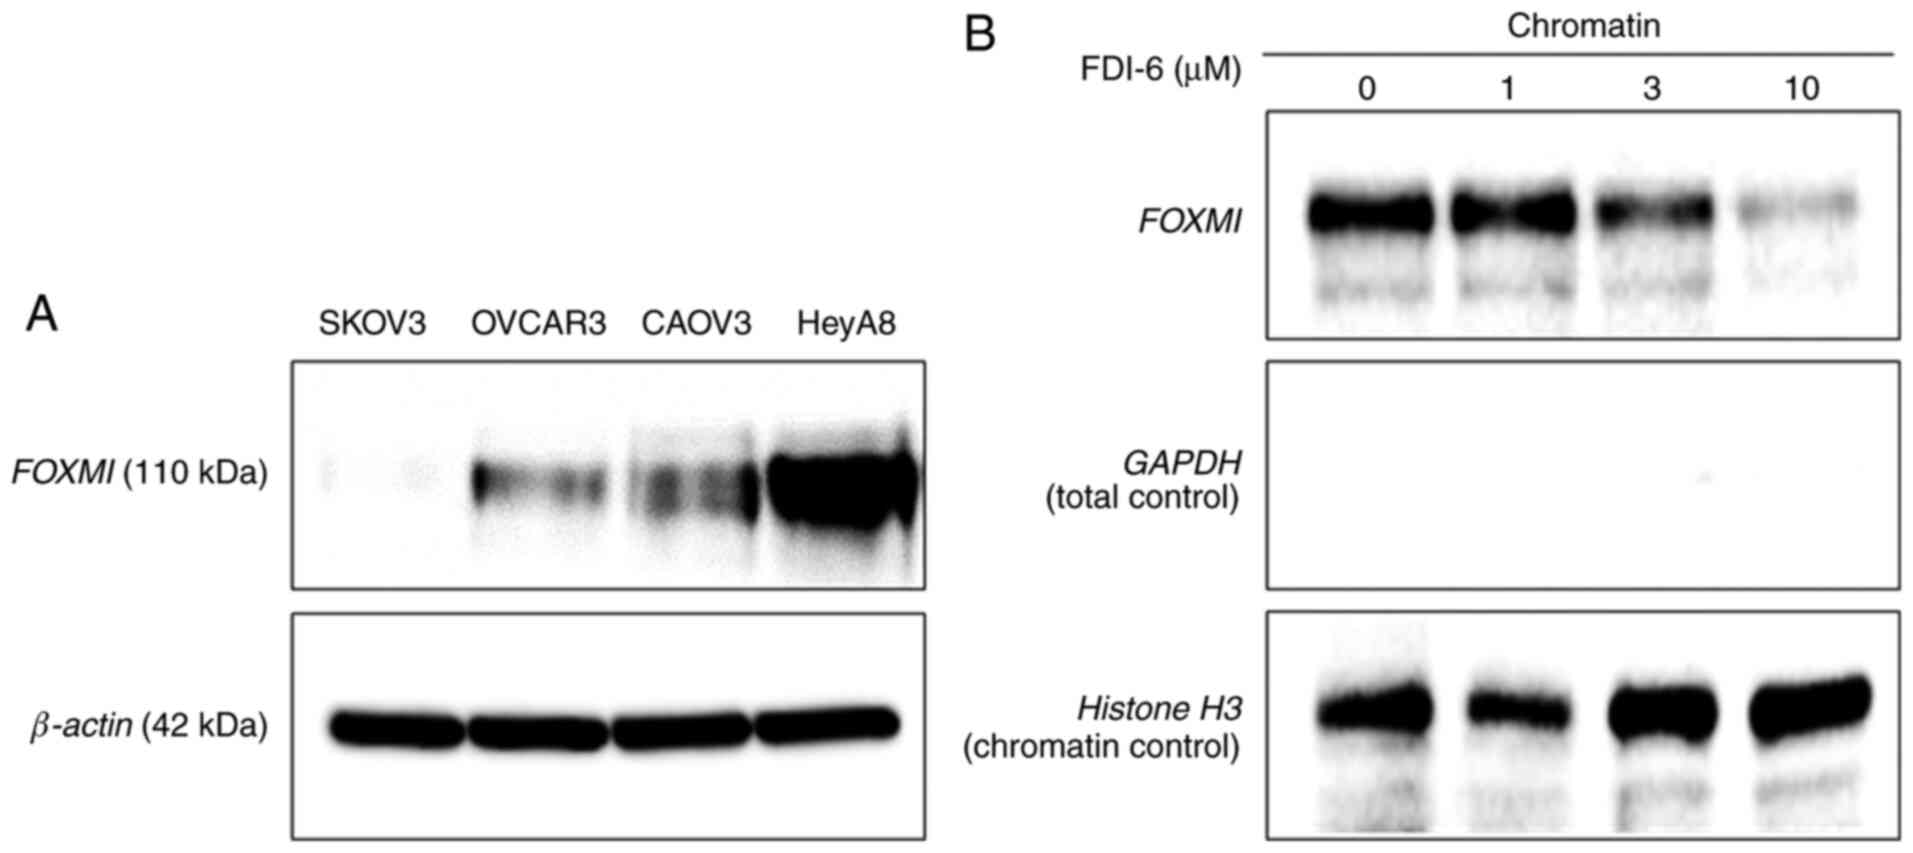
FOXM1 expression was assessed in several ovarian
cancer cells in order to select the cells for use in subsequent
experiments. FOXM1 expression was the highest in HeyA8 cells based
on western blot analysis (Fig. 1A).
FOXM1 expression was also observed in CAOV3 and OVCAR3 cells, but
the expression level was rather low in SKOV3 cells. Hence, HeyA8
and CAOV3 cells were selected for subsequent experiments and SKOV3
cells were used as controls. FDI-6 inhibited FOXM1 function by
displacing FOXM1 from its genomic targets in HeyA8 cells (Fig. 1B). Western blot analysis on
chromatin fractions revealed a specific displacement of DNA-bound
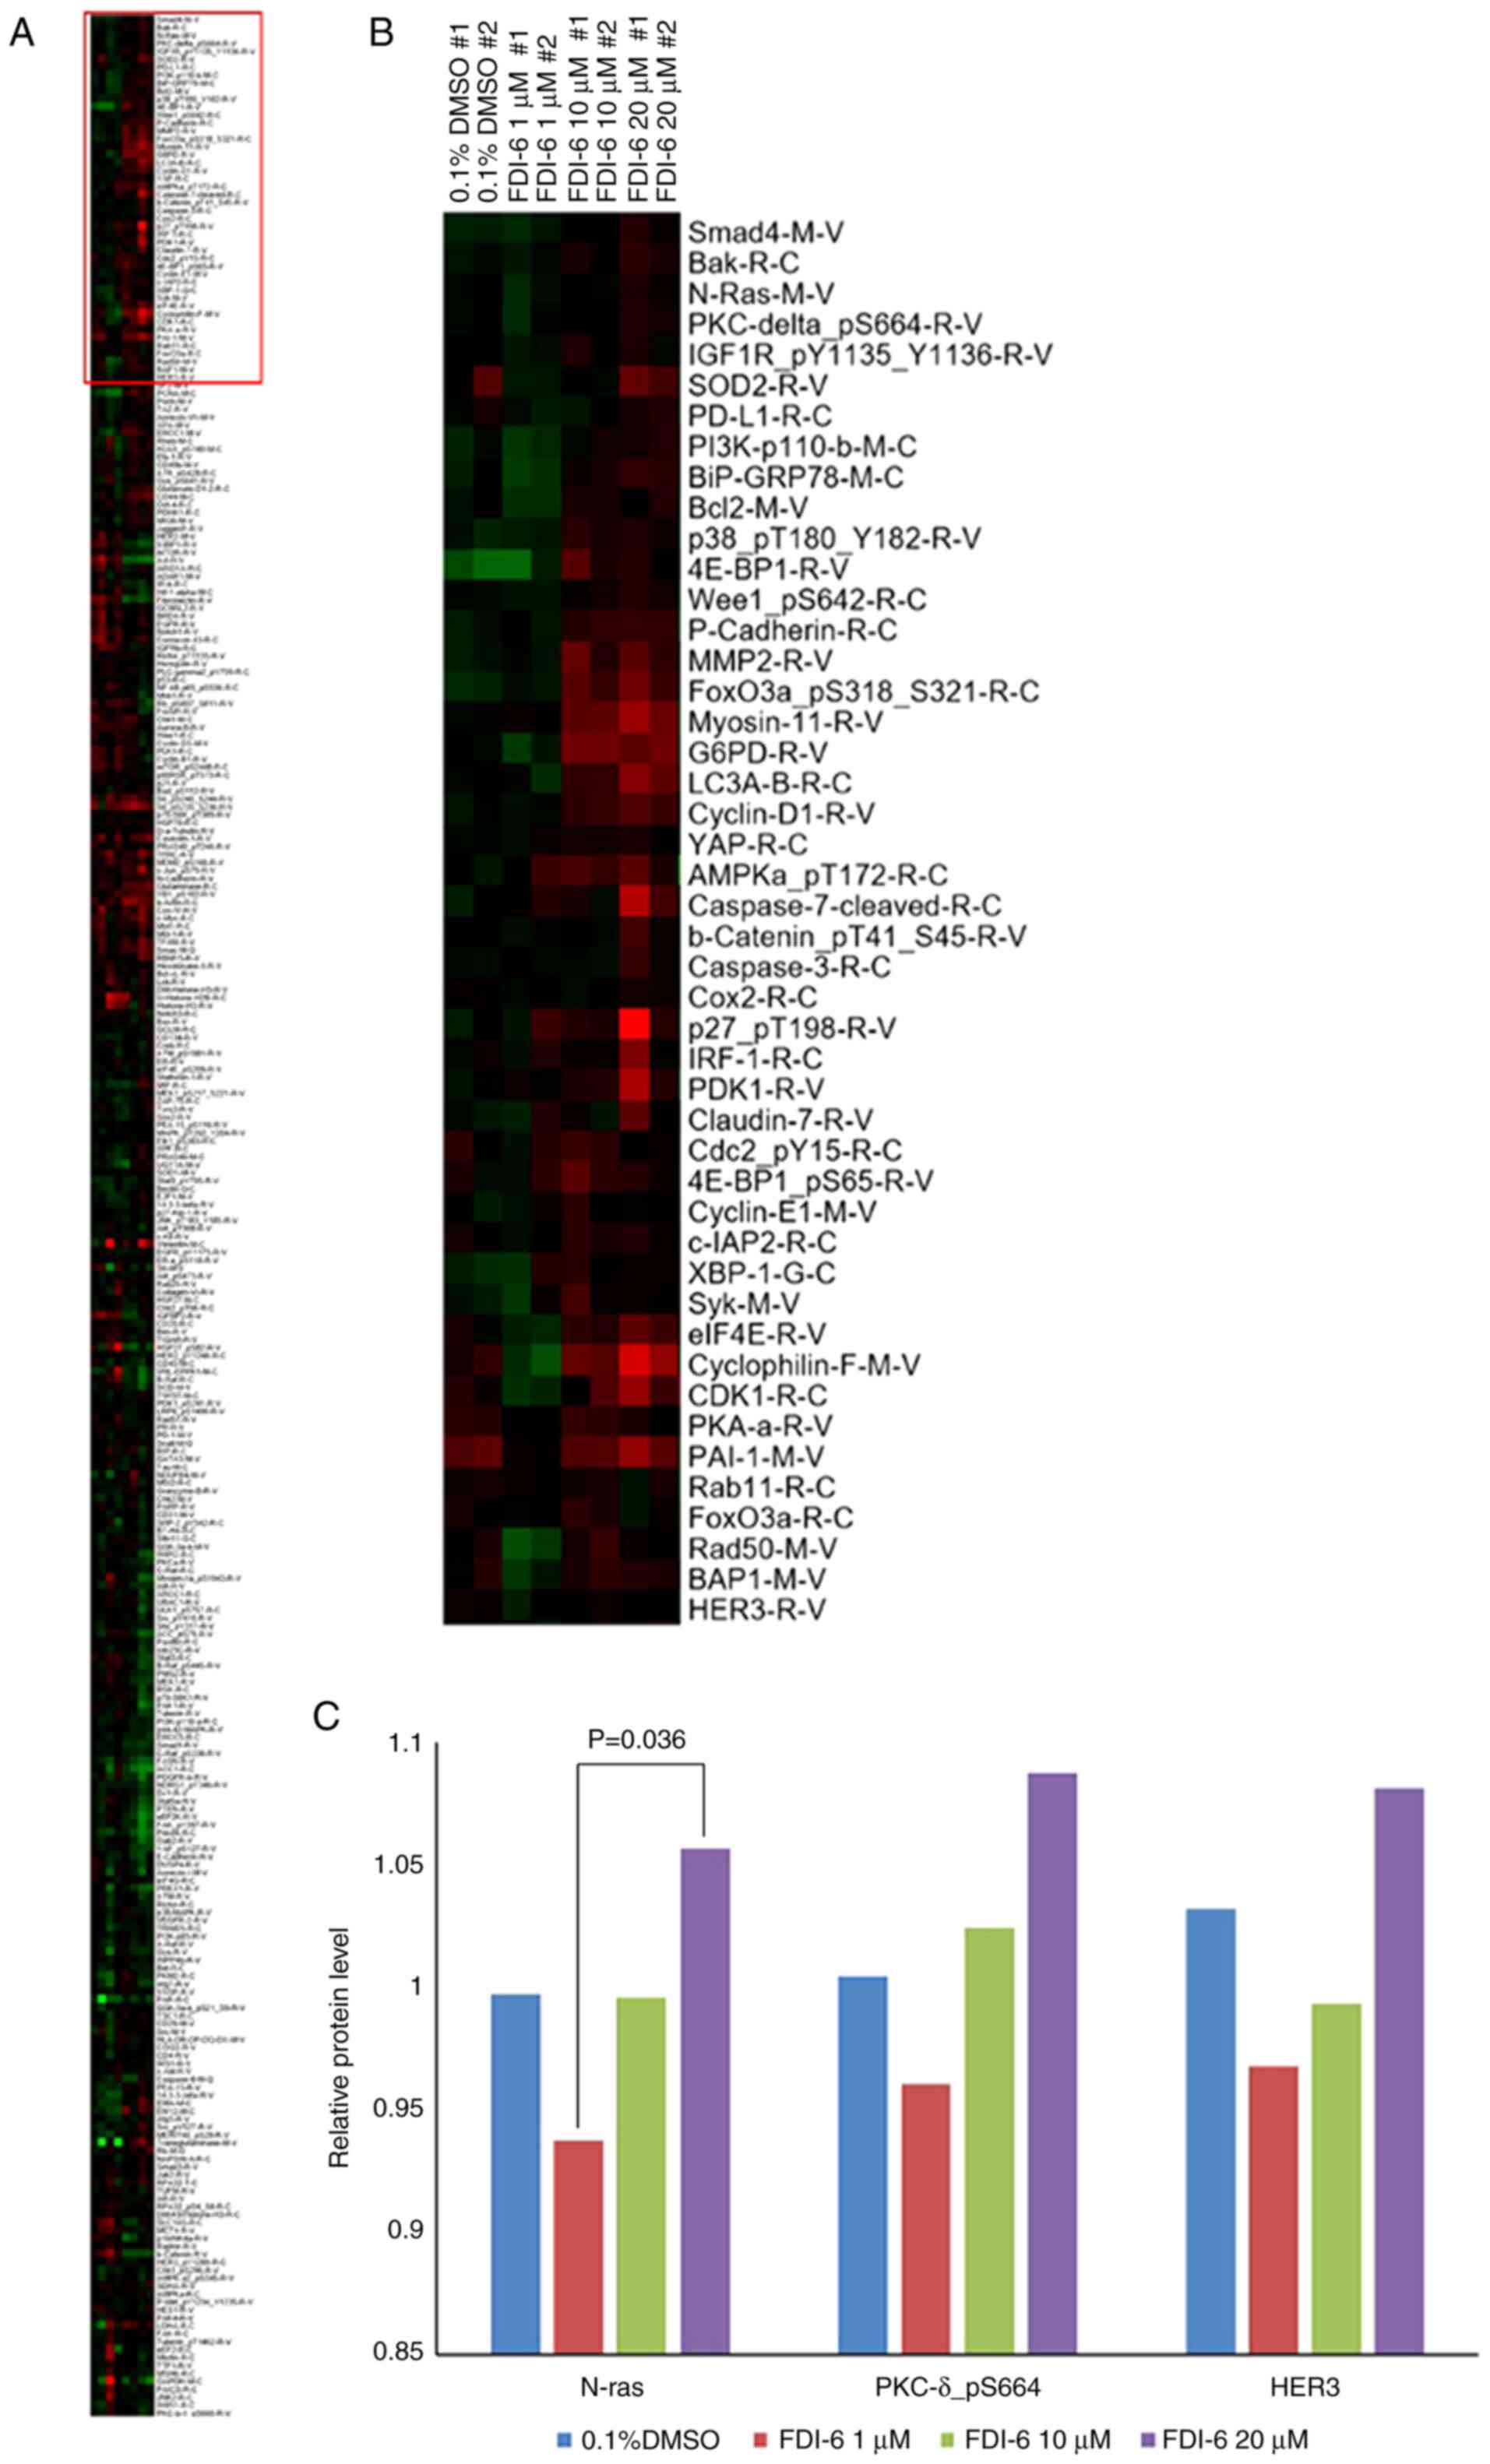
FOXM1 following treatment with FDI-6. RPPA analysis was performed
to identify the proteins associated the adaptive signaling pathway
response induced by FDI-6 in HeyA8 cells (Fig. 2). In cells treated with the highest
concentration of FDI-6 (20 µM), the concentration of DMSO was 0.1%,
and the concentration of DMSO in the control was also 0.1%. When
cells were treated with a lower concentration of FDI-6, less DMSO
was included and the effect of DMSO on cells was minimized
(Fig. 2C). Different concentrations
of DMSO may cause an initial decrease in expression of these
proteins at low doses of FDI-6. As shown in Fig. 2A and B, proteins with a high
expression level after inhibition of FOXM1 are displayed in red in
the upper part of the heat map, and proteins with low or no
expression are shown in green in the lower part of the heat map. In
the heat map, the proteins are arranged according to the degree of
expression from top to bottom. Proteins with a high expression
level (in red) and associated with the cell signaling pathway were
chosen first. Bak and Bcl2 are apoptotic proteins and were excluded
from candidate proteins. Validation by western blot analysis
identified the proteins with different expression levels from those
shown in RPPA analysis, and these were also excluded. Smad4 was
shown to be differently expressed on western blot analysis and was
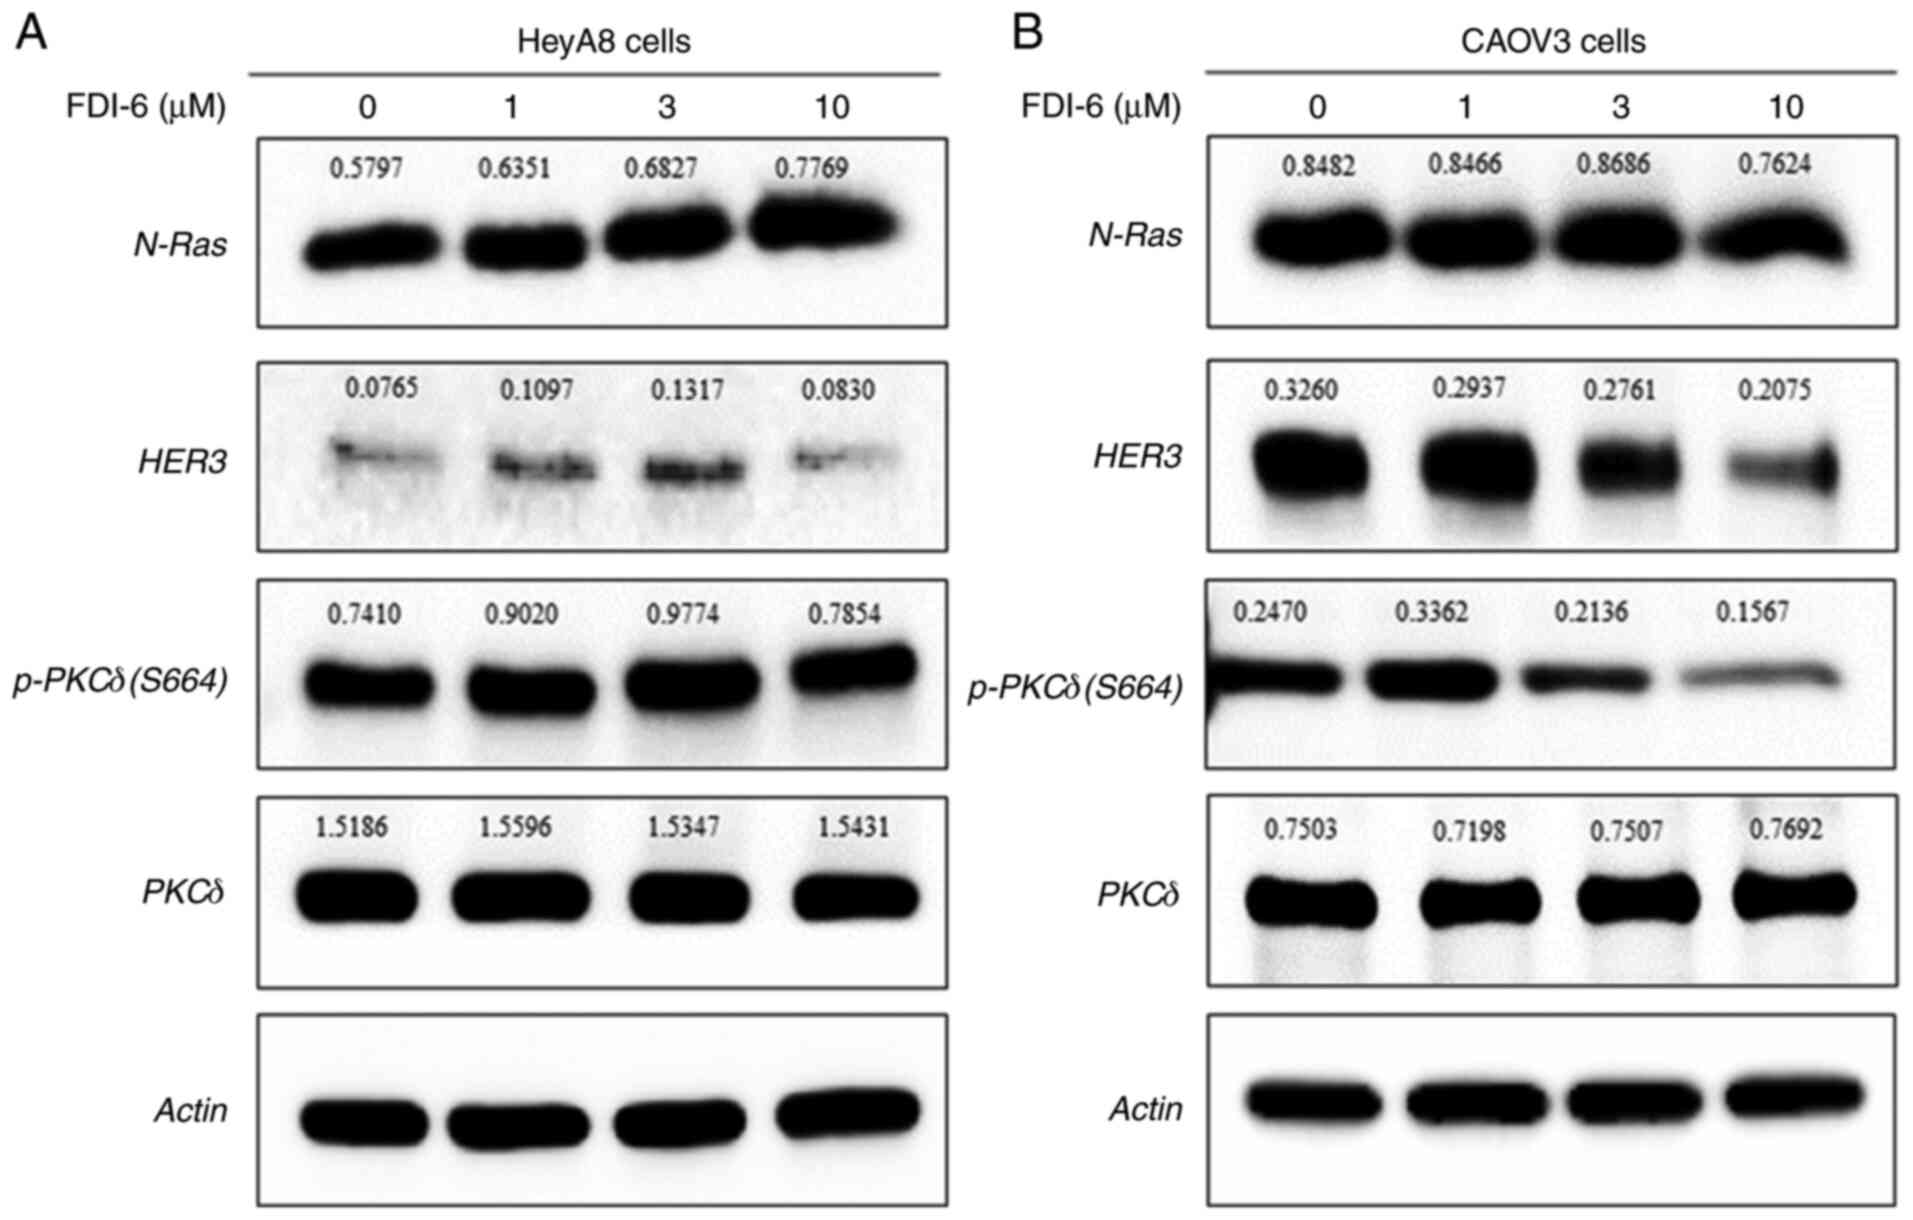
excluded (data not shown). After these processes, N-Ras, p-PKCδ
(S664) and HER3 were chosen as candidate proteins and PKCδ was
added to normalize the signals obtained using p-PKCδ (S664)
(Fig. 3).
Dual inhibition of FOXM1 and a protein
involved in the compensatory signaling pathway induced by FOXM1
inhibition
Increased N-Ras expression induced by FDI-6 in HeyA8
cells was weakened in CAOV3 cells, and p-PKCδ (S664) and HER3 even
showed decreased levels compared with HeyA8 cells (Fig. 3B). CAOV3 cells showed lower
expression of FOXM1 (Fig. 1A)
compared with HeyA8 cells and may be one of the reasons for
differences in the expression of N-Ras, p-PKCδ (S664) and HER3
between HeyA8 and CAOV3 cells. Only N-Ras in CAOV3 cells was
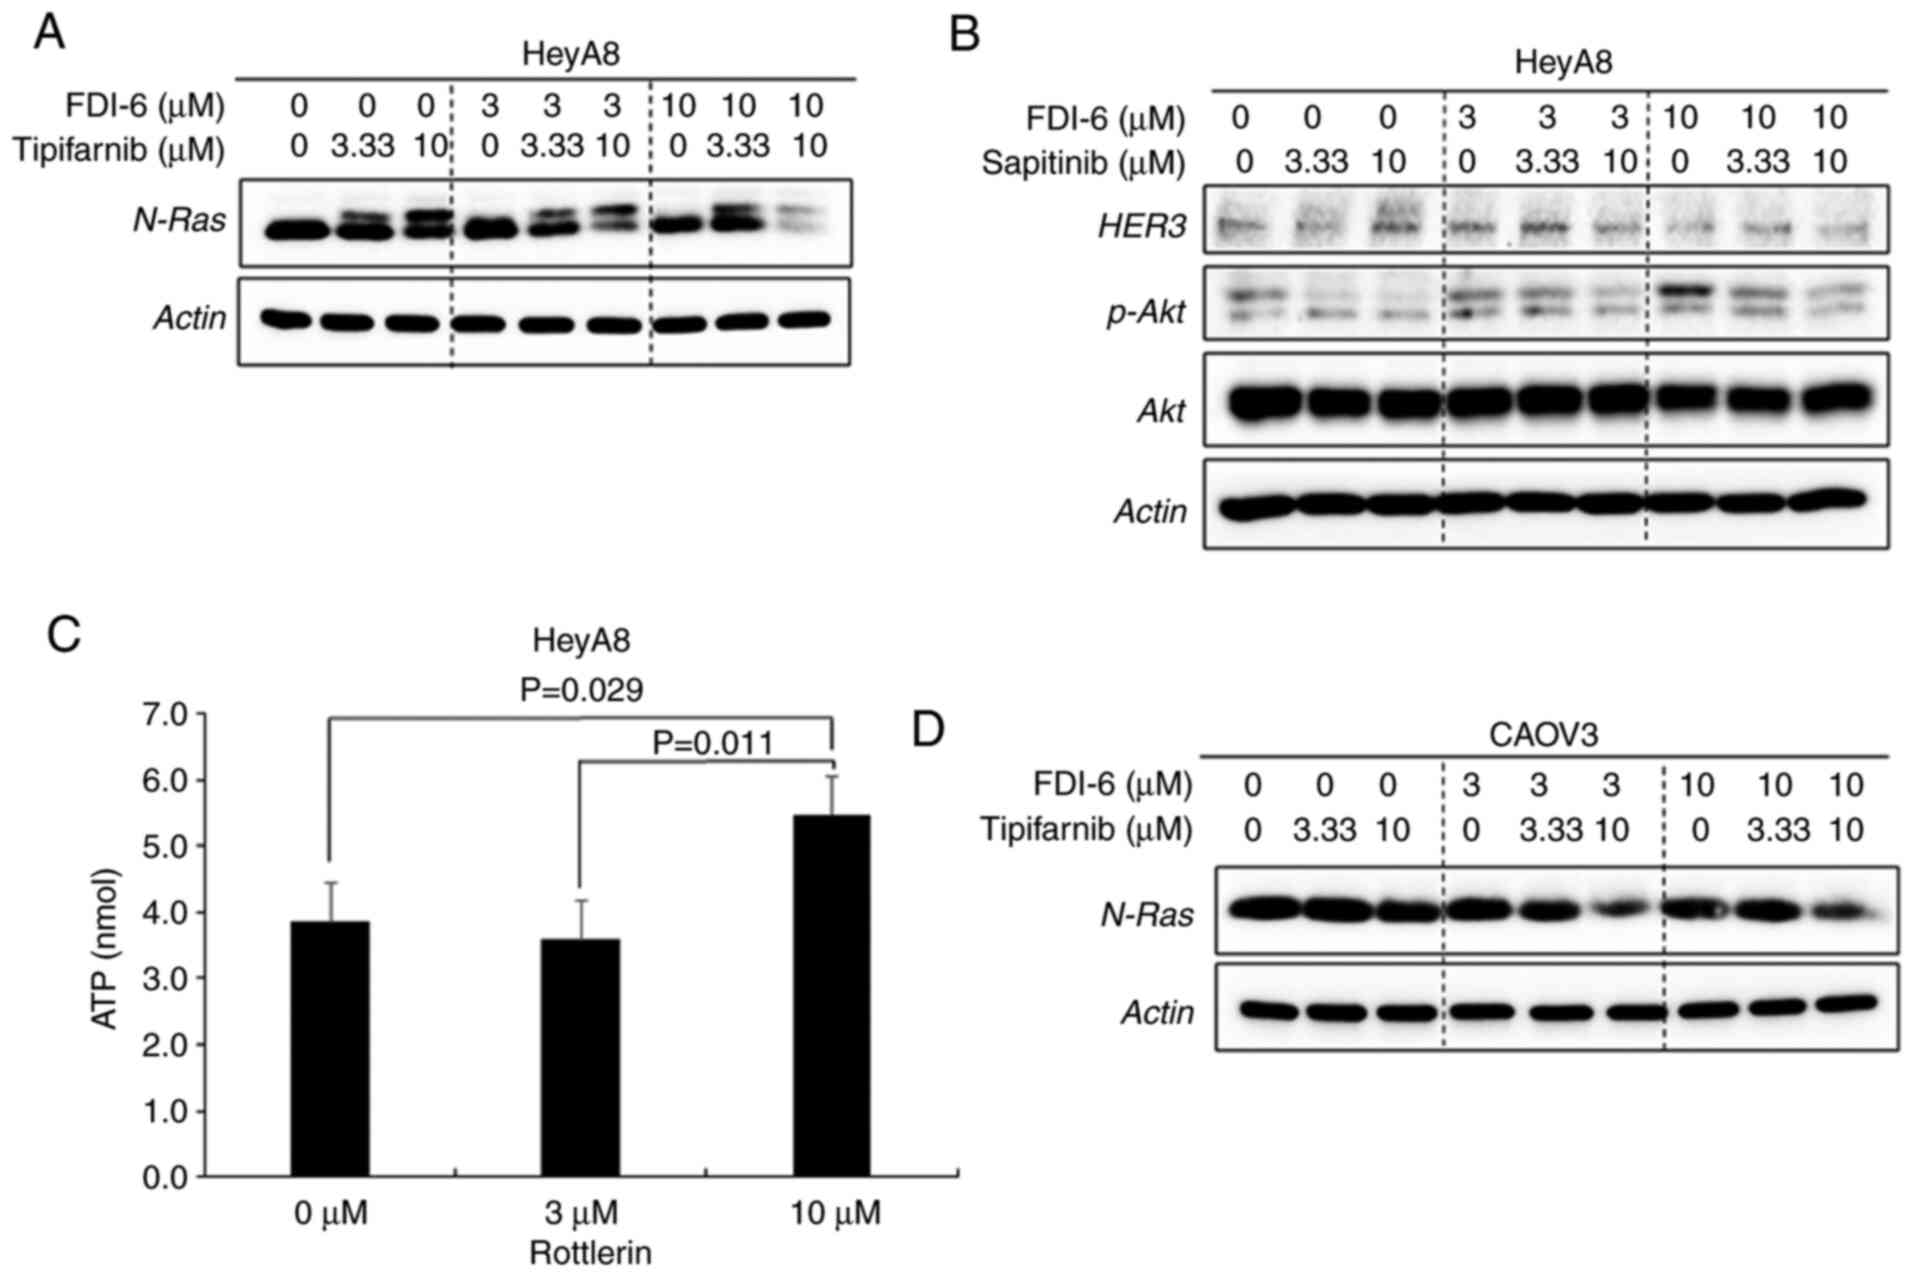
selected as a candidate protein. Tipifarnib as an N-Ras inhibitor,
rottlerin as a p-PKCδ (S664) inhibitor and sapitinib as a HER3
inhibitor at concentrations of 3.33 and 10 µM were treated in HeyA8
cells to validate their ability to inhibit N-Ras, p-PKCδ (S664) and
HER3 expression. The combination of FDI-6 with tipifarnib
attenuated the upregulation of N-Ras induced by FDI-6 in HeyA8 and
CAOV3 cells (Fig. 4A and D). The
combination of FDI-6 with sapitinib attenuated p-Akt, which is one
of the proteins associated with the HER3 downstream signaling
pathway but did not attenuate HER3 expression in HeyA8 cells
(Fig. 4B). Sapitinib suppresses
p-EGFR and its downstream pathways (16). Rottlerin downregulated p-PKCδ (S664)
by inhibiting the activity of the kinase that transfers a phosphate
group to PKCδ, and the ATP levels in HeyA8 cells was significantly
higher after inhibition of kinase activity in the rottlerin-treated
group (Fig. 4C). There were
significant reductions in the survival of HeyA8 cells by the
supplementation of tipifarnib or rottlerin to FDI-6 treatment
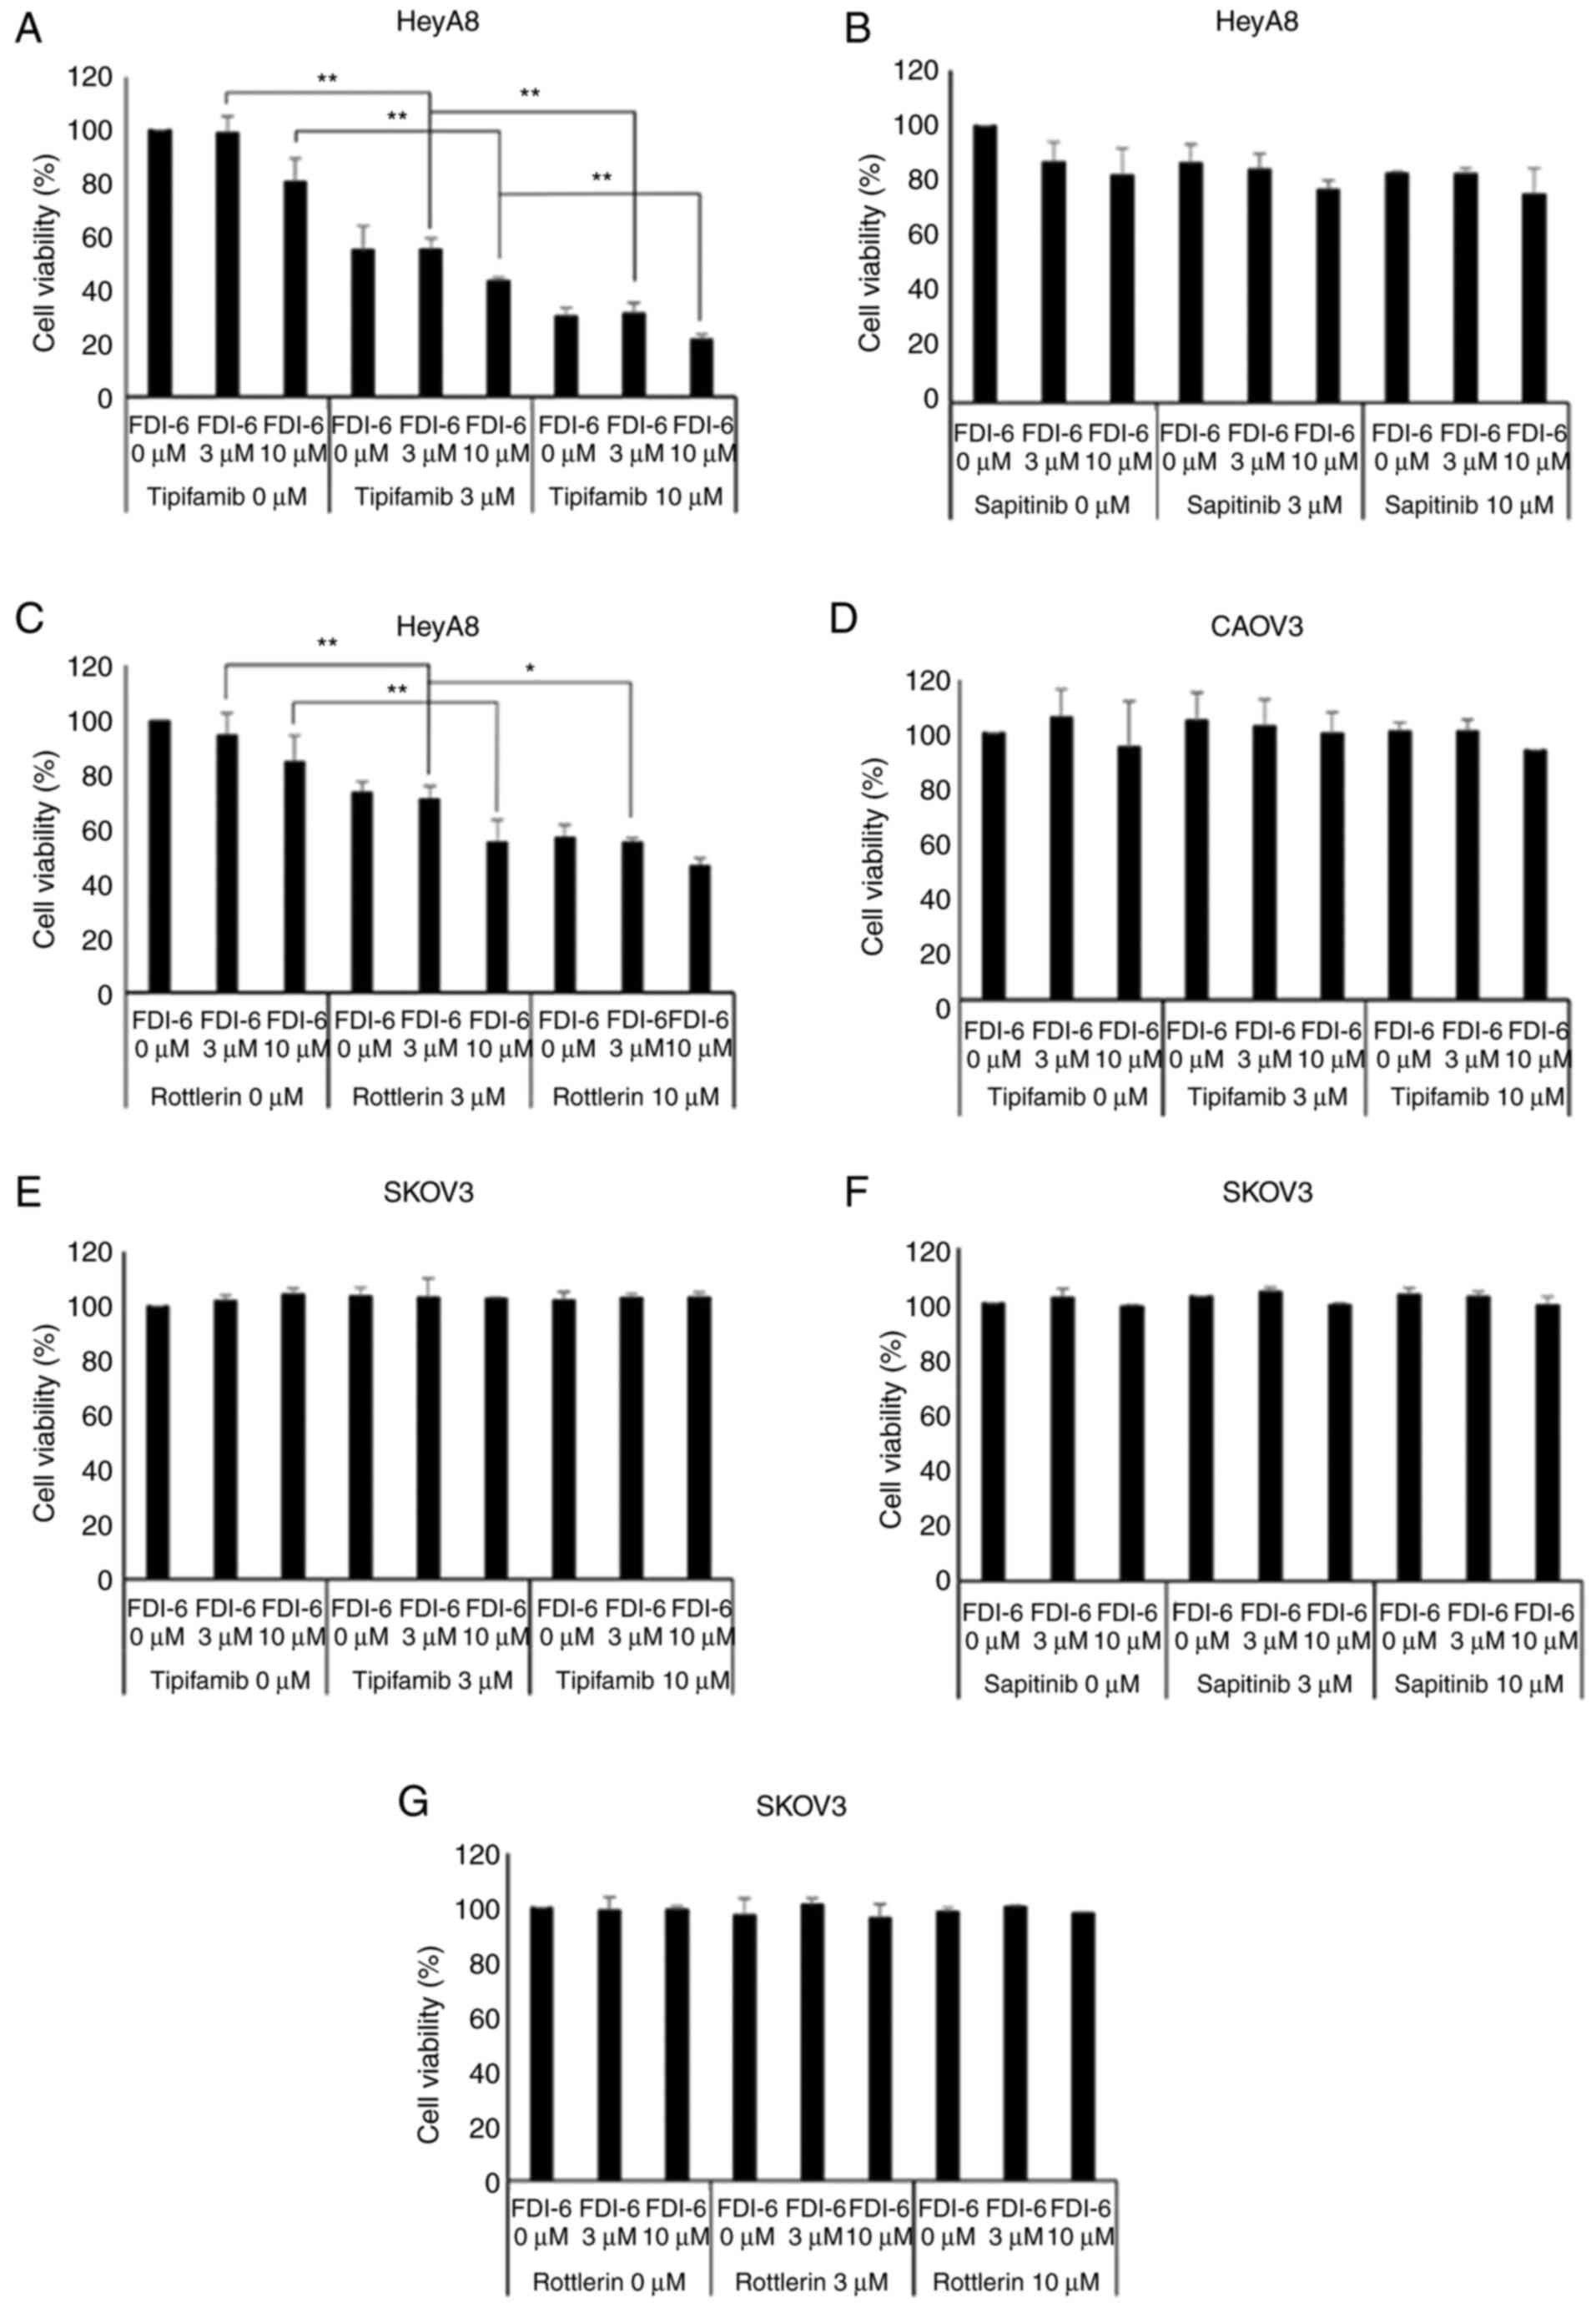
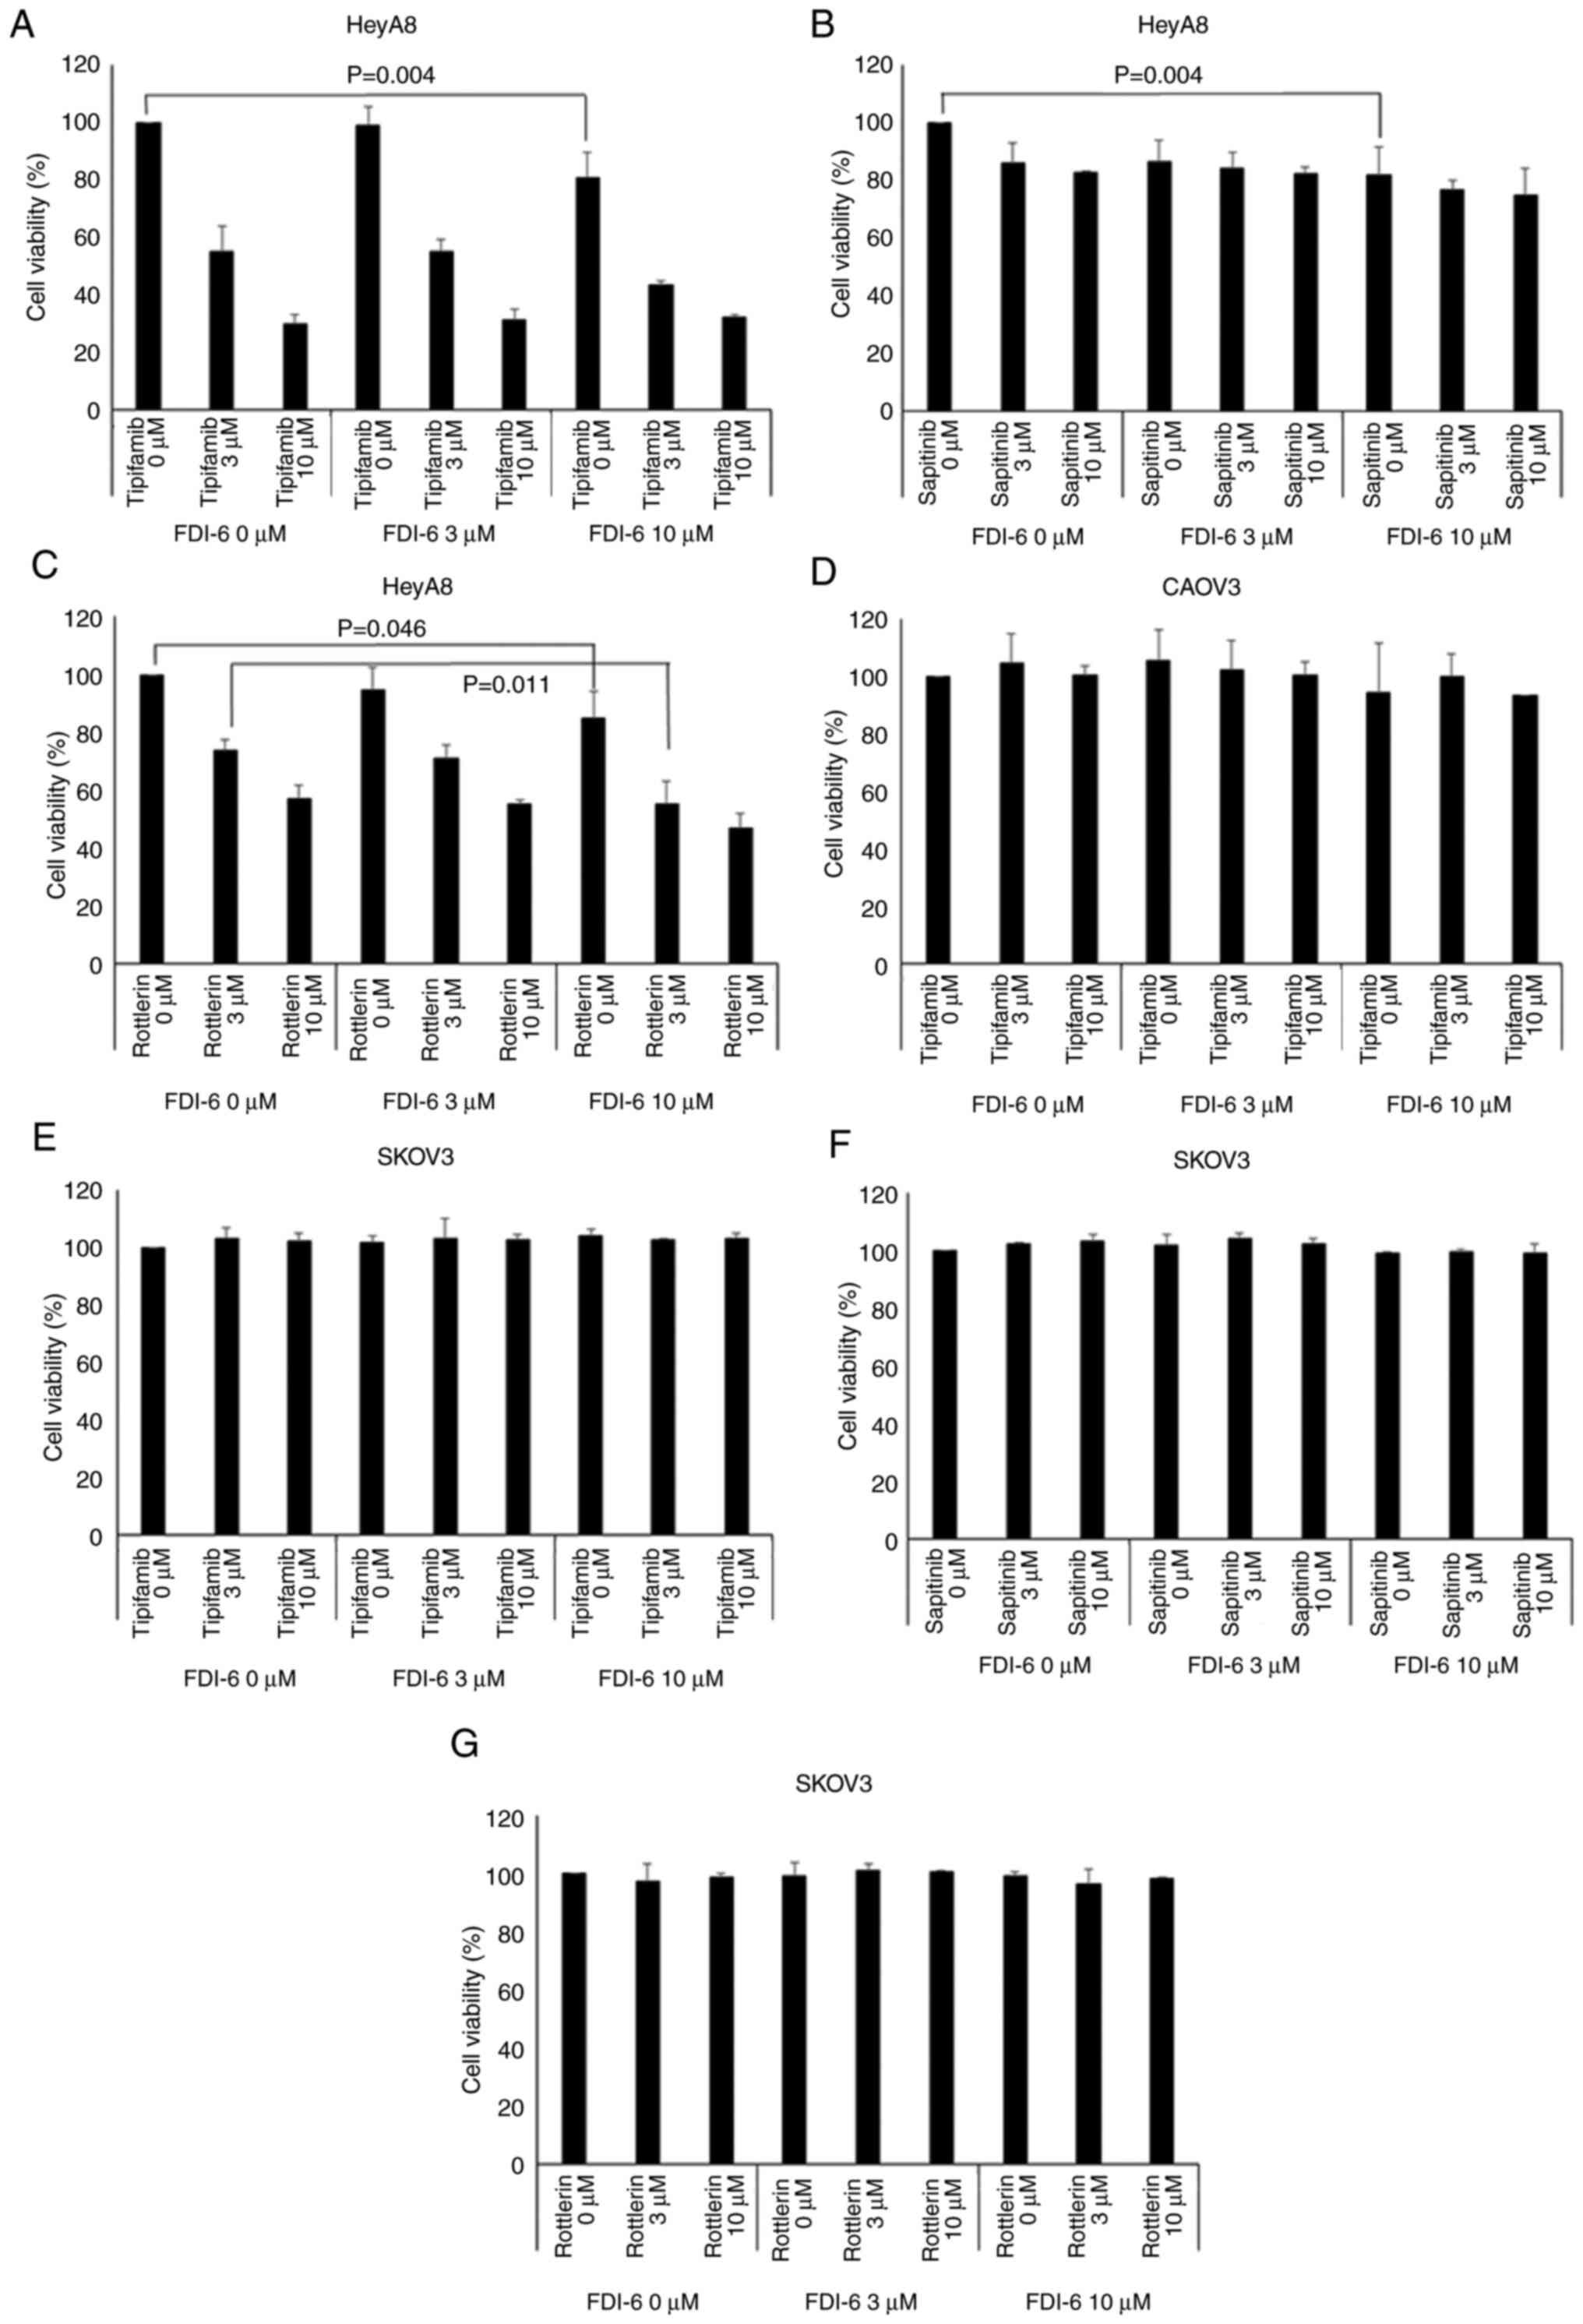
compared with a single FDI-6 treatment (Fig. 5A and C). However, the addition of
sapitinib did not show a significant reduction in cell viability of
HeyA8 cells (Fig. 5B). Unlike in
HeyA8 cells, tipifarnib did not induce significant reduction in the
cell viability of CAOV3 cells (Fig.
5D). In addition, there was no significant reduction in cell
viability in SKOV3 cells, which showed lower FOXM1 expression
(Fig. 5E-G). Fig. 6 shows that the cell viability of
ovarian cancer cells when combined with FDI-6 treatment vs.
treatment with the single agent tipifarnib, sapitinib or rottlerin.
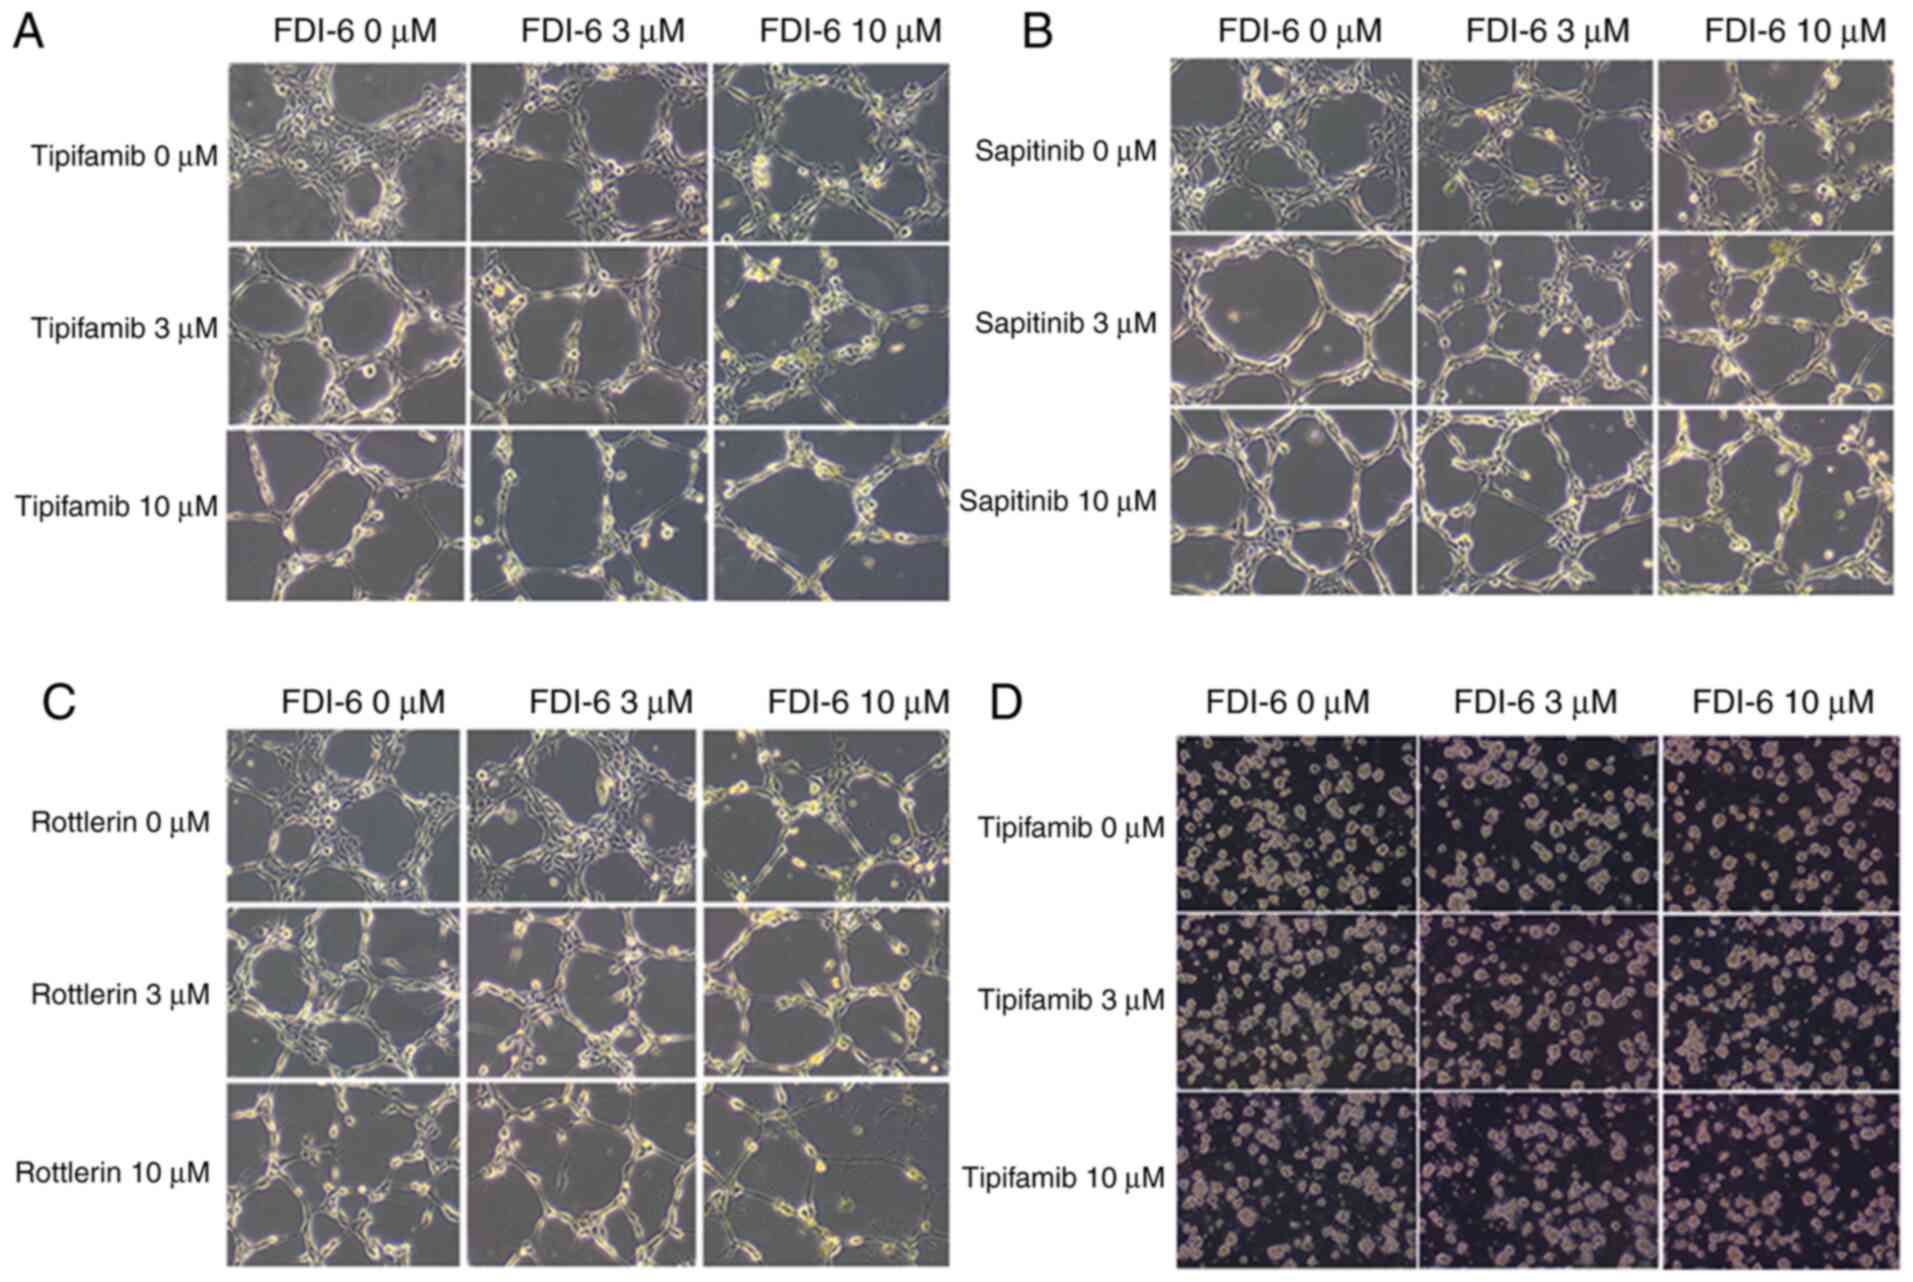
The present study also demonstrated the change in cell viability by
microscopic imaging analysis of HeyA8, CAOV3 and SKOV3 cells
(Fig. 7).
Discussion
Gormally et al (6) found that FDI-6 bound directly to FOXM1
protein and displaced it from its genomic targets in MCF-7 breast
cancer cells and induced concomitant transcriptional
downregulation. Since FDI-6 does not inhibit the synthesis of FOXM1
in cells, there is no decrease in FOXM1 expression induced by FDI-6
based on western blot analysis. However, FOXM1 levels in the
chromatin fractions decreased due to FOXM1 displacement from the
DNA by FDI-6. The present study also demonstrated that FOXM1
expression in the chromatin fractions of HeyA8 cells was decreased
by FDI-6 treatment. Inhibition of FOXM1 by FDI-6 induces inhibition
of cancer cell proliferation (6,18).
Kalinichenko and Kalin (19)
reported that FOXM1 is an important component of the KRAS/ERK
signaling pathway in respiratory epithelial cells and inhibition of
FOXM1 by FDI-6, either alone or in combination with other
anticancer drugs, could be beneficial for treatment of KRAS mutant
non-small-cell lung cancers that are resistant to conventional
chemotherapy.
The compensatory response is a mechanism by which
cancer cells can avoid drug-mediated reactions. This response can
modify the cell signaling pathway that is repressed by the targeted
drug and activates the drug resistance process despite suppression
of the oncogenic kinase (20). In
our previous study, we observed upregulation of pS6 by adaptive
signaling pathway response to paclitaxel in HeyA8 and SKOV3 ovarian
cancer cells and demonstrated that the inhibition of pS6 by
addition of BX795 or CCT128930 restricted the compensatory adaptive
response to paclitaxel and further strengthened the effectiveness
of paclitaxel (5). Turke et
al (9) showed that the
suppression of EGFR in non-small-cell lung carcinoma could lead to
increased expression of MET receptor by the compensatory response.
MET activation stimulates human epidermal growth factor 3
(ERBB3)/phosphatidylinositol 3 kinase (PI3K)/protein kinase B (AKT)
signaling in EGFR mutant lung cancers and can result in resistance
to EGFR kinase inhibitors. By inhibiting both EGFR and MET, the
resistance to EGFR kinase inhibition could be resolved.
RPPA analysis is a screening method generally used
to determine protein expression in cells. The present study
assessed the approximate expression levels of proteins in ovarian
cancer cells using RPPA analysis after FOXM1 inhibition by FDI-6.
After selection of candidate proteins, the expression pattern was
validated using western blot analysis. The protein detection
methods are different between RPPA and western blot analyses, and
thus, the results from these two analyses may be different. RPPA
analysis is an excellent screening method but accuracy is rather
insufficient than western blot analysis, and western blot analysis
is usually used as a validation method for RPPA analysis. In
contrast to the RPPA analysis, the western blot analysis showed
that HER3 and p-PKCδ (S664) expression was lower when induced by
FDI-6 at a concentration of 10 µM compared with a lower
concentration of FDI-6.
Upon inhibition of FOXM1 using FDI-6 in HeyA8 cells,
several proteins showed increased expression due to the
compensatory adaptive response. The present study selected
candidates with increased expression due to the compensatory
pathway among proteins associated with the signaling pathway and
excluded proteins for which no inhibitors, besides small
interfering RNA or short hairpin RNA, were available. The
expression of N-Ras, p-PKCδ (S664) and HER3 tended to increase
after FDI-6 treatment in HeyA8 cells; thus, these three proteins
were selected. The N-Ras gene belongs to a class of genes known as
oncogenes and encodes a protein called N-Ras, which is involved
primarily in regulating cell division, cell differentiation and
apoptosis of cells (21).
Tipifarnib interferes with posttranslational modification of Ras
and inhibits tumor cell growth. Tipifarnib is currently being
evaluated in clinical trials for chronic myelomonocytic leukemia,
acute myeloid leukemia and breast cancer alone or in combination
with chemotherapy (22–24). Although the present study showed
that the combination of tipifarnib and FDI-6 was more effective
than FDI-6 single treatment for growth restriction of HeyA8 cells,
Yam et al (24) reported
that the combination of tipifarnib and gemcitabine was not more
effective than gemcitabine monotherapy in the treatment of
metastatic breast cancer.
N-Ras and HER3 expression were increased by FDI-6
treatment at concentrations of 1 and 3 µM but was downregulated at
the higher concentration of 10 µM FDI-6. Cell viability decreased
to a greater extent in cells treated with the combination of the
N-Ras inhibitor, tipifarnib, along with 10 µM FDI-6 compared with
tipifarnib plus 1 or 3 µM FDI-6. These findings suggested that the
concentration of 10 µM FDI-6 may be toxic to these cells and may
decrease cell viability by both inhibiting cell signaling pathways
and breaking cell structures directly. Tipifarnib inhibits
farnesyltransferase, which is required to translocate N-Ras to the
cell membrane (14). Following
tipifarnib treatment, the expression of unfarnesylationed N-Ras
increased and that of farnesylated N-Ras decreased. The upper band
of N-Ras indicated unfarnesylated N-Ras. In CAOV3 cancer cells,
tipifarnib was not effective and did not cleave N-Ras into two
parts. These data suggested that the function of tipifarnib differs
between cell types (14,25).
The PKC family is a group of serine and threonine
kinases and plays a key role in the regulation of diverse cellular
functions including proliferation, differentiation and
tumorigenesis (26). Rottlerin was
identified as a specific inhibitor of the novel PKC isoform, PKCδ,
and was shown to induce antiproliferative effects and apoptosis of
human cancer cell lines (27). The
inhibitory activity of rottlerin appears to be at least partially
due to an interaction with the ATP-binding site of PKC (15). According to a manufacturer of
rottlerin, when rottlerin inhibits kinase activity, fewer ATP
molecules donate their phosphate groups. Assuming that the starting
amount of ATP is fairly similar between the cells, the ATP amount
will be higher in the rottlerin-treated group compared with the
untreated control group. In the present study, the ATP amount did
increase on increasing the concentration of rottlerin used to treat
HeyA8 cells.
HER3 is a member of the EGFR/HER family and
regulates cell division, proliferation, differentiation,
angiogenesis and tumor progression (28). HER3 impairs kinase activity and
heterodimerizes with HER2. HER3 heterodimerizes with receptor
tyrosine kinases to activate oncogenic signaling via the PI3K/AKT
pathway (17). Enhanced HER3
expression helps breast cancer cells bypass responsiveness to the
estrogen receptor antagonist tamoxifen (29,30).
In the present study, HER3 expression increased in HeyA8 cells
after treatment with FDI-6. However, the expression level was
weaker than N-Ras and p-PKCδ (S664) expression based on western
blot analysis and the combination of sapitinib and FDI-6 was not
significantly more effective compared with FDI-6 single treatment
for growth restriction of HeyA8 cells.
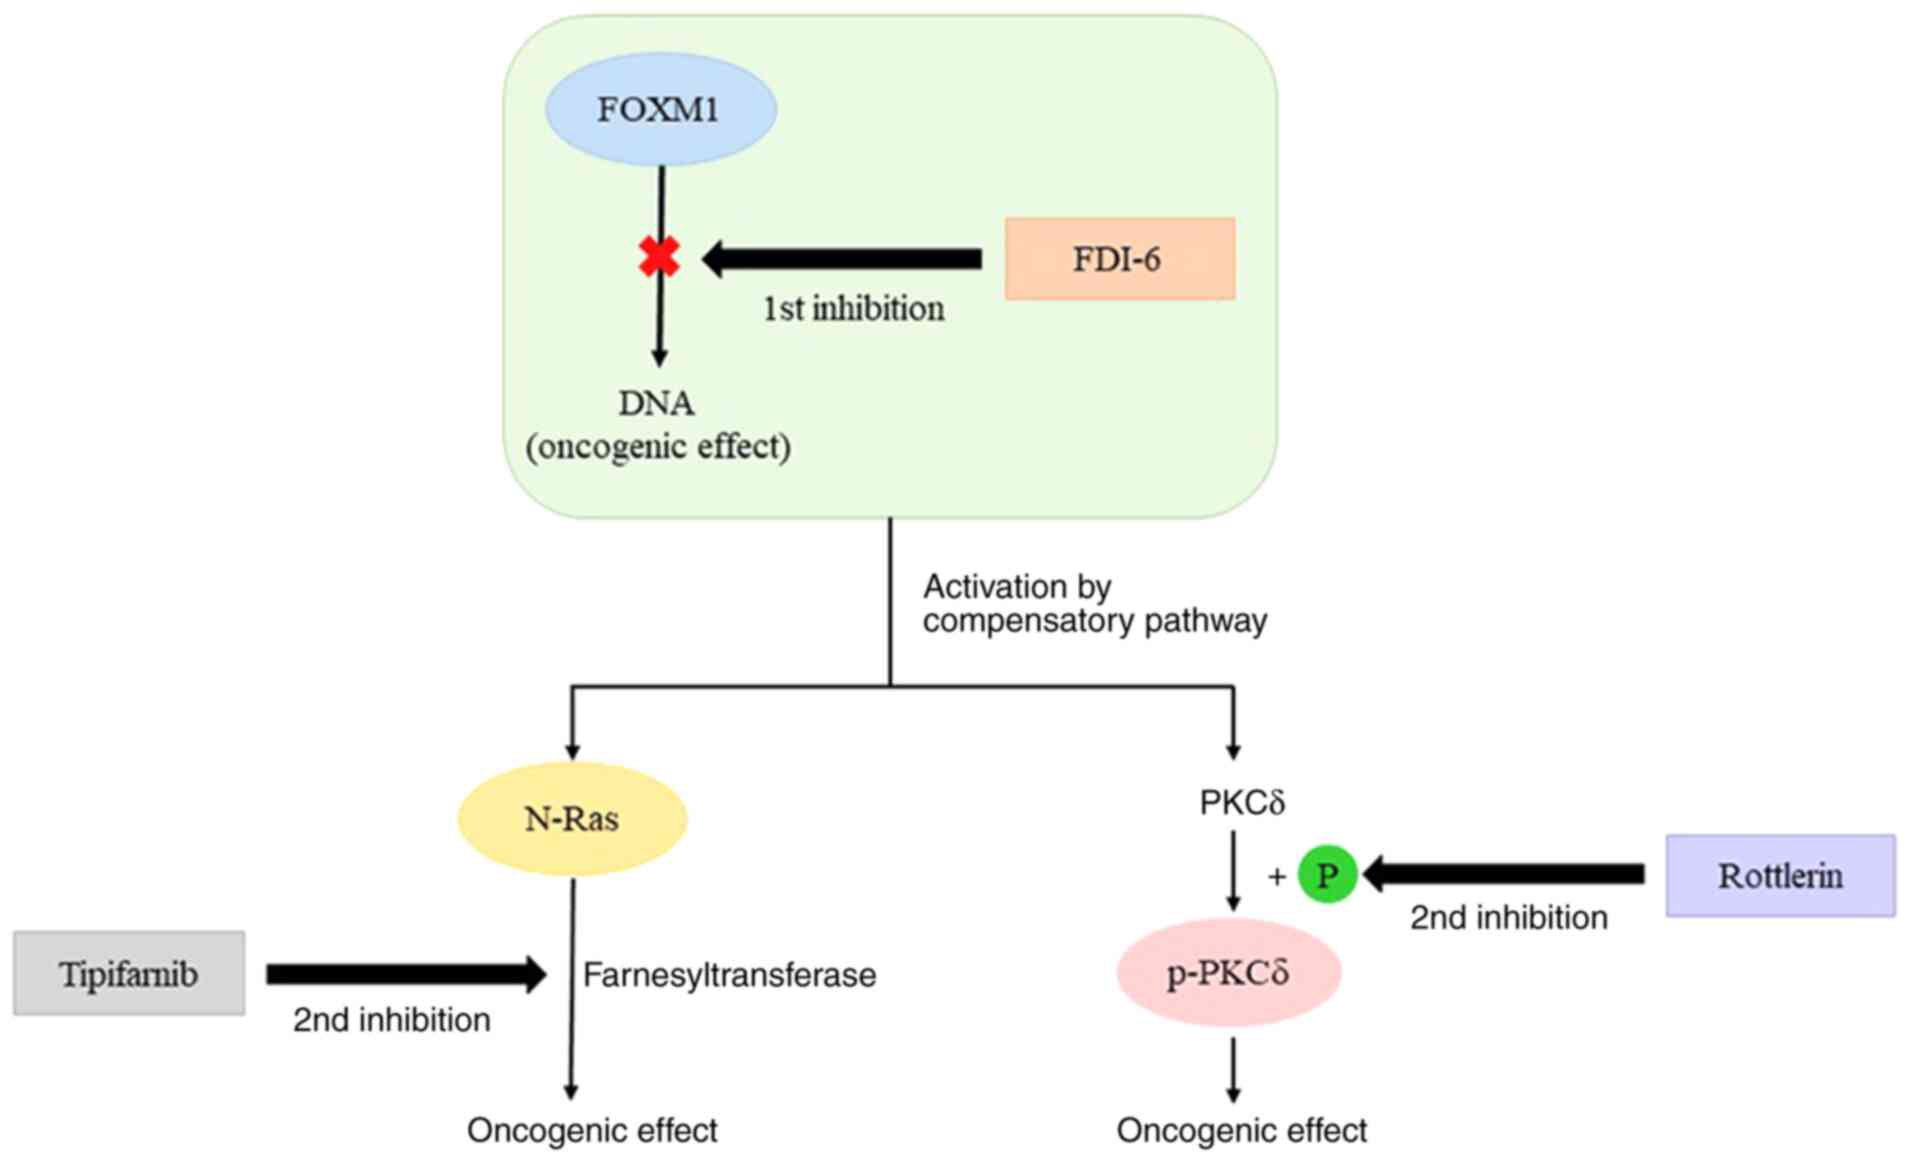
Upon inhibition of FOXM1 using FDI-6 in HeyA8 cells,
N-Ras, p-PKCδ (S664) and HER3 showed increased expression by the
compensatory adaptive response. Simultaneous inhibition of FOXM1
and the compensatory adaptive response via the combination of
tipifarnib or rottlerin and FDI-6 was significantly more effective
than FOXM1 single inhibition for growth restriction of HeyA8 cells
(Fig. 8). However, the combination
of FDI-6 and sapitinib did not induce a significant decrease in
cell viability of HeyA8 cells, which showed a weak increase in HER3
expression by FOXM1 inhibition. Unlike in HeyA8 cells, FOXM1
inhibition using FDI-6 did not induce an increase in the expression
of p-PKCδ (S664) and HER3, and compared with FDI-6 single
treatment, the combination of tipifarnib and FDI-6 did not show a
significant reduction in cell viability of CAOV3 cells, in which
FOXM1 expression was weaker compared with in HeyA8 cells.
Furthermore, in SKOV3 cells, which showed weak FOXM1 expression,
the combination of FDI-6 and tipifarnib, rottlerin, or sapitinib
did not induce a significant decrease in cell viability.
The present study found that dual inhibition of
FOXM1 and the compensatory adaptive response induced by FOXM1
inhibition increased the efficacy for growth restriction of ovarian
cancer cells. These findings will aid in overcoming drug
resistance, which is one of the issues in ovarian cancer therapy.
However, further data via animal studies is needed to determine
further clinical implications.
However, due to insufficient space and facilities,
our laboratory were unable to use RNA interference or CRISPR on
other living organisms, which is a limitation of the present
study.
Acknowledgements
We wish to acknowledge Dr Gordon Mills, who moved to
Oregon Health and Science University from MD Anderson Cancer
Center, for helping with the reverse-phase protein array. We also
thank Dr Yun Yong Park (Asan Medical Center, Republic of Korea) for
helping design the experiments.
Funding
We wish to acknowledge the financial support of the
Institute of Clinical Medicine Research of Bucheon St. Mary's
Hospital Research Fund (grant no. BCMC18AH09).
Availability of data and materials
The datasets used and/or analyzed during the current
study are available from the corresponding author on reasonable
request.
Authors' contributions
DL evaluated and analyzed the data and performed the
experiments. WL and MK performed the experiments and statistical
analysis. HNL conceived and designed the experiments, analyzed the
data and wrote the manuscript. All authors read and approved the
final manuscript.
Ethics approval and consent to
participate
This study was approved by the Institutional Review
Board of the Catholic University of Korea, Bucheon, Korea (approval
no. HC18EESI0095).
Patient consent for publication
Not applicable.
Competing interests
The authors declare that they have no competing
interests.
References
|
1
|
Lheureux S, Gourley C, Vergote I and Oza
AM: Epithelial ovarian cancer. Lancet. 393:1240–1253. 2019.
View Article : Google Scholar
|
|
2
|
Ferlay J, Soerjomataram I, Dikshit R, Eser
S, Mathers C, Rebelo M, Parkin DM, Forman D and Bray F: Cancer
incidence and mortality worldwide: Sources, methods and major
patterns in GLOBOCAN 2012. Int J Cancer. 136:E359–E386. 2015.
View Article : Google Scholar
|
|
3
|
Berek JS: Ovarian, fallopian tube and
peritoneal cancer. Berek and Novak's Gynecology. 15th edition.
Berek JS, Longacre TA and Friedlander M: Wolters Kluwer/Lippincott
Williams & Wilkins; Philadelphia, PA: pp. 1350–1427. 2011
|
|
4
|
Cancer Genome Atlas Research Network.
Integrated genomic analyses of ovarian carcinoma. Nature.
474:609–615. 2011. View Article : Google Scholar
|
|
5
|
Choi JI, Park SH, Lee HJ, Lee DW and Lee
HN: Inhibition of phospho-S6 kinase, a protein involved in the
compensatory adaptive response, increases the efficacy of
paclitaxel in reducing the viability of matrix-attached ovarian
cancer cells. PLoS One. 11:e01550522016. View Article : Google Scholar
|
|
6
|
Gormally MV, Dexheimer TS, Marsico G,
Sanders DA, Lowe C, Matak-Vinković D, Michael S, Jadhav A, Rai G,
Maloney DJ, et al: Suppression of the FOXM1 transcriptional
programme via novel small molecule inhibition. Nat Commun.
5:51652014. View Article : Google Scholar
|
|
7
|
Koo CY, Muir KW and Lam EWF: FOXM1: From
cancer initiation to progression and treatment. Biochim Biophys
Acta. 1819:28–37. 2012. View Article : Google Scholar
|
|
8
|
Chan DW, Hui WW, Cai PC, Liu MX, Yung MM,
Mak CS, Leung TH, Chan KK and Ngan HY: Targeting GRB7/ERK/FOXM1
signaling pathway impairs aggressiveness of ovarian cancer cells.
PLoS One. 7:e525782012. View Article : Google Scholar
|
|
9
|
Turke AB, Zejnullahu K, Wu YL, Song Y,
Dias-Santagata D, Lifshits E, Toschi L, Rogers A, Mok T, Sequist L,
et al: Preexistence and clonal selection of MET amplification in
EGFR mutant NSCLC. Cancer Cell. 17:77–88. 2010. View Article : Google Scholar
|
|
10
|
Debnath J and Brugge JS: Modelling
glandular epithelial cancers in three-dimensional cultures. Nat Rev
Cancer. 5:675–688. 2005. View
Article : Google Scholar
|
|
11
|
Weigelt B and Bissell MJ: Unraveling the
microenvironmental influences on the normal mammary gland and
breast cancer. Semin Cancer Biol. 18:311–321. 2008. View Article : Google Scholar
|
|
12
|
Yamada KM and Cukierman E: Modeling tissue
morphogenesis and cancer in 3D. Cell. 130:601–610. 2007. View Article : Google Scholar
|
|
13
|
Buick RN, Pullano R and Trent JM:
Comparative properties of five human ovarian adenocarcinoma cell
lines. Cancer Res. 45:3668–3676. 1985.
|
|
14
|
Appels NM, Beijnen JH and Schellens JH:
Development of farnesyl transferase inhibitors: A review.
Oncologist. 10:565–578. 2005. View Article : Google Scholar
|
|
15
|
Gschwendt M, Müller HJ, Kielbassa K, Zang
R, Kittstein W, Rincke G and Marks F: Rottlerin, a novel protein
kinase inhibitor. Biochem Biophys Res Commun. 199:93–98. 1994.
View Article : Google Scholar
|
|
16
|
Scheipl S, Barnard M, Cottone L, Jorgensen
M, Drewry DH, Zuercher WJ, Turlais F, Ye H, Leite AP, Smith JA, et
al: EGFR inhibitors identified as a potential treatment for
chordoma in a focused compound screen. J Pathol. 239:320–334. 2016.
View Article : Google Scholar
|
|
17
|
Mishra R, Patel H, Alanazi S, Yuan L and
Garrett JT: HER3 signaling and targeted therapy in cancer. Oncol
Rev. 12:3552018.
|
|
18
|
Tabatabaei-Dakhili SA, Aguayo-Ortiz R,
Domínguez L and Velázquez-Martínez CA: Untying the knot of
transcription factor druggability: Molecular modeling study of
FOXM1 inhibitors. J Mol Graph Model. 80:197–210. 2018. View Article : Google Scholar
|
|
19
|
Kalinichenko VV and Kalin TV: Is there
potential to target FOXM1 for ‘undruggable’ lung cancers? Expert
Opin Ther Targets. 19:865–867. 2015. View Article : Google Scholar
|
|
20
|
Trusolino L and Bertotti A: Compensatory
pathways in oncogenic kinase signaling and resistance to targeted
therapies: Six degrees of separation. Cancer Discov. 2:876–880.
2012. View Article : Google Scholar
|
|
21
|
Uprety D and Adjei AA: KRAS: From
undruggable to a druggable cancer target. Cancer Treat Rev.
89:1020702020. View Article : Google Scholar
|
|
22
|
Elmariah H and DeZern AE: Chronic
myelomonocytic leukemia: 2018 update to prognosis and treatment.
Curr Hematol Malig Rep. 14:154–163. 2019. View Article : Google Scholar
|
|
23
|
Erba HP, Othus M, Walter RB, Kirschbaum
MH, Tallman MS, Larson RA, Slovak ML, Kopecky KJ, Gundacker HM and
Appelbaum FR: Four different regimens of farnesyltransferase
inhibitor tipifarnib in older, untreated acute myeloid leukemia
patients: North American Intergroup Phase II study SWOG S0432. Leuk
Res. 38:329–333. 2014. View Article : Google Scholar
|
|
24
|
Yam C, Murthy RK, Valero V, Szklaruk J,
Shroff GS, Stalzer CJ, Buzdar AU, Murray JL, Yang W, Hortobagyi GN,
et al: A phase II study of tipifarnib and gemcitabine in metastatic
breast cancer. Invest New Drugs. 36:299–306. 2018. View Article : Google Scholar
|
|
25
|
Vasan N, Boyer JL and Herbst RS: A RAS
renaissance: Emerging targeted therapies for KRAS-mutated non-small
cell lung cancer. Clin Cancer Res. 20:3921–30. 2014. View Article : Google Scholar
|
|
26
|
Giorgi C, Agnoletto C, Baldini C, Bononi
A, Bonora M, Marchi S, Missiroli S, Patergnani S, Poletti F,
Rimessi A, et al: Redox control of protein kinase C: Cell- and
disease-specific aspects. Antioxid Redox Signal. 13:1051–1085.
2010. View Article : Google Scholar
|
|
27
|
Soltoff SP: Rottlerin: An inappropriate
and ineffective inhibitor of PKCdelta. Trends Pharmacol Sci.
28:453–458. 2007. View Article : Google Scholar
|
|
28
|
Hynes NE and MacDonald G: ErbB receptors
and signaling pathways in cancer. Curr Opin Cell Biol. 21:177–184.
2009. View Article : Google Scholar
|
|
29
|
Newby JC, Johnston SR, Smith IE and
Dowsett M: Expression of epidermal growth factor receptor and
c-erbB2 during the development of tamoxifen resistance in human
breast cancer. Clin Cancer Res. 3:1643–1651. 1997.
|
|
30
|
Shou J, Massarweh S, Osborne CK, Wakeling
AE, Ali S, Weiss H and Schiff R: Mechanisms of tamoxifen
resistance: Increased estrogen receptor-HER2/neu cross-talk in
ER/HER2-positive breast cancer. J Natl Cancer Inst. 96:926–935.
2004. View Article : Google Scholar
|