Introduction
Epithelial ovarian cancer (EOC) is one of the most
prevalent and fatal malignant diseases of the female genital tract,
with an estimated 21,410 new cases and 13,770 cancer-related deaths
in the US in 2021 (1,2). Debulking surgery followed by
platinum-based adjuvant chemotherapy is the mainstay of EOC
management with an effective response rate of >90% in patients
with EOC. However, the 5-year survival rate of patients with EOC
remains low at ~40% and only a modest improvement has been achieved
in the past decade. Of note, the introduction of anticancer
therapeutic agents, including antiangiogenic drugs and
polyadenosine diphosphate-ribose polymerase inhibitors, has led to
a significant improvement in disease-free survival (DFS) for EOC,
as demonstrated in the randomized phase III AURELIA
(ENGOT-ov3/AGO-OVAR2.15) trial (3–7). The
unfavorable prognosis of EOC is attributed to the lack of effective
clinical screening methods in the early stages of the disease,
resulting in diagnosis at advanced stages with most patients
ultimately acquiring resistance to platinum-based chemotherapy
(8). Thus, identifying new
biomarkers and therapeutic targets is crucial to effectively
diagnose, treat, and predict the progress and outcome of EOC,
including the response to chemotherapy.
A sophisticated web of cellular signaling channels
is necessary for cells to detect and react to intrinsic, external
inputs to keep homeostasis. However, when these pathways are
changed, an impact exists on a variety of cellular functions
eventually disrupting homeostasis and encouraging carcinogenesis
and cancer growth. Ion exchangers, such as the vacuolar-type
proton-translocating ATPase (H+-ATPases), have a
critical role in controlling organelle pH and preserving pH
equilibrium among the complex dynamic processes that regulate
homeostasis (9–12). Various studies have explored the
disruption of H+-ATPases, which promote cancer development,
advancement and resistance to chemotherapy by causing extracellular
acidosis in specific tissues (13–16).
It has been indicated that the presence of V-ATPase on the surface
of tumor cells encourages vesicular trafficking and activation of
proteases, which in turn contributes to malignancy (17). New strategies to selectively inhibit
V-ATPase are being explored to suppress tumor growth and invasion
in various types of solid carcinoma, such as colorectal cancer,
breast cancer and renal cell carcinoma (18–21).
V-ATPases are multisubunit transmembrane protein
transporters composed of 13 subunits organized into two major
domains, V1 and V0 (22,23).
Among the two major domains, V1, also called ATPase H+
transporting V1 (ATP6V1), is composed of subunits A-H. Of these,
the A and B subunits form a hexametric barrel and are directly
responsible for ATP hydrolysis (23–25).
Numerous investigations have revealed that ATP6V is crucial for the
development of several disorders, including diabetes, kidney
disease, cancer and improper bone growth (11,13,26).
However, the connection between ATP6V1 and EOC has remained to be
explored. Furthermore, the expression patterns of ATP6V1 isoforms
in EOC remain incompletely understood.
The present study aimed to examine the expression
patterns of the ATP6V1 isoforms and demonstrate the clinical
significance of ATP6V1 subunit B1 (ATP6V1B1) in serous ovarian
cancer cell lines using data from RNA sequencing (RNA-seq) and
public databases. Furthermore, the clinicopathological
characteristics, including anticancer drug resistance and
prognostic value of ATP6V1B1 in EOC, were analyzed.
Materials and methods
Patients and tumor specimens
A total of 213 EOCs, 60 borderline tumors, 109
benign tumors and 80 nonadjacent normal epithelial tissues were
obtained from patients who underwent primary cytoreductive surgery
at the Gangnam Severance Hospital (Seoul, Korea) between 1996 and
2012 and the Korean Gynecologic Cancer Bank as part of the Bio and
Medical Technology Development Program of the Ministry of the
National Research Foundation of Korea. Written informed consent
from each patient was obtained after providing a detailed
explanation of the study procedures and approval was obtained from
the Regional Institutional Review Board (IRB) of the Gangnam
Severance Hospital (IRB no. 3-2020-0377). For this study, patients
with EOC who had undergone maximal debulking surgery and were
treated with carboplatin and paclitaxel chemotherapy were included.
Patients who had previously received neoadjuvant chemotherapy were
excluded. The inclusion criteria were based on the availability of
histologically confirmed tumor stage and grade according to the
International Federation of Gynecology and Obstetrics (FIGO) and
World Health Organization grading systems, respectively. Clinical
information, such as age, disease-free survival (DFS), overall
survival (OS), survival status, tumor grade, cell type and response
to chemotherapy, was retrieved from patients' medical records. The
response to chemotherapy was assessed using the Response Evaluation
Criteria in Solid Tumors (version 1.1) (27).
Public database
The Gene Expression Profiling Interactive Analysis
(GEPIA) database (http://gepia.cancer-pku.cn) was used to assess the
mRNA expression levels of ATP6V1 subunits A, B1 and B2 (28). Three publicly available datasets
[i.e., GSE6008 (29), GSE14407
(30) and GSE36668 (31)] that analyzed DEGs between normal
ovarian epithelial tissues and high-grade serous ovarian cancer
(HGSOC) samples were downloaded from the gene expression omnibus
(GEO) database (https://www.ncbinlm.nih.gov/geo/) to validate the
RNA-seq data generated in the present study. The expression levels
of ATP6V1B1 in platinum-sensitive and -resistant EOC tissues were
assessed using the GSE15622 dataset (32). The GEO dataset was searched using
the following keywords: ‘Homo sapiens’, ‘epithelial ovarian cancer’
and ‘normal ovarian epithelium’, ‘platinum sensitive’ and ‘platinum
resistance’. In addition, only publications with available raw
microarray gene expression data, clinical treatment and response
information and only two microarray platforms, GPL96 (HG-U133A) and
GPL570 (HG-U133 Plus 2.0; Affymetrix; Thermo Fisher Scientific,
Inc.), were included.
Laser-capture microdissection, RNA
extraction and quality control
The desired lesions from the tissues were
microdissected using an AS LMD laser microdissection system (Leica
Microsystems, Inc.) according to the manufacturer's instructions
after all formalin-fixed paraffin-embedded (FFPE) tissue slides
stained with hematoxylin and eosin were reviewed by an experienced
gynecological pathologist. Sectioned FFPE tissues were placed on a
polyethylene terephthalate membrane (Leica Microsystems, Inc.) and
total RNA was extracted using TRIzol reagent (Invitrogen; Thermo
Fisher Scientific, Inc.). RNA was quantified using a NanoDrop-2000
spectrophotometer (Thermo Fisher Scientific, Inc.). The quality of
the extracted RNA was measured using an Agilent 2100 bioanalyzer
equipped with an RNA 6,000 Nano Chip (Agilent Technologies,
Inc.).
Library preparation, RNA sequencing
read mapping and gene expression analysis
Library construction was performed using the
QuantSeq 3′ mRNA-Seq Library Prep Kit (Lexogen GmbH) according to
the manufacturer's instructions for control and test RNAs. In
brief, 500 ng of total RNA was prepared for the control and
experimental RNAs. RNA was hybridized with an oligo-dT primer using
First Standard cDNA Synthesis Mix included in the QuantSeq 3′
mRNA-Seq Library Prep Kit (Lexogen GmbH), including an
Illumina-compatible sequence at its 5′ end. Reverse transcription
(RT) was performed and after the RNA template was degraded using
RNA Removal Solution in the Kit (Lexogen GmbH), a random primer
with an Illumina-compatible linker sequence at its 5′ end was used
for second-strand synthesis using Second Strand Synthesis Mix
contained in the kit (Lexogen GmbH). The double-stranded library
was purified using the Purification Module with Magnetic Beads
included in the kit (Lexogen GmbH). Complete adapter sequences
using the Lexogen i7 6 nt Index set (Lexogen GmbH) were added to
this library to perform cluster generation and PCR components were
removed from the final library using the Purification Module with
Magnetic Beads included in the kit (Lexogen GmbH). NextSeq 500
(Illumina, Inc.) was used for single-end 75 base pair
high-throughput sequencing. The FASTQ raw data for nine independent
libraries were obtained through sequencing: Two were normal
epithelial tissues and seven were EOC tissues. Among the seven EOC
tissues, four were platinum-sensitive and three were
platinum-resistant. All FASTQ reads were trimmed for quality
control and adapters were trimmed using Bbduk (BBMap v36.59)
(33) and FASTQC (v0.11.7)
(34) for sequencing data. Read
mapping was performed through the STAR-HTSeq workflow, i.e., STAR
(v2.7.3a) (35) and HTSeq-count
(v0.12.4) (36), where the
reference genome (GRCh38) and annotation were aligned with the
sequencing reads. Normalization and differential expression
analyses on gene expression levels were performed using the DESeq2
v1.26.0 R package (37), where a
normalization method was applied as a variance-stabilizing
transformation after performing read counts. Differentially
expressed genes (DEGs) were obtained based on the two following
criteria: i) Adjusted P-value (i.e., Benjamini and Hochberg method)
<0.05; and ii) absolute log2 (fold change) >2.
Tissue microarray (TMA) and
immunohistochemistry
A TMA was constructed with tissue cores of 1.0 mm in
diameter containing a sufficient proportion of tumor cells punched
from the donor FFPE tissues or tissue blocks using a tissue array
(Beecher Instruments, Inc.), and TMA blocks were sliced to 5-µm
thickness using a rotary microtome. The TMA sections were
deparaffinized with xylene after sectioning and rehydrated in
serially graded ethanol to distilled water. Antigen retrieval for
antiATP6V1B1 (rabbit polyclonal antibody; cat. no. HPA031847;
1:150; Sigma-Aldrich; Merck KGaA) was performed by incubating TMA
sections in a steam pressure cooker (Pascal; Dako; Agilent
Technologies, Inc.) containing heat-activated antigen retrieval
buffer (Dako; Agilent Technologies, Inc.) at pH 6.0 antigen
retrieval buffer (Dako; Agilent Technologies, Inc), at 125°C for 2
min is a Pascal pressure cooker (Dako; Agilent Technologies, Inc.)
at 20–23 psi. The sections were then treated with a 3%
H2O2 solution in methanol for 10 min at room
temperature to block the remaining endogenous peroxidase activity.
The slides were stained with an ATP6V1B1 antibody for 30 min at
room temperature after rinsing. Subsequently, the antigen-antibody
reactions were visualized using Envision+ Dual Link
System-HRP (Dako; Agilent Technologies, Inc.) and DAB+
(3,3′-diaminobenzidine; Dako; Agilent Technologies, Inc.) for 10
min at room temperature. The stained sections were counterstained
with hematoxylin after dehydration. Slides were then mounted with
Faramount aqueous mounting medium (Dako; Agilent Technologies,
Inc.). Negative control immunoglobulin G (IgG) was used in place
for primary antibody to evaluate nonspecific staining and the TMA
included appropriate positive control specimens.
Evaluation of immunohistochemistry
staining
Microscopy images of the stained TMA sections
(NanoZoomer 2.0 HT; Hamamatsu Photonics K.K.) at 20× objective
magnification (0.5-µm resolution) were captured using
high-resolution optical imaging. The scanned sections were analyzed
using Visiopharm software, version 6.5.0.2303 (Visiopharm A/S). The
intensity of the brown staining was rated on a scale of 0 to 3 (0,
negative; 1, weak; 2, moderate; and 3, strong) and the percentage
of cytoplasm-stained tumor cells (range, 0–100) was obtained using
a predefined optimized algorithm. The total histoscore was
determined by multiplying the percentage of positively stained
cells by the intensity score (score range, 0–300).
Cell culture
The human ovarian cancer cell line A2780 was
purchased from the European Collection of Cell Cultures. OVCA429
and OVCA433 cells were obtained from the Saint Vincent Hospital,
The Catholic University of Korea, Suwon, Korea (38,39).
OVCAR3, SKOV3 and TOV112D cells were purchased from the American
Type Culture Collection. Ovarian cancer cells were cultured in
Dulbecco's modified Eagle's medium (DMEM) supplemented with 10%
fetal bovine serum (FBS) and 1% penicillin/streptomycin. Three
previously established immortalized HOSE cell lines (iHOSE1481,
−4138 and −8695) (40) were
maintained in DMEM supplemented with 10% FBS and 50 µg/ml
gentamicin. All cell lines were incubated at 37°C in a humidified
incubator with 5% CO2.
Small interfering RNA (siRNA)
transfection
siRNAs targeting ATP6V1B1 and control siRNA were
purchased from Bioneer Corporation. The siRNA sequences are
provided in Table SI. OVCAR3 and
OVCA433 cells grown in six-well plates were transfected with siRNA
at a final concentration of 100 pmol per well using
Lipofectamine® RNAiMAX Reagent (Invitrogen; Thermo
Fisher Scientific, Inc.), according to the manufacturer's
instructions. The knockdown of ATP6V1B1 was verified via
RT-quantitative (q)PCR after 48 h of transfection and used for
downstream functional experiments.
RT-qPCR
Total RNA was isolated using the
AccuPrep® Universal RNA Extraction Kit (Bioneer
Corporation) and cDNA was synthesized using the
AccuPower® RocketScript™ RT PreMix (Bioneer Corporation)
according to the manufacturer's protocol. Gene expression levels
were analyzed using the target gene-specific primers listed in
Table SI, the ABI 7300 Real-Time
PCR System (Applied Biosystems; Thermo Fisher Scientific, Inc.) and
TOPreal™ qPCR 2X PreMIX (SYBR Green with high ROX; Enzynomics).
Data analysis was performed using the relative quantification
method (2−∆∆Cq) to estimate the relative fold changes.
All data were normalized to the GAPDH expression levels. Each
experiment was performed in triplicate and with at least three
independent replicates.
Cell proliferation assay
Cell proliferation assay was measured using the
EZ-Cytox assay kit (Daeil Lab Service) and EdU Cell Proliferation
Assay kit (Thermo Fisher Scientific, Inc.) in accordance with the
manufacturer's instructions. Concisely, 5×10³ cells were
seeded in 96-well plates after 24 h of transfection. EZ-Cytox
reagent was added and the cells were incubated for another 2 h at
37°C. The absorbance at 450 nm was then detected using a microplate
reader (Bio-Rad Laboratories, Inc.). The EdU incorporation
experiment was also performed according to the user manual.
Fluorescence was measured using a FLUOstar Omega instrument (BMG
Labtech GmbH) with 568 nm of excitation and 585 nm of emission.
Each experiment was performed thrice.
Colony-formation assay
The transfected cells (500 cells/well) were seeded
in a six-well plate and incubated at 37°C with 5% CO2
for 2 weeks. The cells were fixed with methanol for 10 min and
stained with 0.5% crystal violet for 30 min at room temperature.
Colonies were counted under a microscope after being rinsed with
distilled water, and each colony contained at least 50 cells. Each
experiment was repeated thrice.
Cell-cycle analysis by flow
cytometry
Transfected OVCAR3 and OVCA433 cells were harvested
and fixed in 70% ethanol at 4°C. The fixed cells were stained with
propidium iodide supplemented with RNAase A (Sigma-Aldrich; Merck
KGaA) in the dark at room temperature for 30 min. The relative
amount of cells in each phase of the cell cycle was analyzed by
flow cytometry (FACSCanto II; BD Biosciences) and evaluated using
the FlowJo software _v10.8.0 (FlowJo LLC).
Western blot analysis
Cells were harvested and lysed using a cell lysis
buffer (Cell Signaling Technology, Inc.) containing
phenylmethylsulfonyl fluoride. Proteins from cell lysates were
electrophoresed on a 10–12% SDS-PAGE gel and transferred to a
nitrocellulose membrane (Pall Corporation). The membranes were
incubated overnight at 4°C with the corresponding primary
antibodies of Cyclin D1 (1:1,000; cat. no. 2922; Cell Signaling
Technology, Inc.), p21 (1:1,000; cat. no. 2947; Cell Signaling
Technology, Inc.) and α-actinin (1:5,000; cat. no. sc-17829; Santa
Cruz Biotechnology, Inc.). HRP-conjugated secondary antibodies
(1:2,000; cat nos. 7074 and 7076; Cell Signaling Technology, Inc.)
were then applied. Immunoreactive bands were visualized using
enhanced chemiluminescence reagents (Thermo Fisher Scientific,
Inc.).
Statistical analysis
Statistical analysis was performed using either the
R statistical package (version 4.2.0) or SPSS version 25.0 (SPSS,
Inc.). The expression levels of α-actinin, ATP6V1B and
clinicopathological characteristics of EOC when appropriate were
assessed using the Mann-Whitney U or Kruskal-Wallis test. The OS
and DFS curves were analyzed using the Kaplan-Meier method by
grouping the subjects into ATP6V1B1 high- or low-expression groups
based on the optimal cut-off point calculated by the ‘MaxStat’
package of the R software (41). A
Cox proportional hazards model was created to identify independent
predictors of survival. P<0.05 was considered to indicate
statistical significance.
Results
Upregulated expression of ATP6V1B1 in
EOC and platinum-resistant EOC
The A and B subunits of ATP6V1 are structurally
similar; however, these subunits were reported to have different
activity profiles (42). Therefore,
data from the GEPIA database were retrieved to evaluate the
specific subunit that is upregulated in EOC. ATP6V1B1 was more
specifically expressed, among the expressions of three subunits,
ATP6V1A, ATP6V1B1 and ATP6V1B2, in EOC than in other cancers
(Fig. 1A). DEGs between the normal
ovarian epithelial and HGSOC tissues were identified by an Illumina
microarray through RNA-seq analysis. RNA isolated from the tissues
was directly compared using hybridization with cDNA microarrays
containing 24,957 probe sets. The volcano plot indicated 24,958
DEGs (P<0.05, fold change >2) in EOC compared with normal
epithelial tissues, and one of the DEGs was ATP6V1B1 (Fig. 1B).
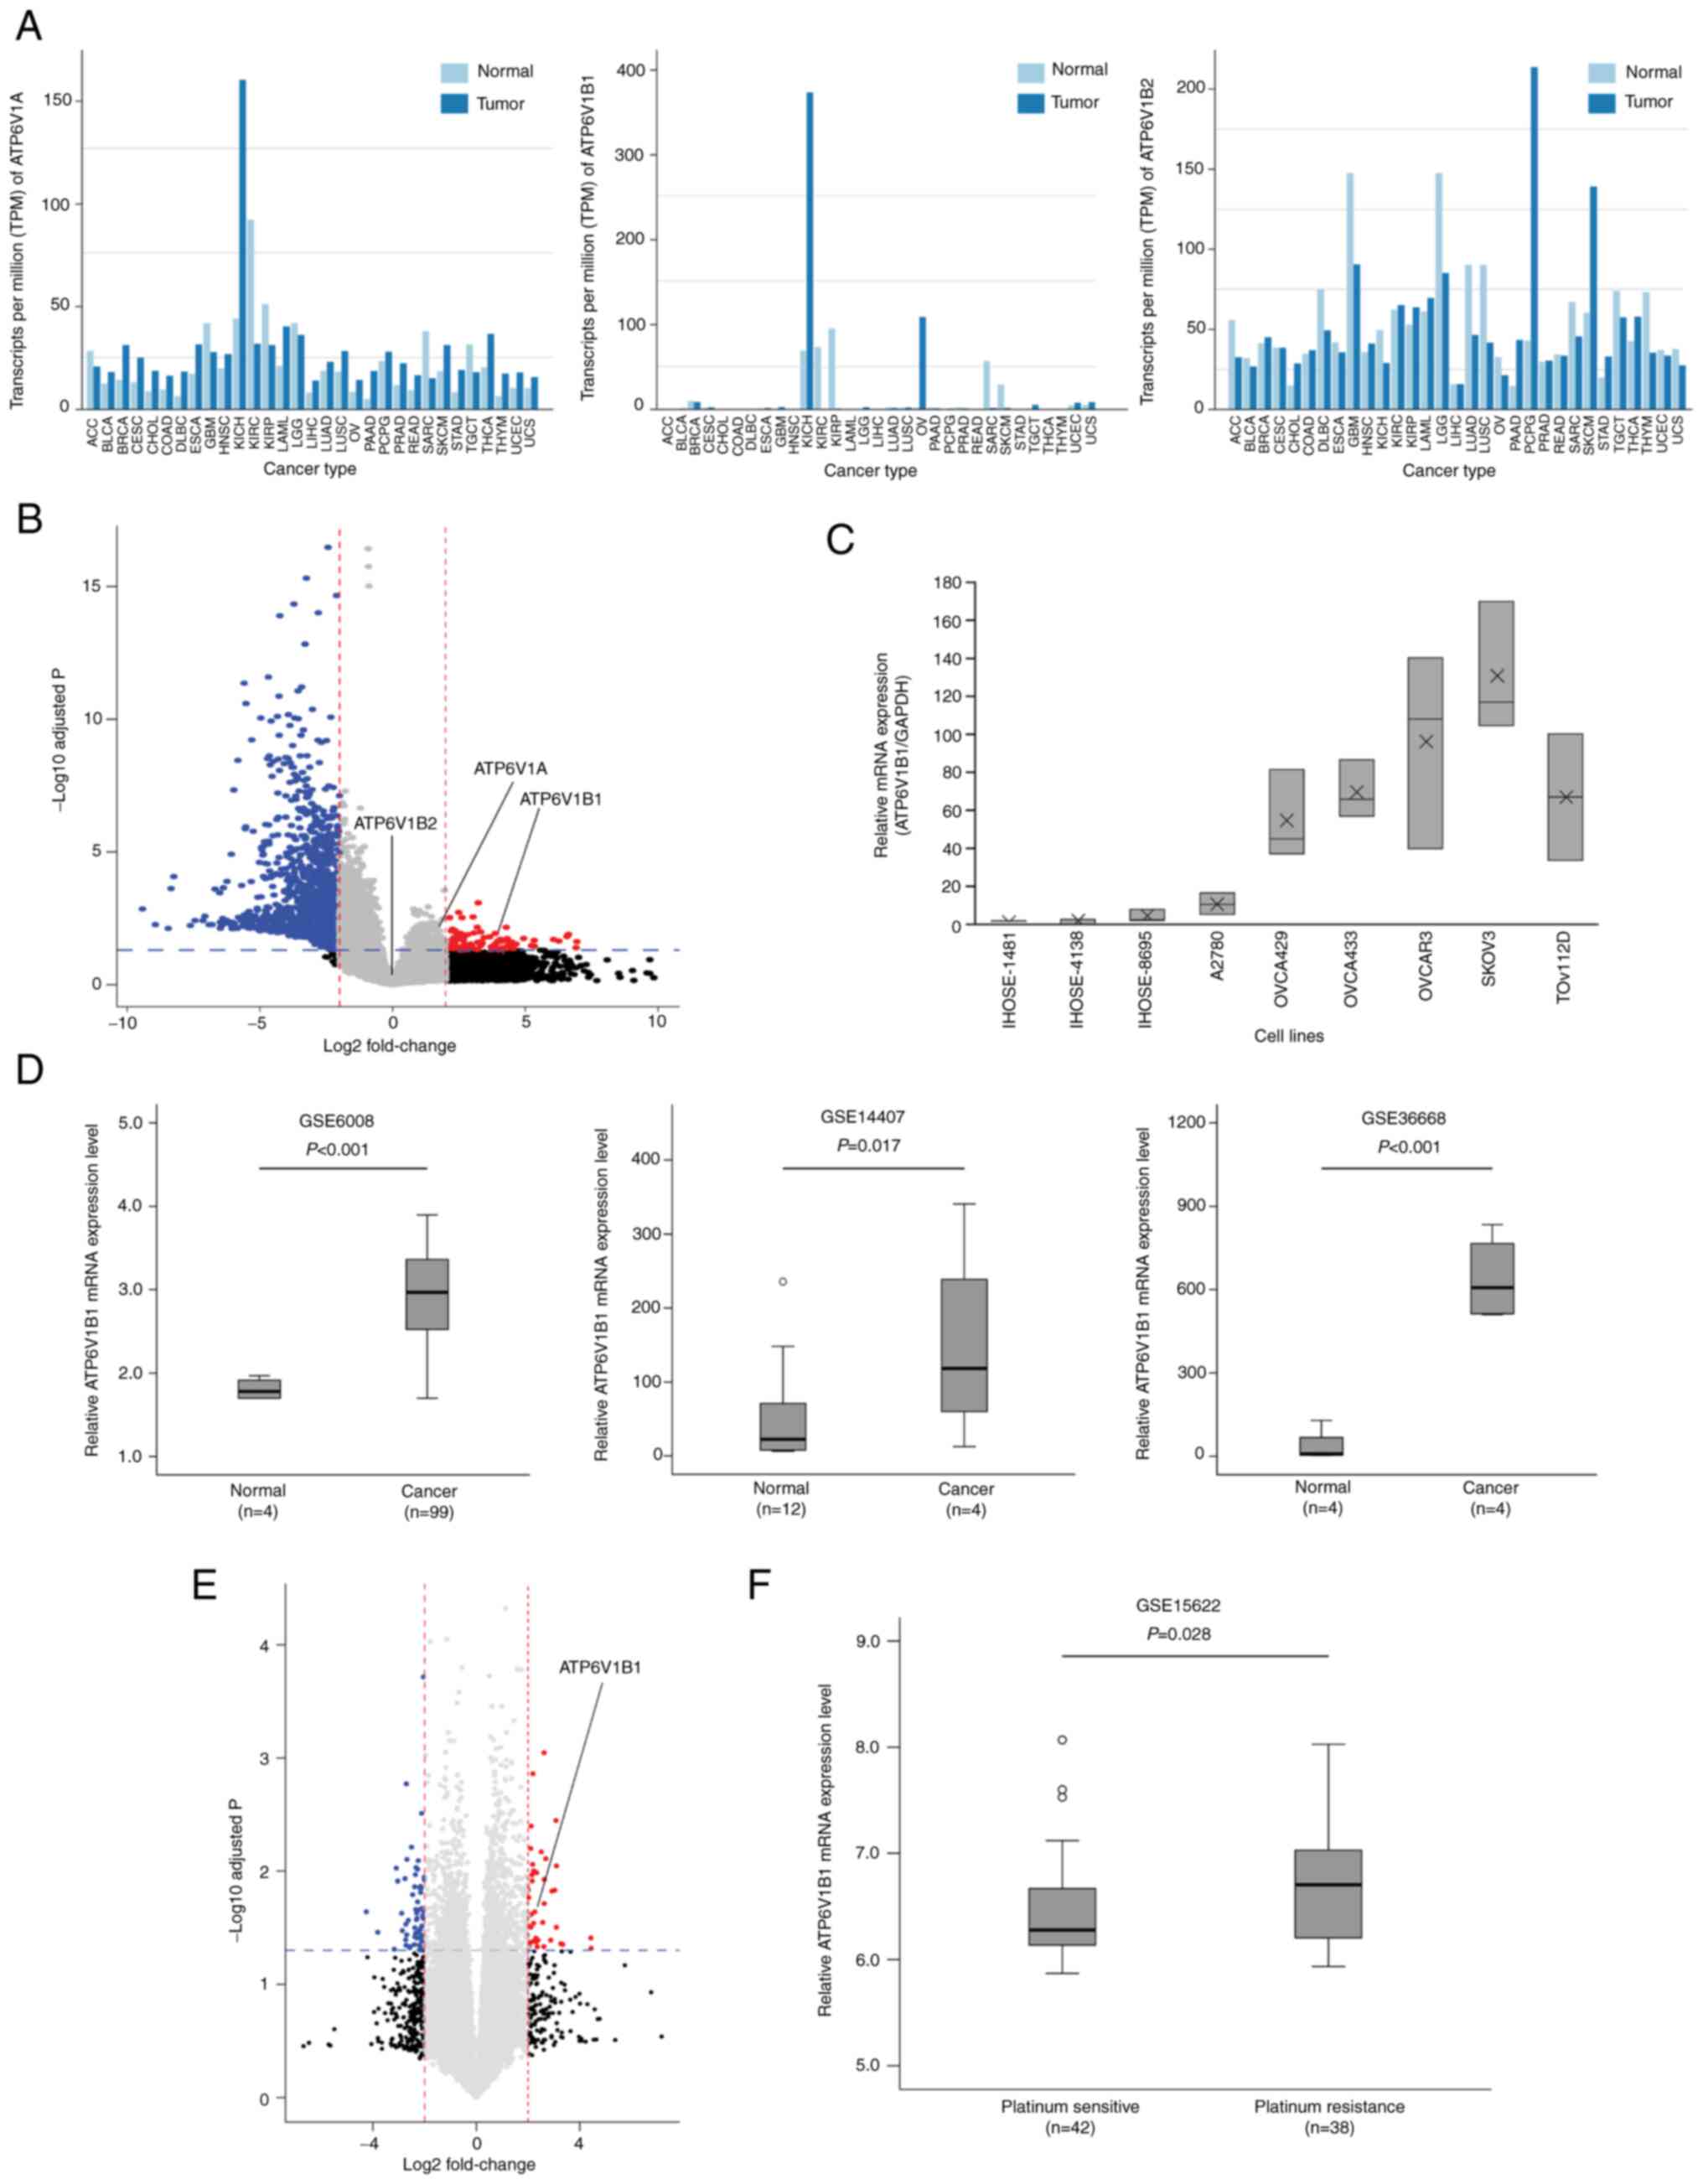 | Figure 1.Comparative analysis of ATP6V1
expression in EOC. (A) Gene Expression Profiling Interactive
Analysis was performed to validate the expression of ATP6V1
subunits A, B1 and B2 in various cancers. (B) Volcano plot of the
distribution of differentially expressed genes between normal
ovarian epithelial tissues and EOC tissues in an RNA sequencing
analysis (P<0.05 and fold change >2) demonstrating the
upregulation of ATP6V1A, ATP6V1B1 and ATP6V1B2 expression in EOCs.
The -log10 (P-value) of each gene is plotted against the
log2 ratio of cancer to normal intensity. Vertical
dotted lines in red and blue correspond to a 2.0-fold upregulation
and downregulation of expression, respectively. Horizontal blue
dotted lines indicate the significance level at P=0.05. Plots were
generated using ExDEGA v.1.6.5 software. (C) mRNA expression of
ATP6V1B1 in immortalized human ovarian epithelial cell lines (iHOSE
1481, iHOSE 4138, and iHOSE 8695) and six ovarian cancer cell lines
determined using reverse transcription-quantitative PCR. The
expression levels of ATP6V1B1 were normalized to GAPDH expression
levels. (D) Box plots of the mRNA expression of ATP6V1B1 between
normal and high-grade serous ovarian cancer samples. Publicly
available gene expression data were obtained from the GEO database
(i.e., GSE6008, GSE14407 and GSE36668). (E) Volcano plot of the
distribution of differentially expressed genes between
platinum-sensitive and -resistant EOC tissues in the RNA sequencing
analysis (P<0.05 and fold change >2). Vertical dotted lines
in red and blue correspond to a 2.0-fold upregulation and
downregulation of expression, respectively. Horizontal blue dotted
lines indicate the significance level at P=0.05. (F) Publicly
available relative ATP6 V1B1 mRNA expression data between
platinum-sensitive and -resistant EOC tissues were obtained from
the GEO database (i.e., GSE15622). ACC, adrenocortical carcinoma;
ATP6V1B1, ATPase H+ transporting V1 subunit B1; BLC, bladder
urothelial carcinoma; BRCA, breast invasive carcinoma; CESC,
cervical squamous cell carcinoma and endocervical adenocarcinoma;
CHOL, cholangiocarcinoma; COAD, colon adenocarcinoma; DLBC,
lymphoid neoplasm diffuse large B-cell lymphoma; EOC, epithelial
ovarian cancer; ESCA, esophageal carcinoma; GBM, glioblastoma
multiforme; GEO, Gene Expression Omnibus; HNSC, head and neck
squamous cell carcinoma; KICH, kidney chromophobe; KIRC, kidney
renal clear cell carcinoma; KIRP, kidney renal papillary cell
carcinoma; LAML, acute myeloid leukemia; LGG, brain lower-grade
glioma; LIHC, liver hepatocellular carcinoma; LUAD, lung
adenocarcinoma; LUSC, lung squamous cell carcinoma; OV, ovarian
serous cystadenocarcinoma; PAAD, pancreatic adenocarcinoma; PCPG,
pheochromocytoma and paraganglioma; PRAD, prostate adenocarcinoma;
READ, rectum adenocarcinoma; SARC, sarcoma; SKCM, skin cutaneous
melanoma; STAD, stomach adenocarcinoma; TGCT, testicular germ cell
tumors; THCA, thyroid carcinoma; THYM, thymoma; UCEC, uterine
corpus endometrial carcinoma; UCS, uterine carcinosarcoma; TPM,
transcripts per million. |
The expression of ATP6V1B1 was first examined in
three iHOSE cell lines and six ovarian cancer cell lines (i.e.,
A2780, OVCA429, OVCA433, OBCAR3, SKOV3 and TOV112D) using RT-qPCR
to elucidate the molecular mechanisms of ATP6V1B1 in promoting
ovarian cancer development. The results indicated that ATP6V1B1 was
highly expressed in ovarian cancer cells and lowly expressed in
iHOSE cells (Fig. 1C), which was
similar to the results obtained from publicly available datasets
(GSE6008, GSE14407 and GSE36668) (Fig.
1D). Anticancer therapy resistance may be induced by changes in
the normal pH gradient across the plasma membrane, which is
influenced by the activity of V-ATPase. The EOC tissues were
divided into platinum-sensitive and -resistant groups and the gene
expression of ATP6V1B1 was compared between these two groups.
ATP6V1B1 was significantly upregulated in platinum-resistant EOCs,
as expected. Similar results were observed using data from
GSE15622, which compared 42 platinum-sensitive and 26
platinum-resistant EOC tissue samples (Fig. 1E and F). Overall, these observations
suggest that the expression of ATP6V1B1 is upregulated in EOC and
platinum-resistant EOCs.
Clinicopathological characteristics
associated with ATP6V1B1 protein expression in patients with
EOC
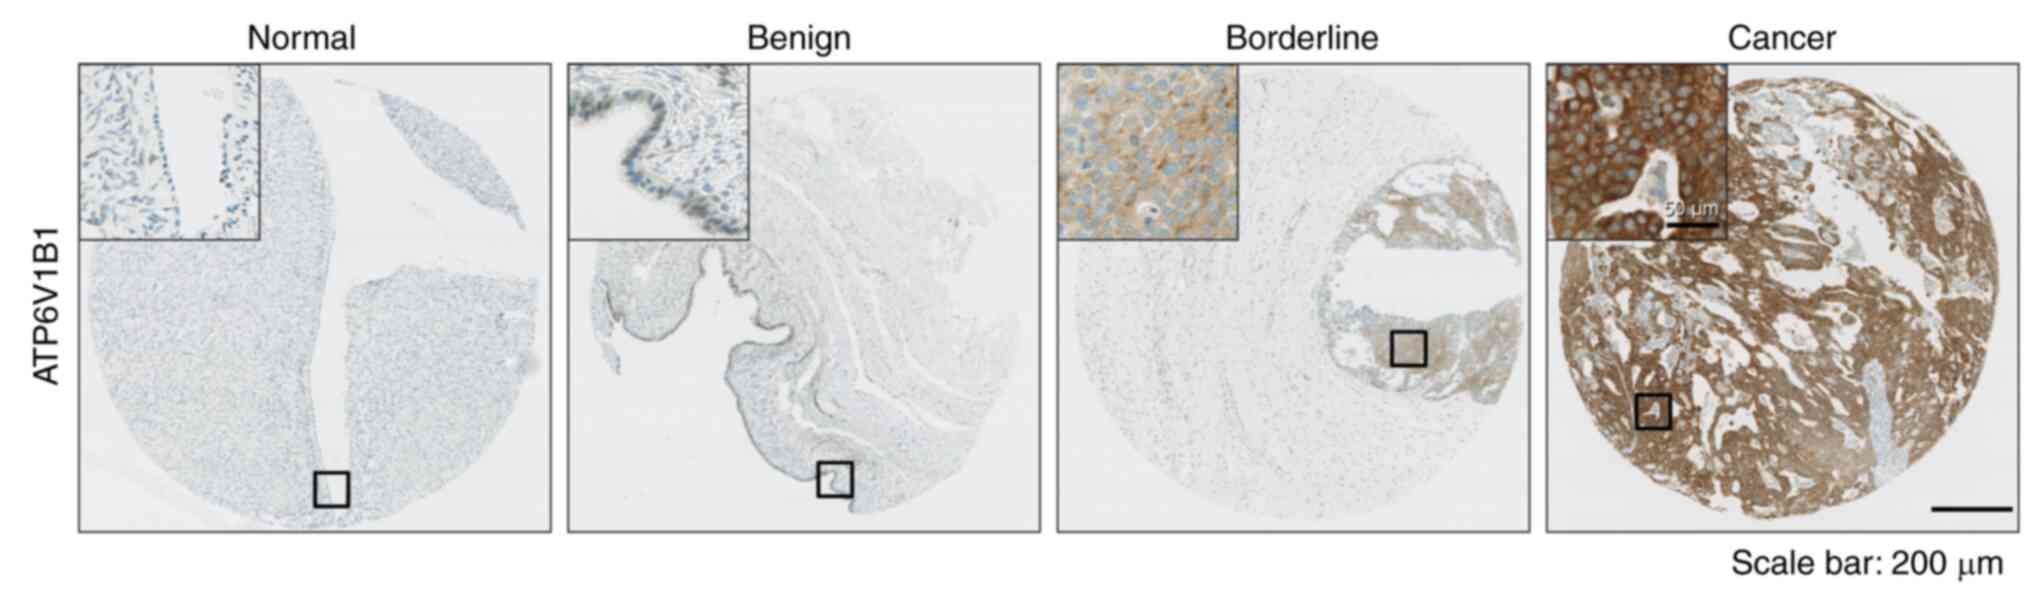
Next, the protein levels of ATP6V1B1 were compared
among nonadjacent normal epithelial tissues, benign and borderline
tumors and EOC tissues obtained from 1996 to 2012 using IHC. The
average age of patients with EOC included in this study was
52.13±13.08 years. For borderline patients, the average age was
43.23±17.44 years, while for benign patients, it was 43.66±13.89
years (Table SII). The average age
of the donors of nonadjacent normal epithelial tissues was
49.12±16.45 years. ATP6V1B1 protein levels gradually increased from
normal tissues to EOCs. Representative IHC images are provided in
Fig. 2A. ATP6V1B1 protein
expression was strongly associated with adverse clinicopathological
features of EOC, including advanced FIGO stage (P<0.001), serous
cell type (P<0.001), high tumor grade (P=0.035), elevated serum
cancer antigen (CA)-125 levels (P=0.029 and platinum resistance
(P=0.011) (Table I).
 | Table I.Association between clinicopathologic
features and ATPase H+ transporting V1 subunit B1 expression in
patients with epithelial ovarian cancer. |
Table I.
Association between clinicopathologic
features and ATPase H+ transporting V1 subunit B1 expression in
patients with epithelial ovarian cancer.
| Item | N (%) | Mean score of
ATP6V1B1 IHC (95% CI) | P-value |
|---|
| Diagnostic
category |
|
| <0.001 |
|
Normal | 72 (18.8) | 9.00
(6.12–11.88) |
|
|
Benign | 91 (23.8) | 29.48
(20.38–38.59) |
|
|
Borderline | 48 (12.6) | 67.67
(50.88–84.46) |
|
|
Cancer | 171 (44.8) | 105.52
(92.56–118.49) |
|
| FIGO stage |
|
| 0.001 |
|
I–II | 57 (33.3) | 74.59
(54.02–95.16) |
|
|
III–IV | 114 (66.7) | 121.51
(101.46–137.56) |
|
| Cell type |
|
| <0.001 |
|
Serous | 113 (66.1) | 129.46
(113.77–154.04) |
|
|
Others | 28 (16.4) | 58.49
(40.45–46.52) |
|
|
N/A | 30 (17.5) |
|
|
| Tumor grade |
|
| 0.035 |
|
Low/moderate | 79 (46.2) | 91.54
(73.74–109.34) |
|
|
High | 82 (48.0) | 120.85
(100.18–141.51) |
|
|
N/A | 10 (5.8) |
|
|
| CA125 |
|
| 0.029 |
|
Negative | 28 (16.4) | 72.76
(44.63–100.90) |
|
|
Positive | 141 (82.5) | 111.84
(97.20–126.47) |
|
|
N/A | 2 (1.1) |
|
|
|
Chemosensitivity |
|
| 0.011 |
|
Sensitive | 144 (84.2) | 104.25
(90.34–118.15) |
|
|
Resistant | 12 (7.0) | 169.96
(111.43–228.49) |
|
|
N/A |
| 15 (8.8) |
|
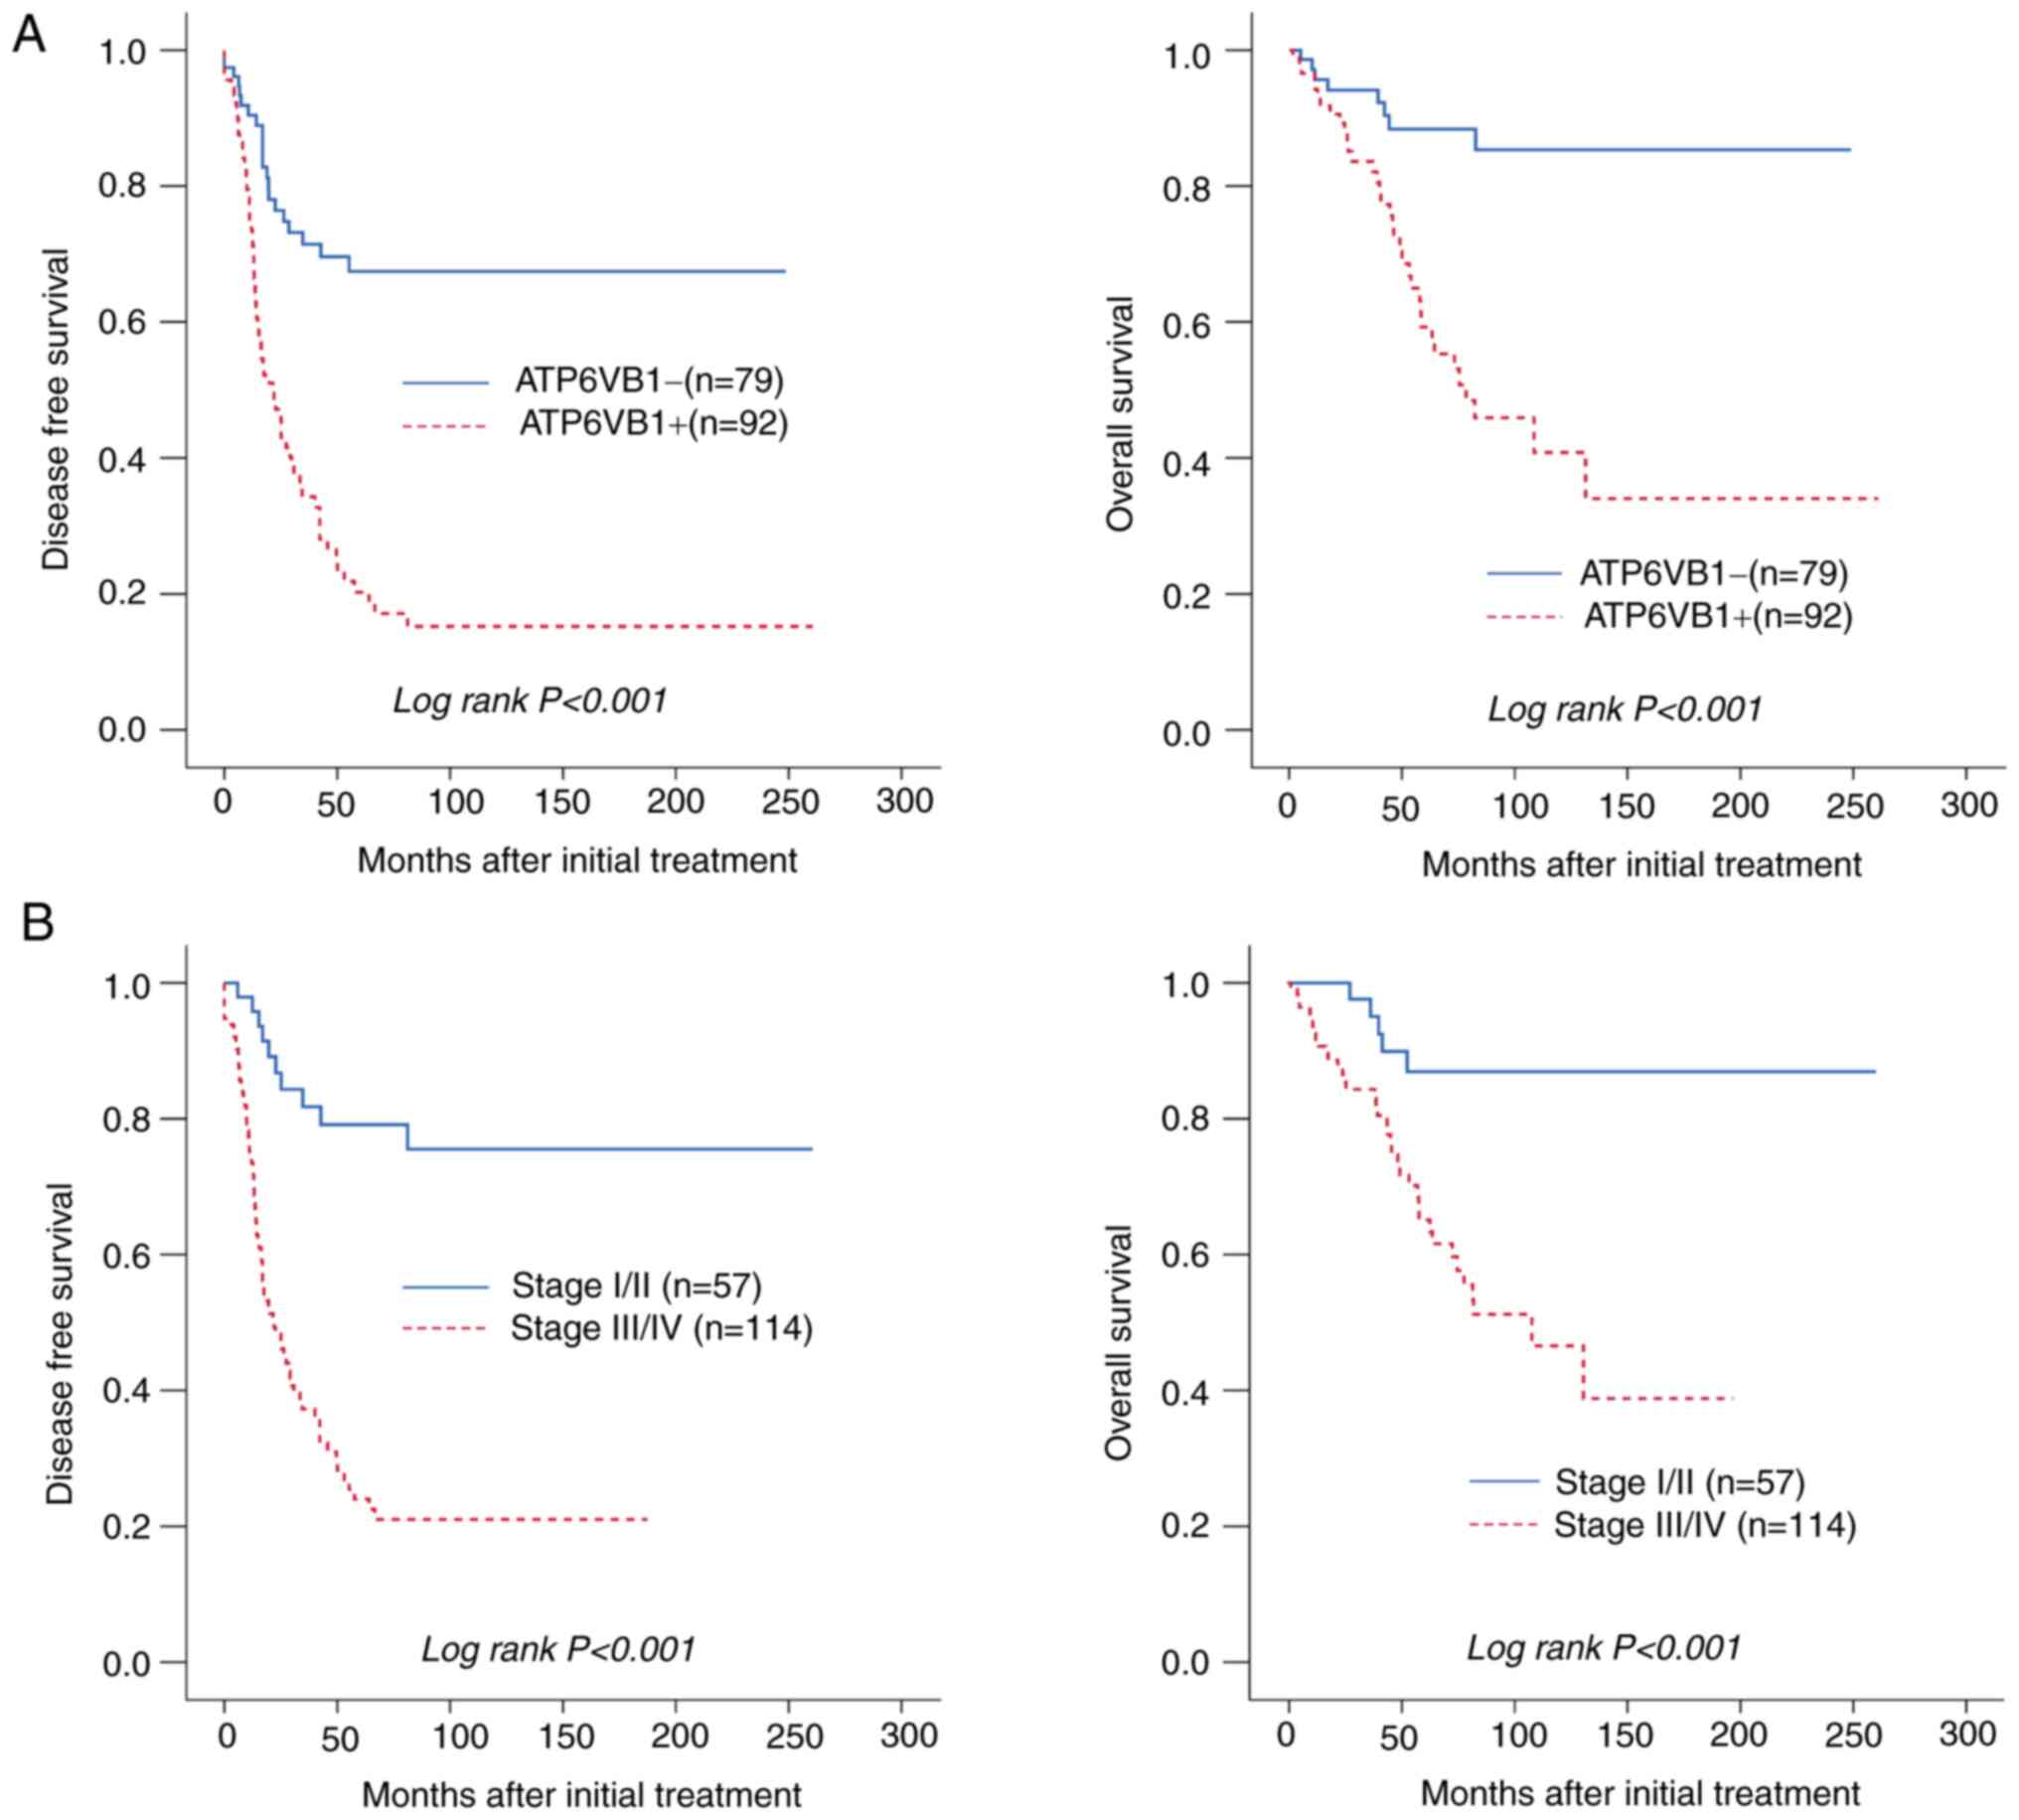
Relationship between ATP6V1B1
expression and prognosis in patients with EOC
The prognostic significance of ATP6V1B1 expression
in patients with EOC was then evaluated using Kaplan-Meier
analysis. High ATP6V1B1 expression was significantly associated
with poor DFS and OS (both P<0.001; Fig. 3A). In addition, FIGO stage III/IV
was significantly associated with poor DFS and OS, which was
expected and further validated in the present analysis (Fig. 3B). The multivariate Cox analysis
suggested that high ATP6V1B1 expression was an independent
prognostic factor for both DFS [hazard ratio (HR)=2.10 (95% CI,
1.23-3.58), P=0.006] and OS [HR=2.57 (95% CI, 1.12-5.94), P=0.027]
(Table II). In summary, the
results of the present study demonstrated that high ATP6V1B1
expression may be a predictive biomarker for poor prognosis in
patients with EOC.
| Table II.Univariate and multivariate analyses
of DFS or OS in patients with epithelial ovarian cancer. |
Table II.
Univariate and multivariate analyses
of DFS or OS in patients with epithelial ovarian cancer.
|
| DFS HR (95% CI),
P-value | OS HR (95% CI),
P-value |
|---|
|
|
|
|
|---|
| Factor | Univariate | Multivariate | Univariate | Multivariate |
|---|
| Age (>50
years) | 1.58 (1.06–2.35),
0.024 | 1.02 (0.66–1,60),
0.916 | 2.12 (1.17–3.84),
0.013 | 1.48 (0.78–2.81),
0.233 |
| FIGO stage
(III–IV) | 6.42 (3.33–12.39),
<0.001 | 3.78 (1.82–7.86),
<0.001 | 5.10 (2.02–12.86),
0.001 | 2.90 (1.12–7.53),
0.029 |
| Cell type
(serous) | 0.33 (0.20–0.55),
<0.001 | 0.60 (0.32–1.13),
0.113 | 0.22 (0.09–0.56),
0.001 | 0.39 (0.13–1.12),
0.080 |
| Tumor grade
(poor) | 1.95 (1.28–2.97),
0.002 | 1.63 (1.04–2.54),
0.032 | 1.69 (0.95–3.00),
0.076 | NA |
| CA125+
(>35 U/ml) | 2.39 (1.20–4.74),
0.013 | 1.05 (0.48–2.27),
0.907 | 2.22 (0.80–6.16),
0.127 | NA |
|
ATP6V1B1+a | 3.47 (2.10–5.74),
<0.001 | 2.10 (1.23–3.58),
0.006 | 4.42 (1.96–9.94),
<0.001 | 2.57 (1.12–5.94),
0.027 |
Knockdown of ATP6V1B1 expression
inhibits ovarian cancer cell proliferation
ATP6V1B1 was silenced using siRNA targeting ATP6V1B1
in OVCAR3 and OVCA433 cells to assess the biological consequences
of ATP6V1B1 overexpression in ovarian cancer cells. The knockdown
of ATP6V1B1 was verified using RT-qPCR (Fig. 4A). Further examination of cell
proliferation using EZ-Cytox (Fig.
4B) and EdU incorporation assays (Fig. 4C) indicated that ATP6V1B1 knockdown
significantly inhibited cell proliferation in both OVCAR3 and
OVCA433 cells. Similarly, knockdown of ATP6V1B1 decreased the
number of colonies formed (Fig.
4D).
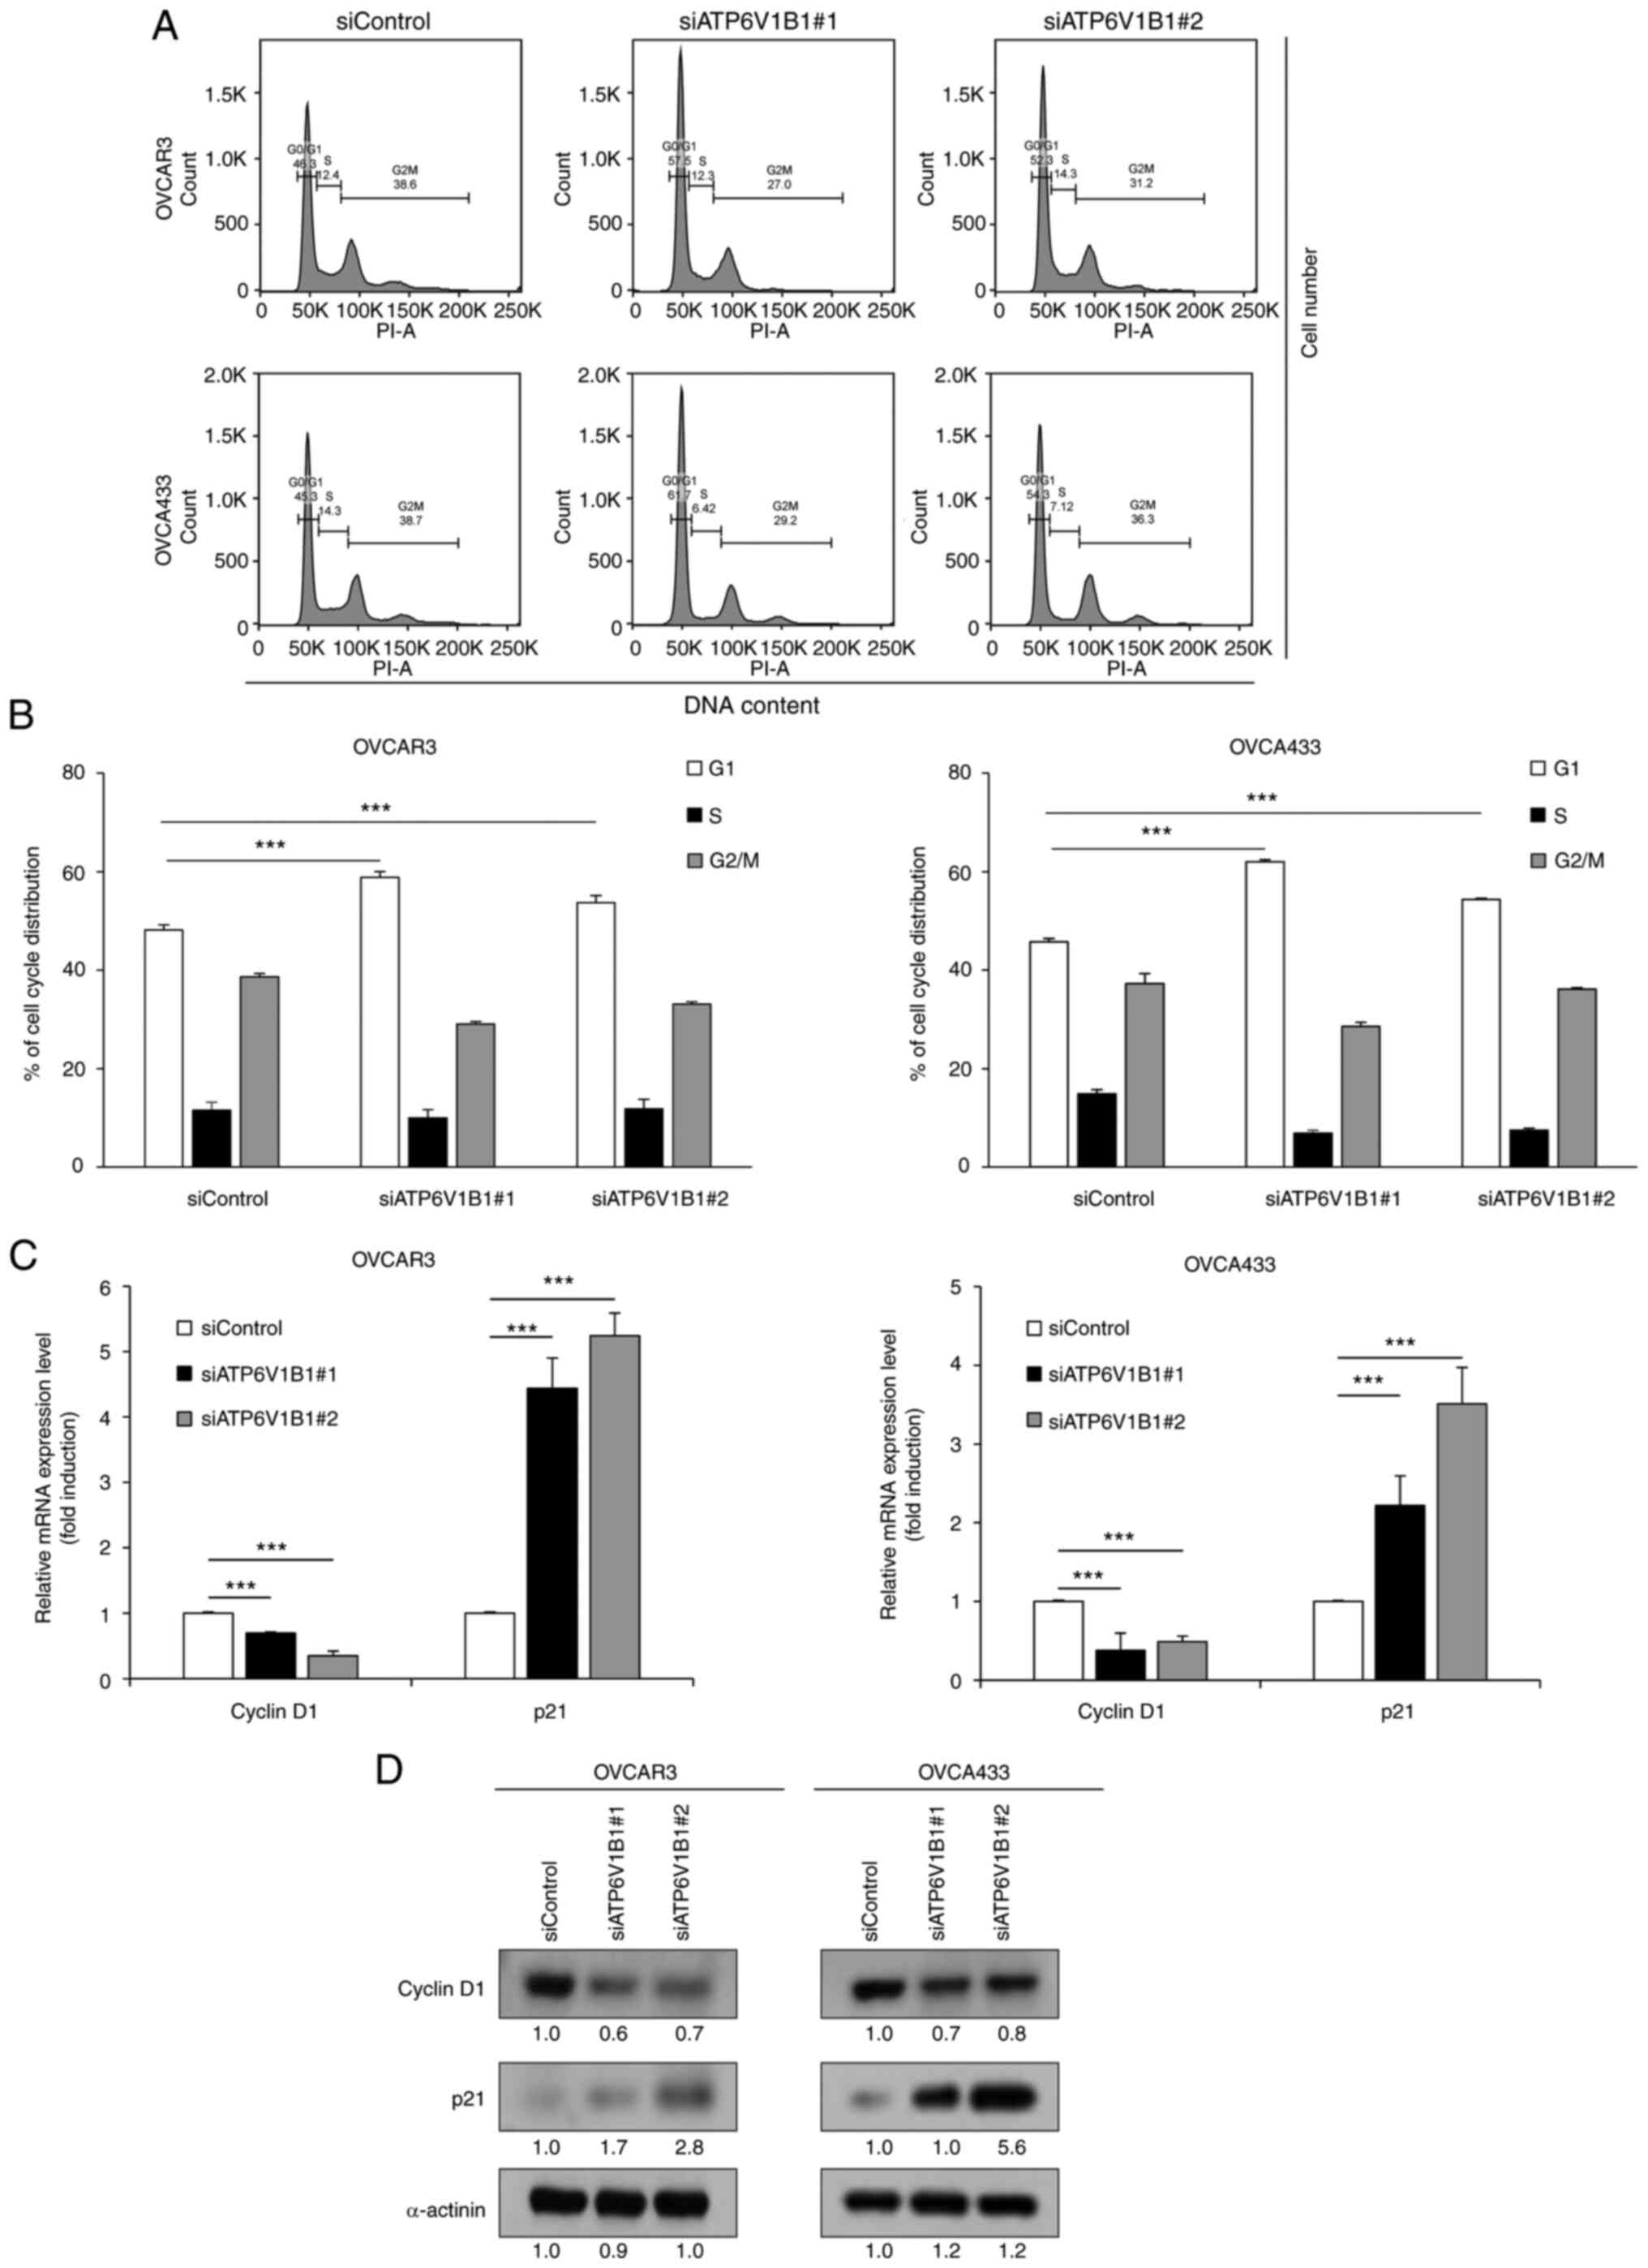
Knockdown of ATP6V1B1 induces
G0/G1-phase cell cycle arrest in ovarian cancer cells
A previous study indicated that V-ATPase inhibition
neutralizes lysosomal pH and induces cell cycle arrest and
apoptosis in various epithelial cells (43). In the present study, cell cycle
progression was analyzed to examine the underlying mechanisms of
the antiproliferative effects observed in cells transfected with
siRNA targeting ATP6V1B1. Flow cytometric analysis of the cell
cycle distribution revealed that knockdown of ATP6V1B1 resulted in
a significant increase in the number of cells in the G0/G1-phase
compared with that of the control (Fig.
5A and B). The mRNA and protein expression levels of cell cycle
regulation proteins cyclin D1 and p21, which promote G1/S
transition, were assessed to elucidate the mechanism by which
ATP6V1B1 knockdown blocks G1 progression. Both the mRNA and protein
expression results revealed upregulation of p21 and downregulation
of cyclin D1 in ATP6V1B1 knockdown cells (Fig. 5C and D).
Discussion
Proton pumps, such V-ATPases, have increased
activity in tumor cells and contribute to the maintenance of an
acidic extracellular microenvironment and intracytoplasmic
alkalization, which eventually fosters medication tolerance and
tumor metastasis (44,45). Various studies have focused on
investigating the oncogenic role of V-ATPases, which are among the
most well-known proton pumps that are composed of eight subunits,
and demonstrated that their expression is positively associated
with cancer invasion and metastasis (46,47).
Furthermore, studies examining specific V-ATPases isoforms have
been conducted. ATP6V1C1 is overexpressed in breast cancer and
Barrett's esophagus, which is a precursor lesion of esophageal
squamous cell carcinoma, and its overexpression is associated with
poor outcomes (48–50). The expression of V-ATPase-specific
subunits has also been examined in pancreatic cancer (51,52),
non-small cell lung cancer (53),
oral squamous cell carcinoma (54,55),
EOC (56) and cervical cancer
(57), further indicating the roles
of V-ATPase subunits in carcinogenesis. However, to the best of our
knowledge, the association between the expression of V-ATPase
isoforms and cancer progression has remained elusive. In the
present study, the expression of V-ATPase V1 subunits A and B,
which are components of the central stator of the proton pump, was
examined in EOC.
Subunits V1A and V1B mediate ATP hydrolysis at the
three reaction sites and increasing evidence suggests that these
subunits are likely to have functional consequences for the entire
pump (42). Therefore, in the
present study, the expression levels of subunits V1A, V1B1 and V1B2
were analyzed using data from RNA-seq and public databases.
Furthermore, the clinical significance of the upregulation of
ATP6V1B1 in EOC was explored. The IHC results indicated a gradual
increase in protein expression of ATP6V1B1 from normal ovarian
epithelial tissues to benign and borderline tumors to EOCs.
Elevated ATP6V1B1 expression was highly associated with advanced
FIGO stage, serous cell type, poor tumor grade and elevated CA-125
levels, indicating that ATP6V1B1 may be involved in EOC
progression. Furthermore, the multivariate analysis indicated that
upregulated ATP6V1B1 was an independent prognostic factor for both
DFS and OS. Overall, these results suggest that ATP6V1B1 has an
important role in the pathogenesis of EOC.
The strength of the present study may have been
compromised by the small sample size and inclusion of several
histological subtypes. Therefore, future research should include
more distinct histological subgroups.
Of note, the knockdown of ATP6V1B1 in EOC decreased
proliferation and colony formation but induced cell cycle arrest
through the G1 phase, signifying cell cycle arrest at the G0/G1
phase. The present results indicate that the decreases in the
number of viable cells and colony-formation abilities were not due
to an increase in cell death; however, they may be related to cell
proliferation. It may be concluded that knockdown of ATP6V1B1
suppresses tumor cell growth, at least in part, by causing
G0/G1-phase cell-cycle arrest via the downregulation of cyclin D
and upregulating p21 based on these results. In agreement with the
present study, Lim et al (58) reported that the inhibition of
V-ATPase by bafilomycin A1 causes apoptosis by inducing cell cycle
arrest at the G0/G1 phase and upregulating p21 in prostate, kidney,
cervical and liver cancers in vitro and in vivo.
Furthermore, the present results support the findings from a
previous study reporting that the cell cycle is regulated by both
signaling pathways and changes in pH during the cell cycle
(59). However, additional studies
are required to determine the underlying mechanism, and it may be
suggested that the Warburg effect may have a role (60). A previous study reported that
elevation of intracellular pH promotes cancer cell proliferation,
which, coupled with increased glycolysis and adaptation to hypoxia
(i.e., the Warburg effect), upregulates hypoxia-inducible factor-α
(HIF-α) (61). The activation of
HIF-α increases iron uptake in tumors by inducing transferrin
receptor-1 expression or degrading heme into iron, carbon monoxide
and biliverdin through the enzyme heme oxygenase. Cancer cells use
the BMP-SMAD and JAK-STAT3 pathways to boost the function of
hepcidin, a modulation of iron metabolism (62). The expression of cell cycle
regulators, such as p21, is altered by higher iron levels, which
inhibit prostate cancer growth in the G0/G1 phase (62). Increased iron levels were found to
alter the expression of cell cycle regulators, such as p21, which
halt prostate cancer growth in the G0/G1 phase (63). A study conducted in 2014 reported
that migrating cancer cells are predominantly in the G0/G1 phase,
which confer chemoresistance in cancers (64). The clinicopathological
characteristics of EOC specimens and RNA-seq data revealed that
ATP6V1B1 overexpression is associated with platinum-based
chemotherapy resistance. Studies relating chemotherapy resistance
in cancer cells to the reversal of the typical pH gradient between
the cytoplasm and extracellular environment, which controls the
G0/G1 phase of the cell cycle, may help to partially explain this.
Overall, therapeutic strategies to maintain the pH gradient across
the plasma membrane appear to be effective in enhancing the
effectiveness of platinum-based chemotherapy (13).
In the present study, the clinical and prognostic
significances of ATP6V1B1 were demonstrated. ATP6V1B1 protein
expression was the lowest in the nonadjacent normal ovarian
epithelial tissues and its expression gradually increased from
benign to borderline tumors and was expressed the highest in the
EOC tissues. Overexpression of ATP6V1B1 was positively correlated
with adverse clinicopathological parameters and has an independent
prognostic value for DFS and OS, further supporting its use as a
valuable biomarker for treatment response and prognosis for EOC. Of
note, including ATP6V1B1 in the subset of gene panels would be more
effective to facilitate a personalized therapy and increase the
survival of patients with EOC as new avenues of EOC molecular
characterization were opened using next-generation/high-throughput
sequencing technology to predict platinum resistance or prognosis
(65,66). In addition, the present study
suggested that ATP6V1B1 may have a mechanistic role in enhancing
cell motility via the disruption of the cell cycle, making it a
viable therapeutic target.
Supplementary Material
Supporting Data
Acknowledgements
Some of the results included in the present study
have been previously presented at the Eropean Congress on
Gynecological Oncology 2022, Berlin (abstract no. 2022-RA-728).
Funding
This study was supported by a National Research Foundation of
Korea (NRF) grant, funded by the Korean government (MIST; grant no.
NRF-2020R1A2C2004782). This research was supported by the Bio and
Medical Technology Development Program of the NRF, funded by the
Korean government (MIST; grant no. NRF-2017M3A9B8069610). This
study was also supported by a faculty research grant from the
Yonsei University College of Medicine (grant no. 6-2020-0226).
Availability of data and materials
The datasets generated and/or analyzed during the
current study are available from the Sequence Read Archive
repository with the accession no. PRJNA929551 (https://dataview.ncbi.nlm.nih.gov/object/PRJNA929551?reviewer=2a8ackbu9q2e6l33nhhh8aonfq).
Authors' contributions
Conceptualization, HY, GHH, JYC and HC; methodology,
GHH, JHK, JYC and HC; data curation, GHH, HY and HC; investigation,
HY; writing-original draft preparation, HY and GHH; and
writing-review and editing, JYC, JHK and HC. GHH, HY and HC
confirmed the authenticity of all the raw data. All authors have
read and approved the final manuscript.
Ethics approval and consent to
participate
All biological samples were collected after
obtaining informed consent from the participants following the
guidelines of the IRB of Gangnam Severance Hospital, and the
present study was approved by the IRB of Gangnam Severance Hospital
(Seoul, Korea; IRB no. 3-2020-0377).
Patient consent for publication
Not applicable.
Competing interests
The authors declare that they have no competing
interests.
Glossary
Abbreviations
Abbreviations:
|
DEGs
|
differentially expressed genes
|
|
DFS
|
disease-free survival
|
|
DMEM
|
Dulbecco's modified Eagle's medium
|
|
EOC
|
epithelial ovarian cancer
|
|
FBS
|
fetal bovine serum
|
|
FIGO
|
Federation of Gynecology and
Obstetrics
|
|
FFPE
|
formalin-fixed paraffin-embedded
|
|
GEPIA
|
Gene Expression Profiling Interactive
Analysis
|
|
HGSOC
|
high-grade serous ovarian cancer
|
|
IRB
|
Institutional Review Board
|
|
OS
|
overall survival
|
|
RNA-seq
|
RNA-sequencing
|
|
siRNAs
|
small interfering RNAs
|
|
TMA
|
tissue microarray
|
References
|
1
|
Sung H, Ferlay J, Siegel RL, Laversanne M,
Soerjomataram I, Jemal A and Bray F: Global cancer statistics 2020:
GLOBOCAN estimates of incidence and mortality worldwide for 36
cancers in 185 countries. CA Cancer J Clin. 71:209–249. 2021.
View Article : Google Scholar : PubMed/NCBI
|
|
2
|
Siegel RL, Miller KD, Fuchs HE and Jemal
A: Cancer statistics, 2021. CA Cancer J Clin. 71:7–33. 2021.
View Article : Google Scholar : PubMed/NCBI
|
|
3
|
Siegel RL, Miller KD and Jemal A: Cancer
statistics, 2020. CA Cancer J Clin. 70:7–30. 2020. View Article : Google Scholar : PubMed/NCBI
|
|
4
|
Lheureux S, Gourley C, Vergote I and Oza
AM: Epithelial ovarian cancer. Lancet. 393:1240–1253. 2019.
View Article : Google Scholar : PubMed/NCBI
|
|
5
|
Perren TJ, Swart AM, Pfisterer J,
Ledermann JA, Pujade-Lauraine E, Kristensen G, Carey MS, Beale P,
Cervantes A, Kurzeder C, et al: A phase 3 trial of bevacizumab in
ovarian cancer. N Engl J Med. 365:2484–2496. 2011. View Article : Google Scholar : PubMed/NCBI
|
|
6
|
Pujade-Lauraine E, Ledermann JA, Selle F,
Gebski V, Penson RT, Oza AM, Korach J, Huzarski T, Poveda A,
Pignata S, et al: Olaparib tablets as maintenance therapy in
patients with platinum-sensitive, relapsed ovarian cancer and a
BRCA1/2 mutation (SOLO2/ENGOT-Ov21): A double-blind, randomised,
placebo-controlled, phase 3 trial. Lancet Oncol. 18:1274–1284.
2017. View Article : Google Scholar : PubMed/NCBI
|
|
7
|
Pujade-Lauraine E, Hilpert F, Weber B,
Reuss A, Poveda A, Kristensen G, Sorio R, Vegote I, Witteveen P,
Bamias A, et al: Bevacizumab combined with chemotherapy for
platinum-resistant recurrent ovarian cancer: The AURELIA open-label
randomized phase III trial. J Clin Oncol. 32:1302–1308. 2014.
View Article : Google Scholar : PubMed/NCBI
|
|
8
|
Bast RC Jr, Hennessy B and Mills GB: The
biology of ovarian cancer: New opportunities for translation. Nat
Rev Cancer. 9:415–428. 2009. View
Article : Google Scholar : PubMed/NCBI
|
|
9
|
Nishi T and Forgac M: The vacuolar
(H+)-ATPases-nature's most versatile proton pumps. Nat Rev Mol Cell
Biol. 3:94–103. 2002. View
Article : Google Scholar : PubMed/NCBI
|
|
10
|
Forgac M: Vacuolar ATPases: Rotary proton
pumps in physiology and pathophysiology. Nat Rev Mol Cell Biol.
8:917–929. 2007. View
Article : Google Scholar : PubMed/NCBI
|
|
11
|
Marshansky V, Rubinstein JL and Grüber G:
Eukaryotic V-ATPase: Novel structural findings and functional
insights. Biochim Biophys Acta. 1837:857–879. 2014. View Article : Google Scholar : PubMed/NCBI
|
|
12
|
Toyomura T, Oka T, Yamaguchi C, Wada Y and
Futai M: Three subunit a isoforms of mouse vacuolar H+-ATPase:
Preferential expression of the a3 isoform during osteoclast
differentiation. J Biol Chem. 275:8760–8765. 2000. View Article : Google Scholar : PubMed/NCBI
|
|
13
|
Stransky L, Cotter K and Forgac M: The
function of V-ATPases in cancer. Physiol Rev. 96:1071–1091. 2016.
View Article : Google Scholar : PubMed/NCBI
|
|
14
|
Morita T, Nagaki T, Fukuda I and Okumura
K: Clastogenicity of low pH to various cultured mammalian cells.
Mutat Res. 268:297–305. 1992. View Article : Google Scholar : PubMed/NCBI
|
|
15
|
Martínez-Zaguilán R, Seftor EA, Seftor RE,
Chu YW, Gillies RJ and Hendrix MJ: Acidic pH enhances the invasive
behavior of human melanoma cells. Clin Exp Metastasis. 14:176–186.
1996. View Article : Google Scholar : PubMed/NCBI
|
|
16
|
Fais S, De Milito A, You H and Qin W:
Targeting vacuolar H+-ATPases as a new strategy against cancer.
Cancer Res. 67:10627–1030. 2007. View Article : Google Scholar : PubMed/NCBI
|
|
17
|
Holliday LS: Vacuolar H+-ATPase: An
essential multitasking enzyme in physiology and pathophysiology.
New J Sci. 2014:1–21. 2014. View Article : Google Scholar
|
|
18
|
Zhang F, Shen H, Fu Y, Yu G, Cao F, Chang
W and Xie Z: Vacuolar membrane ATPase activity 21 predicts a
favorable outcome and acts as a suppressor in colorectal cancer.
Front Oncol. 10:6058012020. View Article : Google Scholar : PubMed/NCBI
|
|
19
|
Nishie M, Suzuki E, Hattori M, Kawaguch K,
Kataoka TR, Hirata M, Pu F, Kotake T, Tsuda M, Yamaguchi A, et al:
Downregulated ATP6V1B1 expression acidifies the intracellular
environment of cancer cells leading to resistance to
antibody-dependent cellular cytotoxicity. Cancer Immunol
Immunother. 70:817–830. 2021. View Article : Google Scholar : PubMed/NCBI
|
|
20
|
Whitton B, Okamoto H, Rose-Zerilli M,
Packham G and Crabb SJ: V-ATPase Inhibition decreases mutant
androgen receptor activity in castrate-resistant prostate cancer.
Mol Cancer Ther. 20:739–748. 2021. View Article : Google Scholar : PubMed/NCBI
|
|
21
|
Ibrahim SA, Kulshrestha A, Katara GK,
Riehl V, Sahoo M and Beaman KD: Cancer-associated V-ATPase induces
delayed apoptosis of protumorigenic neutrophils. Mol Oncol.
14:590–610. 2020. View Article : Google Scholar : PubMed/NCBI
|
|
22
|
Forgac M: Structure, mechanism and
regulation of the clathrin-coated vesicle and yeast vacuolar H
(+)-ATPases. J Exp Biol. 203:71–80. 2000. View Article : Google Scholar : PubMed/NCBI
|
|
23
|
Forgac M: Structure and properties of the
vacuolar (H+)-ATPases. J Biol Chem. 274:12951–1294. 1999.
View Article : Google Scholar : PubMed/NCBI
|
|
24
|
Bar-Peled L, Schweitzer LD, Zoncu R and
Sabatini DM: Ragulator is a GEF for the rag GTPases that signal
amino acid levels to mTORC1. Cell. 150:1196–1208. 2012. View Article : Google Scholar : PubMed/NCBI
|
|
25
|
Vasilyeva E, Liu Q, MacLeod KJ, Baleja JD
and Forgac M: Cysteine scanning mutagenesis of the noncatalytic
nucleotide binding site of the yeast V-ATPase. J Biol Chem.
275:255–260. 2000. View Article : Google Scholar : PubMed/NCBI
|
|
26
|
Lozupone F, Borghi M, Marzoli F, Azzarito
T, Matarrese P, Iessi E, Venturi G, Meschini S, Canitano A, Bona R,
et al: TM9SF4 is a novel V-ATPase-interacting protein that
modulates tumor pH alterations associated with drug resistance and
invasiveness of colon cancer cells. Oncogene. 34:5163–5174. 2015.
View Article : Google Scholar : PubMed/NCBI
|
|
27
|
Kalidos K, Avinash S, Prahladan A, Koshy S
and Ramachandran K: Response evaluation criteria in solid tumors
(RECIST) version 1.1 in lung cancer: comparison with RECIST version
1.0-a retrospective study 2016: European Society of Radiology
(ECR). 2016.PubMed/NCBI
|
|
28
|
Tang Z, Li C, Kang B, Gao G, Li C and
Zhang Z: GEPIA: A web server for cancer and normal gene expression
profiling and interactive analyses. Nucleic Acids Res. 45:W98–W102.
2017. View Article : Google Scholar : PubMed/NCBI
|
|
29
|
Hendrix ND, Wu R, Kuick R, Schwartz DR,
Fearon ER and Cho KR: Fibroblast growth factor 9 has oncogenic
activity and is a downstream target of Wnt signaling in ovarian
endometrioid adenocarcinomas. Cancer Res. 66:1354–1362. 2006.
View Article : Google Scholar : PubMed/NCBI
|
|
30
|
Bowen NJ, Walker LD, Matyunina LV, Logani
S, Totten KA, Benigno BB and McDonald JF: Gene expression profiling
supports the hypothesis that human ovarian surface epithelia are
multipotent and capable of serving as ovarian cancer initiating
cells. BMC Med Genomics. 2:712009. View Article : Google Scholar : PubMed/NCBI
|
|
31
|
Elgaaen BV, Olstad OK, Sandvik L, Odegaard
E, Sauer T, Staff AC and Gautvik KM: ZNF385B and VEGFA are strongly
differentially expressed in serous ovarian carcinomas and correlate
with survival. PLoS One. 7:e463172012. View Article : Google Scholar : PubMed/NCBI
|
|
32
|
Ahmed AA, Mills AD, Ibrahim AE, Temple J,
Blenkiron C, Vias M, Massie CE, Iyer NG, McGeoch A, Crawford R, et
al: The extracellular matrix protein TGFBI induces microtubule
stabilization and sensitizes ovarian cancers to paclitaxel. Cancer
Cell. 12:514–527. 2007. View Article : Google Scholar : PubMed/NCBI
|
|
33
|
Bushnell B: BBMap. https://sourceforge.net/projects/bbmap/July
17–2022
|
|
34
|
Andrews S: FastQC: A quality control tool
for high throughput sequence data. Available online. Retrieved May.
17:20182010.
|
|
35
|
Dobin A, Davis CA, Schlesinger F, Drenkow
J, Zaleski C, Jha S, Batut P, Chaisson M and Gingeras TR: STAR:
Ultrafast universal RNA-seq aligner. Bioinformatics. 29:15–21.
2013. View Article : Google Scholar : PubMed/NCBI
|
|
36
|
Anders S, Pyl PT and Huber W: HTSeq-a
Python framework to work with high-throughput sequencing data.
Bioinformatics. 31:166–169. 2015. View Article : Google Scholar : PubMed/NCBI
|
|
37
|
Love MI, Huber W and Anders S: Moderated
estimation of fold change and dispersion for RNA-seq data with
DESeq2. Genome Biol. 15:5502014. View Article : Google Scholar : PubMed/NCBI
|
|
38
|
Bast RC Jr, Feeney M, Lazarus H, Nadler
LM, Colvin RB and Knapp RC: Reactivity of a monoclonal antibody
with human ovarian carcinoma. J Clin Invest. 68:1331–1337. 1981.
View Article : Google Scholar : PubMed/NCBI
|
|
39
|
Yu-Rice Y, Edassery SL, Urban N, Hellstrom
I, Hellstrom KE, Deng Y, Li Y and Luborsky JL: Selenium-Binding
Protein 1 (SBP1) autoantibodies in ovarian disorders and ovarian
cancer. Reproduction. 153:277–284. 2017. View Article : Google Scholar : PubMed/NCBI
|
|
40
|
Shin HY, Yang W, Lee EJ, Han GH, Cho H,
Chay DB and Kim JH: Establishment of five immortalized human
ovarian surface epithelial cell lines via SV40 T antigen or HPV
E6/E7 expression. PLoS One. 13:e02052972018. View Article : Google Scholar : PubMed/NCBI
|
|
41
|
Hothorn T and Lausen B: Maximally selected
rank statistics in R. R News. 2:3–5. 2002.
|
|
42
|
Li X, Li H, Yang C, Liu L, Deng S and Li
M: Comprehensive analysis of ATP6V1s family members in renal clear
cell carcinoma with prognostic values. Front Oncol. 10:5679702020.
View Article : Google Scholar : PubMed/NCBI
|
|
43
|
Counis MF and Torriglia A: Acid DNases and
their interest among apoptotic endonucleases. Biochimie.
88:1851–1858. 2006. View Article : Google Scholar : PubMed/NCBI
|
|
44
|
Martinez-Zaguilan R, Lynch RM, Martinez GM
and Gillies RJ: Vacuolar-type H (+)-ATPases are functionally
expressed in plasma membranes of human tumor cells. Am J Physiol.
265:C1015–C1029. 1993. View Article : Google Scholar : PubMed/NCBI
|
|
45
|
Barar J and Omidi Y: Dysregulated pH in
tumor microenvironment checkmates cancer therapy. Bioimpacts.
3:149–162. 2013.PubMed/NCBI
|
|
46
|
Hong J, Yokomakura A, Nakano Y, Ishihara
K, Kaneda M, Onodera M, Nakahama K, Morita I, Niikura K, Ahn JW, et
al: Inhibition of vacuolar-type (H+)-ATPase by the cytostatic
macrolide apicularen A and its role in apicularen A-induced
apoptosis in RAW 264.7 cells. FEBS Lett. 580:2723–2730. 2006.
View Article : Google Scholar : PubMed/NCBI
|
|
47
|
Wojtkowiak JW, Rothberg JM, Kumar V,
Schramm KJ, Haller E, Proemsey JB, Lloyd MC, Sloane BF and Gillied
RJ: Chronic autophagy is a cellular adaptation to tumor acidic pH
microenvironments. Cancer Res. 72:3938–3947. 2012. View Article : Google Scholar : PubMed/NCBI
|
|
48
|
McConnell M, Feng S, Chen W, Zhu G, Shen
D, Ponnazhagan S, Deng L and Li YP: Osteoclast proton pump
regulator Atp6v1c1 enhances breast cancer growth by activating the
mTORC1 pathway and bone metastasis by increasing V-ATPase activity.
Oncotarget. 8:47675–47690. 2017. View Article : Google Scholar : PubMed/NCBI
|
|
49
|
Chueca E, Apostolova N, Esplugues JV,
García-González MA, Lanas Á and Piazuelo E: Proton pump inhibitors
display antitumor effects in Barrett's adenocarcinoma cells. Front
Pharmacol. 7:4522016. View Article : Google Scholar : PubMed/NCBI
|
|
50
|
Hinton A, Bond S and Forgac M: V-ATPase
functions in normal and disease processes. Pflugers Arch.
457:589–598. 2009. View Article : Google Scholar : PubMed/NCBI
|
|
51
|
Ohta T, Numata M, Yagishita H, Futagami F,
Tsukioka Y, Kitagawa H, Kayahara M, Nagakawa T, Miyazaki I,
Yamamoto M, et al: Expression of 16 kDa proteolipid of
vacuolar-type H(+)-ATPase in human pancreatic cancer. Br J Cancer.
73:1511–1517. 1996. View Article : Google Scholar : PubMed/NCBI
|
|
52
|
Chung C, Mader CC, Schmitz JC, Atladottir
J, Fitchev P, Cornwell ML, Koleske AJ, Crawford SE and Gorelick F:
The vacuolar-ATPase modulates matrix metalloproteinase isoforms in
human pancreatic cancer. Lab Invest. 91:732–743. 2011. View Article : Google Scholar : PubMed/NCBI
|
|
53
|
Lu Q, Lu S, Huang L, Wang T, Wan Y, Zhou
CX, Zhang C, Zhang Z and Li X: The expression of V-ATPase is
associated with drug resistance and pathology of non-small-cell
lung cancer. Diagn Pathol. 8:1452013. View Article : Google Scholar : PubMed/NCBI
|
|
54
|
García-García A, Pérez-Sayáns M, Rodríguez
MJ, Antúnez-López J, Barros-Angueira F, Somoza-Martín M,
Gándara-Rey JM and Aguirre-Urízar JM: Immunohistochemical
localization of C1 subunit of V-ATPase (ATPase C1) in oral squamous
cell cancer and normal oral mucosa. Biotech Histochem. 87:133–139.
2012. View Article : Google Scholar : PubMed/NCBI
|
|
55
|
Pérez-Sayáns M, Reboiras-López MD,
Somoza-Martín JM, Barros-Angueira F, Diz PG, Rey JM and
García-García A: Measurement of ATP6V1C1 expression in brush
cytology samples as a diagnostic and prognostic marker in oral
squamous cell carcinoma. Cancer Biol Ther. 9:1057–1064. 2010.
View Article : Google Scholar : PubMed/NCBI
|
|
56
|
Kulshrestha A, Katara GK, Ibrahim S,
Pamarthy S, Jaiswal MK, Sachs AG and Beaman KD: Vacuolar ATPase
‘a2’ isoform exhibits distinct cell surface accumulation and
modulates matrix metalloproteinase activity in ovarian cancer.
Oncotarget. 6:3797–3810. 2015. View Article : Google Scholar : PubMed/NCBI
|
|
57
|
Song T, Jeon HK, Hong JE, Choi JJ, Kim TJ,
Choi CH, Bae DS, Kim BG and Lee JW: Proton pump inhibition enhances
the cytotoxicity of paclitaxel in cervical cancer. Cancer Res
Treat. 49:595–606. 2017. View Article : Google Scholar : PubMed/NCBI
|
|
58
|
Lim JH, Park JW, Kim MS, Park SK, Johnson
RS and Chun YS: Bafilomycin induces the p21-mediated growth
inhibition of cancer cells under hypoxic conditions by expressing
hypoxia-inducible factor-1alpha. Mol Pharmacol. 70:1856–1865. 2006.
View Article : Google Scholar : PubMed/NCBI
|
|
59
|
Webb BA, Chimenti M, Jacobson MP and
Barber DL: Dysregulated pH: A perfect storm for cancer progression.
Nat Rev Cancer. 11:671–677. 2011. View Article : Google Scholar : PubMed/NCBI
|
|
60
|
Rishi G, Huang G and Subramaniam VN:
Cancer: The role of iron and ferroptosis. Int J Biochem Cell Biol.
141:1060942021. View Article : Google Scholar : PubMed/NCBI
|
|
61
|
Torti SV and Torti FM: Iron and cancer:
More ore to be mined. Nat Rev Cancer. 13:342–355. 2013. View Article : Google Scholar : PubMed/NCBI
|
|
62
|
Couch JA, Yu YJ, Zhang Y, Tarrant JM, Fuji
RN, Meilandt WJ, Solanoy H, Tong RK, Hoyte K, Luk W, et al:
Addressing safety liabilities of TfR bispecific antibodies that
cross the blood-brain barrier. Sci Transl Med. 5:183ra572013.
View Article : Google Scholar : PubMed/NCBI
|
|
63
|
Deng Z, Manz DH, Torti SV and Torti FM:
Iron-responsive element-binding protein 2 plays an essential role
in regulating prostate cancer cell growth. Oncotarget.
8:82231–82243. 2017. View Article : Google Scholar : PubMed/NCBI
|
|
64
|
Shen J, Sheng X, Chang Z, Wu Q, Wang S,
Xuan Z, Li D, Wu Y, Shang Y, Kong X, et al: Iron metabolism
regulates p53 signaling through direct heme-p53 interaction and
modulation of p53 localization, stability, and function. Cell Rep.
7:180–193. 2014. View Article : Google Scholar : PubMed/NCBI
|
|
65
|
Falzone L, Scandurra G, Lombardo V,
Gattuso G, Lavoro A, Distefano AB, Scibilia G and Scollo P: A
multidisciplinary approach remains the best strategy to improve and
strengthen the management of ovarian cancer (Review). Int J Oncol.
59:532021. View Article : Google Scholar : PubMed/NCBI
|
|
66
|
Rojas V, Hirshfield KM, Ganesan S and
Rodriguez-Rodriguez L: Molecular characterization of epithelial
ovarian cancer: Implications for diagnosis and treatment. Int J Mol
Sci. 17:21132016. View Article : Google Scholar : PubMed/NCBI
|