Introduction
Breast cancer (BC) is amongst the most commonly
encountered malignant tumors affecting women worldwide. According
to the latest estimates from the International Agency for Research
on Cancer of the World Health Organization, BC has superseded lung
cancer as the most common type of cancer worldwide (1). Numerous changes and improvements have
been made in the diagnosis and treatment of BC; however, a vast
number of patients still presents with therapeutic resistance and
relapse following surgery (2,3).
Patients with BC continue to encounter significant clinical
obstacles. Thus, it is crucial to improve the current diagnostic
and treatment methods. Prognostic indicators for BC are critical
for detection, diagnosis, prognosis and for the planning of
therapeutic strategies (4). In
spite of the discovery of several prognostic markers, the accuracy
of BC prognosis remains limited, as indicated by the increased
occurrence of BC tumors (5–7). Novel prognostic biomarkers with highly
sensitive, specific and effective therapeutic targets are necessary
for the improvement of BC treatment and for the enhancement of
patient clinical outcomes.
The gene for glucosamine-phosphate
N-acetyltransferase 1 (GNPNAT1; also known as GNA1) is located at
14q22.1. This enzyme is crucial for the uridine
diphosphate-N-acetylglucosamine biosynthetic pathway and
nucleotide-sugar biosynthesis. Among the diseases related to
GNPNAT1 are rhizomelic dysplasia and dysostosis multiplex, Ain-Naz
type (8–10). GNPNAT1 expression has been linked to
the development of castration-resistant prostate cancer via the
phosphatidylinositol 3-kinase/protein kinase B signaling pathway
(11). In addition, GNPNAT1
silencing has been reported to regulate insulin secretion in
pancreatic β-cells (12). Moreover,
the reduced expression of GNPNAT1 has been shown to inhibit tumor
cell adhesion and infiltration in lung cancer A549 cells (13). Additionally, a number of recently
published studies have demonstrated that GNPNAT1 may serve as a
biomarker for lung cancer prognosis (14–17).
However, it is uncertain whether GNPNAT1 may function as a
biomarker for BC, and its biological function in BC has not yet
been fully elucidated.
Cancer stem cells (CSCs) are a minute portion of the
diverse tumor population. It is considered that their capacity to
self-renew and differentiate constitutes the initial stage in the
development of malignancies. A poor treatment response, tumor
recurrence and metastasis in BC have been associated with CSCs
(18,19). BC stem cells (BCSCs) have been
widely identified, with their most common markers being
CD44+, CD24− and aldehyde dehydrogenase
positive (ALDH+) (20,21).
There is increasing evidence to indicate that targeting CSCs may be
an effective cancer therapy. However, further CSCs-related criteria
and processes need to be identified.
In the present study, GNPNAT1 expression and
prognosis of breast invasive carcinoma (BRCA) patients were
analyzed using The Cancer Genome Atlas (TCGA) database.
Additionally, the functional network of GNPNAT1 and its
co-expressed genes in BRCA was examined, in order to determine
their involvement in the immune response to malignancies. The
expression of GNPNAT1 and its effects on the stemness capacity of
BCSCs were also investigated. The objective of the present study
was to identify novel biological targets and methods for the
diagnosis, treatment, and prediction of the outcomes of patients
with BC.
Materials and methods
Data collection and analysis
The toil program has been always used to acquire the
RNA-sequencing data from UCSC Xena in TPM format (https://xenabrowser.net/datapages/). Genotype
Tissue Expression Project (GTEx) and TCGA_BRCA normal tissue data
were utilized to compare the two groups. From the TCGA and GTEx
datasets, the mRNA expression profiles and clinical information of
patients with BC were retrieved.
The University of Alabama at
Birmingham Cancer data analysis portal (UALCAN) database
analysis
UALCAN (http://ualcan.path.uab.edu/analysis.html) provides
protein expression analysis options for 13 commonly occurring
cancers, including BC, by using information from the Clinical
Proteomic Tumor Analysis Consortium (CPTAC) dataset (22–25).
Using the UALCAN database, data from GNPNAT1 protein expression
analysis across BRCA and normal samples based on TCGA_BRCA data and
the study of positively linked genes were obtained.
Human protein atlas (HPA) database
analysis
The HPA database (https://proteinatlas.org/) provides information on
protein levels in normal and cancer tissues for human gene
expression profiling, focusing on various aspects of research on
human proteins across the whole genome (26). Using HPA, the comparison between
GNPNAT1 protein levels in normal vs. BC tissues was performed.
Gene Expression Profiling Interactive
Analysis 2 (GEPIA2) database analysis
GEPIA2 (http://gepia2.cancer-pku.cn/#index) is an open access
online database containing RNA sequencing expression data from
8,587 normal and 9,736 tumor samples (22). Various features of the ‘Expression
Analysis’ module were used for visualization analysis, including
analysis of tumor and normal differential expression,
categorization by cancer type or pathological stage, assessment of
patient survival, and detection of comparable genes. Pearson's
correlation analysis was used to compute the correlation between
GNPANT1 and other genes in BC.
LinkedOmics database analysis
LinkedOmics (http://www.linkedomics.org/login.php) is a powerful
and free database site that includes multi-omics data from all 32
TCGA cancer types and 10 CPTAC cancer cohorts (27). The ‘LinkFinder’ module was used to
analyze genes related with GNPNAT1 expression. Furthermore, the
‘LinkInterpreter’ module with the gene set enrichment analysis
(GSEA) tool were used for Gene Ontology (GO) and Kyoto Encyclopedia
of Genes and Genomes (KEGG) pathway enrichment analyses with the
‘clusterProfile’ R program.
WEB-based GEne SeT AnaLysis Toolkit
(WebGestalt) database analysis
WebGestalt (http://www.webgestalt.org/), a web-based functional
enrichment analysis software, was utilized to run a GSEA on GNPNAT1
for the present study (28). Using
information from LinkedOmics, a WebGestalt dabatase was established
with the following advanced parameters for GSEA: i) A category must
include a minimum of 20 genes and a maximum of 500 genes; ii) the
top 10 genes are relevant; and iii) 1,000 permutations are
feasible.
Immune infiltration analysis
It is important to investigate and elucidate the
links between tumor and immune cells in order to predict the
immunotherapy response and develop novel immunotherapy targets. The
TISIDB portal for tumor and immune system interactions (http://cis.hku.hk/TISIDB/index.php) incorporates
several diverse data sources (29).
Using database information, the amount and expression of GNPNAT1 in
28 tumor-infiltrating lymphocytes (TILs) were evaluated. Using gene
expression profiling data from BC and the single-sample GSEA
(ssGSEA) approach in the R package GSVA, the present study further
examined the effect of GNPNAT1 expression on immune cell
infiltration in depth (version 3.6). To analyze the association
between the expression of GNPNAT1 and the number of immune cells
that infiltrate tumors, the Wilcoxon rank sum test was used and
Spearman's rank correlation coefficients were calculated.
Protein-protein interaction (PPI)
networks
STRING (https://www.string-db.org/) is an online database for
retrieval of interacting bases. In the present study, STRING was
used to search for genes co-expressed with GNPNAT1 and to construct
a PPI network.
Receiver operating characteristic
(ROC) analysis
GNPNAT1 expression was compared between BRCA tumors
and para-cancerous tissues by ROC analysis to test the predictive
value of GNPNAT1 for BRCA diagnosis. The area under the ROC curve
(AUC) is often used to evaluate diagnostic tests, and the AUC
generally ranges from 0.5 to 1. The closer the AUC is to 1, the
better the variable is in terms of predicting outcomes.
Establishment and evaluation of the
nomogram
In the present study, GNPNAT1 expression and
clinicopathologic characteristics of patients with BC, including
age, T stage, N stage, M stage and TP53 form TCGA_BRCA database
were used to create a nomogram, which is a reliable and useful
method used to estimate a the overall survival (OS) of patients
(30). The calibration curve was
used to test and confirm that the nomogram was good at making
predictions.
Cell culture
The MCF10A (cat. no. CL-0525) cell line was
purchased from Wuhan Procell Company, derived from human normal
mammary epithelial cells, and was cultured in specialized MCF10A
medium (Procell Life Science & Technology Co., Ltd.). The human
BC cell lines, SKBR3 (cat. no. 1101HUM-PUMC000085), MCF7 (cat. no.
1101HUM-PUMC000013) and Hs578T (cat. no. 1101HUM-PUMC000670), were
cultured in DMEM (Dalian Meilun Biology Technology Co.)
supplemented with 10% fetal bovine serum (Shanghai ExCell
Biological Products Co., Ltd.), 100 U/ml penicillin and 100 µg/ml
streptomycin (Dalian Meilun Biology Technology Co., Ltd.) in a 5%
CO2 incubator at 37°C, while the MDA-MB-231 (cat. no.
1101HUM-PUMC000014) and MDA-MB-468 cells (cat. no.
1101HUM-PUMC000249) were cultured in RPMI-1640 medium (Dalian
Meilun Biology Technology Co.). All the human BC cell lines were
purchased from the ChineseNational Infrastructure of Cell line
Resource (NICR).
Mammosphere formation assay
Briefly, serum-free DMEM/F12 medium (Dalian Meilun
Biology Technology Co.) supplemented with epidermal growth factor
(EGF; 20 ng/ml; T&L Biotechnology Co., Ltd), basic fibroblast
growth factor (bFGF; 10 ng/ml; T&L Biotechnology Co., Ltd) and
2% B27 (Gibco; Thermo Fisher Scientific, Inc.) was used to enrich
the SKBR3 and Hs578T CSCs in ultra-low adsorption six-well plates
(Corning, Inc.) for 14 days at 37°C in a 5% CO2
incubator. Both the amount and the total number of CSCs were
calculated.
Lentiviral transfection
The overexpression and knockdown vectors for
GNPNAT1, LV-2 of a three-plasmid system including the GAG-POL and
VSVG plasmid, were acquired from Tsingke Biotechnology Co., Ltd.
The sh-GNPNAT1#1 sequence was 5′-GCAAGAAACTGAACTGTTACA-3′; the
sh-GNPNAT1#2 sequence was 5′-GCTACGGCAACTCTGATTATA-3′; the
sh-GNPNAT1#3 sequence was 5′-GGAGTTGTCAGCCCTGAACAA-3′. All plasmids
(10 µg) were co-transfected into 293T cells (cat. no.
1101HUM-PUMC000091, NICR) with polyethylenimine (PEI) for
lentivirus production. Use PEG8000 concentrated lentivirus solution
(Beyotime Institute of Biotechnology) was used after 72 h. The
SKBR3 and Hs578T cells were seeded, cultured to 60–70% confluency,
and then transfected with lentivirus at a high concentration
(MOI=10). Following a 72-h incubation, drug screening was initiated
with 2 µg/ml puromycin and culture was continued for 2 weeks to
establish a model of BC cells with stable overexpression or
knockdown of GNPNAT1.
Reverse transcription-quantitative PCR
(RT-qPCR)
The RT-qPCR experiments were performed in accordance
with a previously published study by the authors (31). Relative expression was calculated
using Å (32). All reactions were
performed in triplicate. The primer pair sequences used are
presented in Table SI.
Western blot analysis
Protein extraction and western blot analysis were
performed in accordance with the protocol stated in a previously
published study by the authors (31). The primary antibodies used were as
follows: GNPNAT1 rabbit mAb (1:2,000; cat. no. TD13048; Abmart
Pharmaceutical Technology Co., Ltd.), Krüppel-like factor 4 rabbit
mAb (KLF4; 1:2,000; cat. no. T56648; Abmart Pharmaceutical
Technology Co., Ltd.), c-MYC rabbit mAb (1:2,000; cat. no. T55150;
Abmart Pharmaceutical Technology Co., Ltd.), Nanog homeobox rabbit
mAb (NANOG; 1:2,000; cat. no. T55611; Abmart Pharmaceutical
Technology Co., Ltd.), and GAPDH rabbit mAb (1:2,000; cat. no.
A19056; ABclonal Biotech Co., Ltd.). The secondary antibodies used
here was HRP goat anti-rabbit IgG (H+L) antibody (1:2,000; cat. no.
AS014; ABclonal Biotech Co., Ltd.)
Colony formation assay
Stably transfected BC cells overexpressing GNPNAT1
or cells in which GNPNAT1 was knocked down along with control cells
were seeded into six-well plates and cultured for 14 days to obtain
cell colonies. The colonies were fixed with 4% paraformaldehyde
(Beyotime Institute of Biotechnology) for 20 min and then stained
with 1% crystal violet solution (Beyotime Institute of
Biotechnology) for 15 min at room temperature. The colonies were
photographed using a mobile phone camera (Vivo) and counted.
Statistical analysis
GraphPad Prism 5.0 (Dotmatics) was used to conduct
statistical analyses. At least three distinct experimental results
were used for the acquisition of the mean and standard deviation.
The unpaired Student's t-test was used to evaluate individual
comparisons between two groups. Comparisons between three or more
groups were determined using one-way ANOVA followed with Dunnett's
post hoc test or Kruskal-Wallis test with Dunn's post hoc test.
P<0.05 was considered to indicate a statistically significant
difference.
Results
mRNA expression pan-cancer analysis of
GNPNAT
Using the ‘Gene DE’ module of the TIMER2.0 database,
the mRNA expression of GNPNAT1 in several types of tumors was
investigated by comparing them to normal tissues adjacent to the
tumors. As presented in Fig. 1A,
GNPNAT1 expression was overexpressed in bladder urothelial
carcinoma (BLCA), BRCA, cervical squamous cell carcinoma and
endocervical adenocarcinoma (CESC), colon adenocarcinoma (COAD),
esophageal carcinoma (ESCA), head and neck squamous cell carcinoma
(HNSC), lung adenocarcinoma (LUAD), lung squamous cell carcinoma
(LUSC), kidney chromophobe (KICH), prostate adenocarcinoma (PRAD),
stomach adenocarcinoma (STAD), uterine corpus endometrial carcinoma
(UCEC) compared to normal tissues. However, cholangiocarcinoma
(CHOL), kidney renal clear cell carcinoma (KIRC), liver
hepatocellular carcinoma (LIHC), kidney renal papillary carcinoma
(KIRP), and skin cutaneous melanoma (SKCM) presented with
significantly reduced GNPNAT1 expression. The ‘Expression
Analysis-Profile Plots’ tool on the GEPIA2 database was
subsequently utilized to perform further research on the expression
of GNPNAT1 in pan-cancer that matched TCGA normal and GTEx data.
GNPNAT1 expression was significantly higher in BRCA, COAD, diffuse
large B cell lymphoma (DLBCL), ESCA, glioblastoma (GBM), KICH,
LUAD, LUSC, PRAD, rectum adenocarcinoma (READ), SKCM, STAD and
thymic carcinoma (THYM) than in the control group (Fig. 1B). The ‘CCLE Data Characterization
Expression 22Q2 Public’ module was used to assess GNPNAT1 mRNA
expression in 30 cancer types, including 1,406 cell lines from the
CCLE database. The findings demonstrated that the GNPNAT1
expression levels varied considerably across cancer cell lines
(Fig. 1C).
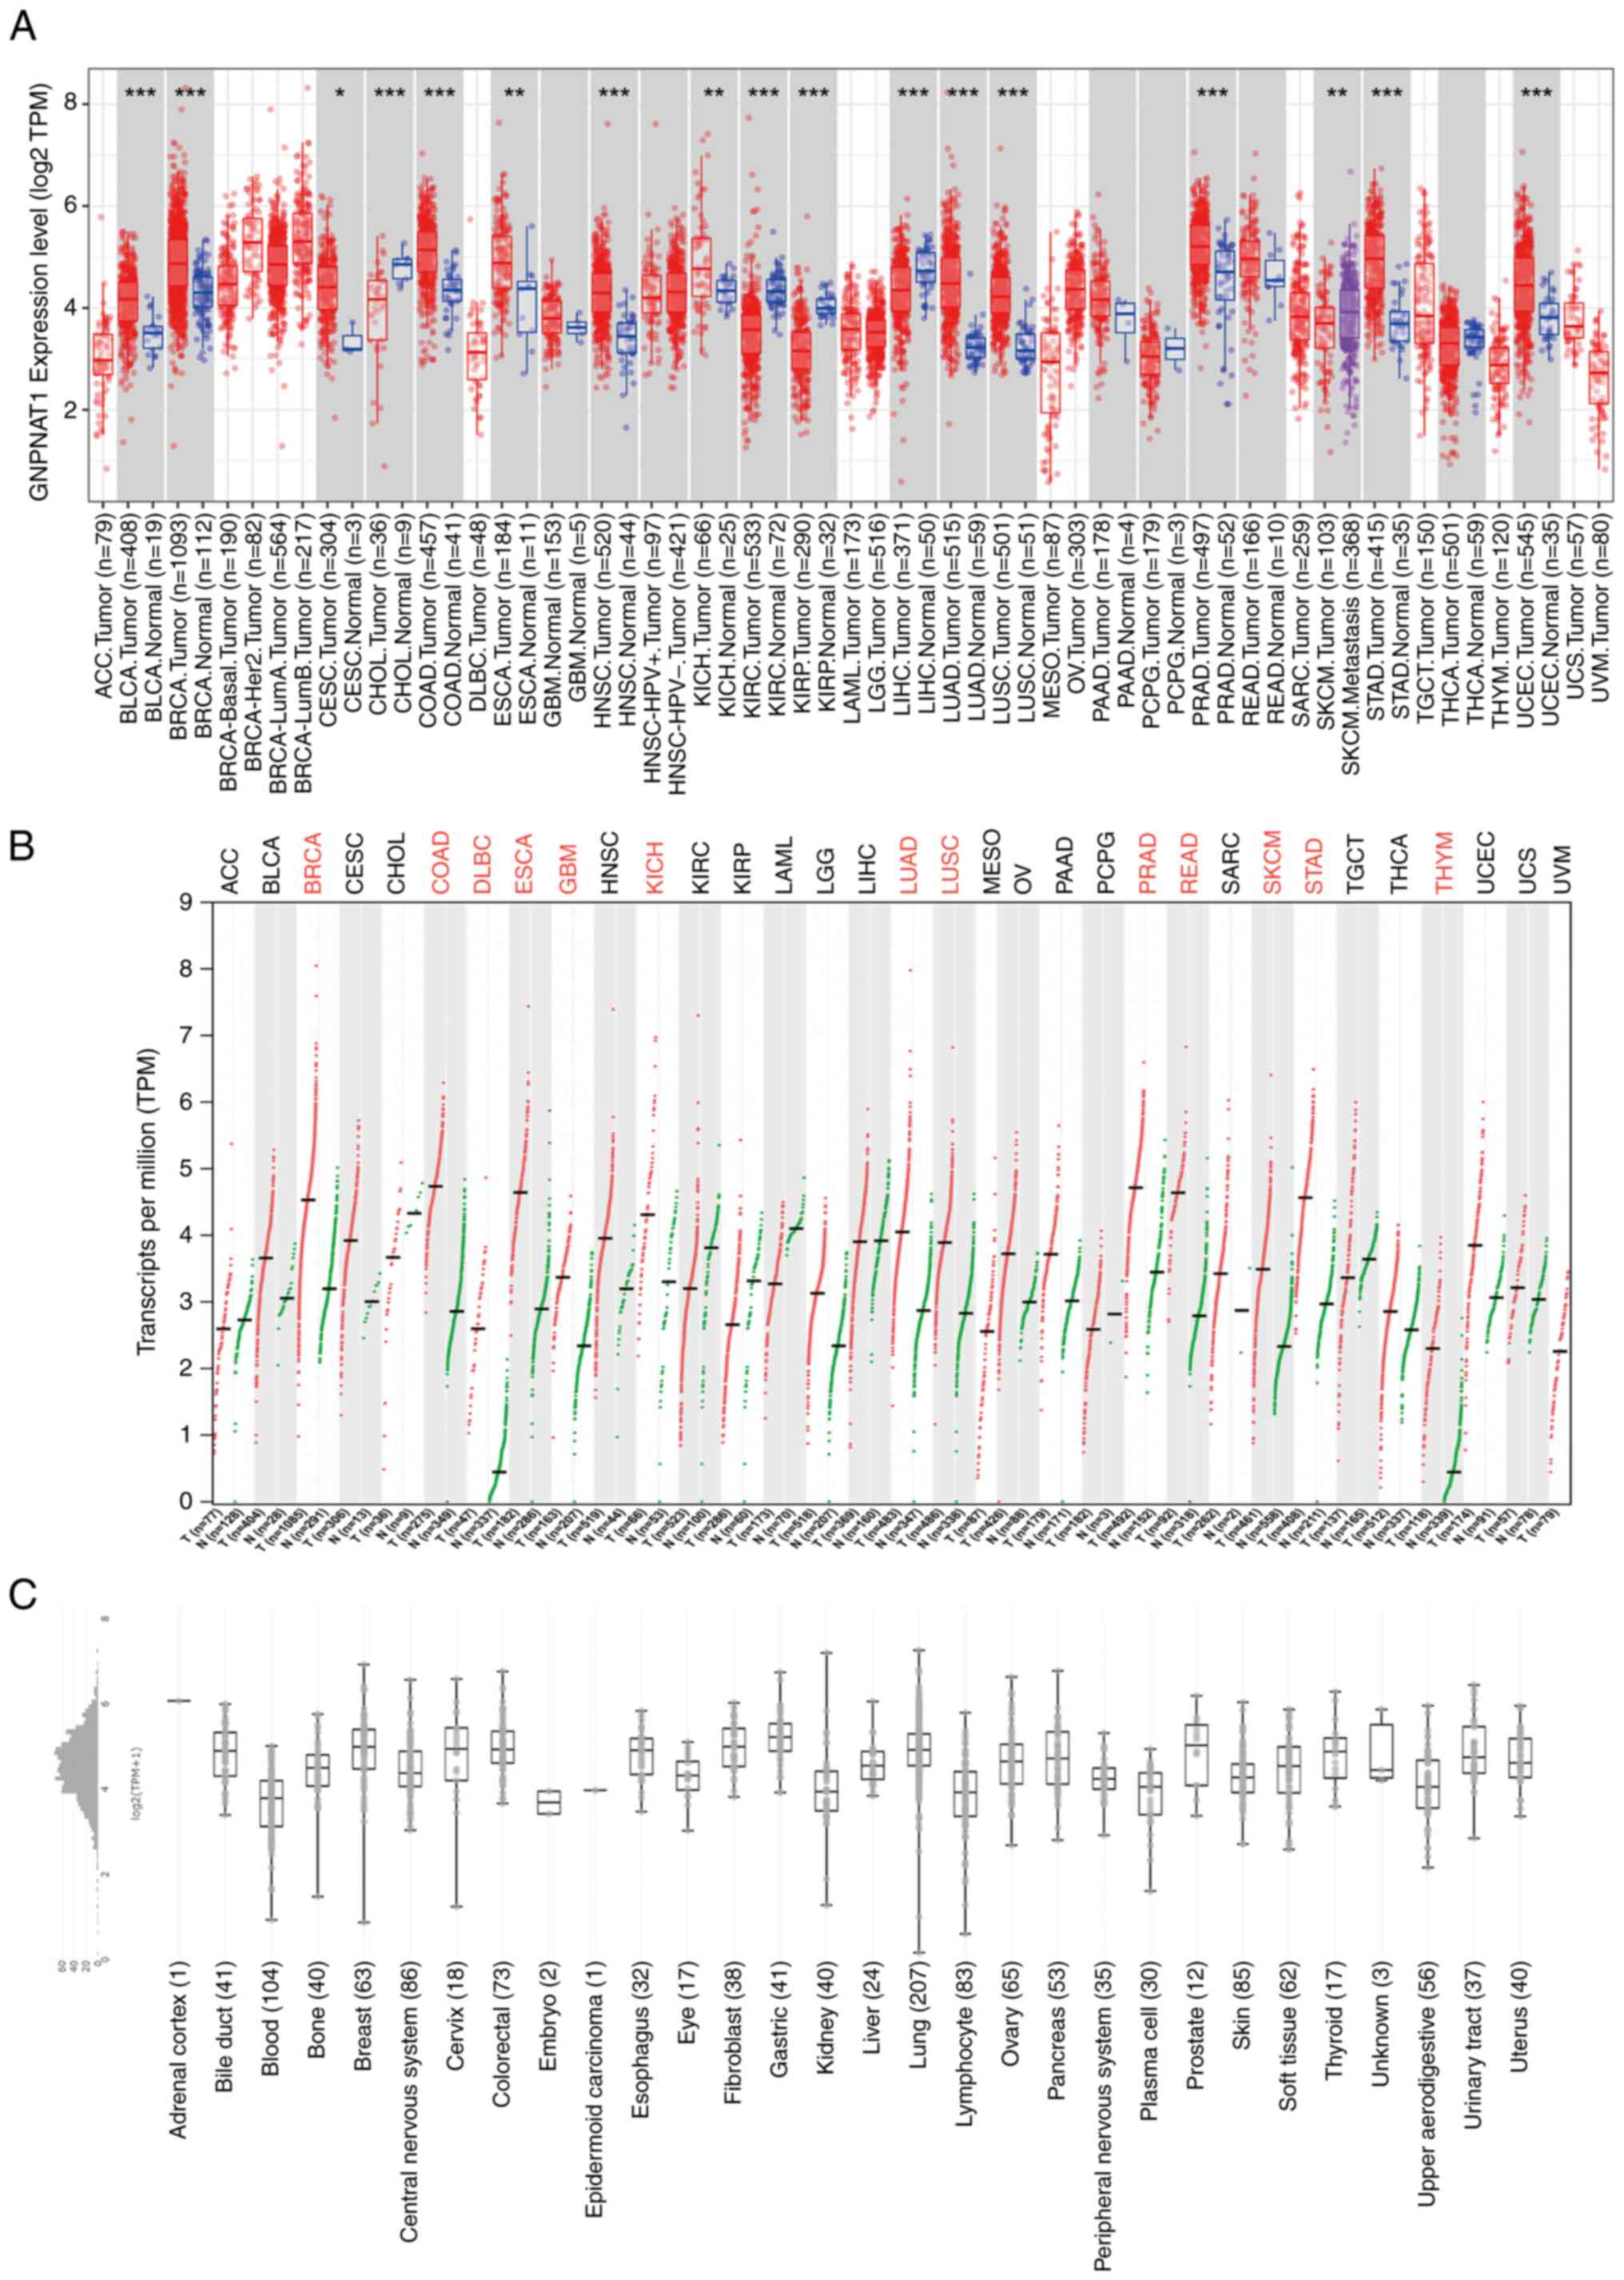 | Figure 1.GNPNAT1 is significantly
overexpressed in pan-cancer. (A) GNPNAT1 mRNA expression in
different cancer types among TCGA in TIMER2.0. (B) GNPNAT1 mRNA
expression in different cancer types among TCGA and GTEx in GEPIA2.
(C) GNPNAT1 mRNA expression in human cancer cell lines, analyzing
by the CCLE dataset. *P<0.05, **P<0.01 and ***P<0.001, as
compared with the normal group. GNPNAT1, glucosamine-phosphate
N-acetyltransferase 1; TCGS, The Cancer Genome Atlas; GTEx,
Genotype Tissue Expression Project; GEPIA, Gene Expression
Profiling Interactive Analysis 2; ACC, adenoid cystic carcinoma;
BLCA, bladder urothelial carcinoma; BRCA, breast invasive
carcinoma; CESC, cervical squamous cell carcinoma and endocervical
adenocarcinoma; CHOL, cholangiocarcinoma; COAD, colon
adenocarcinoma; DLBC, Diffuse large B cell lymphoma; ESCA,
esophageal carcinoma; GBM, glioblastoma; HNSC, head and neck
squamous cell carcinoma; KICH, kidney chromophobe; KIRC, kidney
renal clear cell carcinoma; KIRP, kidney renal papillary carcinoma;
LAML, acute myeloid leukemia; LGG, low-grade gliomas; LIHC, liver
hepatocellular carcinoma; LUAD, lung adenocarcinoma; LUSC, lung
squamous cell carcinoma; MESO, mesothelioma; OV, ovarian; PAAD,
pancreatic adenocarcinoma; PCPG, pheochromocytoma and
paraganglioma; PRAD, prostate adenocarcinoma; READ, rectum
adenocarcinoma; SARC, sarcoma; SKCM, skin cutaneous melanoma; STAD,
stomach adenocarcinoma; TGCT, tenosynovial giant cell tumor; THCA,
thyroid carcinoma; THYM, thymoma; UCEC, uterine corpus endometrial
carcinoma; UCS, uterine carcinosarcoma; UVM, uveal melanoma. |
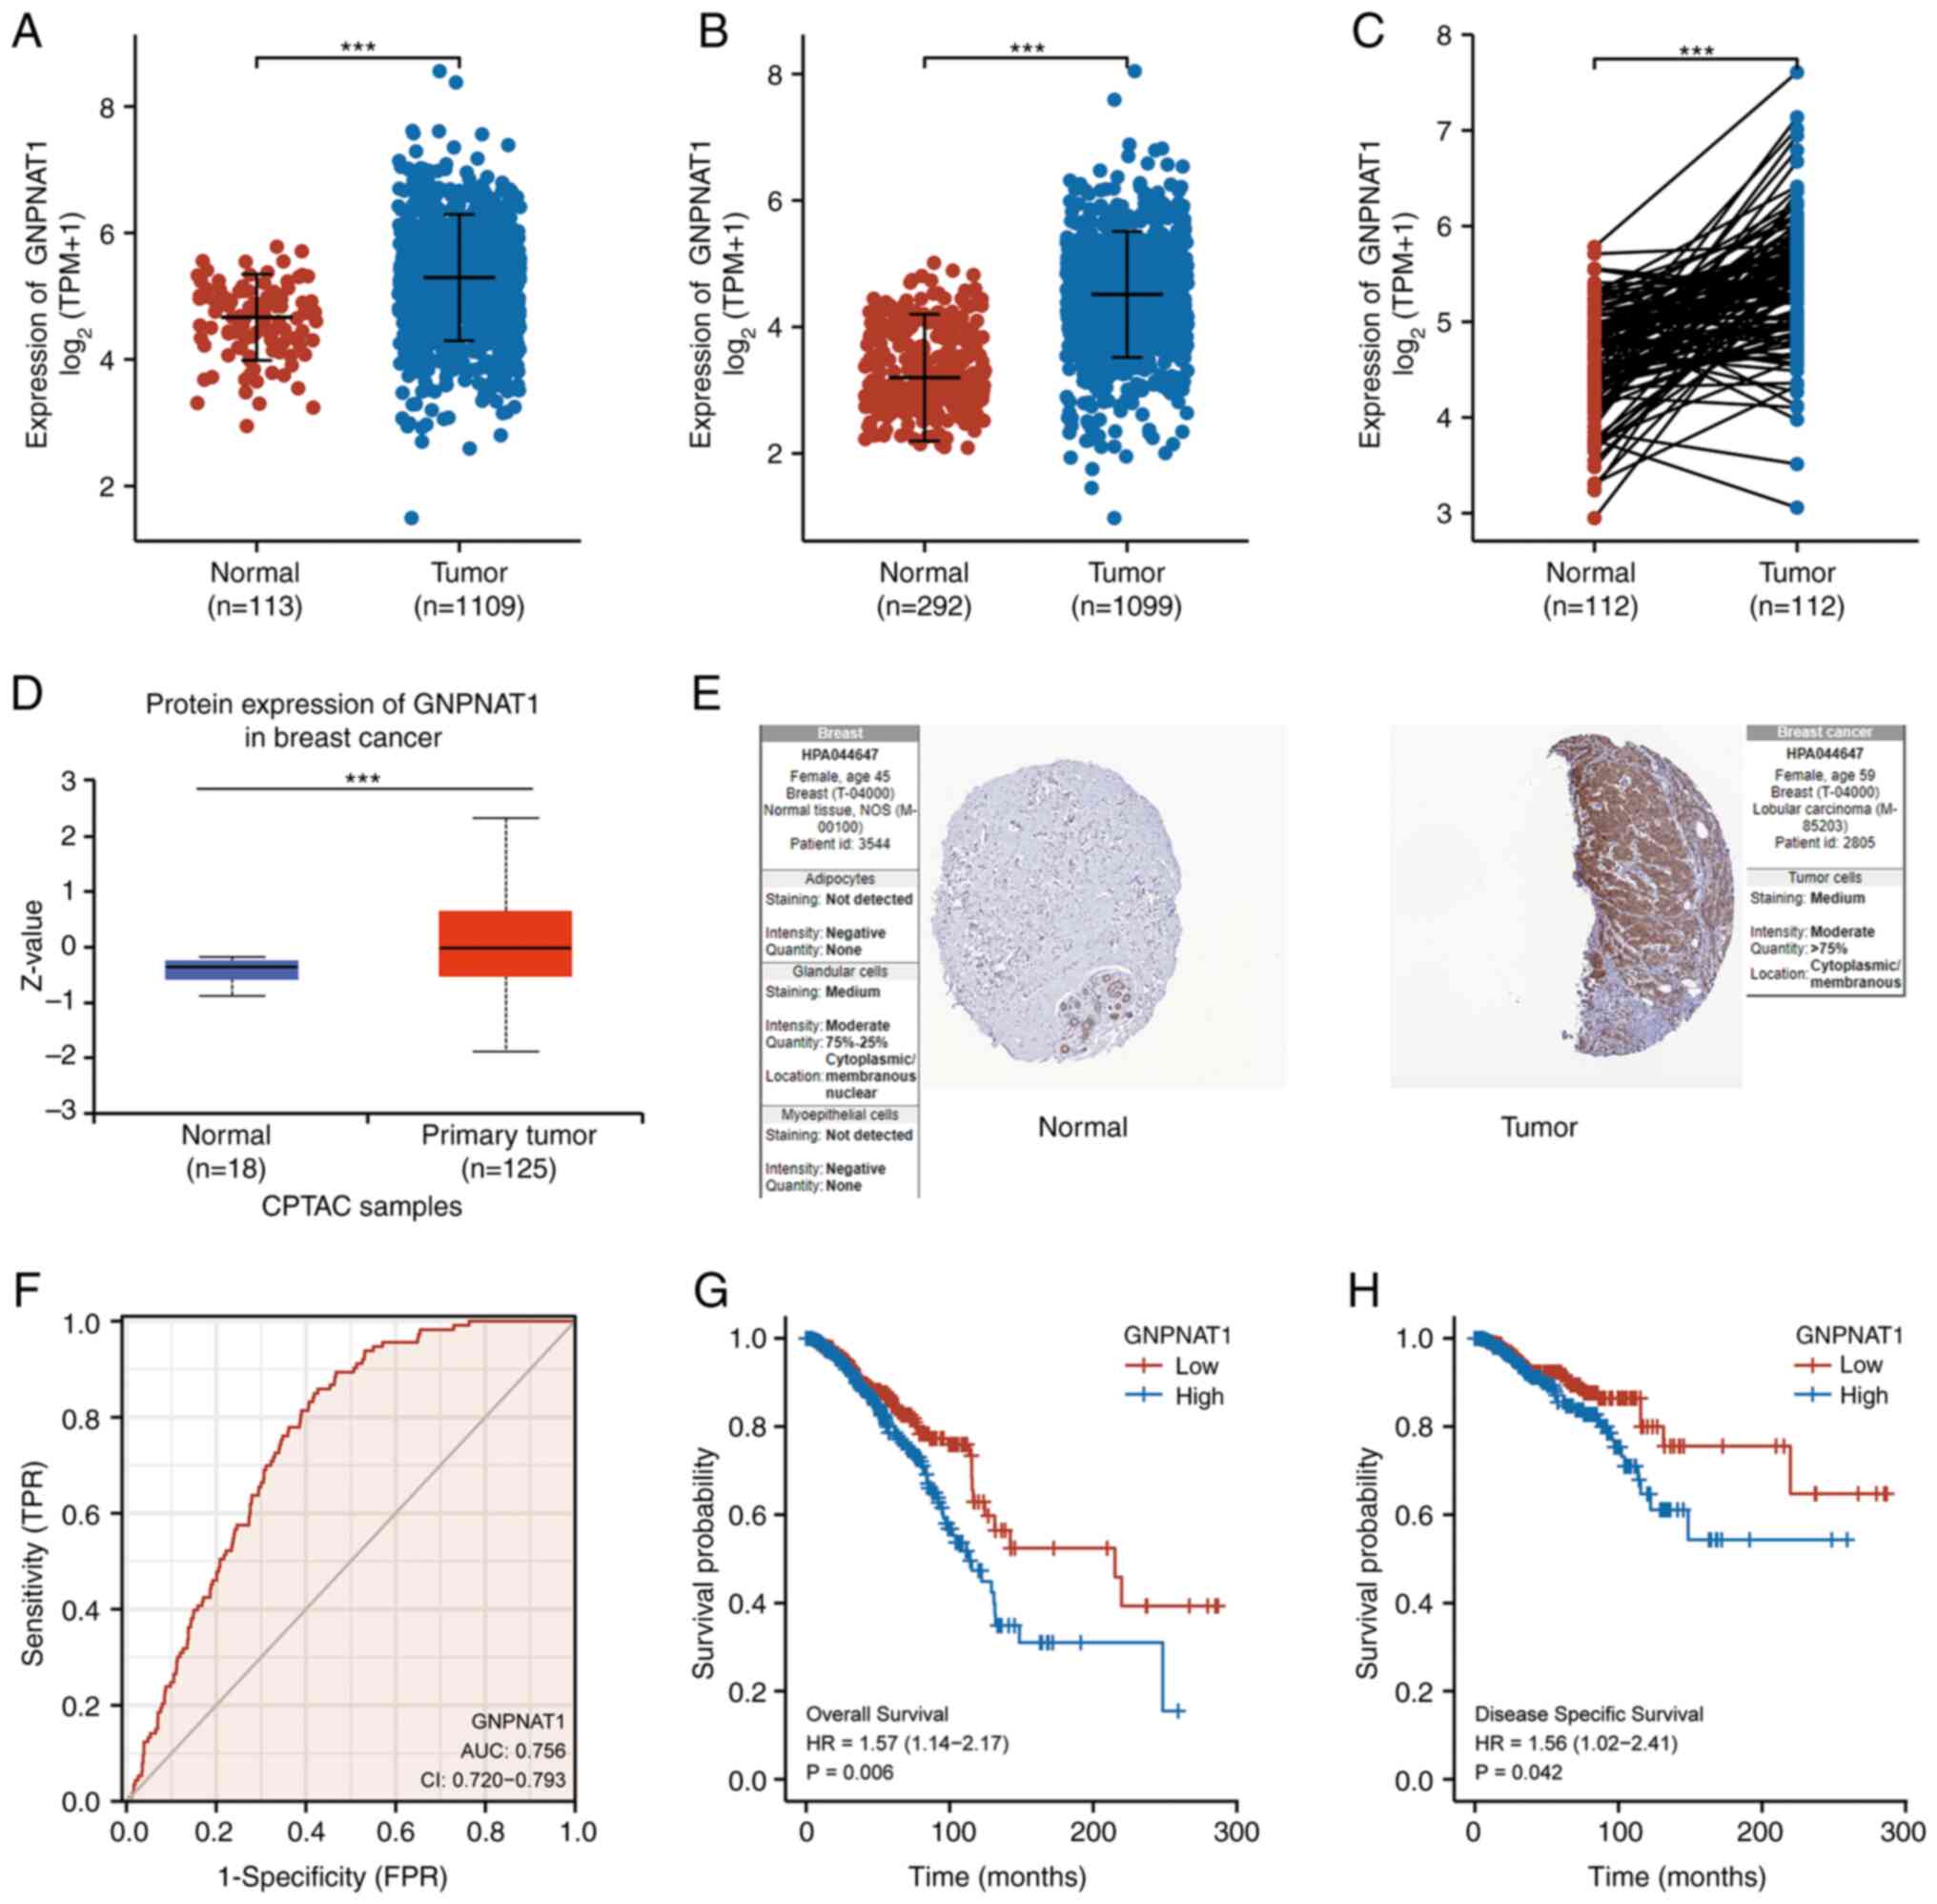
mRNA and protein expression analysis
of GNPNAT1 in BC
The mRNA expression of GNPNAT1 was significantly
increased in BC samples (n=1,109) in comparison with normal breast
tissues (n=113) among TCGA (Fig.
2A). In contrast to the control group (n=292), GNPNAT1
expression remained substantially elevated in 1,099 BC samples with
all of the normal samples when TCGA and the GTEx datasets merged
(Fig. 2B). In addition, GNPNAT1 was
highly expressed in 112 paired BC tissues (Fig. 2C). To further identify the protein
expression of GNPNAT1, protein expression analysis using the CPTAC
dataset provided by the UALCAN database was performed. The results
revealed that primary breast tumors (n=125) presented with a
significantly higher GNPNAT1 protein expression in comparison with
the control group (n=18; P<0.001; Fig. 2D). In addition, GNPNAT1 protein was
substantially expressed in tumor tissues in two representative
immunohistochemistry images from the HPA collection (Fig. 2E).
Diagnostic and prognostic value
analysis
ROC curve analysis was generated to evaluate the
diagnostic value of GNPNAT1 for BRCA. The ROC curve indicated that
the predictive ability of GNPNAT1 in BRCA had a relative accuracy
with an area under the curve (AUC) of 0.756 [95% confidence
interval (CI), 0.720-0.793], as presented in Fig. 2F. Kaplan-Meier (KM) survival curve
analysis was used to evaluate and compare the survival differences
between patients with a high and low expression of GNPNAT1 in
TCGA_BRCA. The results revealed that a higher GNPNAT1 expression
was associated with a poor OS and disease-specific survival (DSS).
In detail, the median OS of the high GNPNAT1 expression group was
113.5 months, whereas in the low expression group it was 215.2
months (log-rank test; P=0.006; Fig.
2G). Similarly, the median disease specific survival of the
high GNPNAT1 expression group was 122.3 months, and vs. 219.8
months in the low expression (log-rank test; P=0.042; Fig. 2H). Univariate and multivariate
analyses of the association of the GNPNAT1 expression with OS among
patients with BC was also performed in TCGA_BRCA. As demonstrated
in Table I, in the univariate Cox
analysis model, age (P<0.001), T stage (P=0.046), N stage
(P<0.001), M stage (P<0.001) and pathological stage (P=0.003)
were associated with OS in patients with BC; in the multivariate
Cox analysis model, the associations of age (P<0.001), N stage
(P=0.003) and M stage (P=0.002) with OS were preserved.
 | Table I.Univariate and multivariate analyses
of the association of GNPNAT1 expression with the overall survival
of patients with breast cancer in TCGA_BRCA. |
Table I.
Univariate and multivariate analyses
of the association of GNPNAT1 expression with the overall survival
of patients with breast cancer in TCGA_BRCA.
|
|
| Univariate
analysis | Multivariate
analysis |
|---|
|
|
|
|
|
|---|
| Characteristic | Total no. of
samples | Hazard ratio (95%
CI) | P-value | Hazard ratio (95%
CI) | P-value |
|---|
| Age, years | 1,082 |
|
|
|
|
|
≤60 | 601 |
|
|
|
|
|
>60 | 481 | 2.020
(1.465-2.784) | <0.001 | 2.079
(1.437-3.008) | <0.001 |
| T stage | 1,079 |
|
|
|
|
| T1 | 276 |
|
|
|
|
|
T2-T4 | 803 | 1.482
(1.007-2.182) | 0.046 | 1.124
(0.599-2.106) | 0.716 |
| N stage | 1,063 |
|
|
|
|
| N0 | 514 |
|
|
|
|
|
N1-N3 | 549 | 2.239
(1.567-3.199) | <0.001 | 1.983
(1.266-3.107) | 0.003 |
| M stage | 922 |
|
|
|
|
| M0 | 902 |
|
|
|
|
| M1 | 20 | 4.254
(2.468-7.334) | <0.001 | 2.915
(1.493-5.690) | 0.002 |
| Pathological
stage | 1,059 |
|
|
|
|
| Stage
I | 180 |
|
|
|
|
| Stage
II–IV | 879 | 2.210
(1.313-3.721) | 0.003 | 1.257
(0.525-3.013) | 0.608 |
|
GNPNAT1 | 1,082 | 1.213
(0.998-1.474) | 0.052 | 1.082
(0.870-1.344) | 0.479 |
Analysis of patient clinicopathologic
characteristics
To examine the association between GNPNAT1 mRNA
expression and the clinicopathological characteristics of BC
samples, logistic regression analysis and the Kruskal-Wallis test
were used. Using age, T stage, M stage, N stage, pathological
stage, prediction analysis of microarray 50 (PAM50), ER state, and
ER status, GNPNAT1 mRNA expression was determined in TCGA_BRCA
samples (Fig. 3). In all
categories, the GNPNAT1 mRNA levels were increased in BRCA tumor
tissues in comparison with normal tissues. The Wilcoxon rank sum
test revealed an association between ethnicity (Caucasian) and
GNPNAT1 mRNA expression (P<0.001; Table II). Using logistic regression, the
connection between the level of GNPNAT1 expression and the
clinicopathological characteristics of BC tissues was also
investigated. The results revealed a significant association
between GNPNAT1 expression and N stage (P=0.003), PR status
(P<0.001), ER status (P<0.001) and HER2 status (P=0.001;
Table III).
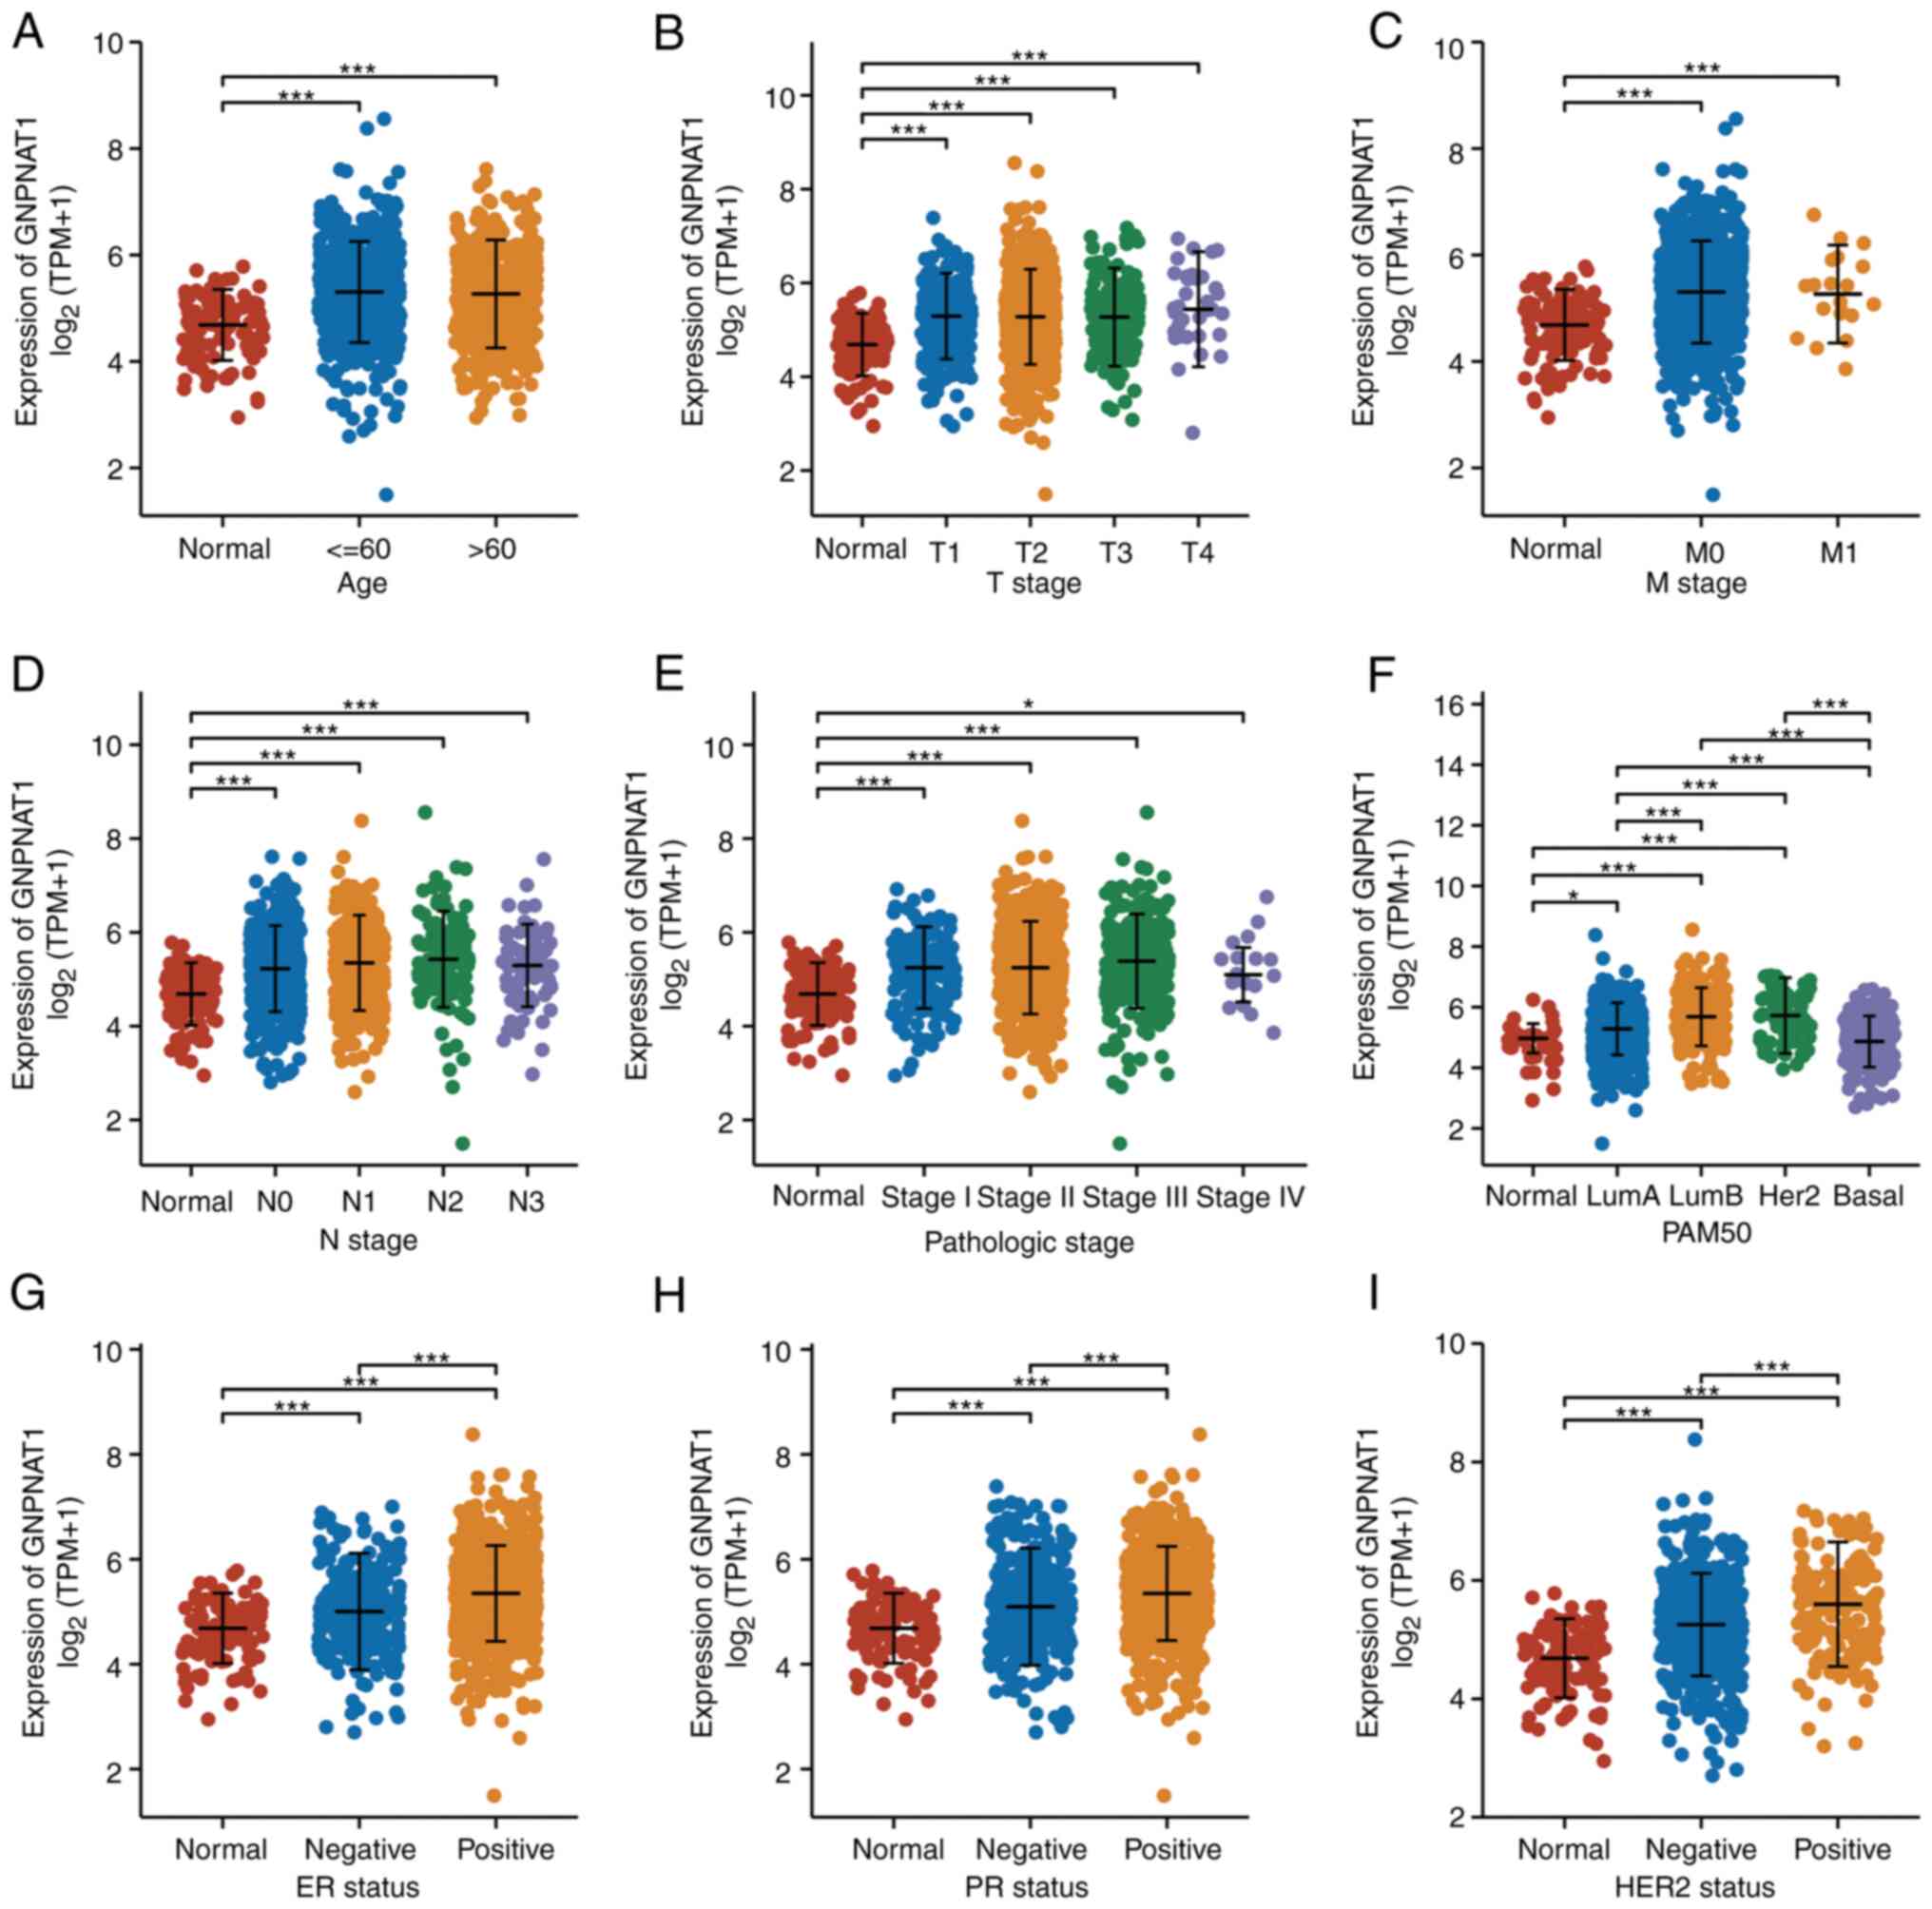 | Figure 3.Association of GNPNAT1 expression
with clinicopathological characteristics in TCGA_BRCA. Associations
between GNPNAT1 mRNA expression and clinicopathological
characteristics in BRCA patients based on (A) age, (B) T stage, (C)
M stage, (D) N stage, (E) pathological stage, (F) PAM50, (G) ER
status, (H) PR status and (I) HER2 status. *P<0.05 and
***P<0.001. GNPNAT1, glucosamine-phosphate N-acetyltransferase
1; PAM50, prediction analysis of microarray 50; ER, estrogen
receptor; PR, progesterone. |
| Table II.Association of GNPNAT1 expression
with clinicopathological characteristics in breast cancer. |
Table II.
Association of GNPNAT1 expression
with clinicopathological characteristics in breast cancer.
| Characteristic | Low expression of
GNPNAT1 (n=541) | High expression of
GNPNAT1 (n=542) | P-value |
|---|
| Age, n (%) |
|
| 0.411 |
|
≤60 | 293 (27.1%) | 308 (28.4%) |
|
|
>60 | 248 (22.9%) | 234 (21.6%) |
|
| Race, n (%) |
|
| <0.001 |
|
Asian | 23 (2.3%) | 37 (3.7%) |
|
| African
American | 119 (12%) | 62 (6.2%) |
|
|
Caucasian | 373 (37.5%) | 380 (38.2%) |
|
| T stage, n (%) |
|
| 0.640 |
| T1 | 137 (12.7%) | 140 (13%) |
|
| T2 | 318 (29.4%) | 311 (28.8%) |
|
| T3 | 72 (6.7%) | 67 (6.2%) |
|
| T4 | 14 (1.3%) | 21 (1.9%) |
|
| N stage, n (%) |
|
| 0.013 |
| N0 | 283 (26.6%) | 231 (21.7%) |
|
| N1 | 168 (15.8%) | 190 (17.9%) |
|
| N2 | 47 (4.4%) | 69 (6.5%) |
|
| N3 | 37 (3.5%) | 39 (3.7%) |
|
| M stage, n (%) |
|
| 1.000 |
| M0 | 438 (47.5%) | 464 (50.3%) |
|
| M1 | 10 (1.1%) | 10 (1.1%) |
|
| Pathological stage,
n (%) |
|
| 0.103 |
| Stage
I | 98 (9.2%) | 83 (7.8%) |
|
| Stage
II | 323 (30.5%) | 296 (27.9%) |
|
| Stage
III | 106 (10%) | 136 (12.8%) |
|
| Stage
IV | 10 (0.9%) | 8 (0.8%) |
|
| Table III.Associations of GNPNAT1 expression
with clinicopathological features estimated by logistic regression
analysis. |
Table III.
Associations of GNPNAT1 expression
with clinicopathological features estimated by logistic regression
analysis.
|
Characteristics | Total no. of
samples | Odds ratio
(OR) | P-value |
|---|
| Age (>60 vs.
≤60) | 1,083 | 0.898
(0.706-1.141) | 0.377 |
| T stage (T2-T4 vs.
T1) | 1,080 | 0.966
(0.735-1.270) | 0.807 |
| N stage (N1-N3 vs.
N0) | 1,064 | 1.449
(1.138-1.846) | 0.003 |
| M stage (M1 vs.
M0) | 922 | 0.944
(0.384-2.322) | 0.899 |
| Pathologic stage
(stage II–IV vs. Stage I) | 1,060 | 1.183
(0.859-1.633) | 0.304 |
| PR status (positive
vs. negative) | 1,030 | 1.882
(1.447-2.454) | <0.001 |
| ER status (positive
vs. negative) | 1,033 | 2.511
(1.858-3.416) | <0.001 |
| HER2 status
(positive vs. negative) | 715 | 1.800
(1.257-2.596) | 0.001 |
| Radiation therapy
(yes vs. no) | 987 | 0.929
(0.722-1.194) | 0.564 |
Co-expression gene analysis
Using LinkedOmics, GNPNAT1 co-expression networks in
TCGA_BRCA cohort were obtained. The number of positively and
negatively associated genes with GNPNAT1 was 6,137 and 7,494,
respectively (FDR <0.01). As shown in Fig. 4A, dark red and green dots represent
positively and negatively correlated genes, respectively. The top
50 most significantly co-expressed genes for both favorable and
unfavorable outcomes were then utilized to generate heatmaps
(Table SII, Table SIII and Fig. 4B and C). Three genes were
significantly positively linked with GNPNAT1 expression: The
proteasome 26S subunit, ATPase 6 (PSMC6; Fig. 4D), L-2-hydroxyglutarate
dehydrogenase (L2HGDH; Fig. 4E) and
serine/threonine/tyrosine-interacting protein (STYX; Fig. 4F). Rho guanine nucleotide exchange
factor 1 (ARHGEF1; Fig. 4G), the
FES proto-oncogene, tyrosine kinase (FES; Fig. 4H) and AT-rich interaction domain 5A
(ARID5A; Fig. 4I) were the three
most significantly negatively correlated genes. Subsequently, a
KM-OS curve analysis on the top 50 positively correlated genes was
performed, using the survival analysis module of the GEPIA2
database. The results revealed that only three genes were highly
expressed and associated with the poor prognosis in patient with
BC, including tumor protein D52 (TPD52; Fig. 4J), signal recognition particle 54
(SRP54; Fig. 4K) and LRAT domain
containing 2 (LRATD2, also known as FAM84B; Fig. 4L).
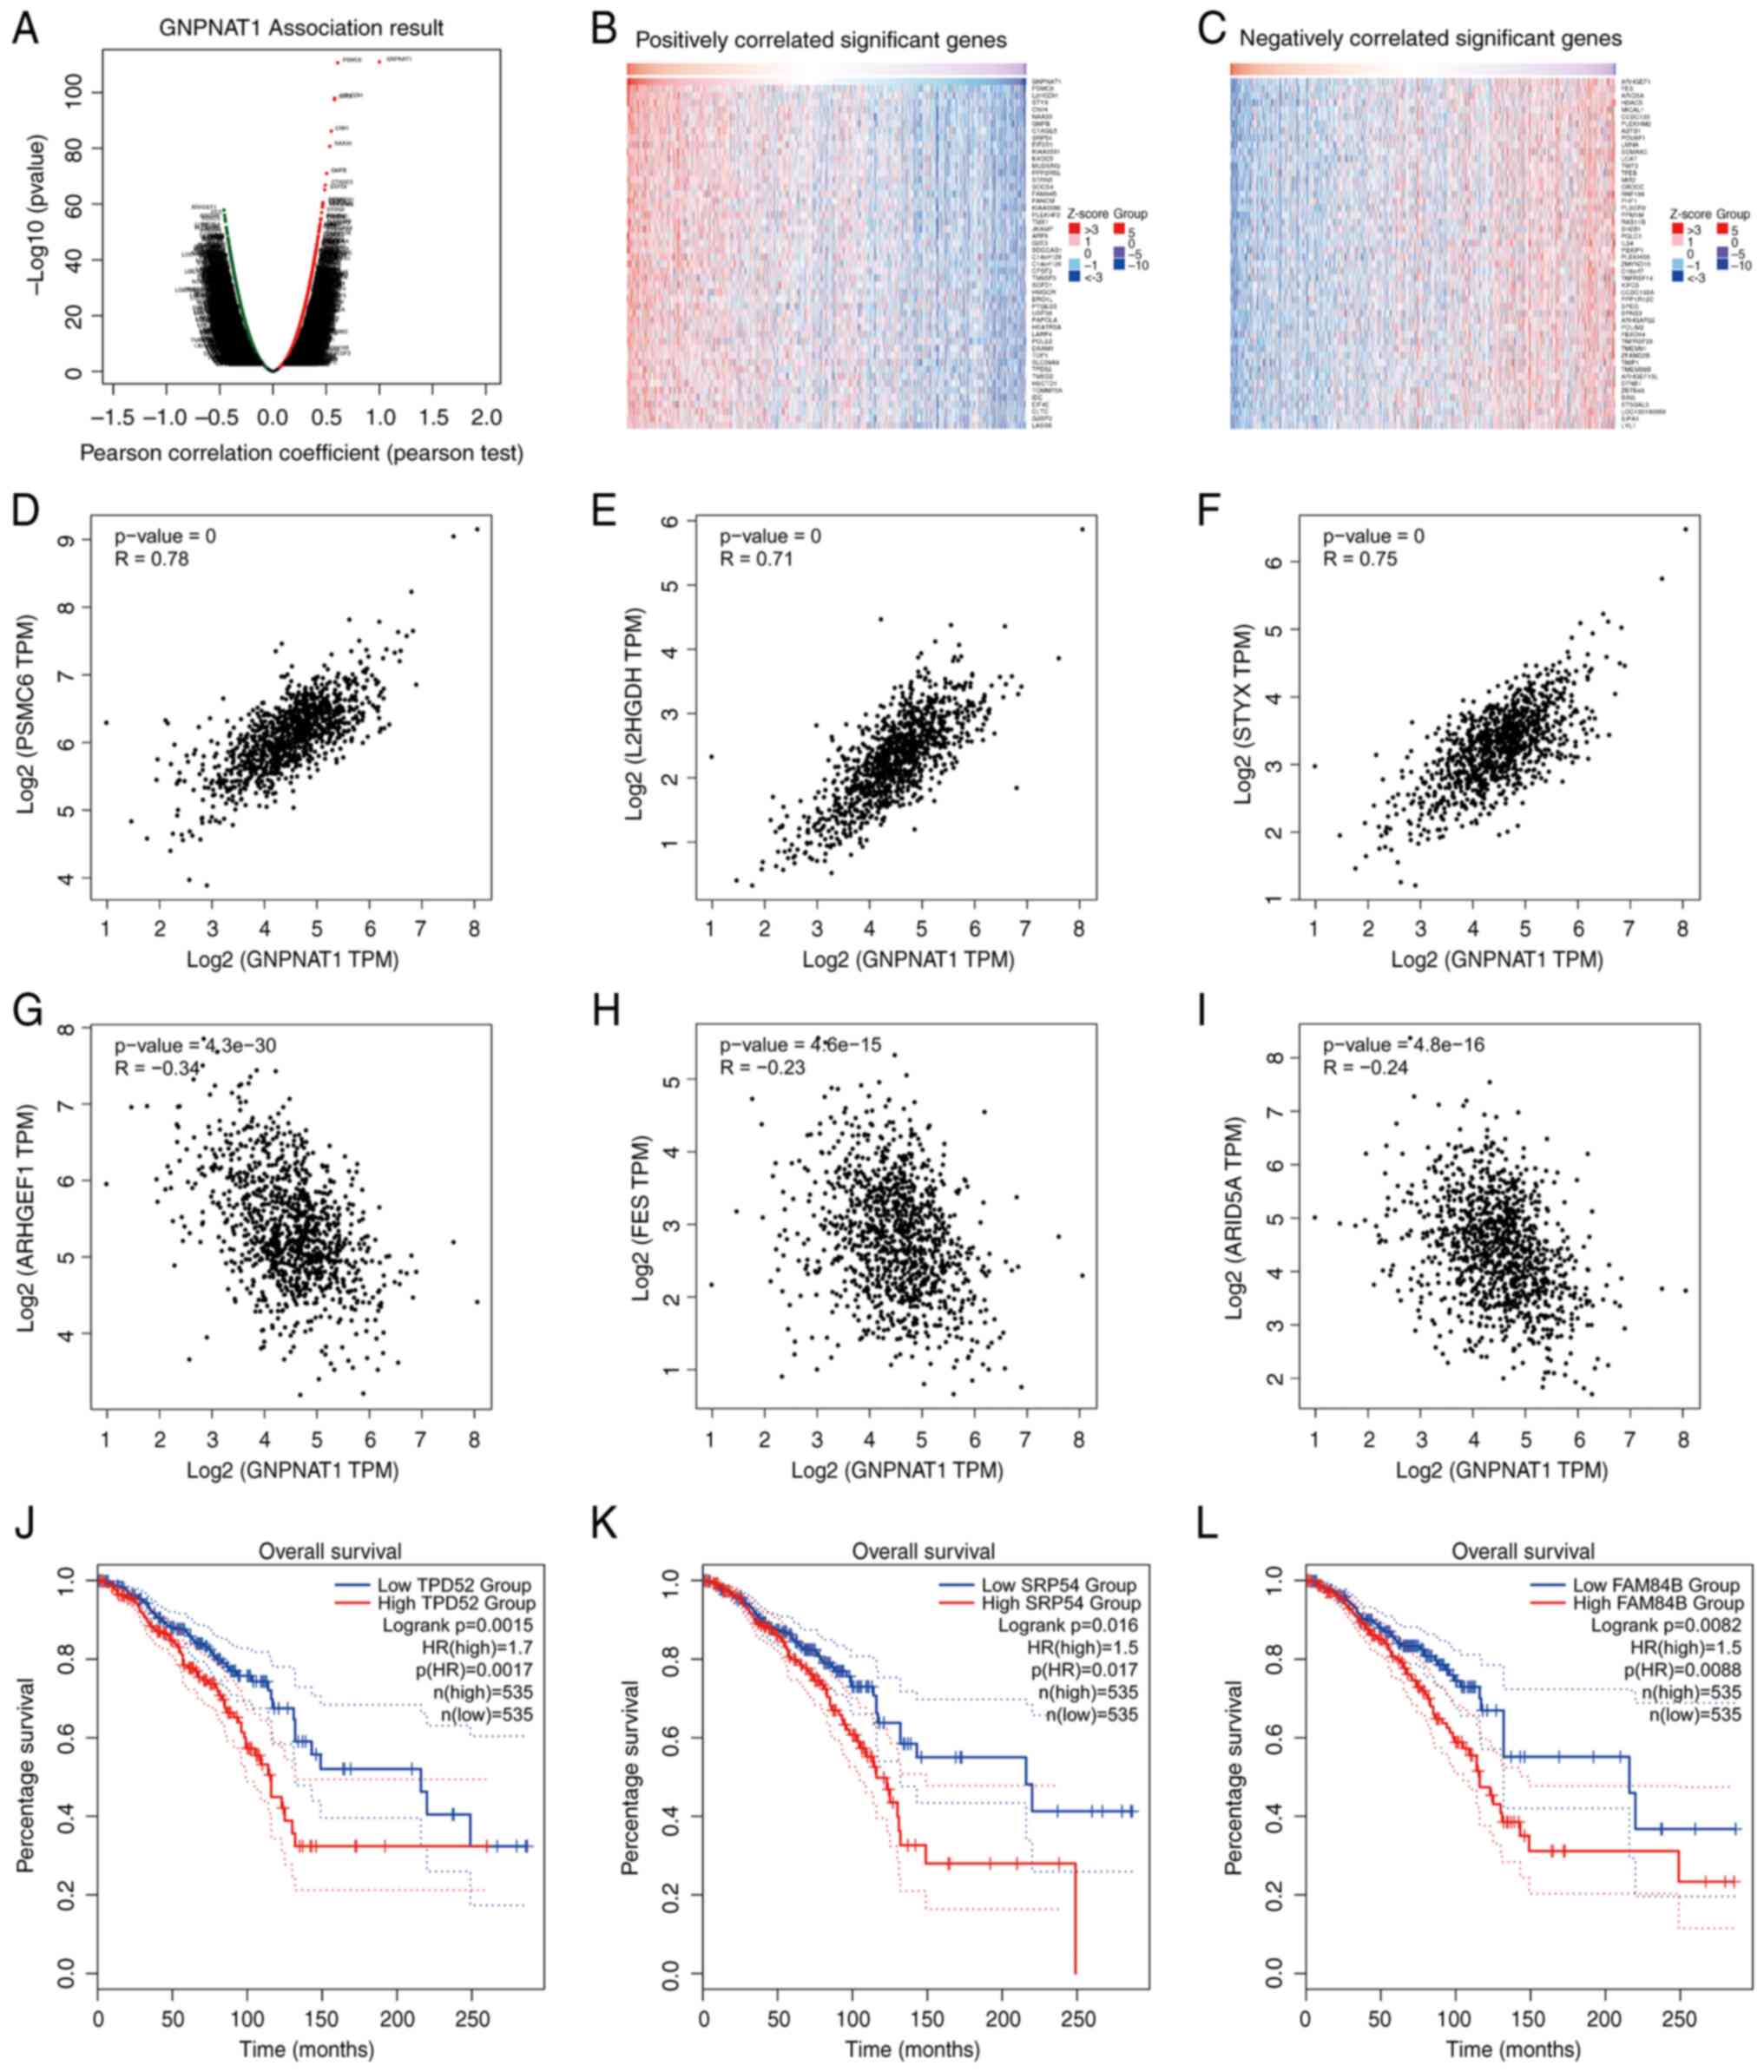 | Figure 4.GNPNAT1 co-expression genes in
TCGA_BRCA cohort. (A) The global GNPNAT1 highly correlated genes
identified by Pearson's correlation analysis using RNAseq data on
the HiSeq RNA platform in TCGA_BRCA cohort. Red and green dots
represent positively and negatively significantly correlated genes
with GNPNAT1, respectively. (B and C) Heatmaps showing top 50 genes
positively and negatively correlated with GNPNAT1 in TCGA_BRCA.
(D-F) Correlation analysis of GNPNAT1 between representative top
three positively correlated genes: PSMC6, L2HGDH, STYX. (G-I)
Correlation analysis of GNPNAT1 between representative top 3
negatively genes: ARHGEF1, FES, ARID5A. (J-L) OS curves of three
positively correlated genes: TPD52, SRP54, FAM84B. GNPNAT1,
glucosamine-phosphate N-acetyltransferase 1; PSMC6, the proteasome
26S subunit, ATPase 6; L2HGDH, L-2-hydroxyglutarate dehydrogenase;
STYX, serine/threonine/tyrosine-interacting protein; ARHGEF1, Rho
guanine nucleotide exchange factor 1; FES, FES proto-oncogene,
tyrosine kinase; ARID5A, AT-rich interaction domain 5A; OS, overall
survival; TPD52, tumor protein D52; SRP54, signal recognition
particle 54; FAM84B, LRAT domain containing 2. |
PPI network and functional enrichment
analysis
The ‘Similar Genes Detection’ module was used to
obtain 1,000 genes positively correlated with GNPNAT1 in the GEPIA2
database (Table SIV), and the
‘Correlation’ module was further used to obtain 1,608 genes
positively correlated with GNPNAT1 in BRCA in the UALCAN database
(Table SV). After using the Veen
tool, the ‘clusterProfile’ R program was used to investigate GO and
KEGG enrichment for 847 genes (Table
SVI). As demonstrated in Fig.
5A, the majority of the genes were related to coated vesicles,
the ubiquitin ligase complex, and cytoplasmic stress granules
involved in nuclear transport, Golgi vesicle transport,
ubiquitin-like protein transferase activity, ribonucleoprotein
complex binding, Salmonella infection and ubiquitin-mediated
proteolysis, as revealed by the KEGG analysis results. For PPI
network analysis, the interactions of 50 physically bound proteins
with experimentally validated GNPNAT1-binding proteins were
extracted from the STRING network (Fig.
5B).
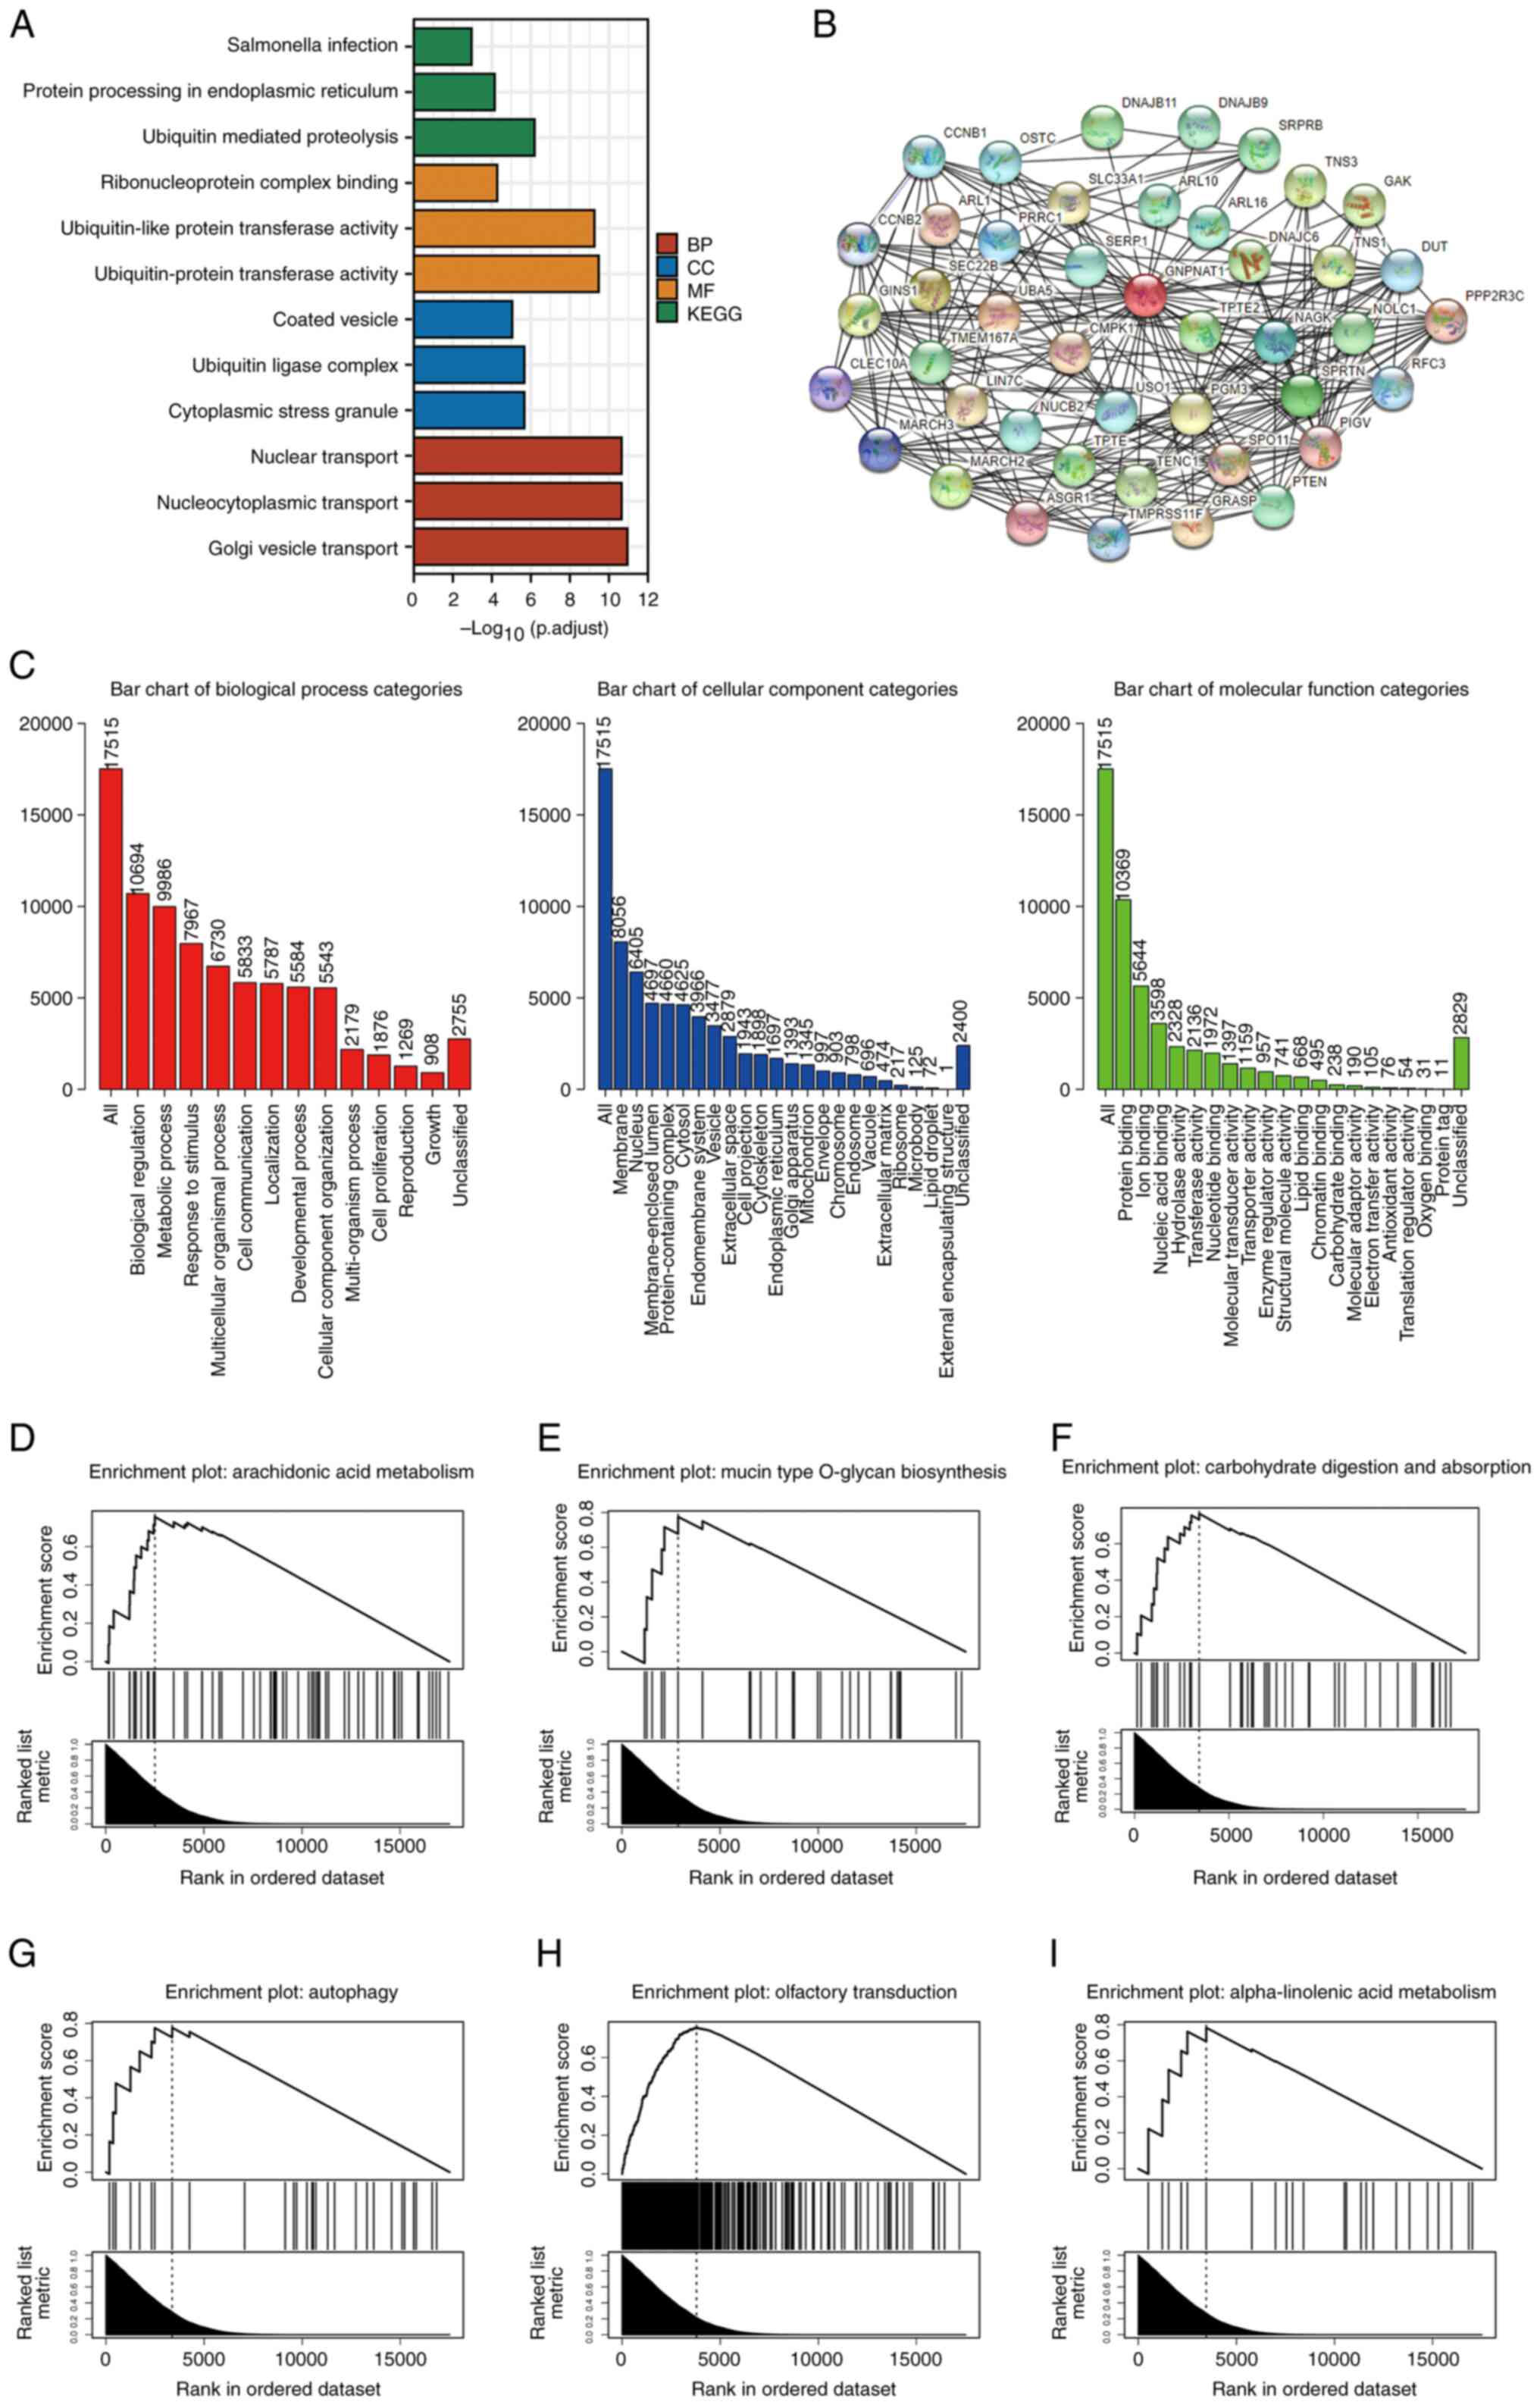 | Figure 5.Functional enrichment analysis of
GNPNAT1 in BC using GO, KEGG and GSEA. (A) A total number of 50
GNPNAT1-related proteins were identified using STRING. (B) GO terms
(including BP, MF and CC) and KEGG of genes most strongly related
with GNPNAT1. (C) GSEA analysis results of GNPNAT1 on GO terms.
GSEA analysis results of GNPNAT1 on KEGG terms were: (D)
Arachidonic acid metabolism, (E) Mucin type O-glycan biosynthesis,
(F) Carbohydrate digestion and absorption, (G) Autophagy, (H)
Olfactory transduction and (I) alpha-Linolenic acid metabolism.
GNPNAT1, glucosamine-phosphate N-acetyltransferase 1; BC, breast
cancer; GO, gene ontology; KEGG, Kyoto Encyclopedia of Genes and
Genomes; GSEA, gene set enrichment analysis; BP, Biological
Pathway; MF, Molecular Function; CC, Cellular Components. |
For GSEA, data associated with GNPNAT1 (Table SVII) were upload on the WebGestalt
database. The height of the bar, as revealed in Fig. 5C, indicates the total number of IDs
in the user list category. For biological process categories, there
were 10,694 genes associated with biological regulation; for
cellular component categories, there were 8,056 genes associated
with membrane; for molecular function categories, there were 10,369
genes associated with protein binding. The KEGG data analysis
revealed the top six FDRs of pathways were arachidonic acid
metabolism, mucin type O-glycan biosynthesis, carbohydrate
digestion and absorption, autophagy, olfactory transduction and
alpha-Linolenic acid metabolism (Fig.
5D-I).
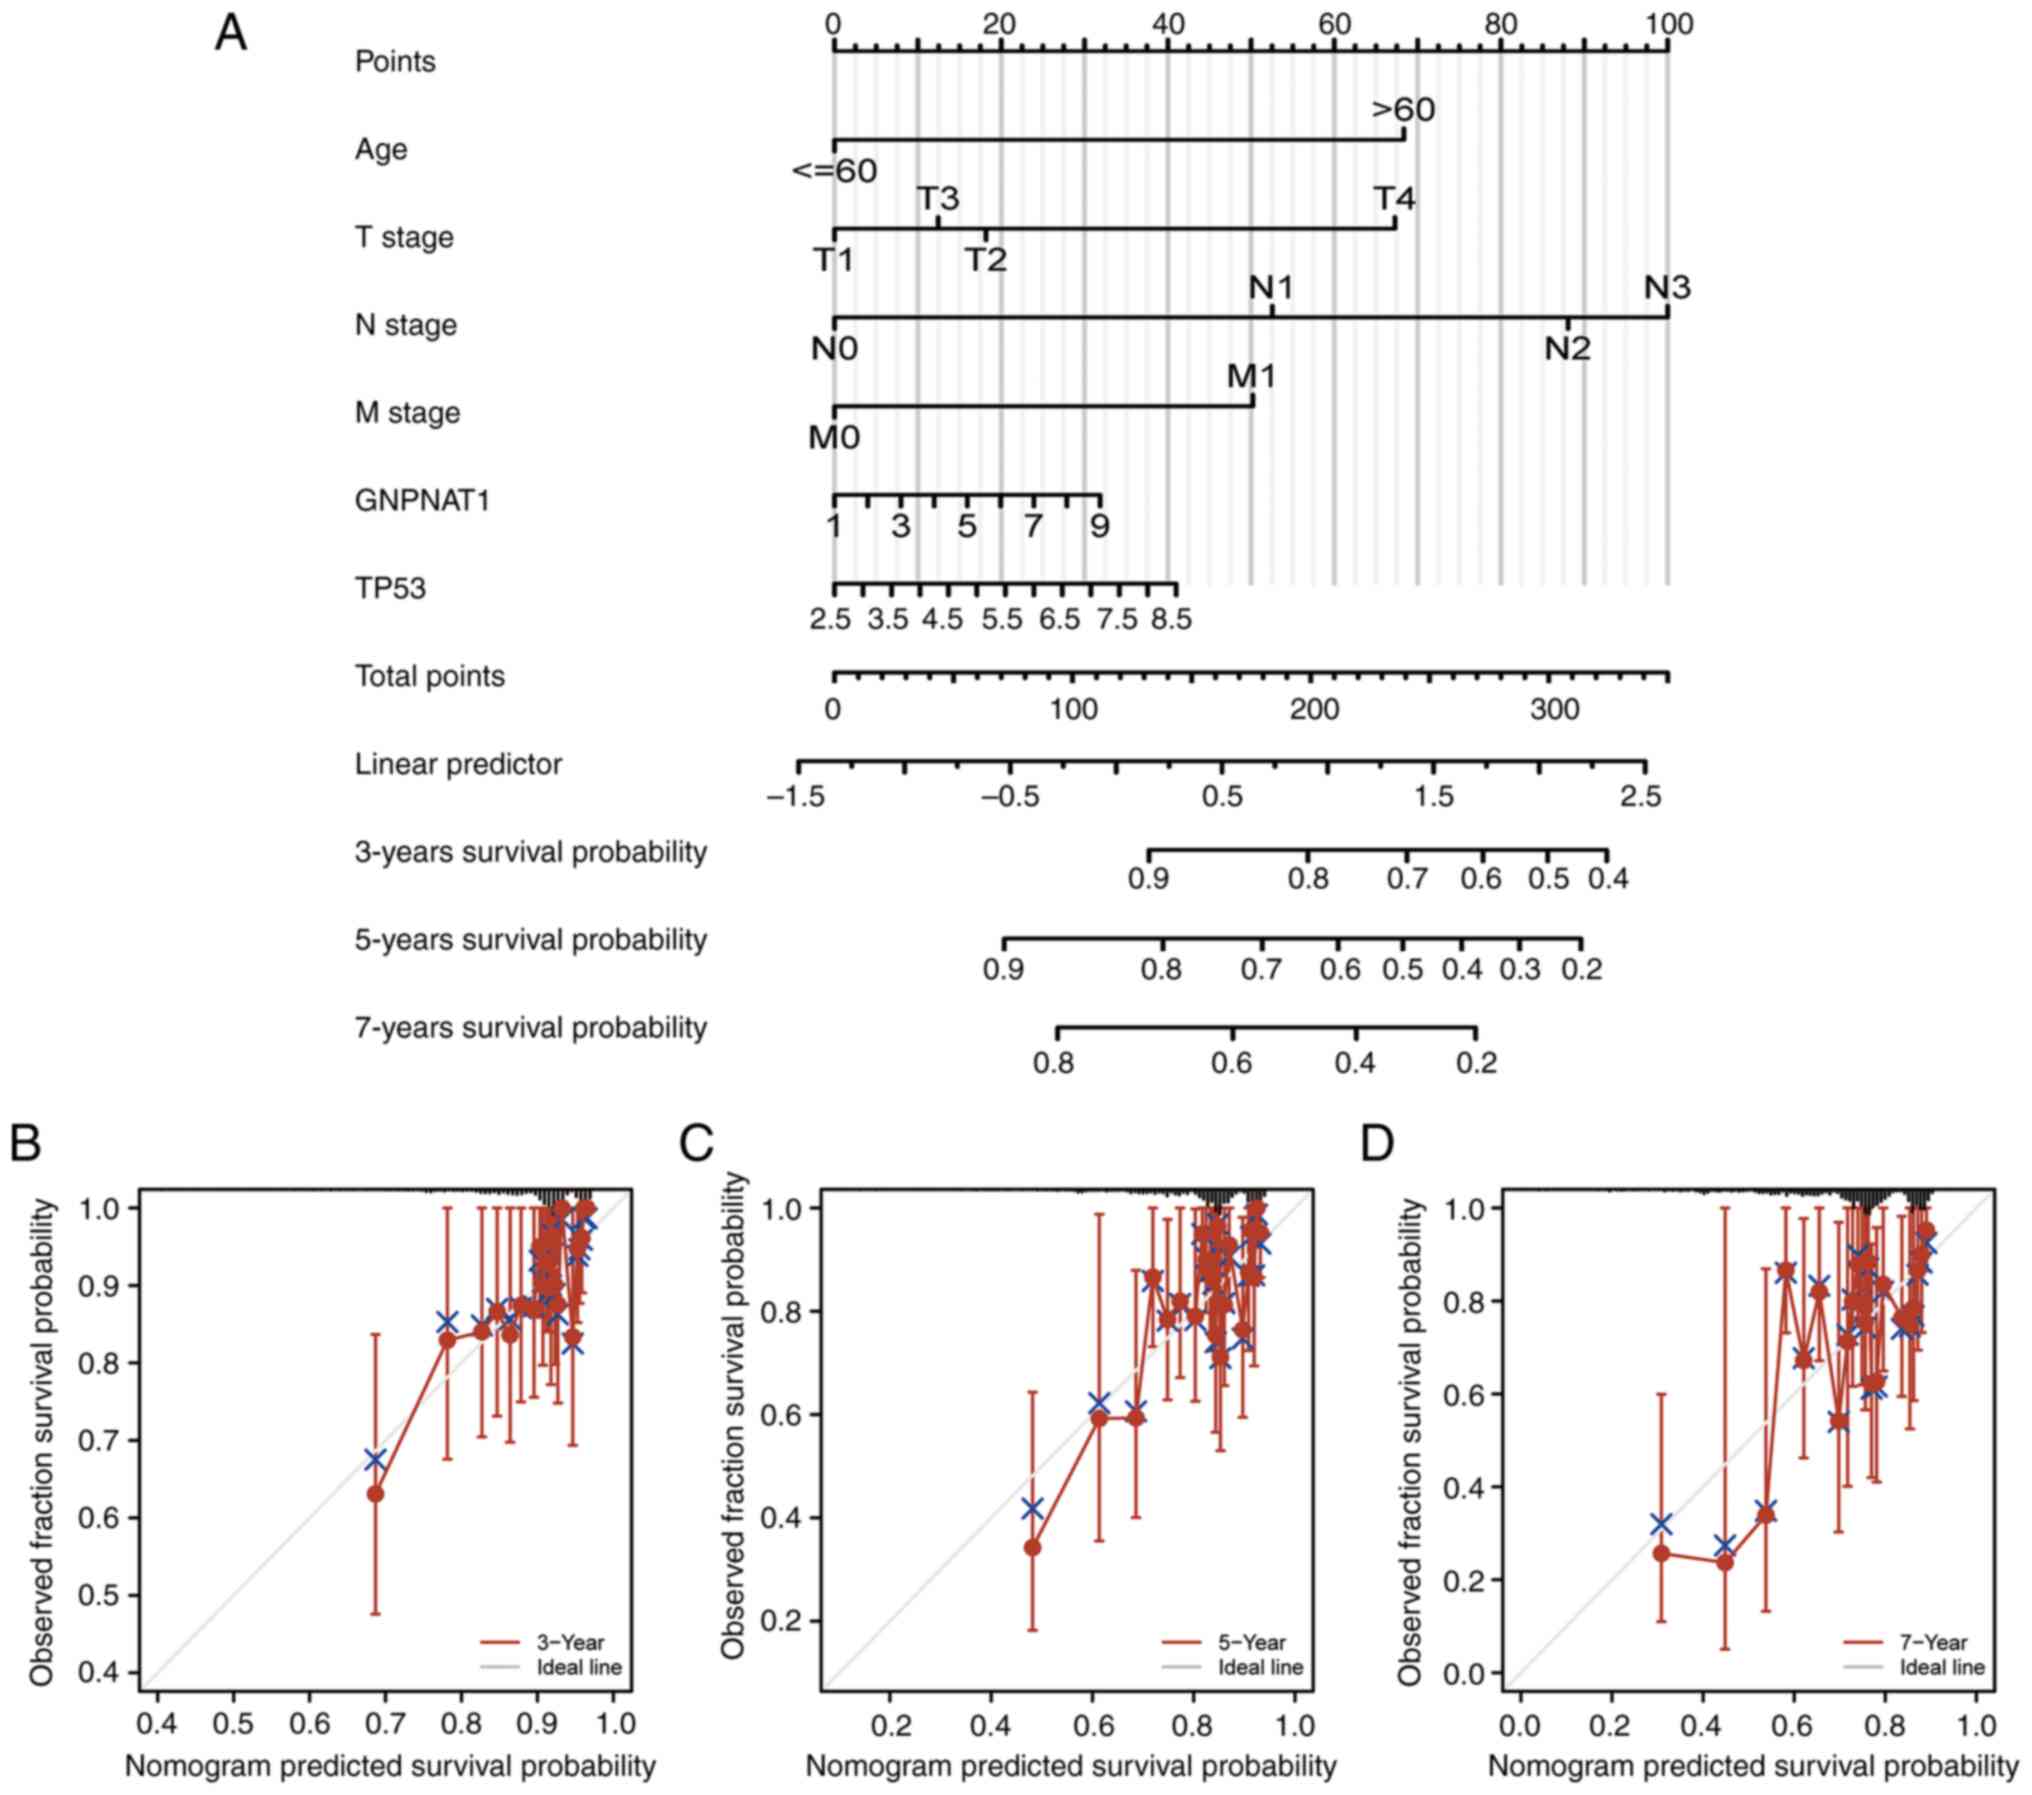
Nomogram diagram and calibration
analysis
The prognosis of patients with BC may now be
predicted using a factor-based nomogram that is related to OS. As
presented in Fig. 6A, prognosis
worsens as the number of dots on the nomogram increases. In
addition, a calibration curve was used to evaluate how predictions
affected the nomogram (Fig. 6B-D).
While using the bootstrapping technique, the nomogram's C-index was
0.702 (95% CI, 0.676-0.728), indicating a moderate degree of
accuracy in predicting OS for patients with BC.
Immune infiltration analysis
According to the Spearman's Rho correlation analysis
on the TISIDB database, the associations between the abundance of
28 TILs and expression of GNPNAT1 across human pan-cancer is
presented in Fig. 7A. The red color
indicates a positive correlation with GNPNAT1 mRNA expression, and
blue indicates a negative correlation. In addition, the expression
of GNPNAT1 was significantly positively correlated with the levels
of immune cell infiltration of Th2 cells and T-helper cells and
negatively correlated with plasmacytoid dendritic cells (pDCs),
CD8+ T-cells and cytotoxic T-cells (Fig. 7B). Furthermore, the enrichment
scores of Th2 cells and T-helper cells in the GNPNAT1 high
expression group were markedly higher than those in the GNPNAT1 low
expression group, whereas the enrichment scores of pDC, CD8 T-cells
and cytotoxic T-cells in the GNPNAT1 high expression group were
markedly reduced, as compared with the GNPNAT1 low expression group
(P<0.001 in all comparisons; Fig.
7C-H).
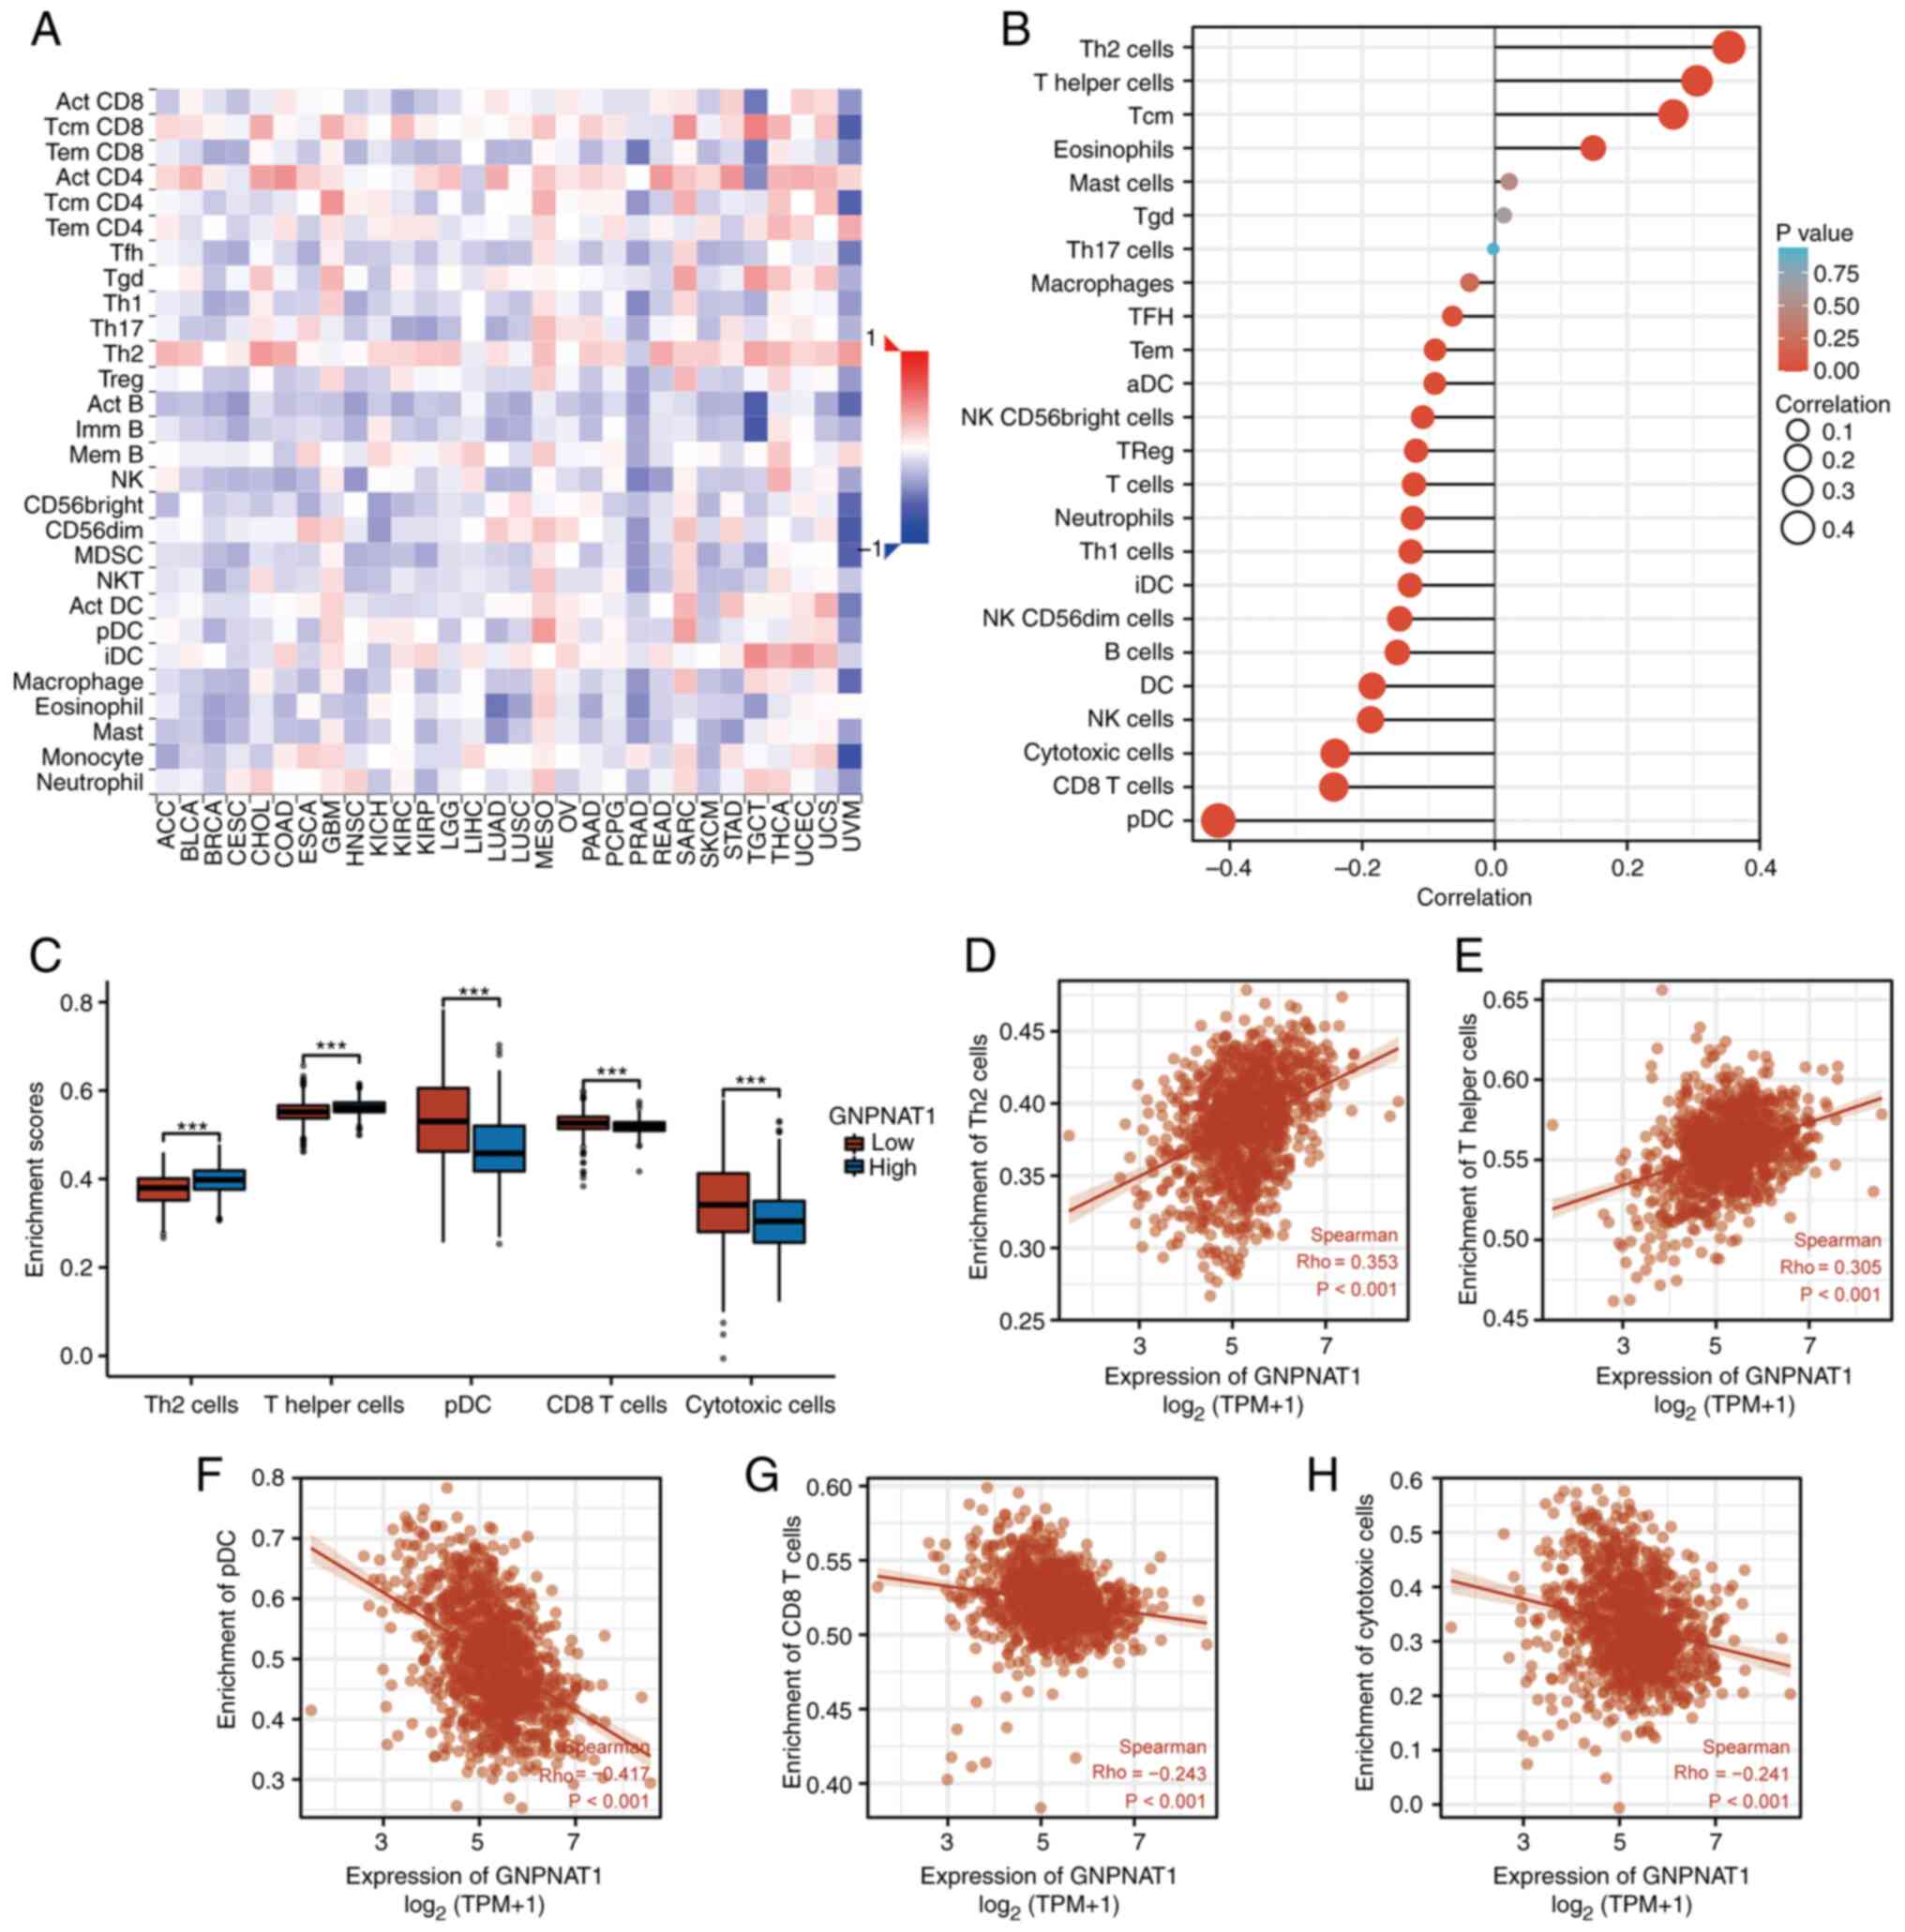 | Figure 7.Correlation of GNPNAT1 expression
with immune infiltration level in BC. (A) Correlation between
GNPNAT1 expression and relative abundance of 28 types of TILs
across human pan-cancer on TISIDB database. (B) Correlation between
GNPNAT1 expression and relative abundance of 24 types of immune
cell in BC. (C) Comparison of immune infiltration levels of immune
cells (including Th2 cells, T-helper cells, pDC, CD8+
T-cells and cytotoxic cells) between the high- and low-GNPNAT1
expression groups. (D-H) Correlations between the relative
enrichment scores of immune cells (including Th2 cells, T-helper
cells, pDC, CD8+ T-cells and cytotoxic cells) and the
expression of GNPNAT1. ***P<0.001. GNPNAT1,
glucosamine-phosphate N-acetyltransferase 1; BC, breast cancer;
TILs, tumour-infiltrating lymphocytes; pDC, plasmacytoid dendritic
cells. |
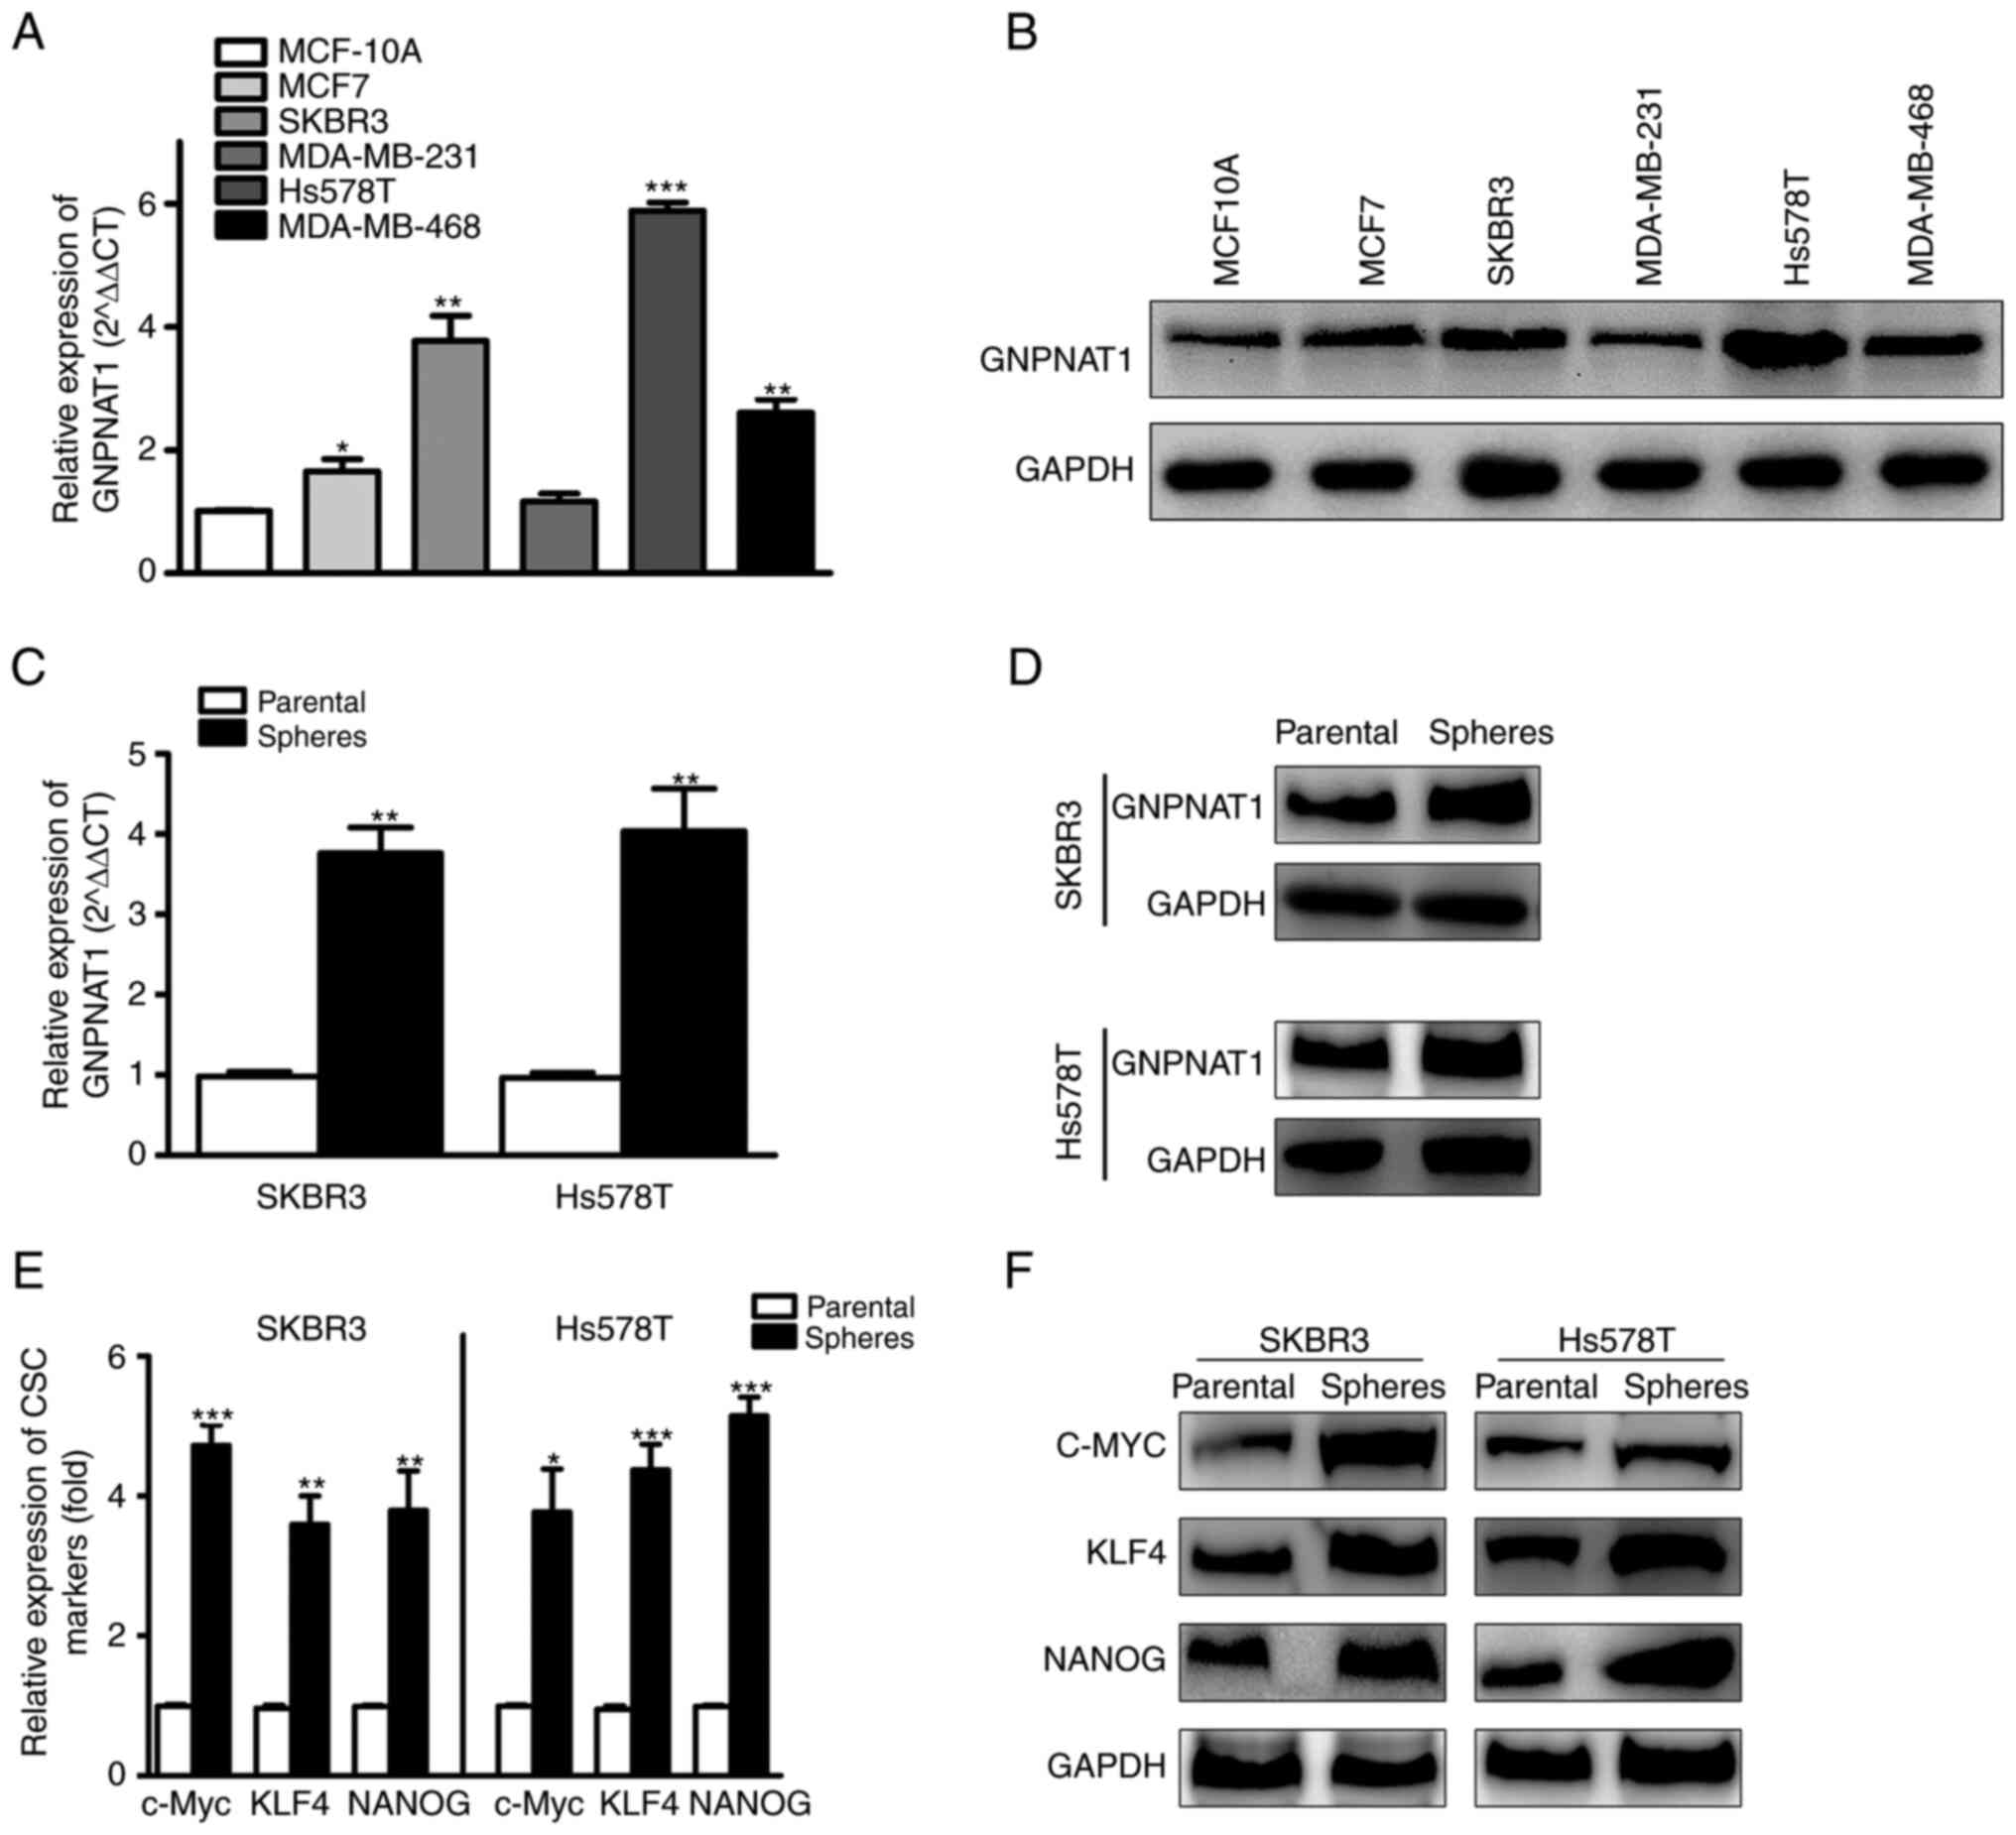
mRNA and protein expression analysis
of GNPNAT1 in BC cells and CSCs
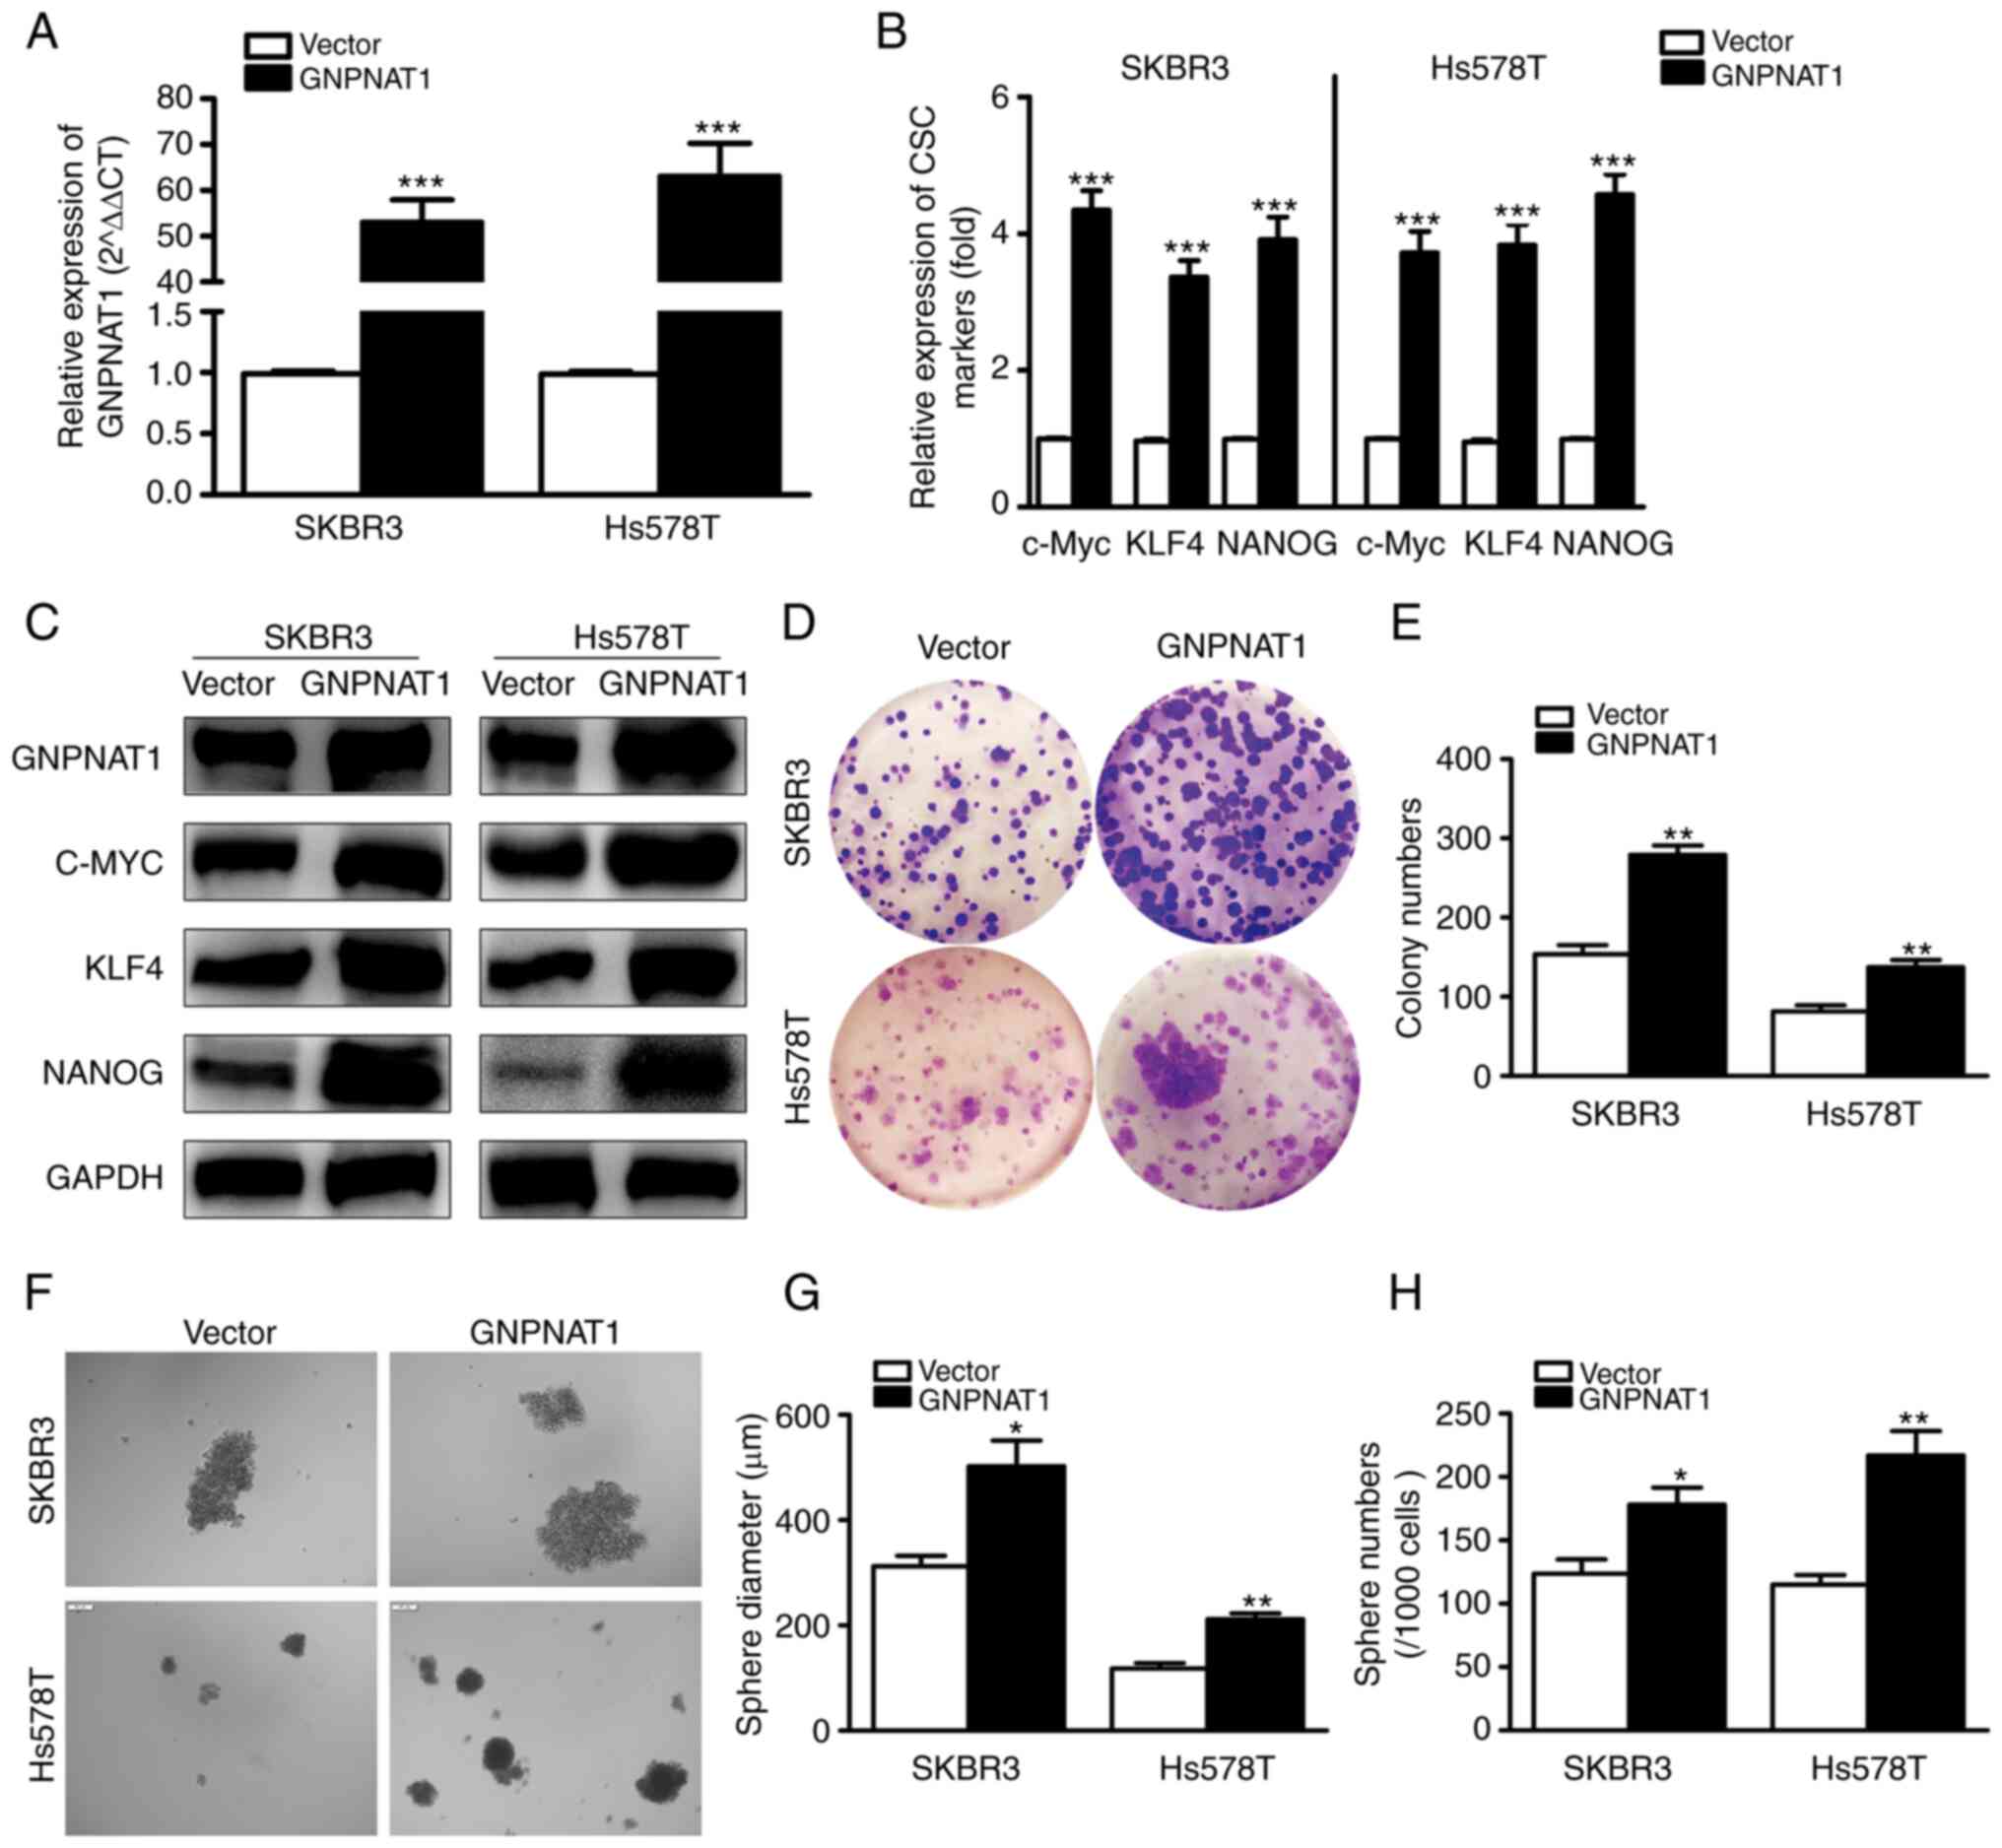
The Expression of GNPNAT1 was upregulated in the
MCF7, SKBR3, Hs578T and MDA-MB-468 BC cell lines in comparison with
the MCF10A normal breast cell line. Using RT-qPCR and western blot
analysis, the mRNA (Fig. 8A) and
protein (Fig. 8B) expression levels
of GNPNAT1 were evaluated. GNPNAT1 expression in the SKBR3 and
Hs578T cell lines was markedly higher than in the other cell lines.
Thus, these two cell lines were used in further analyses. Moreover,
GNPNAT1 expression was considerably increased in mammospheres, in
relation to adherent cells (Fig. 8C and
D). To determine whether BCSCs had been effectively enriched,
the expression levels of CSC markers, including c-MYC, KLF4 and
NANOG, were measured in mammosphere cells (Fig. 8E and F). The considerable increase
in the mRNA and protein expression of CSC markers in breast
spheroid cells revealed that the mammospheres included a high
number of CSCs.
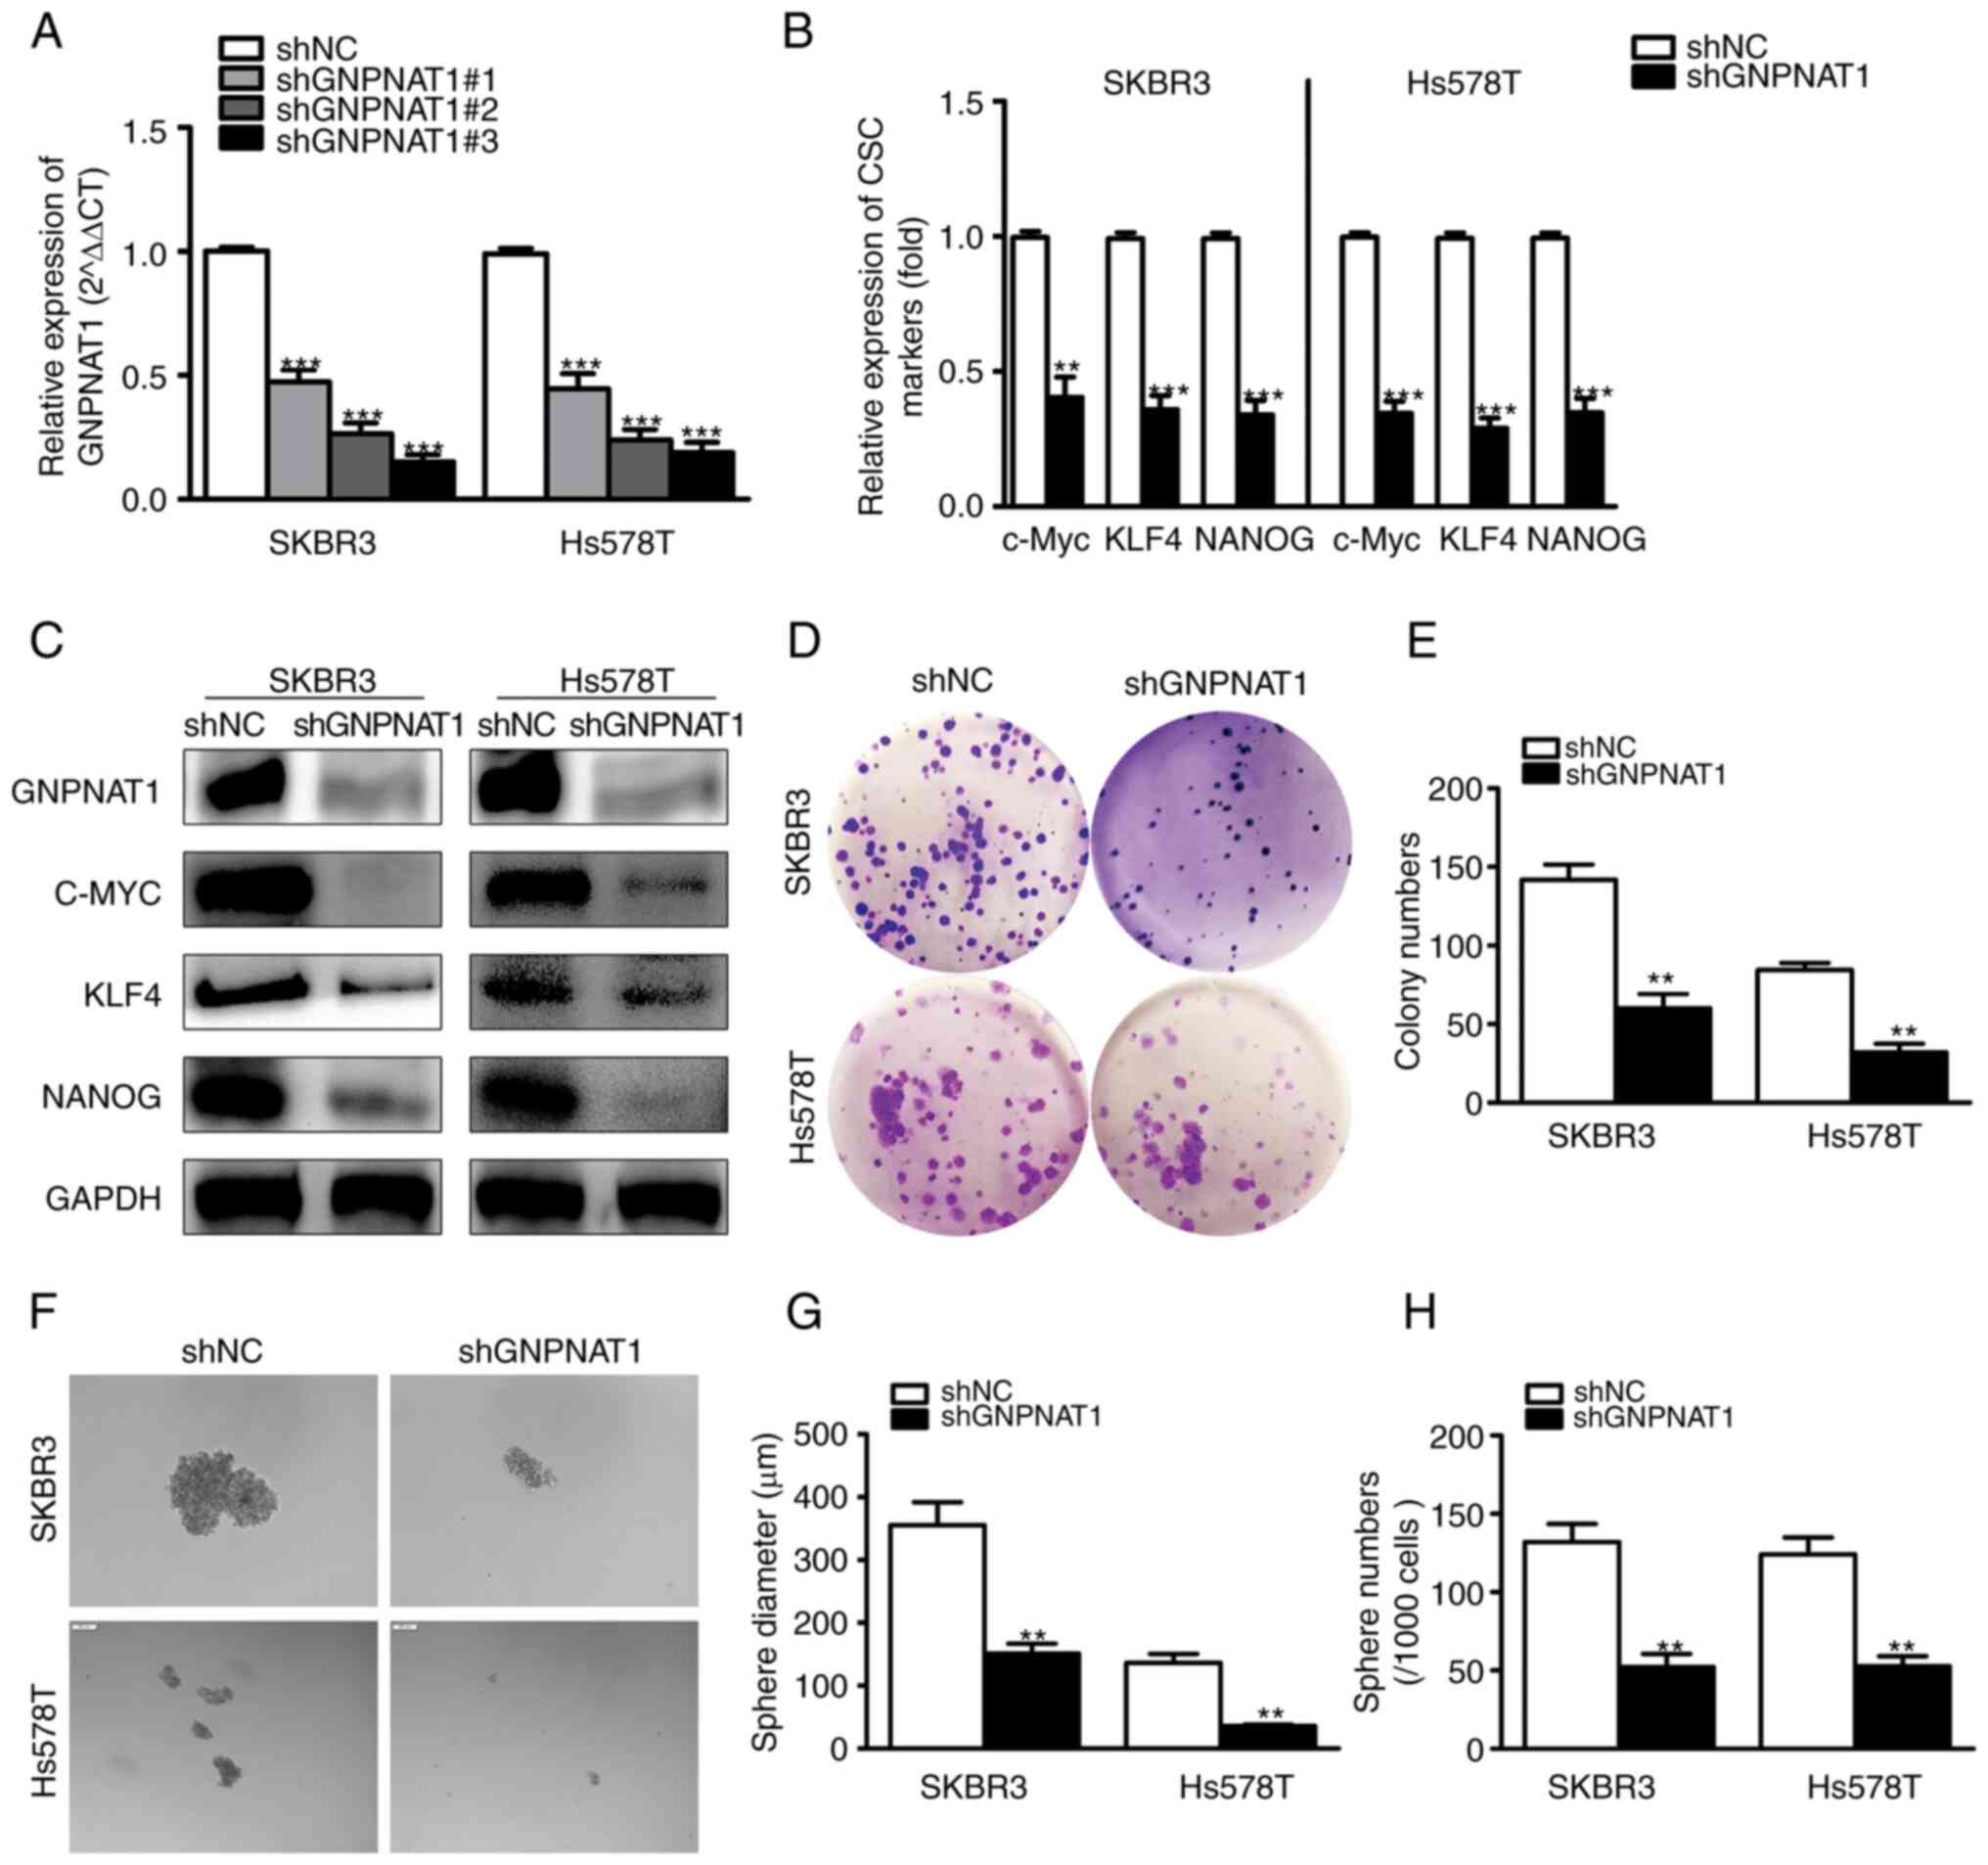
GNPNAT1 knockdown suppresses the
stemness of BC cells
In order to determine whether GNPNAT1 participates
in the control of BCSCs, GNPNAT1 was initially knocked down in the
SKBR3 and Hs578T cell lines. As presented in Fig. 9A in three independent shRNA vector
knockdown cell lines, shGNPNAT1#3 was the optimally functioning and
was therefore used in subsequent experiments. Pluripotent
transcription factors (c-MYC, KLF4 and NANOG) are frequently used
to identify CSCs in clinical tissues and several cancer cell lines
(33,34). The mRNA (Fig. 9B) and protein (Fig. 9C) levels of c-MYC, KLF4 and NANOG
were examined using RT-qPCR and western blot analysis. Compared to
the control cells, transfection with shGNPNAT1 resulted in a
reduction in the mRNA and protein expression levels of
stemness-related genes and GNPNAT1. Following GNPNAT1 knockdown,
the capacity of SKBR3 and Hs578T cells to produce clones was
drastically limited, according to colony formation test data
(Fig. 9D and E). Moreover, the
capacity of GNPNAT1 knockdown BC cells to produce tumor spheroids
was evaluated. As demonstrated in Fig.
9F, GNPNAT1 knockdown resulted in fewer spheroids developing in
the cells than in the vector control, as predicted. According to
statistical examination of the number and diameter of spheroids,
the number and size of the GNPNAT1 knockdown group decreased
significantly (Fig. 9G and H).
Therefore, it can be concluded that GNPNAT1 knockdown inhibited the
stemness of BC cells.
GNPNAT1 overexpression promotes the
stemness of BC cells
A cell line with the stable overexpression of
GNPNAT1 was also constructed to examine its effect on the stemness
capacity of BCSCs. As demonstrated in Fig. 10A, the GNPNAT1 mRNA levels were
considerably elevated in the SKBR3 and Hs578T cell lines following
transfection with a lentiviral GNPNAT1 overexpression vector. The
mRNA (Fig. 10B) and protein
(Fig. 10C) expression results of
stemness-related genes demonstrated that overexpression of GNPNAT1
caused a significant increase in the expression of c-MYC, KLF4 and
NANOG, as compared with the control cells, and GNPNAT1 protein
expression was also markedly increased. Similarly, the clonogenic
capacity of SKBR3 and Hs578T cells was significantly increased,
following GNPNAT1 overexpression (Fig.
10D and E). Finally, the results of spheroid culture
experiments demonstrated that GNPNAT1 overexpression caused a
significant upregulation of the number and size of suspended
spheroids (Fig. 10F-H). The
aforementoined results suggested that GNPNAT1 overexpression
promoted the stemness of BC cells.
Discussion
Previous research has examined the expression and
function of GNPNAT1 in lung cancer (16). GNPNAT1 is an important enzyme,
involved in eukaryotic UDP-GlcNAc production and metabolism
(35). By interfering with cellular
metabolism, GNPNAT1 upregulation may influence the onset and
progression of LUAD (36).
Nevertheless, the potential predictive usefulness of GNPNAT1 and
its expression in BC has not yet been completely investigated.
Hence, the aim of the present study was to evaluate the possible
function of GNPNAT1 in BC. GNPNAT1 mRNA and protein expression were
upregulated in BC tissues, as was the expression of GNPNAT1 in
several tumor types. ROC curve analysis suggested that GNPNAT1 may
be a promising diagnostic biomarker for distinguishing BC from
normal tissue. Using Kaplan-Meier curves and univariate analysis,
it was demonstrated in the present study that GNPNAT1 expression
may be simultaneously linked to both short OS and DSS. GNPNAT1 may
function as a biomarker for BC with a poor outcome. In addition,
the nomogram revealed that GNPNAT1 may be involved in clinical
diagnosis and prognostic evaluation. Further bioinformatics
analyses revealed an association between the elevated expression of
GNPNAT1 in BC and clinicopathological characteristics (age, TNM
pathologic stage, PAM50 and ER/PR/HER2 status). GSEA analysis was
performed to further evaluate and identify the influence of GNPNAT1
expression in BC. ‘Arachidonic acid metabolism’, ‘Mucin type
O-glycan biosynthesis’, ‘Carbohydrate digestion and absorption’,
‘Autophagy’, ‘Olfactory transduction’, and ‘alpha-Linolenic acid
metabolism’ were overrepresented in the GNPNAT1 high expression
phenotype. GNPNAT1 may inhibit these processes by modifying the
function of cyclin genes post-translationally. O-linked
N-acetylglucosamine transferase (OGT) is essential for the cell
cycle, since inhibiting OGT prevents the synthesis of cyclin D1
(37).
Numerous immune cell types inside the tumor
microenvironment (TME) play an essential role in tumor formation,
metastasis, and treatment resistance (38). The link between GNPNAT1 expression
and immune cell infiltration was then confirmed. Hence, it was
hypothesized that GNPNAT1 would promote tumor development and
metastasis by altering the proportion of certain immune cell types
that impact the TME. In fact, it has been revealed that GNPNAT1
maintains the TME in LUAD (14,17).
The present study revealed a substantial positive link between
Th2/T helper cells and GNPNAT1 and a significant negative
association between pDC, CD8 T-cells and cytotoxic cells with
GNPNAT1. T-cells are an essential component of the TME and
tumor-associated CD4+/CD8+ T-cells play a
crucial role in the pathophysiology of cancer. Other immune cell
types, including interstitial DCs, neutrophils, NK CD56+
bright cells, Th1 cells, DCs and B cells, may potentially affect
the survival of tumor cells in the TME. Future research is
required, in order to investigate further their connection to
GNPNAT1 expression.
Overall, the findings of the present study
demonstrate that GNPNAT1 expression may be a viable diagnostic and
prognostic molecular marker for patients with BC with a dismal
prognosis for survival. Furthermore, arachidonic acid metabolism,
mucin-type O-glycan production, and other pathways may be
controlled by GNPNAT1 in BC. Therefore, further validation trials
are necessary to confirm the biological effects of GNPNAT1.
Supplementary Material
Supporting Data
Supporting Data
Supporting Data
Supporting Data
Supporting Data
Acknowledgements
Not applicable.
Funding
The present study was supported by the National Natural Science
Foundation of China (grant nos. 31501149, 31770815 and 31570764),
the Wuhan Health and Family Planning Scientific Research Project
(grant no. WX21Q49), the Hubei Natural Science Foundation (grant
nos. 2017CFB537, 2019CFB398, 2019CFB368 and 2021CFB230), the
Educational Commission of Hubei (grant no. B2020001), the Hubei
Province Health and Family Planning Scientific Research Project
(grant nos. WJ2021Q051, WJ2019M255 and ZY2021Q005), the Frontier
Project of Applied Basic Research in Wuhan (grant no.
2020020601012250) and the Hunan Provincial Natural Science
Foundation (grant no. 2023JJ50296) and ‘The 14th Five Year Plan’
Hubei Provincial advantaged characteristic disciplines (group)
project of Wuhan University of Science and Technology (grant no.
2023C0303).
Availability of data and materials
The datasets used and/or analyzed during the current
study are available from the corresponding author on reasonable
request.
Authors' contributions
XHL, ZYY and TCZ participated in the design of the
study. HH, ZWW, SH, YX, YD and FJW performed the experiments and
analyzed the data, and HH was mainly responsible for writing this
manuscript. HH and ZWW confirm the authenticity of all the raw
data. All authors have read and approved the final manuscript.
Ethics approval and consent to
participate
Not applicable.
Patient consent for publication
Not applicable.
Competing interests
The authors declare that they have no competing
interests.
References
|
1
|
Sung H, Ferlay J, Siegel RL, Laversanne M,
Soerjomataram I, Jemal A and Bray F: Global Cancer Statistics 2020:
GLOBOCAN estimates of incidence and mortality worldwide for 36
cancers in 185 countries. CA Cancer J Clin. 71:209–249. 2021.
View Article : Google Scholar : PubMed/NCBI
|
|
2
|
Zhu J, Wu G, Zhao Y, Yang B, Chen Q, Jiang
J, Meng Y, Ji S and Gu K: Epidemiology, treatment and prognosis
analysis of small cell breast carcinoma: A population-based study.
Front Endocrinol (Lausanne). 13:8023392022. View Article : Google Scholar : PubMed/NCBI
|
|
3
|
Harbeck N and Gnant M: Breast cancer.
Lancet. 389:1134–1150. 2017. View Article : Google Scholar : PubMed/NCBI
|
|
4
|
Duffy MJ, Walsh S, McDermott EW and Crown
J: Biomarkers in breast cancer: Where are we and where are we
going? Adv Clin Chem. 71:1–23. 2015. View Article : Google Scholar : PubMed/NCBI
|
|
5
|
Bao Z, Cheng J, Zhu J, Ji S, Gu K, Zhao Y,
Yu S and Meng Y: Using weighted gene co-expression network analysis
to identify increased MND1 expression as a predictor of poor breast
cancer survival. Int J Gen Med. 15:4959–4974. 2022. View Article : Google Scholar : PubMed/NCBI
|
|
6
|
Deng M, Xiong C, He ZK, Bin Q, Song JZ, Li
W and Qin J: MCTS1 as a novel prognostic biomarker and its
correlation with immune infiltrates in breast cancer. Front Genet.
13:8259012022. View Article : Google Scholar : PubMed/NCBI
|
|
7
|
Rajarajan D, Kaur B, Penta D, Natesh J and
Meeran SM: miR-145-5p as a predictive biomarker for breast cancer
stemness by computational clinical investigation. Comput Biol Med.
135:1046012021. View Article : Google Scholar : PubMed/NCBI
|
|
8
|
Elhossini RM, Ahmed HA, Otaify G, Ghorab
RM, Amr K and Aglan M: A novel variant in GNPNAT1 gene causing a
spondylo-epi-metaphyseal dysplasia resembling PGM3-Desbuquois like
dysplasia. Am J Med Genet A. 188:2861–2868. 2022. View Article : Google Scholar : PubMed/NCBI
|
|
9
|
Sabbagh Q, Alkar F, Patte K, Prodhomme O,
Janel C, Touraine R, Jeandel C and Geneviève D: A second individual
with rhizomelic spondyloepimetaphyseal dysplasia and homozygous
variant in GNPNAT1. Eur J Med Genet. 65:1044952022. View Article : Google Scholar : PubMed/NCBI
|
|
10
|
Ain NU, Baroncelli M, Costantini A, Ishaq
T, Taylan F, Nilsson O, Mäkitie O and Naz S: Novel form of
rhizomelic skeletal dysplasia associated with a homozygous variant
in GNPNAT1. J Med Genet. 58:351–356. 2021. View Article : Google Scholar : PubMed/NCBI
|
|
11
|
Kaushik AK, Shojaie A, Panzitt K, Sonavane
R, Venghatakrishnan H, Manikkam M, Zaslavsky A, Putluri V, Vasu VT,
Zhang Y, et al: Inhibition of the hexosamine biosynthetic pathway
promotes castration-resistant prostate cancer. Nat Commun.
7:116122016. View Article : Google Scholar : PubMed/NCBI
|
|
12
|
Bacos K, Gillberg L, Volkov P, Olsson AH,
Hansen T, Pedersen O, Gjesing AP, Eiberg H, Tuomi T, Almgren P, et
al: Blood-based biomarkers of age-associated epigenetic changes in
human islets associate with insulin secretion and diabetes. Nat
Commun. 7:110892016. View Article : Google Scholar : PubMed/NCBI
|
|
13
|
Zhao M, Li H, Ma Y, Gong H, Yang S, Fang Q
and Hu Z: Nanoparticle abraxane possesses impaired proliferation in
A549 cells due to the underexpression of glucosamine 6-phosphate
N-acetyltransferase 1 (GNPNAT1/GNA1). Int J Nanomedicine.
12:1685–1697. 2017. View Article : Google Scholar : PubMed/NCBI
|
|
14
|
Zheng X, Li Y, Ma C, Zhang J, Zhang Y, Fu
Z and Luo H: Independent prognostic potential of GNPNAT1 in lung
adenocarcinoma. Biomed Res Int. 2020:88514372020. View Article : Google Scholar : PubMed/NCBI
|
|
15
|
Zhang S, Zhang H, Li H, Guo J, Wang J and
Zhang L: Potential role of glucosamine-phosphate
N-acetyltransferase 1 in the development of lung adenocarcinoma.
Aging (Albany NY). 13:7430–7453. 2021. View Article : Google Scholar : PubMed/NCBI
|
|
16
|
Zhu P, Gu S, Huang H, Zhong C, Liu Z,
Zhang X, Wang W, Xie S, Wu K, Lu T and Zhou Y: Upregulation of
glucosamine-phosphate N-acetyltransferase 1 is a promising
diagnostic and predictive indicator for poor survival in patients
with lung adenocarcinoma. Oncol Lett. 21:4882021. View Article : Google Scholar : PubMed/NCBI
|
|
17
|
Liu W, Jiang K, Wang J, Mei T, Zhao M and
Huang D: Upregulation of GNPNAT1 predicts poor prognosis and
correlates with immune infiltration in lung adenocarcinoma. Front
Mol Biosci. 8:6057542021. View Article : Google Scholar : PubMed/NCBI
|
|
18
|
Gupta PB, Fillmore CM, Jiang G, Shapira
SD, Tao K, Kuperwasser C and Lander ES: Stochastic state
transitions give rise to phenotypic equilibrium in populations of
cancer cells. Cell. 146:633–644. 2011. View Article : Google Scholar : PubMed/NCBI
|
|
19
|
Kreso A and Dick JE: Evolution of the
cancer stem cell model. Cell Stem Cell. 14:275–291. 2014.
View Article : Google Scholar : PubMed/NCBI
|
|
20
|
Al-Hajj M, Wicha MS, Benito-Hernandez A,
Morrison SJ and Clarke MF: Prospective identification of
tumorigenic breast cancer cells. Proc Natl Acad Sci USA.
100:3983–3988. 2003. View Article : Google Scholar : PubMed/NCBI
|
|
21
|
Charafe-Jauffret E, Ginestier C, Bertucci
F, Cabaud O, Wicinski J, Finetti P, Josselin E, Adelaide J, Nguyen
TT, Monville F, et al: ALDH1-positive cancer stem cells predict
engraftment of primary breast tumors and are governed by a common
stem cell program. Cancer Res. 73:7290–7300. 2013. View Article : Google Scholar : PubMed/NCBI
|
|
22
|
Chandrashekar DS, Karthikeyan SK, Korla
PK, Patel H, Shovon AR, Athar M, Netto GJ, Qin ZS, Kumar S, Manne
U, et al: UALCAN: An update to the integrated cancer data analysis
platform. Neoplasia. 25:18–27. 2022. View Article : Google Scholar : PubMed/NCBI
|
|
23
|
Chandrashekar DS, Bashel B, Balasubramanya
SAH, Creighton CJ, Ponce-Rodriguez I, Chakravarthi BVSK and
Varambally S: UALCAN: A portal for facilitating tumor subgroup gene
expression and survival analyses. Neoplasia. 19:649–658. 2017.
View Article : Google Scholar : PubMed/NCBI
|
|
24
|
Zhang Y, Chen F, Chandrashekar DS,
Varambally S and Creighton CJ: Proteogenomic characterization of
2002 human cancers reveals pan-cancer molecular subtypes and
associated pathways. Nat Commun. 13:26692022. View Article : Google Scholar : PubMed/NCBI
|
|
25
|
Chen F, Chandrashekar DS, Varambally S and
Creighton CJ: Pan-cancer molecular subtypes revealed by
mass-spectrometry-based proteomic characterization of more than 500
human cancers. Nat Commun. 10:56792019. View Article : Google Scholar : PubMed/NCBI
|
|
26
|
Uhlén M, Fagerberg L, Hallström BM,
Lindskog C, Oksvold P, Mardinoglu A, Sivertsson Å, Kampf C,
Sjöstedt E, Asplund A, et al: Proteomics. Tissue-based map of the
human proteome. Science. 347:12604192015. View Article : Google Scholar : PubMed/NCBI
|
|
27
|
Vasaikar SV, Straub P, Wang J and Zhang B:
LinkedOmics: Analyzing multi-omics data within and across 32 cancer
types. Nucleic Acids Res. 46((D1)): D956–D963. 2018. View Article : Google Scholar : PubMed/NCBI
|
|
28
|
Wang J, Vasaikar S, Shi Z, Greer M and
Zhang B: WebGestalt 2017: A more comprehensive, powerful, flexible
and interactive gene set enrichment analysis toolkit. Nucleic Acids
Res. 45((W1)): W130–W137. 2017. View Article : Google Scholar : PubMed/NCBI
|
|
29
|
Ru B, Wong CN, Tong Y, Zhong JY, Zhong
SSW, Wu WC, Chu KC, Wong CY, Lau CY, Chen I, et al: TISIDB: An
integrated repository portal for tumor-immune system interactions.
Bioinformatics. 35:4200–4202. 2019. View Article : Google Scholar : PubMed/NCBI
|
|
30
|
Park SY: Nomogram: An analogue tool to
deliver digital knowledge. J Thorac Cardiovasc Surg. 155:17932018.
View Article : Google Scholar : PubMed/NCBI
|
|
31
|
Hu H, Xiang Y, Zhang XY, Deng Y, Wan FJ,
Huang Y, Liao XH and Zhang TC: CDCA5 promotes the progression of
breast cancer and serves as a potential prognostic biomarker. Oncol
Rep. 48:1722022. View Article : Google Scholar : PubMed/NCBI
|
|
32
|
Livak KJ and Schmittgen TD: Analysis of
relative gene expression data using real-time quantitative PCR and
the 2(−Delta Delta C(T)) Method. Methods. 25:402–408. 2001.
View Article : Google Scholar : PubMed/NCBI
|
|
33
|
Ai L, Mu S, Sun C, Fan F, Yan H, Qin Y,
Cui G, Wang Y, Guo T, Mei H, et al: Myeloid-derived suppressor
cells endow stem-like qualities to multiple myeloma cells by
inducing piRNA-823 expression and DNMT3B activation. Mol Cancer.
18:882019. View Article : Google Scholar : PubMed/NCBI
|
|
34
|
Ma XL, Hu B, Tang WG, Xie SH, Ren N, Guo L
and Lu RQ: CD73 sustained cancer-stem-cell traits by promoting SOX9
expression and stability in hepatocellular carcinoma. J Hematol
Oncol. 13:112020. View Article : Google Scholar : PubMed/NCBI
|
|
35
|
Aquino-Gil M, Pierce A, Perez-Cervera Y,
Zenteno E and Lefebvre T: OGT: A short overview of an enzyme
standing out from usual glycosyltransferases. Biochem Soc Trans.
45:365–370. 2017. View Article : Google Scholar : PubMed/NCBI
|
|
36
|
Furuta E, Okuda H, Kobayashi A and Watabe
K: Metabolic genes in cancer: Their roles in tumor progression and
clinical implications. Biochim Biophys Acta. 1805:141–152.
2010.PubMed/NCBI
|
|
37
|
Olivier-Van Stichelen S, Drougat L,
Dehennaut V, El Yazidi-Belkoura I, Guinez C, Mir AM, Michalski JC,
Vercoutter-Edouart AS and Lefebvre T: Serum-stimulated cell cycle
entry promotes ncOGT synthesis required for cyclin D expression.
Oncogenesis. 1:e362012. View Article : Google Scholar : PubMed/NCBI
|
|
38
|
Usui T, Sakurai M, Enjoji S, Kawasaki H,
Umata K, Ohama T, Fujiwara N, Yabe R, Tsuji S, Yamawaki H, et al:
Establishment of a novel model for anticancer drug resistance in
three-dimensional primary culture of tumor microenvironment. Stem
Cells Int. 2016:70538722016. View Article : Google Scholar : PubMed/NCBI
|