Introduction
Bladder cancer is a significant global health issue,
responsible for ~500,000 new cases and 200,000 deaths worldwide,
with >80,000 new cases and 17,000 deaths occurring in the United
States each year (1). According to
clinical staging, bladder urothelial carcinoma (BLCA) is divided
into two primary groups, including non-muscle-invasive urothelial
carcinoma (NMIBC) and MIBC (2).
NMIBC, which constitutes ~70% of BLCA cases, is typically treated
with transurethral bladder tumor resection and bladder perfusion to
prevent recurrence (3). Bacillus
Calmette-Guérin instillation can significantly inhibit development
of NMIBC (4). A total of 20–30% of
patients with MIBC undergo total cystectomy and neoadjuvant
chemotherapy. Although neoadjuvant chemotherapy regimens such as
Methotrexate/Vinblastine/Doxorubicin/Cisplatin (M-VAP),
Capecitabine/Cisplatin and MVP have improved MIBC survival rates,
their overall response rate remains at 50% (5). In advanced BLCA cases, cancer
immunotherapy, such as immune checkpoint blockade, has shown
promise in enhancing patient survival (6). However, due to limited molecular
targets, certain patients experience unfavorable long-term
outcomes. Therefore, comprehensive understanding of the molecular
mechanisms and the development of novel diagnostic markers are
crucial for guiding clinical BLCA management and therapy.
Synaptopodin-2 (SYNPO2), also known as Fesslin or
myopodin, is localized on chromosome 4q26, contains seven exons and
was first discovered in 1999 (7,8).
Initially, SYNPO2 was recognized as a structural protein that
serves a key role in promoting actin protein polymerization and the
formation of actin bundles, facilitating creation of an F-actin
network (9). However, studies have
linked abnormal SYNPO2 expression to tumorigenesis and cancer
progression: For example, De Ganck et al (10) showed that elevated SYNPO2 expression
can stimulate the proliferation and migration of prostate cancer
cells. Other investigations have suggested that SYNPO2 increases
the progression of prostate cancer by regulating the formation of
actin fibers and assembly of plate-like pseudopods (11,12).
On the other hand, in triple-negative breast cancer, increased
SYNPO2 expression is associated with enhanced tumor invasion and
metastasis via its regulation of Yes-associated protein homolog 1
(YAP1) nuclear translocation (13).
Yet whether SYNPO2 is a tumor suppressor or oncogene remains
controversial. Roperto (14)
reported that in bladder cancer infected with Bovineparvovirus
(BPV), SYNPO2 upregulates molecular chaperone-mediated mitophagy,
promoting cancer cell survival by binding to BAG family molecular
chaperone regulator 3 (BAG3), a key autophagy protein. However,
other studies have suggested that SYNPO2 may exert
tumor-suppressive effects by binding to the 14-3-3 protein via
importin-mediated mechanisms (9,15).
These findings underscore the need for further investigation into
the biological functions and molecular mechanisms of SYNPO2 in
cancer, particularly in BLCA, where clarity is lacking.
The present study aims to investigate the
relationship between high SYNPO2 expression and the occurrence and
progression of BLCA, analyze the regulatory role of SYNPO2 in
signaling pathways, and assess its impact on tumor immune
infiltration.
Materials and methods
Prognostic factor selection and
correlation analysis
Clinical information and RNA sequencing data of BLCA
were downloaded from The Cancer Genome Atlas
(cancer.gov/ccg/research/genome-sequencing/tcga, TCGA) using GDC
Data Transfer Tool Version
1.6.1(docs.gdc.cancer.gov/Data_Transfer_Tool/Users_Guide/Getting_Started/#downloading-the-gdc-data-transfer-tool).
Differential gene expression analysis was conducted using the
DESeq2 R package Version. 1.40.2 (website: http://bioconductor.org/packages/release/bioc/html/DESeq2.html)
with count data. Subsequently, next-generation sequencing data were
converted into transcripts per kilobase million format for further
analysis. Prognostic factors in BLCA were identified by univariate
Cox regression analysis, considering factors with hazard ratio
>1 and a significance level of P<0.05 as poor prognostic
indicators. Independent risk factors were confirmed via
multivariate Cox regression analysis. The correlation between
SYNPO2 expression and clinical characteristics, such as TNM stage,
subtype, histological grade and therapy, was evaluated using
Kruskal-Wallis or Wilcoxon rank sum test. All statistical analyses
were performed using the stats R package Version 3.4.3.
(rdocumentation.org/packages/stats).
Survival analysis
All samples were categorized into low and high
SYNPO2 group, based on the median SYNPO2 expression (TPM=1.703).
Survival analysis was performed using Log-rank test with the
survival R package Version 2.42–3
(rdocumentation.org/packages/survival). Kaplan-Meier plots were
generated using the survminer R package Version 0.4.2
(rdocumentation.org/packages/survminer).
Immunohistochemistry (IHC)
A total of 45 clinical BLCA samples was obtained
from NingBo Medical Centre Lihuili Hospital Pathology Department
(Ningbo, China). The samples were initially fixed with 4%
formaldehyde, embedded in paraffin for 3 days at room temperature
and cut into 4-um thick sections before deparaffinization, antigen
retrieval and endogenous enzymatic activity inactivation. The
sections were placed in deparaffinization solution I, II for 10
min, and III for 10 min. Subsequently, immerse the sections in
absolute ethanol I for 5 min, absolute ethanol II for 5 min, and
absolute ethanol III for 5 min. Finally, rinse the sections with
distilled water. The sections were placed in 0.01 M citrate buffer
(pH 0.6; (92°C), start the timer and maintain this temperature for
40 min. In order to inhibit endogenous peroxidase enzymes, the
sections were placed in 3% hydrogen peroxide solution and incubated
at room temperature in the dark for 25 min. To block non-specific
binding, 10% goat serum (cat. no. C0265, Beyotime) was added for 15
min at room temperature. Tissue was incubated overnight at 4°C with
specific primary antibodies, including anti-human SYNPO2 (1:150,
cat. no. 25453-1-AP), Ki67 (1:200, cat. no. 27309-1-AP), C-C
chemokine receptor type 3 CCR3 (1:200, cat. no. 22351-1-AP) and
Tryptase alpha/beta-1 (TPSAB1 (1:200, cat. no. 13343-1-AP; all
Proteintech Group, Inc.). After washing with PBS buffer three
times, sections were incubated with secondary antibody
HRP-conjugated Goat Anti-Rabbit IgG (1:200, cat. no. SA00001-2,
Proteintech Group, Inc.) for 2 h at 37°C. DAB staining was
performed and stopped with water. Hematoxylin was used to stain the
nuclei for about 3 min at 37°C, washing with tap water, hematoxylin
differentiation solution for a few seconds, rinse with tap water,
hematoxylin return to blue solution, and rinse. Images were
obtained using a light Leica microscope at 200× magnification.
Tissue staining density was assessed using Image J software
Version. 1.53s (National Institutes of Health) and protein
expression was analyzed by the H-score as follows: H-score=∑(πxi),
where i represents the intensity score (1 for weak, 2 for moderate
and 3 for strong staining) and π denotes the corresponding
percentage of tissue area showing each intensity.
Toluidine blue staining
Following dewaxing, place the tissue sections into
Toluidine Blue staining solution (cat. no. G1032, Servicebio) at
room temperature for 10–20 min. Dehydrate the sections using
different concentrations of ethanol (usually 70, 95, 100%),
immersing them in each concentration to ensure thorough
dehydration. Clear the sections in clean xylene (cat.no.X112051,
Aladdin) for 10 min, and then seal them with neutral mounting
medium (cat.no. WG10004160, Servicebio). Images were collected
using a light Leica microscope at 100× magnification and numbers of
mast cells were calculated.
Construction of stable
SYNPO2-overexpressing cell lines
Human bladder cancer cell lines T24 and 5637 were
cultured in RPMI-1640 medium (cat. no. PM150110; Procell)
supplemented with 10% FBS (cat. no. 164210, Procell) until the cell
confluence reached 70% at 37°C with 5% CO2. Cell lines
overexpressing SYNPO2 were generated using lentiviral vectors
carrying 2.5 ug SYNPO2 cDNA or a control using
Lipofectamine™ 3000 reagent (cat. no. L3000001,
Invitrogen) at 37°C for 12 h. The control plasmid was a total of
2.5 ug pLVX-CMV–IRES-mCherry (cat. no. HH-LV-093, Hedgehogbio).
Then, We performed flow cytometry to sort cells expressing mCherry
three days post-transfection and identified SYNPO2 overexpression
using western blotting.
Reverse transcription-quantitative
(RT-qPCR)
Total RNA was extracted from 5637 and T24 cell lines
with SYNPO2 overexpression using RNase mini-Kit (cat. no. 74104,
Qiagen GmbH) according to the manufacturer's instructions and 1 µg
total RNA was reverse-transcribed using HiScript II 1st Strand cDNA
Synthesis kit (cat. no. R211-01,Vazyme) according to the
manufacturer's protocol. qPCR was conducted with the SYBR Green
qPCR Master Mix (cat. no. QKD-201, Toyobo Life Science) using the
following thermocycling conditions: Initial denaturation at 95°C
for 5 min, followed by 40 cycles of 95°C for 5 sec and 55°C for 15
sec. Gene expression was normalized to the reference gene GAPDH and
differences in target gene expression were calculated using the
ΔΔCq method (16). Primer sequences
were as follows: SYNPO2 forward, 5′-AGAAGCAGCCCTTACAAGTTG-3 and
reverse, 5-AGCCTCACTTATTCCACTGGAT-3; GAPDH forward,
5-GGAGCGAGATCCCTCCAAAAT-3 and reverse, 5-GGCTGTTGTCATACTTCTCATGG-3;
MYC forward, 5-GGCTCCTGGCAAAAGGTCA-3 and reverse,
5′-CTGCGTAGTTGTGCTGATGT-3; CDK4 forward, 5-ATGGCTACCTCTCGATATGAGC-3
and reverse, 5-CATTGGGGACTCTCACACTCT-3; CDK6 forward,
5-GCTGACCAGCAGTACGAATG-3 and reverse, 5-GCACACATCAAACAACCTGACC-3′;
TP53 forward, 5′-CAGCACATGACGGAGGTTGT-3′ and reverse primer,
5-TCATCCAAATACTCCACACGC-3; KRAS forward, 5-ACAGAGAGTGGAGGATGCTTT-3
and reverse, 5-TTTCACACAGCCAGGAGTCTT-3; P27 forward,
5-AACGTGCGAGTGTCTAACGG-3 and reverse, 5-CCCTCTAGGGGTTTGTGATTC T-3
and Cyclin D1 CCND1 forward, 5-TCTACACCGACAACTCCATCCG-3 and
reverse, 5-TCTGGCATTTTGGAGAGGAAGTG-3′.
Western blotting
Following digestion with 0.25% trypsin (cat. no.
T1320, Solarbio), the cells were collected by centrifugation at 500
g for 10 min. Protein lysate was extracted using RIPA buffer (cat.
no. R0010, Solarbio) supplemented with protease inhibitor cocktail
(cat. no. HY-K0010, MCE). Total protein concentration was
determined using the BCA method (cat.no. P0012, Beyotime). After
separation by SDS-PAGE on a 10% gel, a total of 20 ug proteins in
each lane were transferred onto PVDF membranes using a transfer
buffer containing 20% methanol. PVDF membranes were blocked with
10% skimmed milk at 4°C for 1 h and incubated with primary
antibodies in 5% non-fat milk at 4°C overnight. The primary
antibodies were as follows: Anti-human GAPDH (1:3,000, cat. no.
60004-1-Ig, Proteintech Group, Inc.), E-cadherin(1:1,000, cat. no.
610405, BD Transduction Laboratories™; BD Biosciences)
and vimentin (1:1,000, cat. no. AF7013, Affinity Biosciences).
Following primary antibody incubation at 4°C overnight, membranes
were treated with HRP-conjugated anti-mouse (cat. no. SA00001-1) or
anti-Rabbit IgG (both 1:5,000, cat. no. SA00001-2, both Proteintech
Group, Inc.) for 2 h at room temperature. ECL kit (cat. no.
RPN2235, Amersham) was used to visualize the protein bands. Blotted
bands were detected using the GE Detecting System and analyzed
using Image J software Version. 1.53s.
Wound healing assay
5637 and T24 cells were seeded in 6-well plates with
3% FBS at 37°C. A wound scratch experiment was continued when the
cell confluence reached ~90%. Wound scratch assay was conducted at
37°C using the light Leica Live Cell Imaging System (Essen
Bioscience) at 10× magnification at 0 and 24 h after the
scratch.
Transwell assay
A total of 105 cells were seeded into the
upper chamber of RPMI-1640 medium without serum. Prior to seeding,
T24 cells (cat. no. CL-0227, Procell) and 5637 cells (cat. no.
CL-0002, Procell) were serum-starved for 4 h at 37°C in RPMI-1640
medium (cat. no. PM150110, Procell). These cells were then plated
into 8 µm inserts coated with Matrigel Matrix (1:200, cat. no.
356234, Corning, Inc.) and cultured in RPMI-1640 medium (cat. no.
PM150110, Procell) without fetal bovine serum. The Matrigel Matrix
coating process involved melting Matrigel Matrix at 4°C overnight.
RPMI-1640 medium (cat. no. PM150110, Procell) containing 10% fetal
bovine serum (cat. no. 164210, Procell) was added to the lower
chamber. The induction process continued for 24 h at 37°C with 5%
CO2, allowing the cells to migrate from the upper
chamber through the membrane to the outside. The upper chamber was
stained with crystal violet at room temperature for 1 h, following
the manufacturer's instructions (cat. no. C0121, Beyotime Institute
of Biotechnology). Images were captured using a Leica light
microscope at 100× magnification.
Animal model
The cell lines 5637 and T24 are prominent models in
the study of bladder cancer. 5637 is notable for its robust
tumorigenicity, rendering it suitable for in vivo animal
experimentation. A stable 5637 cell line expressing Luciferase was
established by transfection with 2.5 ug of pLenti-CMV-Puro-LUC
(pLV-Luc) plasmid (cat. no. 17477, Addgene) using
Lipofectamine™ 3000 reagent (cat. no. L3000001,
Invitrogen) at 37°C for 12 h, and selected by 1ug/ml puromycin
(cat. no. P8230, Solarbio) for two weeks. The lentivirus packaging
plasmids were used in the following ratio for each 10
mm^2 dish: pLVX-CMV-SYNPO2-IRES-mCherry (cat. no.
HH-LV-093, Hedgehogbio):psPAX2 (cat. no. HH-LV-012,
Hedgehogbio):pMD2.G (cat. no. HH-LV-013, Hedgehogbio)=5(10 ug):3(6
ug):1(2 ug). These plasmids were transfected into the 293-cell line
at 37°C for 12 h (cat. no. CL-0001, Procell) using
Lipofectamine™ 3000 reagent (catalog no. L3000001,
Invitrogen). Three days following transfection, lentiviral
particles were harvested by centrifugation at 50,000 g for 2 h at
4°C. The collected lentiviral particles were then resuspended in
100 ul of PBS and stored at −80°C. Then, 10 ul of 2nd lentivirus
carrying SYNPO2 was employed to infect 5637 cell line expressing
Luciferase. This led to the generation of another stable cell line
co-expressing SYNPO2 and Luciferase, achieved through flow
cytometry sorting. For in vivo experiments, 6×10⁶
5637 cells co-expressing pLV-Luc and pLVX-CMV-SYNPO2-IRES-mcherry
were injected into the tail veins of 6-week-old BALB/c nude mice
(Charles river), with a total of 11 female mice weighing 18–22 g.
The laboratory mice are housed under controlled conditions,
including a temperature range of 20–24°C, humidity levels between
40 and 60%, a 12-h light/dark cycle, and continuous access to food
and water to ensure their well-being during research. Tumor growth
was monitored every 6 weeks by bioluminescence imaging using an
IVIS Spectrum device (PerkinElmer, Inc.) after intraperitoneal
injection of 30 mg D-luciferin. Tumors did not exceed a volume of
2,000 mm3 and diameter of 20 mm.
Immunofluorescence
Mice were euthanized by CO2 displacement
at a controlled rate of 30% container volume/min. This method
ensures a gradual and controlled administration of CO2,
leading to a rapid loss of consciousness and minimal distress to
minimize animal suffering. Fresh lung tissue was promptly collected
and fixed in 4% paraformaldehyde at 4°C overnight. After fixation,
the tissue was washed three times with PBS buffer and soaked
overnight at 4°C in a solution containing 20% sucrose and 0.05%
NaN3. The samples were directly affixed to sample stages
coated with optimal cutting temperature compound and frozen in an
ice cutter at −80°C. Subsequently, frozen tissue was sectioned into
4-µm sections and mounted onto slides. Tissue sections were
incubated with the primary antibody [mast cell chymase (CMA) 1;
1:200, cat. no. DF12290, Affinity Biosciences] at 4°C overnight.
They were then incubated with the secondary FITC-conjugated
anti-Rabbit IgG (1:400, cat. no. SA00003-2, Proteintech Group,
Inc.) at 37°C for 1 h. DAPI staining was used to visualize the
distribution of cell nuclei for 15 min at 37°C. Images were
acquired using a Leica SP8 confocal microscope (magnification of
200×, and ImageJ Version. 1.53s (National Institutes of Health) was
utilized to quantify the number of infiltrating mast cells.
ELISA
800 ul Blood was extracted from BALB/c nude mice.
Serum was obtained through centrifugation at 500 × g, 4°C, for 10
min. Serum concentrations of mast cell-secreted cytokines were
determined using TGF-β and IL-6 ELISA kits according to their
manufacturer's instructions (cat. nos. 70-EK981-48 and
70-EK206HS-48, respectively; both Hangzhou Lianke Biotechnology
Co., Ltd.).
Gene Ontology (GO), Kyoto Encyclopedia
of Genes and Genomes (KEGG) and Gene Set Enrichment Analysis
(GSEA)
A gene expression ranking matrix was generated using
the DEseq2 package (17). GO, KEGG
and GSEA enrichment analysis were performed using the R package
ClusterProfiler Version. 4.4.4 (18). The top 10 signaling pathways from
each enrichment analysis were visualized using the R package
ggplot2 Version 3.4.3
(cran.r-project.org/web/packages/ggplot2/index.html). P.adj
<0.05 and false discovery rate <0.25 were considered to
indicate significant enrichment.
Evaluation of the sensitivity of
chemotherapeutic agents
Drug sensitivity of patients was predicted using
half-maximal inhibitory concentration (IC50) and
RNA-sequence data was obtained from TCGA. IC50 was
calculated using the R package pRRophetic with ridge regression
(19).
Assessment of correlation between
SYNPO2 expression and immune infiltration
The significance and percentage of immune cells
infiltrating the tumor were estimated by the xCell method based on
a single-sample GSEA (ssGSEA) model (20). Expression of immune checkpoint genes
in both high and low SYNPO2 groups was evaluated and correlation
between the expression of each gene and SYNPO2 was assessed using
Pearson correlation analysis Tumor Immune Dysfunction and Exclusion
(TIDE) model (21) was used to
assess the effects of immune therapy in each group.
Evaluation of the effect of SYNPO2
expression on the response to PDL-1-targeted immune therapy
A total of 348 samples, including RNA-seq data and
clinical information, was acquired from the IMvigor 210 dataset
(22). CIBERSORT analysis was used
to assess the association between SYNPO2 expression and human
immune cell populations using IOBR R package Version 3
(github.com/IOBR/IOBR). In addition, the distribution of SYNPO2
expression in three immune infiltrating subtypes, including desert,
excluded and inflamed, was detected.
Statistical analysis
Statistical analysis was performed using R version
3.6.1 software (Website: http://cran.utstat.utoronto.ca/bin/windows/base/old/3.6.1/).
The data are presented as mean ± standard error of the mean (SEM).
Paired Student and Welch t and Wilcoxon's rank-sum test were
applied to compare two groups, while the Kruskal-Wallis test with
multiple hypothesis testing (Dunn's post hoc test) was performed to
compare multiple groups. Each experiment was repeated three times.
P<0.05 was considered to indicate a statistically significant
difference.
Results
High SYNPO2 expression is a poor
prognostic factor in BLCA
Univariate and multivariate Cox proportional hazards
analysis (Table I) revealed high
SYNPO2 expression as an independent risk factor associated with
poor prognosis in patients with BLCA. Survival analysis further
supported these findings, indicating an association between
elevated SYNPO2 levels and shorter overall and progression-free
survival and increased mortality (Fig.
1A-C). SYNPO2 expression was correlated with BLCA progression,
including clinical pathological, T and N stage (Fig. 1D-F). Notably, SYNPO2 expression was
significantly lower in papillary compared with non-papillary
bladder cancer (Fig. 1G), while
higher SYNPO2 levels were detected in bladder cancer cases with
lymphovascular invasion than those without (Fig. 1H). In addition, in 45 clinical
cancer samples from patients with BLCA, IHC revealed a positive
correlation between SYNPO2 expression and oncogene Ki67 (Fig. 1I and J). In a prognosis model for
BLCA, SYNPO2 expression was inversely associated with the 1- and
3-year survival rates. Higher total scores in this model signified
an increased mortality risk (Fig.
1K). Overall, these results underscore the role of SYNPO2 as a
risk factor associated with BLCA development.
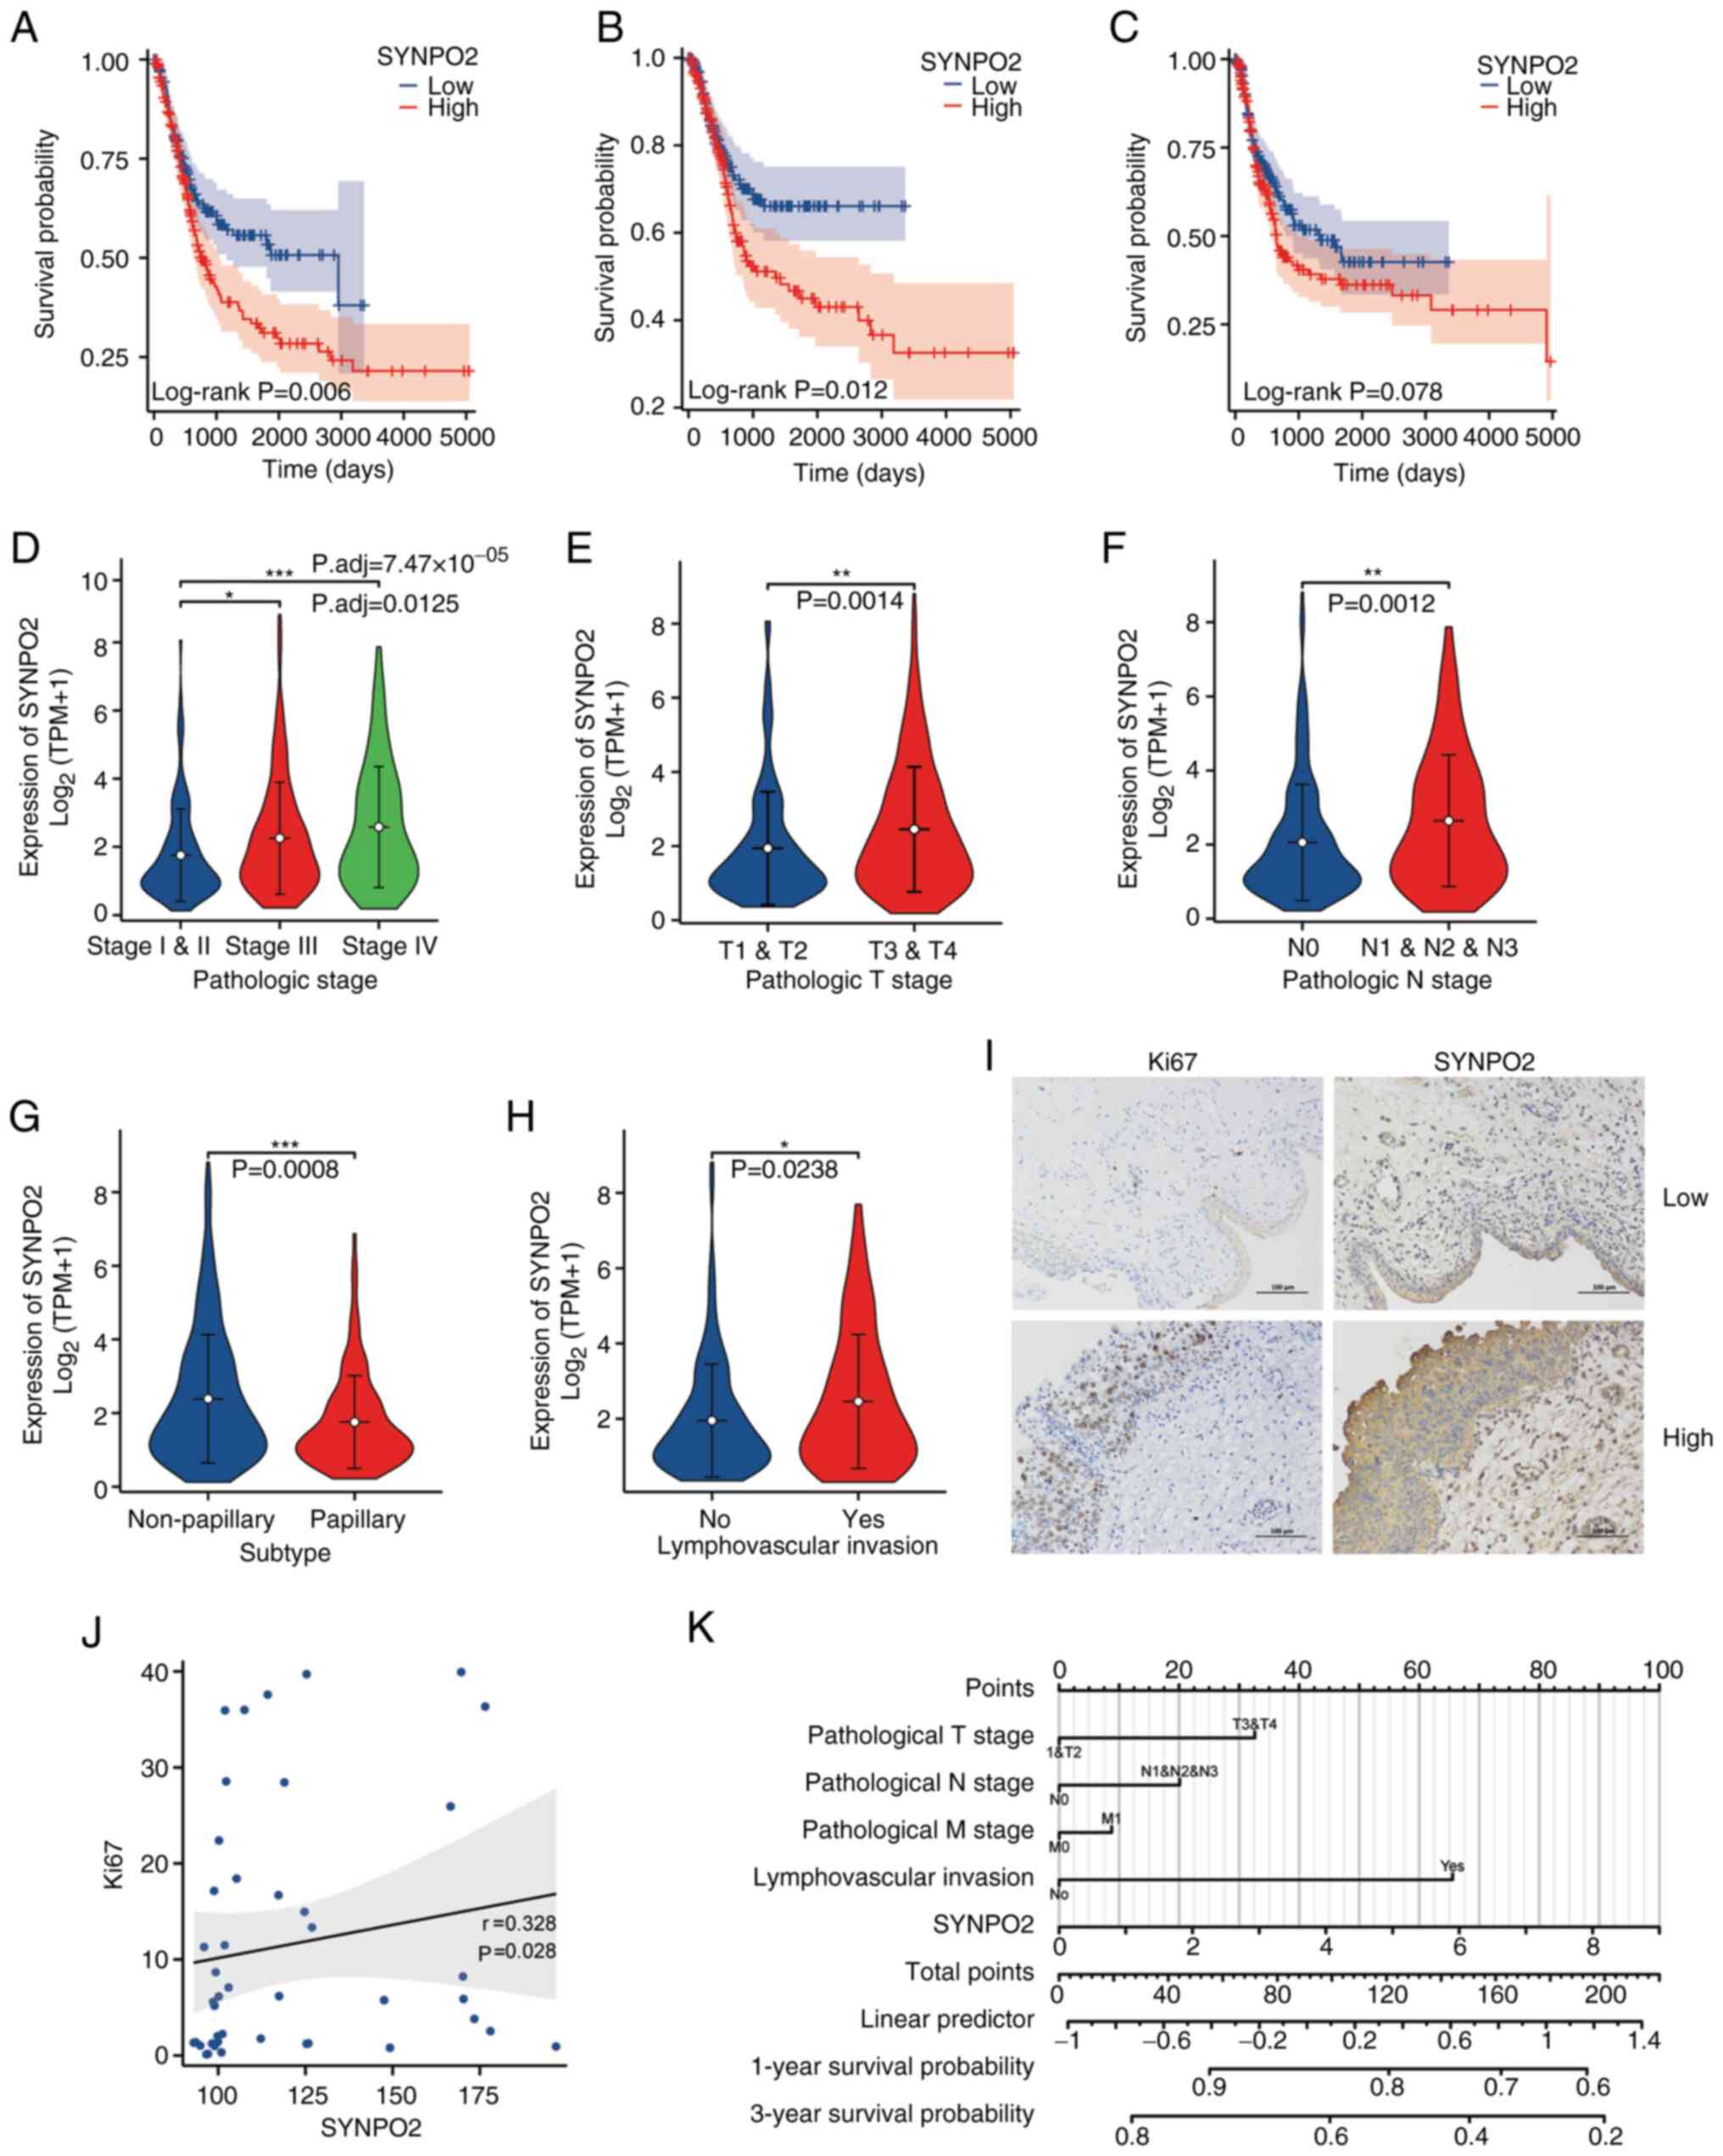 | Figure 1.High SYNPO2 expression is a poor
prognostic factor in BLCA. (A) Overall survival in patients with
BLCA with low (n=206) and high (n=205) SYNPO2 expression. (B)
Disease-specific survival in patients with BLCA in low (n=200) and
high (n=179) SYNPO2 expression groups. (C) Progression-free
interval for patients based on SYNPO2 expression (low, n=206; high,
n=206). (D) Distribution of SYNPO2 expression in BLCA samples from
patients at different stages. Stage I and stage II (n=133), stage
III (n=142), stage IV (n=135). Stage I and II vs. stage III,
P.adj=0.0125, stage I and II vs, stage IV P.adj=7.47×1005. (E)
Distribution of SYNPO2 expression in patients with BLCA at
different T stages. T1 and T2 (n=123) vs. T3 and T4 (n=255),
P=0.0014. (F) SYNPO2 expression in patients with BLCA at different
N stages. N0 (n=238) vs. N1, N2 and N3 (n=130), P=0.0012. (G)
SYNPO2 expression in BLCA samples of non-papillary (n=273) and
papillary (n=134) subtypes. P=0.0008. (H) SYNPO2 expression in
patients with BLCA with (n=129) or without (n=152) lymphovascular
invasion. P=0.0238. (I) Representative immunohistochemistry of Ki67
and SYNPO2 staining in BLCA tissue with low and high SYNPO2
expression. (J) Spearman correlation analysis of Ki67 and SYNPO2
expression (n=45). (K) Nomogram based on multivariate Cox
regression analysis for 1 and 3-year survival probability. SYNPO2,
synaptopodin-2; BLCA, Bladder Urothelial Carcinoma; TPM, Transcript
per million. *, ** and *** indicate P<0.05, P<0. 01,
P<0.001, respectively. |
 | Table I.Univariate and multivariate Cox
proportional hazards analysis between SYNPO2 expression and overall
survival for patients with Bladder Urothelial Carcinoma (BLCA). |
Table I.
Univariate and multivariate Cox
proportional hazards analysis between SYNPO2 expression and overall
survival for patients with Bladder Urothelial Carcinoma (BLCA).
|
|
| Univariate
analysis | Multivariate
analysis |
|---|
|
|
|
|
|
|---|
| Characteristic | n | Hazard ratio (95%
CI) | P-value | Hazard ratio (95%
CI) | P-value |
|---|
| T stage [T1&2
(n=124) vs. T3&4 (n=255)] | 379 | 2.199
(1.515–3.193) |
<0.001a | 0.914
(0.203–4.123) | 0.907 |
| N stage [N0&1
(n=285) vs. N2&3 (n=84)] | 369 | 2.273
(1.640–3.150) |
<0.001a | 2.050
(0.908–4.632) | 0.084 |
| M stage [M0 (n=202)
vs. M1 (n=11)] | 213 | 3.136
(1.503–6.544) | 0.002a | 0.696
(0.180–2.695) | 0.600 |
| Pathological stage
[I&II (n=134) vs. III&IV (n=277)] | 411 | 2.310
(1.596–3.342) |
<0.001a | 1.872
(0.334–10.492) | 0.476 |
| Radiation therapy
[no (n=366) vs. yes (n=21)] | 387 | 0.965
(0.475–1.964) | 0.923 |
|
|
| Sex [female (n=109)
vs. male (n=304)] | 413 | 0.849
(0.616–1.169) | 0.316 |
|
|
| Ethnicity
[Asian&Black or African American (n=67) vs. | 396 | 1.145
(0.731–1.794) | 0.554 |
|
|
| White (n=329)] |
|
|
|
|
|
| Weight [≤80 (n=204)
vs. >80 kg (n=166)] | 370 | 0.968
(0.709–1.323) | 0.840 |
|
|
| Height
[≤170 cm (n=158) vs. >170 cm (n=206)] | 364 | 1.100
(0.798–1.518) | 0.561 |
|
|
| BMI [≤25 (n=152)
vs. >25 (n=211)] | 363 | 0.978
(0.706–1.353) | 0.892 |
|
|
| Histological grade
[high (n=389) vs. low (n=21)] | 410 | 0.337
(0.083–1.360) | 0.126 |
|
|
| Smoking status [no
(n=109) vs. yes (n=291)] | 400 | 1.305
(0.922–1.847) | 0.133 |
|
|
| Primary therapy
outcome | 357 | 0.226
(0.162–0.315) |
<0.001a | 0.455
(0.218–0.949) | 0.036a |
| [PD&SD (n=101)
vs. PR&CR (n=256)] | 413 | 1.421
(1.063–1.901) | 0.018a | 1.428
(0.727–2.803) | 0.301 |
| Age [≤70 (n=233)
vs. >70 years (n=180)] | 408 | 0.690
(0.488–0.976) | 0.036a | 1.635
(0.737–3.628) | 0.226 |
| Subtype
[non-papillary (n=275) vs. papillary (n=133)] |
|
|
|
|
|
| Lymphovascular
invasion | 282 | 2.294
(1.580–3.328) |
<0.001a | 1.677
(0.732–3.843) | 0.222 |
| [no (n=130) vs. yes
(n=152)] | 413 | 1.609
(1.195–2.168) | 0.002a | 2.238
(1.093–4.582) | 0.028a |
| SYNPO2 expression
[low (n=207) vs. high (n=206)] |
|
|
|
|
|
SYNPO2 overexpression promotes the
invasion and migration of BLCA cell lines
RT-qPCR was used to detect mRNA levels of
proliferation-associated genes, including MYC (23), KRAS (24), TP53 (25), P27 (26), CDK4, CDK6 (27) CCND1 (28) and SYNPO2. SYNPO2 overexpression
increased the levels of oncogene C-MYC in both 5637 (n=3) and T24
(n=3) cell lines (Fig. 2A and B).
Transwell invasion assay demonstrated that SYNPO2 overexpression
significantly increased the invasive capacity of BLCA 5637 (n=3)
and T24 cell lines (n=3; Fig. 2C and
D). Additionally, scratch assay revealed that SYNPO2
overexpression increased wound healing in BLCA cell lines (n=3,
Fig. 2E and F).
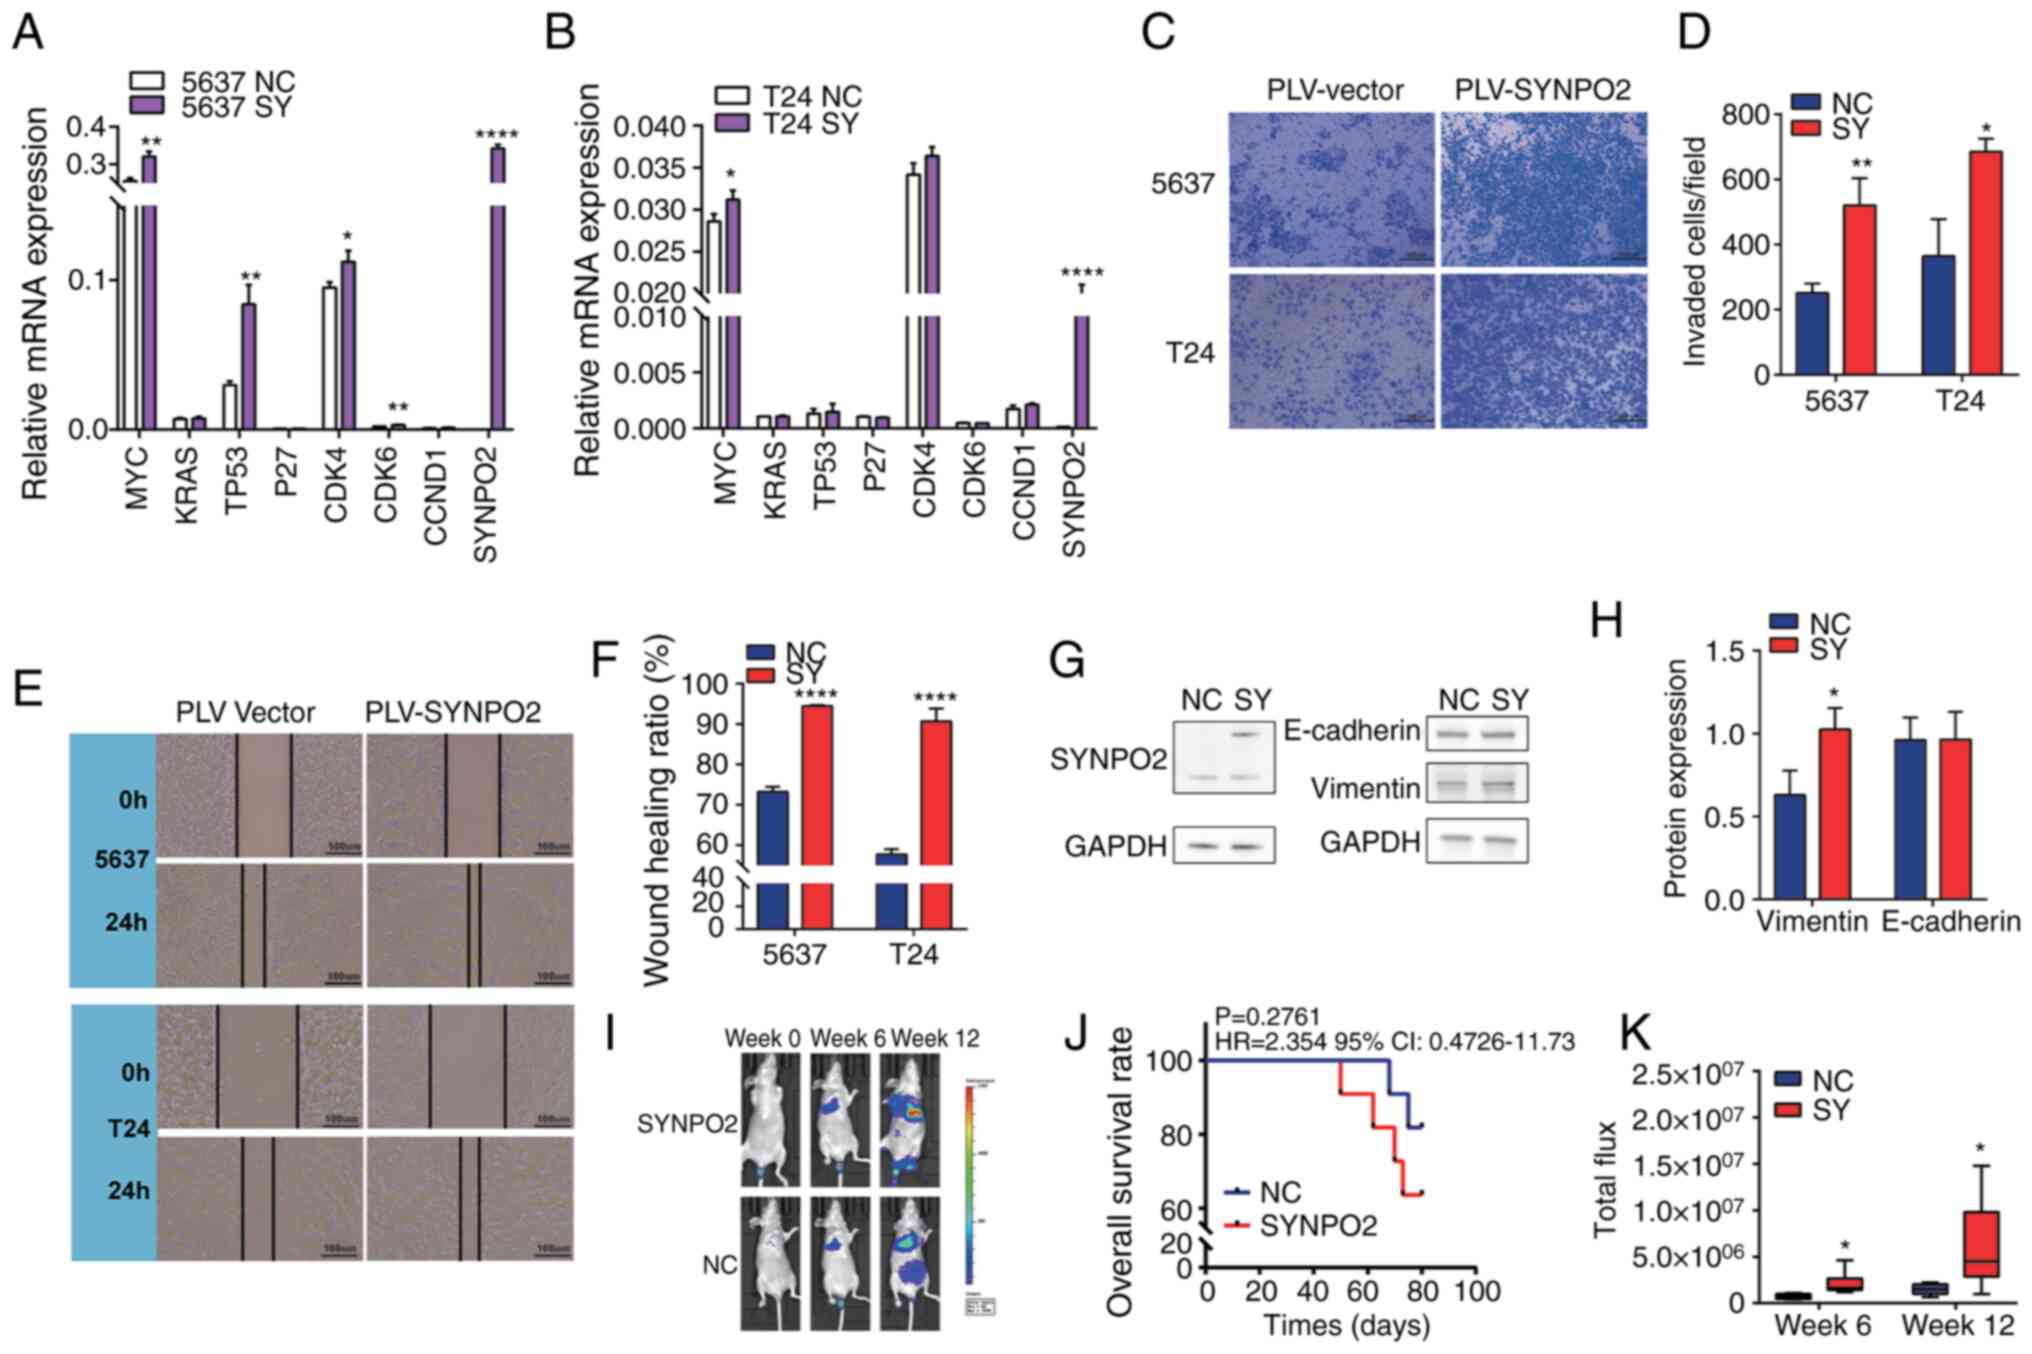 | Figure 2.SYNPO2 overexpression increases
invasion of BLCA in vivo and in vitro. (A) mRNA
levels in NC and SYNPO2-overexpressing 5637 cells was detected by
reverse transcription-quantitative PCR. MYC, P=0.0019; TP53,
P=0.0023; CDK4, P=0.0221; CDK6, P=0.0022 and SYNPO2, P<0.0001
between NC and SY group. (B) mRNA levels in T24 cells. MYC,
P=0.0343 and SYNPO2, P<0.0001 between NC and SY group. (C)
Transwell invasion assay of BLCA cell lines with SYNPO2
overexpression. (D) Number of invaded 5637 (P=0.006) and T24 cells
(P=0.0101). (E) Representative (F) wound healing assay in 5637 or
T24 cells at 0 and 24 h. (G) Western blotting analysis for (H)
SYNPO2, E-cadherin, vimentin and GAPDH protein. Vimentin, P=0.025.
(I) Bioluminescence imaging of 5637-Luc cells at 0, 6 and 12 weeks.
(J) Kaplan-Meier survival analysis of nude mice implanted with
5637-Luc cells. (K) Total flux in each group in vivo
imaging. 6 week NC (n=6) vs. SY (n=6), P=0.0247; 12 week NC (n=6)
vs. SY (n=5), P=0.0445. SYNPO2, Synaptopodin-2; BLCA, Bladder
Urothelial Carcinoma; NC, Negative Control; SY, SYNPO2
overexpression; Luc, Luciferase. *, ** and **** indicate P<0.05,
P<0.01, P<0.0001, respectively. |
In cancer cells with high metastatic potential,
expression of vimentin protein is typically upregulated, while
E-cadherin protein is inhibited (29). Western blotting showed increased
vimentin levels in the 5637 cell line with SYNPO2 overexpression
(Fig. 2G and H). To validate the
metastasis and invasion-promoting effects of SYNPO2, a BLCA lung
metastasis model was established in nude mice (n=11) via.
intravenous tail injection (Fig.
2I). While the association between SYNPO2 overexpression and
survival of this model was not significant, SYNPO2 increased the
risk of death (HR=2.354, 95% CI:0.4726–11.73; Fig. 2J). In vivo imaging analysis
revealed that the area of BLCA metastasis in the SYNPO2
overexpression group was ~2-fold larger than that in the control
group at 6 weeks and ~4-fold larger at 12 weeks (Fig. 2K).
SYNPO2 regulates innate
immune-associated and PI3K/AKT signaling pathways
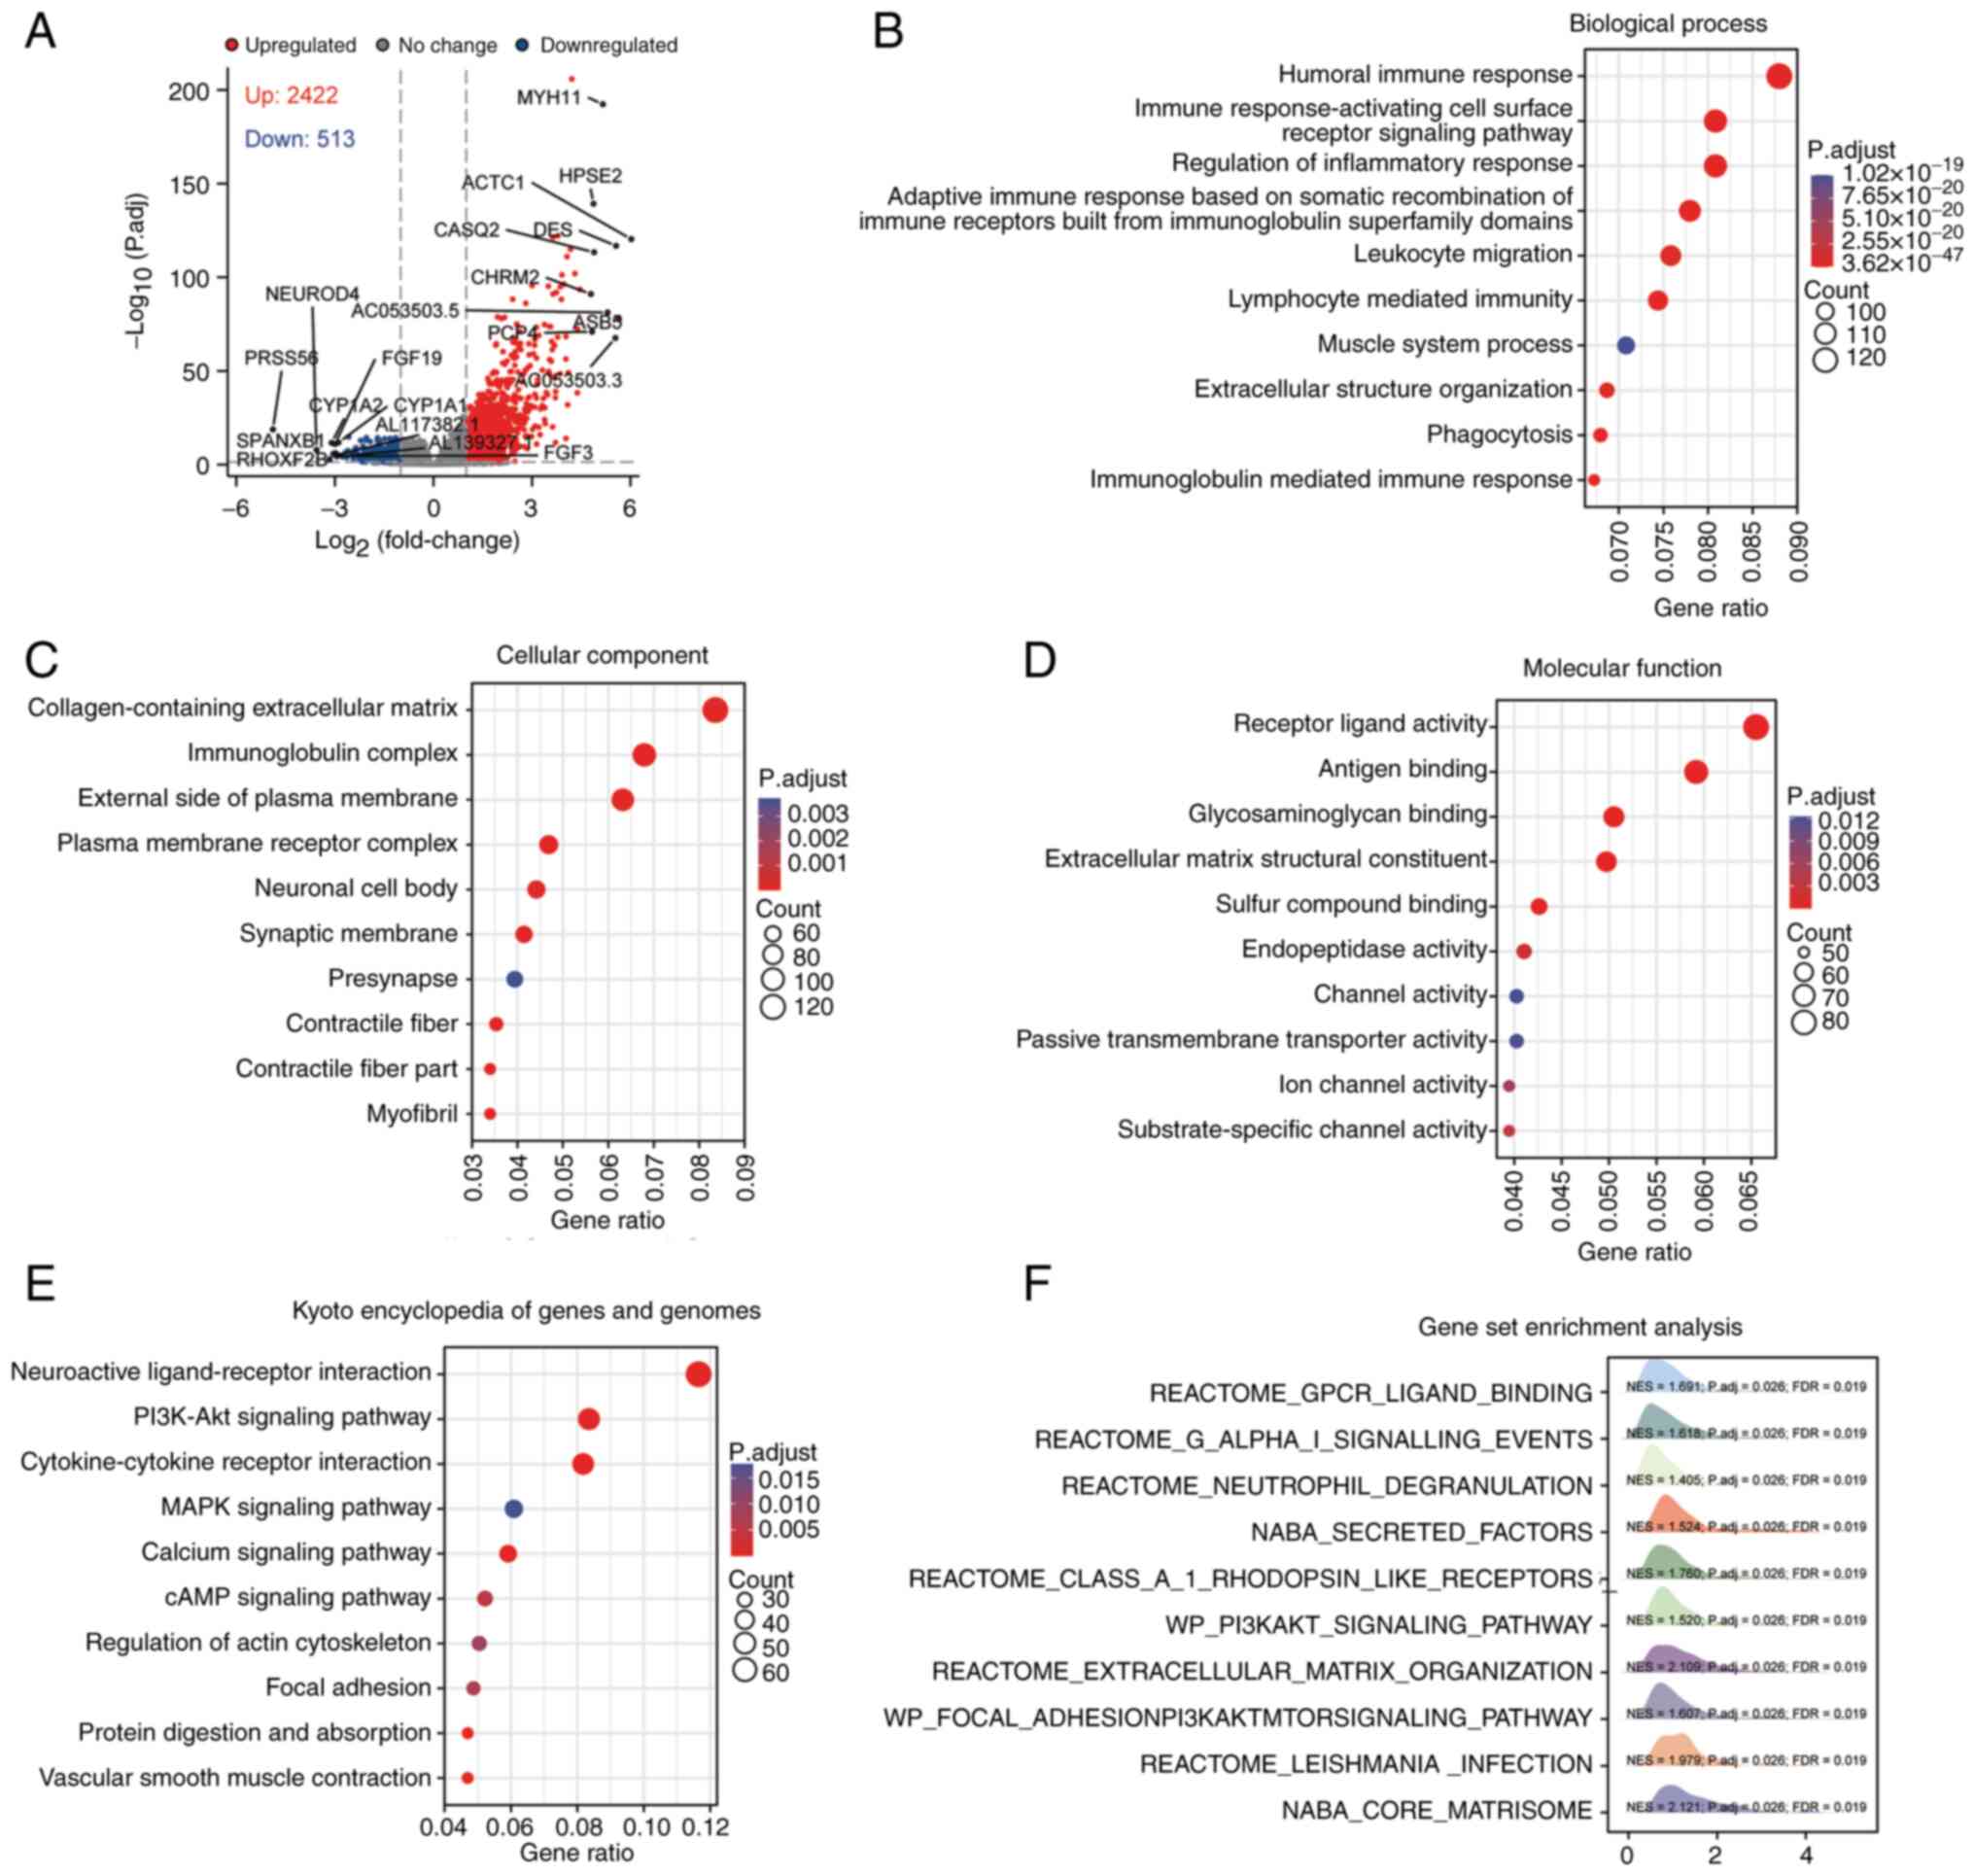
To uncover the molecular mechanisms of by SYNPO2 in
cancer development, BLCA next-generation sequencing data was
obtained from TCGA database. Utilizing DESeq2 analysis,
differentially expressed genes (DEGs; |logFC|>2, P<0.05)
between SYNPO2 expression groups were obtained, comprising 2,422
upregulated and 513 downregulated genes. The top 10 genes are shown
(Fig. 3A). GO) analysis revealed
that abnormal SYNPO2 expression led to dysfunction in the innate
immune system across biological processes including ‘complement
activation’, ‘formation of immunoglobulin complexes’ and
‘antigen-binding process’, cell components and molecular functions
(Fig. 3B-D). KEGG pathway analysis
highlighted the top 10 enriched pathways, including ‘neuroactive
ligand-receptor interaction’, ‘PI3K-Akt signaling pathway’,
‘cytokine-cytokine receptor interaction’, ‘MAPK signaling pathway’,
‘calcium signaling pathway’, ‘cAMP signaling pathway’, ‘regulation
of actin cytoskeleton’, ‘focal adhesion’, ‘protein digestion and
absorption’ and ‘vascular smooth muscle contraction’ (Fig. 3E). GSEA also showed the enrichment
of the ‘PI3K-AKT signaling pathway’ (Fig. 3F). Overall, these findings suggested
that SYNPO2 expression modulated innate immune-related and the
PI3K/AKT signaling pathway.
SYNPO2 expression increases the
sensitivity of PI3K/AKT-targeted drugs
Given that survival in patients with BLCA at the
advanced stage depends on drug response (30), drug sensitivity of BLCA in different
SYNPO2 expression groups was evaluated based on RNA-sequencing data
from TCGA database. IC50 prediction indicated that
SYNPO2 expression increased resistance to conventional
chemotherapeutic drugs, including docetaxel, paclitaxel,
doxorubicin and gemcitabine (Fig.
4A-D).
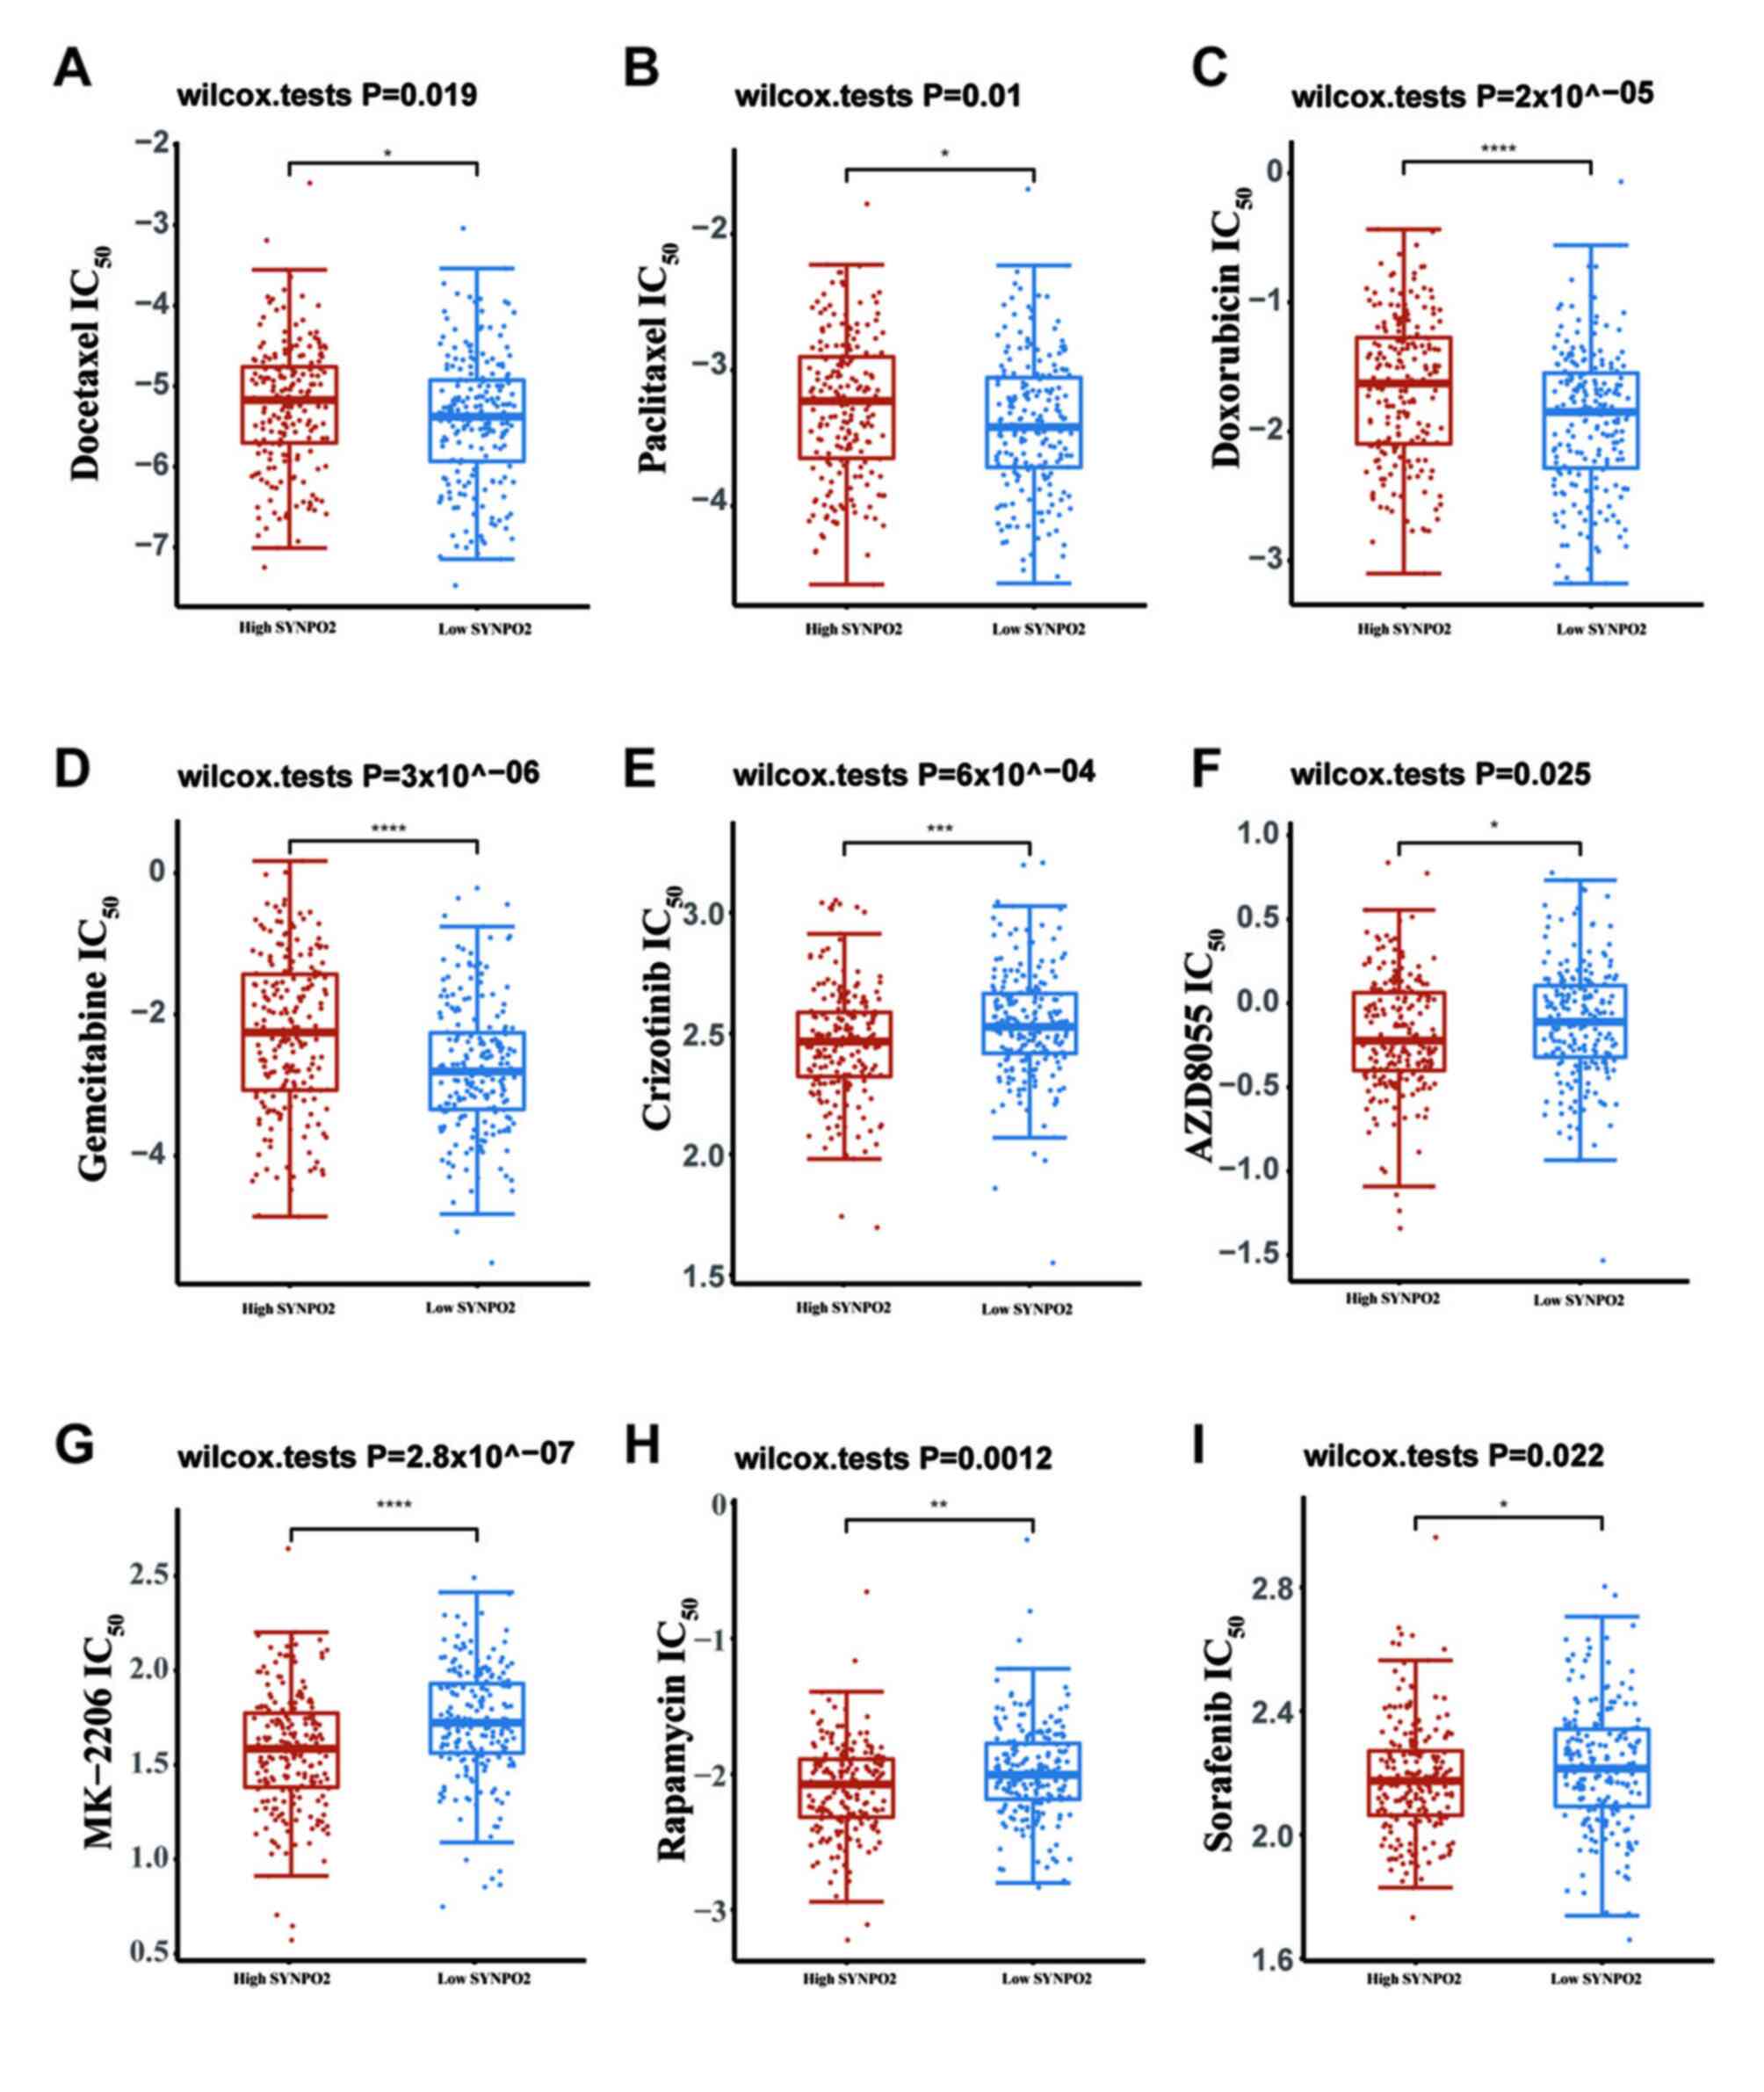 | Figure 4.Drug sensitivity in bladder
Urothelial Carcinoma (BLCA) with different SYNPO2 expression. IC50
of (A) docetaxel, P=0.019 (B) paclitaxel, P=0.01 (C) doxorubicin,
P=2×10^−05 (D) gemcitabine, P=3×10^−06 (E)
crizotinib, P=6×10^−04 (F) AZD8055, P=0.025 (G) MK-2206,
P=2.8×10^−07 (H) rapamycin P=0.0012 and (I) sorafenib
P=0.022. IC50, half maximal inhibitory concentration; SYNPO2,
Synaptopodin-2. *, **, *** and **** indicate P<0.05, P<0.01,
P<0.001, P<0.0001, respectively. |
The PI3K/AKT signaling pathway plays a vital role in
tumorigenesis and is one of the important therapeutic targets in
the treatment of several types of cancer (31). Various molecules in this pathway,
such as c-met, AKT1/2/3, PI3K, mTOR and VEGFR, are involved, and
drugs targeting them, including crizotinib, MK-2206, AZD8055,
rapamycin and sorafenib, have been employed in clinical therapy
(32–35). Therefore, sensitivity of these
PI3K-AKT targeted drugs was assessed. IC50 of these drugs in BLCA
with high SYNPO2 expression was significantly decreased compared
with the low SYNPO2 group (Fig.
4E-I).
SYNPO2 expression facilitates mast
cell infiltration in BLCA
Given the potential impact of SYNPO2 expression on
immune function (36,37), ssGSEA was used to estimate tumor
immune infiltration levels. Several innate immune cell types,
including mast (r=0.636) and natural killer (NK) cells (r=0.509)
and eosinophils (r=0.489), exhibited significant correlations with
SYNPO2 expression (Fig. 5A). To
validate the role of SYNPO2 in increasing mast cell infiltration in
BLCA tissues, mast cell degranulation and protein expression in
BLCA tissue was measured using IHC and toluidine blue staining.
Toluidine blue staining revealed a significantly higher number of
mast cells in BLCA tissues with high SYNPO2 expression (Fig. 5B and C). Additionally, TPSAB1
staining, a mast cell marker, showed a positive association between
SYNPO2 expression and TPSAB1 levels (r=0.708; Fig. 5B and D). Moreover, the levels of the
mast cell surface receptor CCR3 (r=0.623) also strongly correlated
with SYNPO2 expression (Fig. 5B and
E).
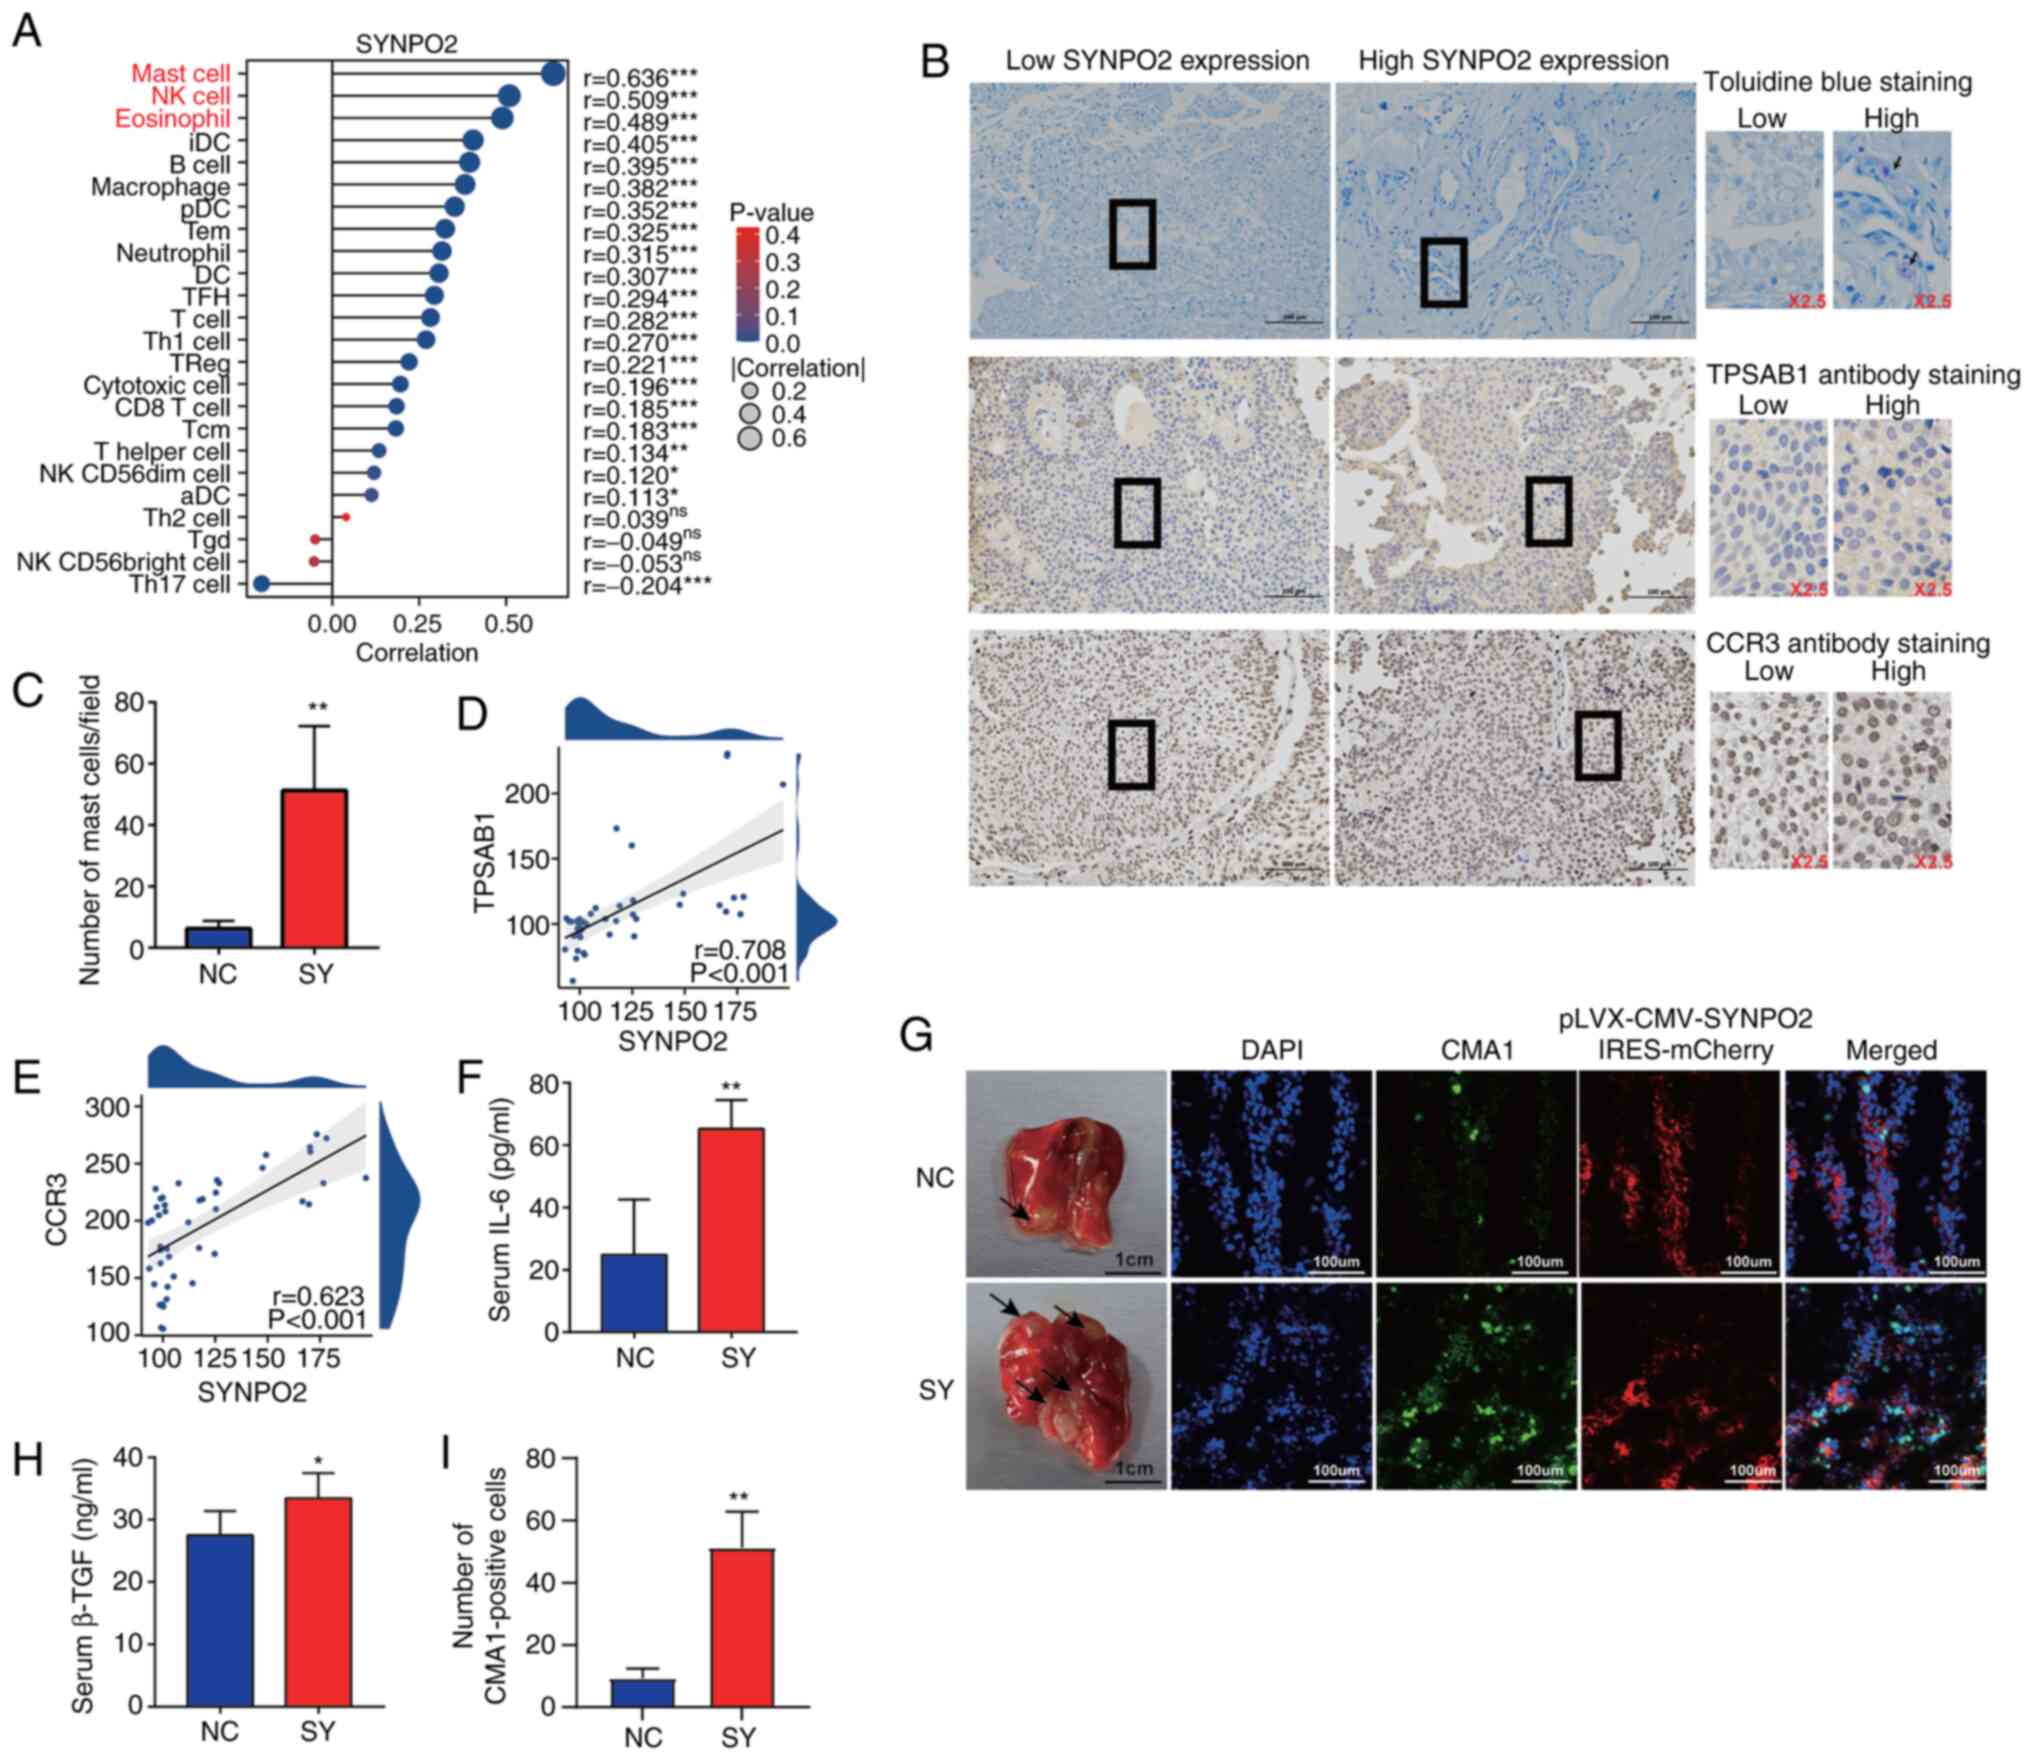 | Figure 5.SYNPO2 expression enhances mast cell
infiltration. (A) SYNPO2 expression in 24 types of immune cell. Red
text indicates a high correlation. (B) Representative toluidine and
immunohistochemical staining in clinical Bladder Urothelial
Carcinoma (BLCA) samples with low and high SYNPO2 expression.
Purple represents cell degranulation. Scale bar, 100 µm. (C) Mast
cell number/field in low and high SYNPO2 expression groups
(P=0.0053). Correlation between SYNPO2 and (D) TPSAB1 and (E) CCR3
expression based on H-score. (F) Mouse serum IL-6 levels in NC
(n=5) and SY (n=5; P=0.002). (G) Representative indirect
immunofluorescence of a frozen lung section from a mouse model with
pulmonary metastasis. The black arrow indicates the area of tumor
invasion in the lung tissue. (H) Mouse serum TGF-β1 levels
(P=0.045). (I) CMA-positive cells (n=3, P=0.0036). SYNPO2,
synaptopodin-2; TPSAB1, Tryptase alpha/beta-1; CCR3, C-C chemokine
receptor type 3; NC, Negative Control; SY, SYNPO2 overexpression;
CMA1, Chymase 1. * and ** indicate P<0.05, P<0.01,
respectively. |
In the in vivo model, SYNPO2 overexpression
increased lung metastasis of BLCA, as evidenced by a significant
increase in mast cells expressing CMA1 in the immunofluorescence
assay (Fig. 5G and I). Furthermore,
mast cell-secreted immune suppressive cytokines, including TGF-β1
and IL-6, were significantly higher in the SYNPO2 overexpression
group compared with the control (Fig.
5F and H).
SYNPO2 increases immunotherapy
resistance by upregulating infiltration of resting mast cells
To assess the association between SYNPO2 and
immunotherapy, expression levels of eight immune
checkpoint-associated genes (38),
including programmed cell death protein 1 (PDCD1), Lymphocyte
activation gene 3 protein, CD274, hepatitis A virus cellular
receptor 2 (HAVCR2), cytotoxic T-lymphocyte protein 4 (CTLA4),
programmed cell death 1 ligand 2 (PDCD1LD2), T-cell immunoreceptor
with Ig and ITIM domains (TIGIT) and sialic acid-binding Ig-like
lectin 15 (SIGLEC15), were evaluated using RNA-seq data from TCGA
database. Except for CD274 and SIGLEC15, expression of immune
checkpoint genes was correlated with SYNPO2 levels (Fig. 6A). Additionally, to predict the
response to ICIs, TIDE score was calculated. In the high SYNPO2
expression group, TIDE score was significantly higher compared with
the low SYNPO2 expression group, indicating that SYNPO2 expression
increased resistance to ICIs (Fig.
6B).
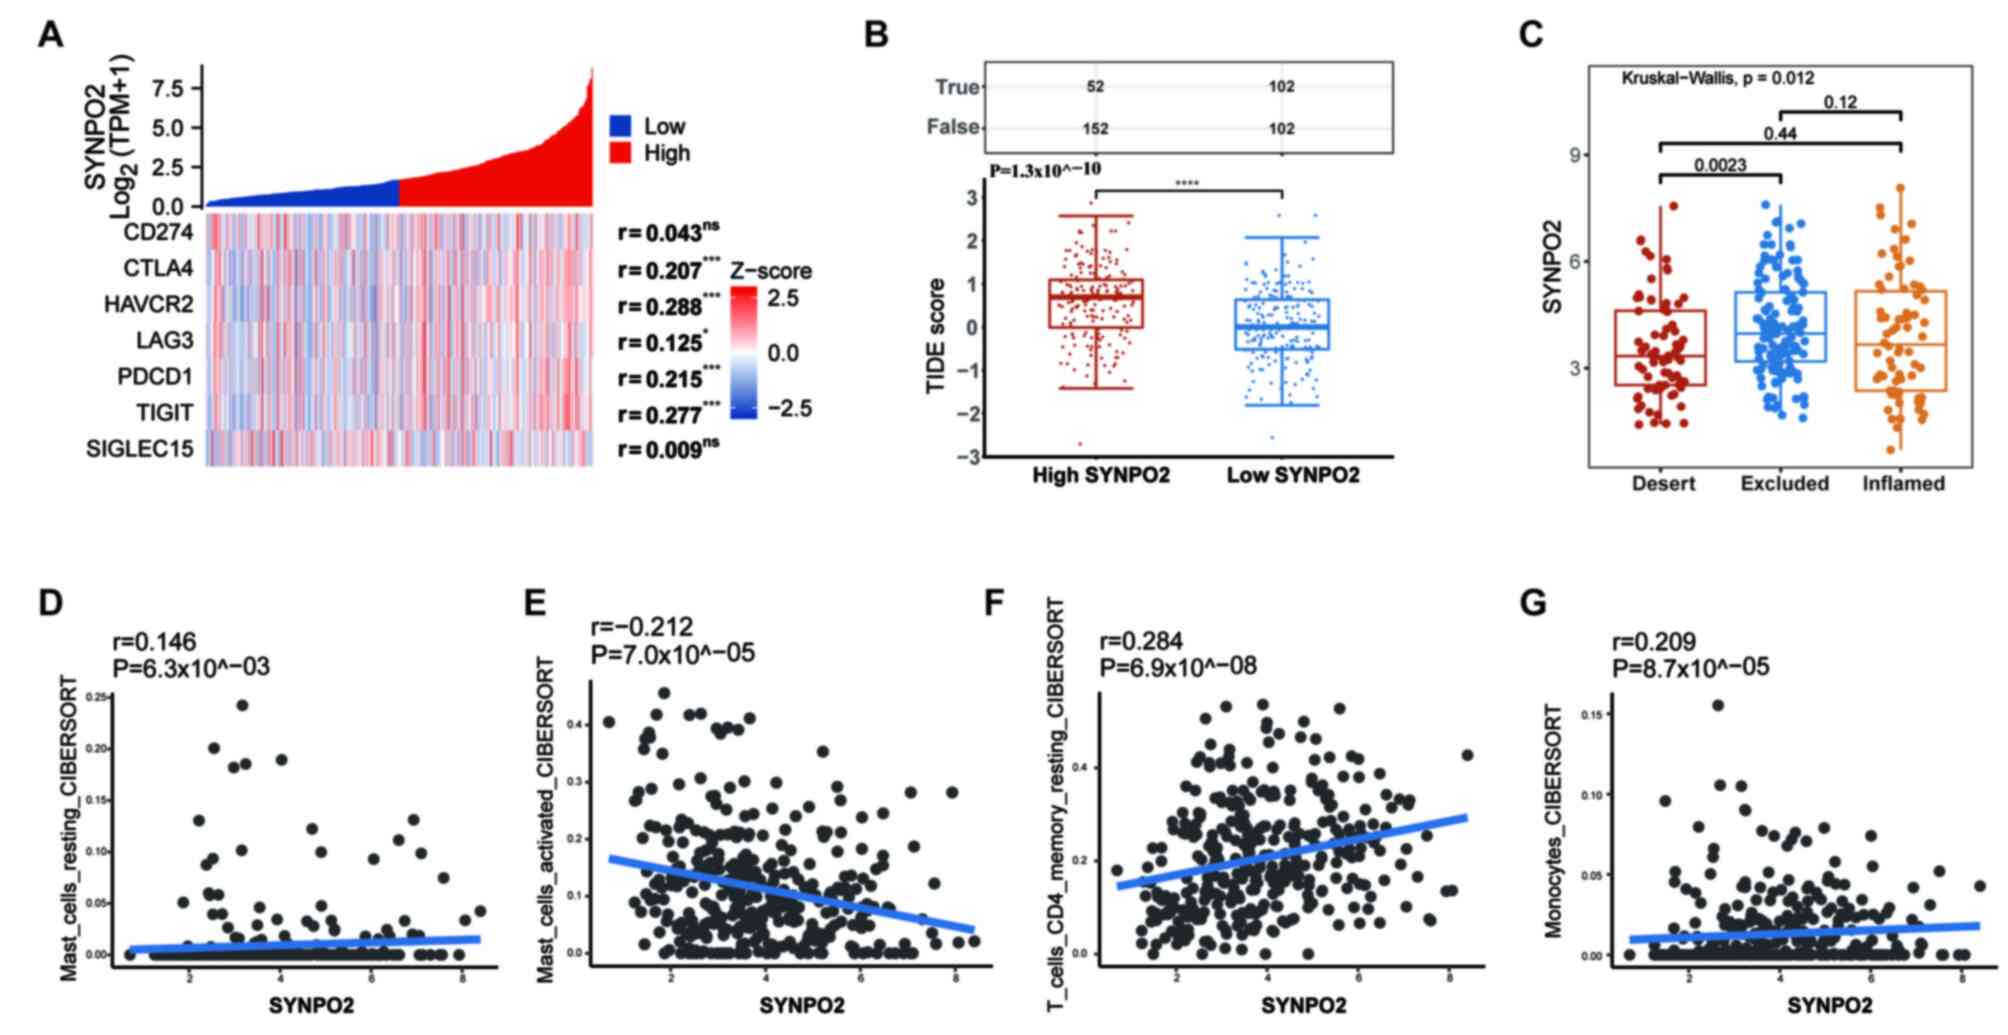 | Figure 6.High SYNPO2 expression increases
resistance to anti-PDL1 immune therapy. (A) Correlation of immune
checkpoint genes with SYNPO2. (B) TIDE score. True presents numbers
of positive immune responses; False presents numbers of negative
immune responses; Red, resistance to immune checkpoint blocking;
blue, positive response, P=P=1.3×10^−10. (C) Differences
in SYNPO2 expression in three immune infiltration types, The
Deserted VS The Excluded P=0.0023. Correlation between
SYNPO2 and (D) resting, P=6.3×10^−03 and (E) activated
mast cell, P=7.0×10^−05, (F) resting CD4 memory T and
(G) monocyte infiltration in the IMVigor 210 cohort (n=348).
SYNPO2, Synaptopodin-2; TPM, Transcript per million; PDL1,
Programmed cell death 1 ligand 1; TIDE, Tumor Immune Dysfunction
and Exclusion; ns, no significance. *, *** and **** indicate
P<0.05, P<0.001, P<0.0001, respectively. |
ICIs are developed based on the concept of
reactivating preexisting anti-tumor T cell responses suppressed due
to inherent immunological resistance in BLCA (39). To validate the current hypothesis
that SYNPO2 expression affects the efficacy of immune therapy in
BLCA we evaluated immune microenvironment subtypes and infiltration
in a cohort of 348 BLCA patients who were treated with
atezolizumab, a PD-L1 inhibitor. This analysis was based on the
data from the IMvigor 210 study, which included RNA-sequencing data
and clinical information. Among the three subtypes of immune
infiltration, the excluded subtype exhibited higher SYNPO2
expression compared with the desert subtype (P=0.0023; Fig. 6C). According to analysis of immune
cell infiltration, SYNPO2 expression was positively correlated with
infiltration of mast cells at rest (R=0.146), monocytes (R=0.209)
and resting CD4 memory T cells (r=0.284), while it was negatively
correlated with activated mast cell infiltration (R=−0.212;
Fig. 6D-G). Therefore, SYNPO2 may
increase resistance to immunotherapy by upregulating the
infiltration of resting mast cells.
Discussion
In numerous cancer types, SYNPO2 exhibits different
effects. For example, in triple-negative breast cancer (TNBC) and
colorectal cancer, SYNPO2 is reported to act as a tumor suppressor
by reducing TNBC metastasis and inhibiting proliferation and
migration in colorectal cancer by regulating specific molecular
pathways (40,41). However, in prostate cancer, SYNPO2
overexpression is associated with enhanced cell migration,
potentially due to its involvement in stress fiber assembly
(10,15). The present findings align with
previous studies, suggesting that SYNPO2 is an independent
predictor of poor clinical outcome and is positively linked to
increased metastasis in cancer (37,42).
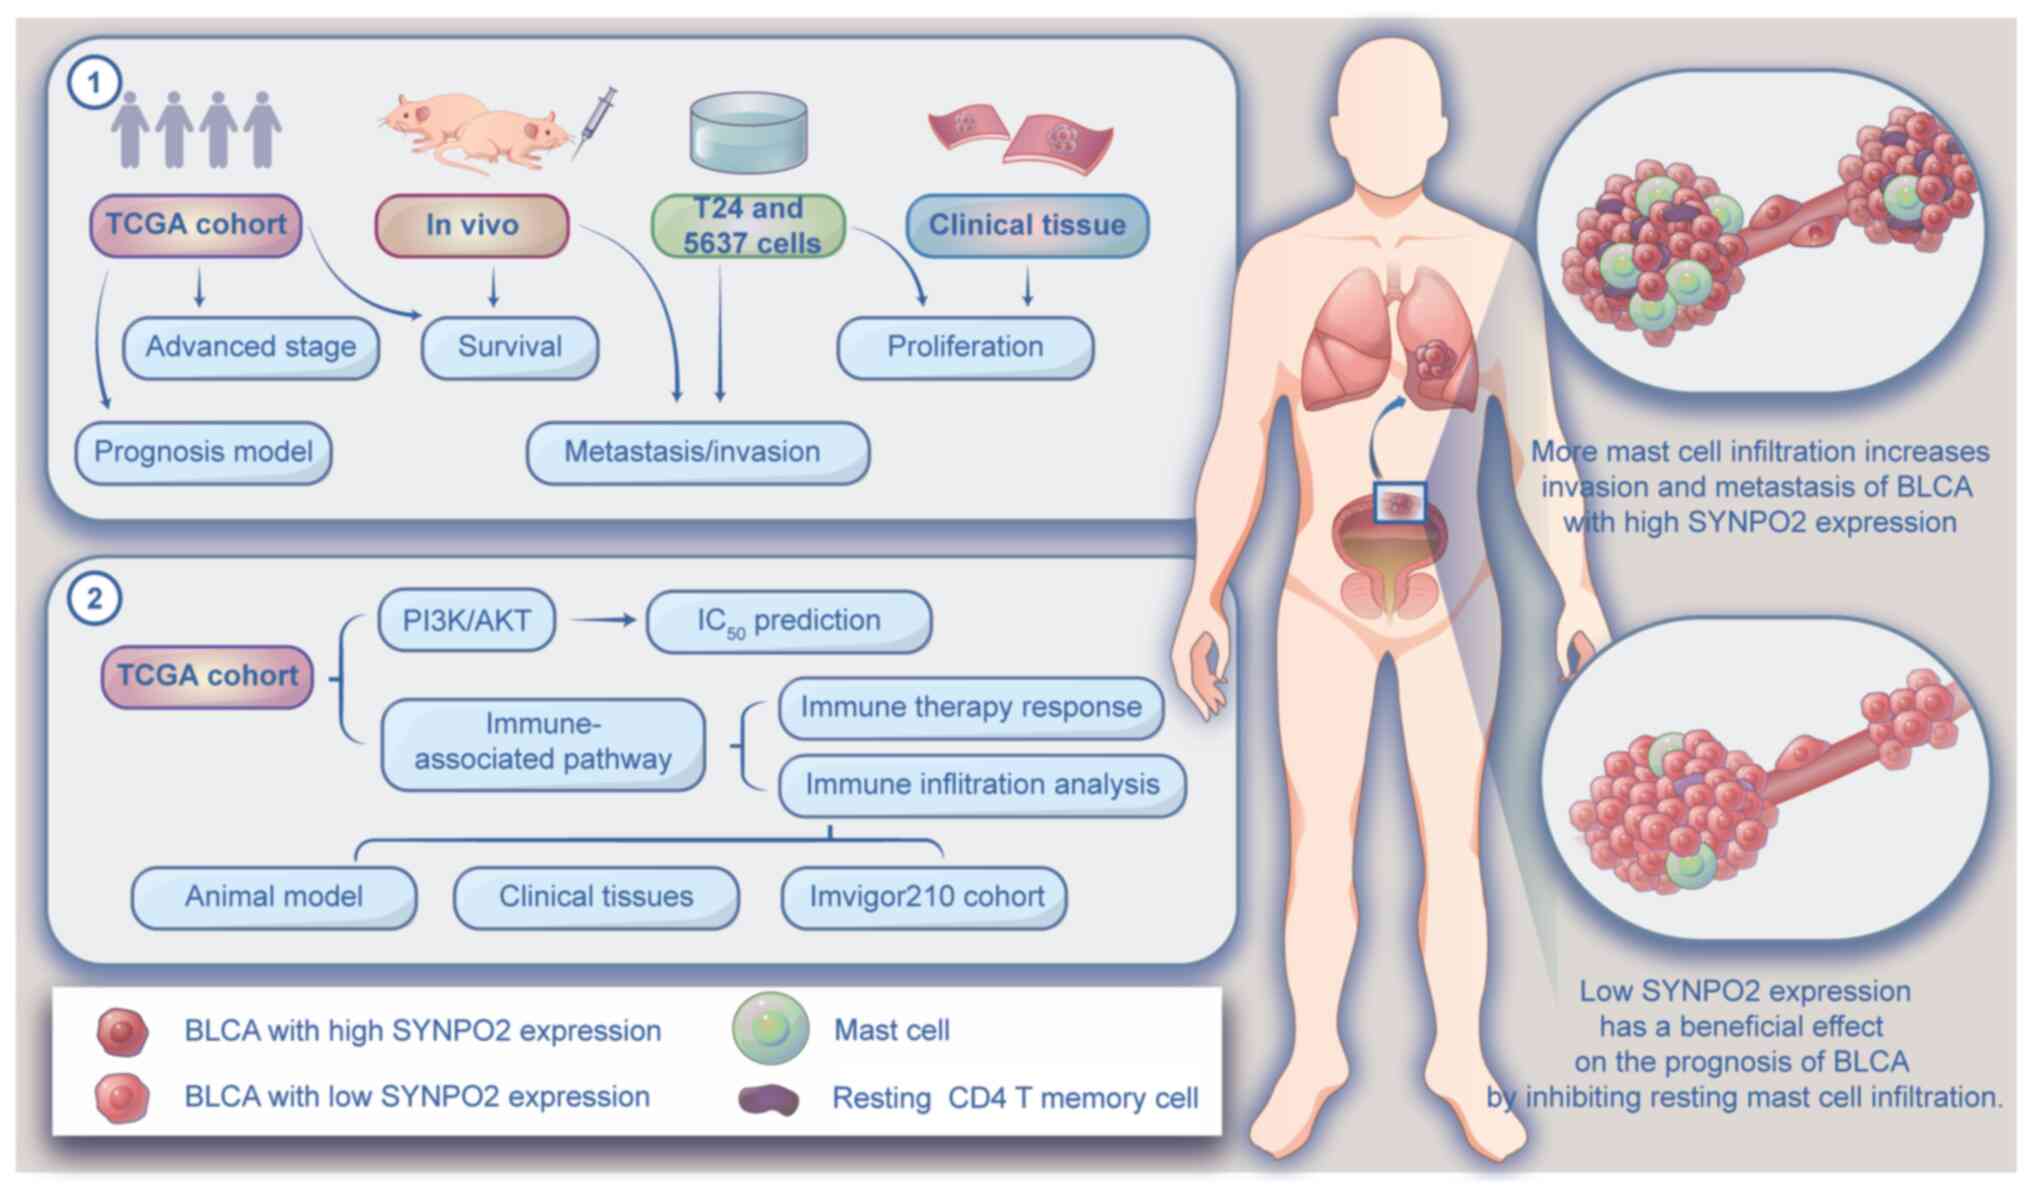
Notably, drug resistance poses a challenge in the treatment of
patients with advanced BLCA. A study reported that TEA domain
family member 4 promotes BLCA invasion by activating
epithelial-mesenchymal transition via the PI3K/AKT pathway
(43,44). Here, high SYNPO2 expression
correlated with resistance to conventional chemotherapy agents such
as paclitaxel, cisplatin and doxorubicin and increased sensitivity
to PI3K/AKT-targeted drugs, suggesting that patients with high
SYNPO2 expression may benefit more from targeted therapies such as
rapamycin, MK-2206 and AZD8055 (Fig.
7).
Immune cell infiltration serves a crucial role in
tumor progression by shaping the BLCA microenvironment. Innate
immune cells participate in immune suppression, inhibiting adaptive
immune responses in the early stages of tumor development (45). For example, mast cells stimulate
IL-17 secretion from myeloid-derived suppressor cells, leading to
IL-9 release from regulatory T (Treg) cells, thereby promoting
tumor growth in the microenvironment (46). The present study observed
significant correlations between SYNPO2 expression and infiltration
of various innate immune cells, including mast cells, eosinophils,
NK cells, immature dendritic Cells (iDC), B cells, macrophages,
plasmacytoid dendritic cell (pDC), follicular helper T cell (TFH),
DC, neutrophils and memory T cell (Tem) and T cells. GO analysis
revealed that SYNPO2 was involved in multiple classical pathways
associated with innate immune regulation, such as complement
activation, formation of immunoglobulin complexes and
antigen-binding process. Therefore, SYNPO2 can induce the
infiltration of suppressive innate immune cells, thereby increasing
BLCA development and progression via the regulation of
immune-associated signaling pathways.
Mast cells are innate immune cells commonly found in
connective tissue near lymphatic systems, blood vessels, skin and
the gastrointestinal tract. Their degranulation is a fundamental
biological process involved in immune responses (47). This process also involves the
release of various inflammatory mediators, including TNF-α and β,
IL-10, chemokines such as CXCL10 and CXCL8, as well as other
factors such as histamine. It serves a pivotal role in recruiting
and regulating immune cells within the tumor microenvironment
(48). Certain studies suggest that
mast cells exert anti-tumor effects by secreting inflammatory
factors that recruit CD4/CD8+ T and NK cells (49,50).
However, other evidence indicates that higher mast cell density in
bladder cancer is associated with high-grade transitional cell
carcinoma (TCC) and serves as a poor prognostic factor for TCC
(51). The gradual release of
granules from mast cells is associated with immunosuppression and
tumor angiogenesis. For example, Visciano et al (52) reported that mast cells promote
epithelial-mesenchymal transition in cancer tissue by releasing
IL-6, VEGF-A and CXCL8. The present study revealed a significant
association between SYNPO2 expression and mast cell infiltration,
with increased mast cell infiltration being negatively correlated
with BLCA survival. Additionally, following PD1/PDL1 immune
therapy, SYNPO2 expression is associated with elevated levels of
resting and decreased abundance of activated mast cells. In the
BLCA mouse model, the high SYNPO2 expression group exhibited
significantly increased serum levels of TGF-β1 and IL-6 originating
from mast cells. Hence, it was hypothesized that SYNPO2-mediated
mast cell infiltration served a crucial role in immunosuppression
in BLCA.
Activation of immune checkpoints plays a critical
role in immunosuppression within BLCA. Tumor cells often exhibit
heightened levels of PD-L1 and B7 ligands that bind to inhibitory
receptors such as PD-1 or CTLA-4 on the surface of T cells, thus
impairing antigen presentation (53). Jiang et al (54) reported that increased PD-1
expression in bladder cancer is linked to reduced 5-year overall
and disease-free survival due to disruptions in immune-associated
signaling pathways. In a humanized mouse melanoma model, it was
observed that the interaction between FOXP3+ Treg and mast cells
confers resistance to anti-PD-1 treatment (55). In the present study, SYNPO2
exhibited co-expression with immune checkpoint genes such as
CTLA-4, PD1 and PDL2 in BLCA and higher SYNPO2 expression was
correlated with increased resistance to immune checkpoint
inhibitors, indicating the potential role of SYNPO2 in hindering
the efficacy of immune therapy by upregulating expression of immune
checkpoint genes. These data support SYNPO2 as a promising
candidate target for immune therapy in BLCA.
Acknowledgements
The authors would like to thank Professor Zhang
Yanmei and Dr Yu Jie (Center for Molecular Medicine, Hangzhou
Medical College, Hangzhou, CHINA) for instructive advice on the
manuscript.
Funding
The present study was supported by the Natural Science
Foundation of Zhejiang Province (grant no. LQQ20H160001), Youth
Foundation of Zhejiang Academy of Medical Sciences (grant no.
2019Y003) and Natural Science Foundation of Ningbo (grant no.
2021J296).
Availability of data and materials
The datasets used and/or analyzed during the current
study are available from the corresponding author on reasonable
request.
Authors' contributions
YS and XZ designed the study. GY and LT confirmed
the authenticity of all the raw data. ZL and XL were involved in
data collection, interpretation and analysis. YS and GY performed
the literature review and wrote the manuscript. All authors have
read and approved the final manuscript.
Ethics approval and consent to
participate
The present study was approved by the Institutional
Research Ethics Committee of NingBo Medical Center Lihuili
Hospital, Ningbo, CHINA (approval no. KY2022PJ024). The animal
experiments were approved by Institutional Animal Care and Use
Committee, Hangzhou, China; approval no.
ZJCLCA-IACUC-20040088).
Patient consent for publication
Not applicable.
Competing interests
The authors declare that they have no competing
interests.
References
|
1
|
Siegel RL, Miller KD, Wagle NS and Jemal
A: Cancer statistics, 2023. CA Cancer J Clin. 73:17–48. 2023.
View Article : Google Scholar : PubMed/NCBI
|
|
2
|
Tran L, Xiao JF, Agarwal N, Duex JE and
Theodorescu D: Advances in bladder cancer biology and therapy. Nat
Rev Cancer. 21:104–121. 2021. View Article : Google Scholar : PubMed/NCBI
|
|
3
|
Lenis AT, Lec PM and Chamie K: Bladder
cancer. JAMA. 324:20062020. View Article : Google Scholar : PubMed/NCBI
|
|
4
|
Larsen ES, Joensen UN, Poulsen AM, Goletti
D and Johansen IS: Bacillus Calmette-Guérin immunotherapy for
bladder cancer: A review of immunological aspects, clinical effects
and BCG infections. APMIS. 128:92–103. 2020. View Article : Google Scholar : PubMed/NCBI
|
|
5
|
Zhao J, Zhou L, Pan Y and Chen L: A
systematic review and meta-analysis of radical cystectomy in the
treatment of muscular invasive bladder cancer (MIBC). Transl Androl
Urol. 10:3476–3485. 2021. View Article : Google Scholar : PubMed/NCBI
|
|
6
|
Guo CC and Czerniak B: Molecular taxonomy
and immune checkpoint therapy in bladder cancer. Surg Pathol Clin.
15:681–694. 2022. View Article : Google Scholar : PubMed/NCBI
|
|
7
|
Zheng Z and Song Y: Synaptopodin-2: A
potential tumor suppressor. Cancer Cell Int. 23:1582023. View Article : Google Scholar : PubMed/NCBI
|
|
8
|
Leinweber BD, Fredricksen RS, Hoffman DR
and Chalovich JM: Fesselin: A novel synaptopodin-like actin binding
protein from muscle tissue. J Muscle Res Cell Motil. 20:539–545.
1999. View Article : Google Scholar : PubMed/NCBI
|
|
9
|
Faul C, Dhume A, Schecter AD and Mundel P:
Protein kinase A, Ca2+/calmodulin-dependent kinase II, and
calcineurin regulate the intracellular trafficking of myopodin
between the Z-disc and the nucleus of cardiac myocytes. Mol Cell
Biol. 27:8215–8227. 2007. View Article : Google Scholar : PubMed/NCBI
|
|
10
|
De Ganck A, De Corte V, Bruyneel E, Bracke
M, Vandekerckhove J and Gettemans J: Down-regulation of myopodin
expression reduces invasion and motility of PC-3 prostate cancer
cells. Int J Oncol. 34:1403–1409. 2009.PubMed/NCBI
|
|
11
|
Linnemann A, Vakeel P, Bezerra E, Orfanos
Z, Djinović-Carugo K, van der Ven PF, Kirfel G and Fürst DO:
Myopodin is an F-actin bundling protein with multiple independent
actin-binding regions. J Muscle Res Cell Motil. 34:61–69. 2013.
View Article : Google Scholar : PubMed/NCBI
|
|
12
|
Kai F, Fawcett JP and Duncan R:
Synaptopodin-2 induces assembly of peripheral actin bundles and
immature focal adhesions to promote lamellipodia formation and
prostate cancer cell migration. Oncotarget. 6:11162–11174. 2015.
View Article : Google Scholar : PubMed/NCBI
|
|
13
|
Liu J, Ye L, Li Q, Wu X, Wang B, Ouyang Y,
Yuan Z, Li J and Lin C: Synaptopodin-2 suppresses metastasis of
triple-negative breast cancer via inhibition of YAP/TAZ activity. J
Pathol. 244:71–83. 2018. View Article : Google Scholar : PubMed/NCBI
|
|
14
|
Roperto S: Role of BAG3 in bovine
Deltapapillomavirus-mediated autophagy. J Cell Biochem. 123:59–64.
2022. View Article : Google Scholar : PubMed/NCBI
|
|
15
|
Faul C, Hüttelmaier S, Oh J, Hachet V,
Singer RH and Mundel P: Promotion of importin alpha-mediated
nuclear import by the phosphorylation-dependent binding of cargo
protein to 14-3-3. J Cell Biol. 169:415–424. 2005. View Article : Google Scholar : PubMed/NCBI
|
|
16
|
Livak KJ and Schmittgen TD: Analysis of
relative gene expression data using real-time quantitative PCR and
the 2(−Delta Delta C(T)) method. Methods. 25:402–408. 2001.
View Article : Google Scholar : PubMed/NCBI
|
|
17
|
Love MI, Huber W and Anders S: Moderated
estimation of fold change and dispersion for RNA-seq data with
DESeq2. Genome Biol. 15:5502014. View Article : Google Scholar : PubMed/NCBI
|
|
18
|
Wu T, Hu E, Xu S, Chen M, Guo P, Dai Z,
Feng T, Zhou L, Tang W, Zhan L, et al: clusterProfiler 4.0: A
universal enrichment tool for interpreting omics data. Innovation
(Camb). 2:1001412021.PubMed/NCBI
|
|
19
|
Geeleher P, Cox N and Huang RS:
pRRophetic: An R package for prediction of clinical
chemotherapeutic response from tumor gene expression levels. PLoS
One. 9:e1074682014. View Article : Google Scholar : PubMed/NCBI
|
|
20
|
Aran D, Hu Z and Butte AJ: xCell:
Digitally portraying the tissue cellular heterogeneity landscape.
Genome Biol. 18:2202017. View Article : Google Scholar : PubMed/NCBI
|
|
21
|
Jiang P, Gu S, Pan D, Fu J, Sahu A, Hu X,
Li Z, Traugh N, Bu X, Li B, et al: Signatures of T cell dysfunction
and exclusion predict cancer immunotherapy response. Nat Med.
24:1550–1558. 2018. View Article : Google Scholar : PubMed/NCBI
|
|
22
|
Mariathasan S, Turley SJ, Nickles D,
Castiglioni A, Yuen K, Wang Y, Kadel EI III, Koeppen H, Astarita
JL, Cubas R, et al: TGFβ attenuates tumour response to PD-L1
blockade by contributing to exclusion of T cells. Nature.
554:544–548. 2018. View Article : Google Scholar : PubMed/NCBI
|
|
23
|
Wang Y, Ju L, Wang G, Qian K, Jin W, Li M,
Yu J, Shi Y, Wang Y, Zhang Y, et al: DNA polymerase POLD1 promotes
proliferation and metastasis of bladder cancer by stabilizing MYC.
Nat Commun. 14:24212023. View Article : Google Scholar : PubMed/NCBI
|
|
24
|
Tan TZ, Rouanne M, Tan KT, Huang RY and
Thiery JP: Molecular subtypes of urothelial bladder cancer: Results
from a meta-cohort analysis of 2411 tumors. Eur Urol. 75:423–432.
2019. View Article : Google Scholar : PubMed/NCBI
|
|
25
|
Wu X, Lv D, Cai C, Zhao Z, Wang M, Chen W
and Liu Y: A TP53-associated immune prognostic signature for the
prediction of overall survival and therapeutic responses in
muscle-invasive bladder cancer. Front Immunol. 11:5906182020.
View Article : Google Scholar : PubMed/NCBI
|
|
26
|
Huang S, Hua X, Kuang M, Zhu J, Mu H, Tian
Z, Zheng X and Xie Q: miR-190 promotes malignant transformation and
progression of human urothelial cells through CDKN1B/p27
inhibition. Cancer Cell Int. 21:2412021. View Article : Google Scholar : PubMed/NCBI
|
|
27
|
Koch J, Schober SJ, Hindupur SV, Schöning
C, Klein FG, Mantwill K, Ehrenfeld M, Schillinger U, Hohnecker T,
Qi P, et al: Targeting the Retinoblastoma/E2F repressive complex by
CDK4/6 inhibitors amplifies oncolytic potency of an oncolytic
adenovirus. Nat Commun. 13:46892022. View Article : Google Scholar : PubMed/NCBI
|
|
28
|
Chen Z, Chen X, Xie R, Huang M, Dong W,
Han J, Zhang J, Zhou Q, Li H, Huang J and Lin T: DANCR promotes
metastasis and proliferation in bladder cancer cells by enhancing
IL-11-STAT3 signaling and CCND1 expression. Mol Ther. 27:326–341.
2019. View Article : Google Scholar : PubMed/NCBI
|
|
29
|
Pastushenko I and Blanpain C: EMT
transition states during tumor progression and metastasis. Trends
Cell Biol. 29:212–226. 2019. View Article : Google Scholar : PubMed/NCBI
|
|
30
|
Zhang Z, Yu Y, Li P, Wang M, Jiao W, Liang
Y and Niu H: Identification and validation of an immune signature
associated with EMT and metabolic reprogramming for predicting
prognosis and drug response in bladder cancer. Front Immunol.
13:9546162022. View Article : Google Scholar : PubMed/NCBI
|
|
31
|
Alzahrani AS: PI3K/Akt/mTOR inhibitors in
cancer: At the bench and bedside. Semin Cancer Biol. 59:125–132.
2019. View Article : Google Scholar : PubMed/NCBI
|
|
32
|
Xing Y, Lin NU, Maurer MA, Chen H, Mahvash
A, Sahin A, Akcakanat A, Li Y, Abramson V, Litton J, et al: Phase
II trial of AKT inhibitor MK-2206 in patients with advanced breast
cancer who have tumors with PIK3CA or AKT mutations, and/or PTEN
loss/PTEN mutation. Breast Cancer Res. 21:782019. View Article : Google Scholar : PubMed/NCBI
|
|
33
|
Hu W, Zhang Y, Ning J, Li M, Tang Y, Li L,
Cheng F and Yu W: Anti-tumor effect of AZD8055 against bladder
cancer and bladder cancer-associated macrophages. Heliyon.
9:e142722023. View Article : Google Scholar : PubMed/NCBI
|
|
34
|
Camidge DR, Otterson GA, Clark JW,
Ignatius Ou SH, Weiss J, Ades S, Shapiro GI, Socinski MA, Murphy
DA, Conte U, et al: Crizotinib in patients with MET-amplified
NSCLC. J Thorac Oncol. 16:1017–1029. 2021. View Article : Google Scholar : PubMed/NCBI
|
|
35
|
Zou Z, Chen J, Yang J and Bai X: Targeted
inhibition of Rictor/mTORC2 in cancer treatment: A new era after
rapamycin. Curr Cancer Drug Targets. 16:288–304. 2016. View Article : Google Scholar : PubMed/NCBI
|
|
36
|
Chen J, Wu S, Peng Y, Zhao Y, Dong Y, Ran
F, Geng H, Zhang K, Li J, Huang S and Wang Z: Constructing a cancer
stem cell related prognostic model for predicting immune landscape
and drug sensitivity in colorectal cancer. Front Pharmacol.
14:12000172023. View Article : Google Scholar : PubMed/NCBI
|
|
37
|
Sun Y, Chen Y, Zhuang W, Fang S, Chen Q,
Lian M, Lv C, Weng J, Wei R, Lin Y, et al: Gastric cancer
peritoneal metastasis related signature predicts prognosis and
sensitivity to immunotherapy in gastric cancer. J Cell Mol Med. Aug
21–2023.(Epub ahead of print). View Article : Google Scholar
|
|
38
|
Topalian SL, Taube JM, Anders RA and
Pardoll DM: Mechanism-driven biomarkers to guide immune checkpoint
blockade in cancer therapy. Nat Rev Cancer. 16:275–287. 2016.
View Article : Google Scholar : PubMed/NCBI
|
|
39
|
Bagchi S, Yuan R and Engleman EG: Immune
checkpoint inhibitors for the treatment of cancer: Clinical impact
and mechanisms of response and resistance. Annu Rev Pathol.
16:223–249. 2021. View Article : Google Scholar : PubMed/NCBI
|
|
40
|
Gan L, Camarena V, Mustafi S and Wang G:
Vitamin C inhibits triple-negative breast cancer metastasis by
affecting the expression of YAP1 and synaptopodin 2. Nutrients.
11:29972019. View Article : Google Scholar : PubMed/NCBI
|
|
41
|
OuYang C, Xie Y, Fu Q and Xu G: SYNPO2
suppresses hypoxia-induced proliferation and migration of
colorectal cancer cells by regulating YAP-KLF5 axis. Tissue Cell.
73:1015982021. View Article : Google Scholar : PubMed/NCBI
|
|
42
|
Chang SL, Yang CC, Lai HY, Tsai HH, Yeh
CF, Lee SW, Kuo YH, Kang NW, Wu WB and Chen TJ: SYNPO2 upregulation
is an unfavorable prognostic factor for nasopharyngeal carcinoma
patients. Medicine (Baltimore). 102:e344262023. View Article : Google Scholar : PubMed/NCBI
|
|
43
|
Chi M, Liu J, Mei C, Shi Y, Liu N, Jiang
X, Liu C, Xue N, Hong H, Xie J, et al: TEAD4 functions as a
prognostic biomarker and triggers EMT via PI3K/AKT pathway in
bladder cancer. J Exp Clin Canc Res. 41:1752022. View Article : Google Scholar
|
|
44
|
Wang J, Shen C, Zhang J, Zhang Y, Liang Z,
Niu H, Wang Y and Yang X: TEAD4 is an immune regulating-related
prognostic biomarker for bladder cancer and possesses
generalization value in pan-cancer. DNA Cell Biol. 40:798–810.
2021. View Article : Google Scholar : PubMed/NCBI
|
|
45
|
Li MO, Wolf N, Raulet DH, Akkari L, Pittet
MJ, Rodriguez PC, Kaplan RN, Munitz A, Zhang Z, Cheng S and
Bhardwaj N: Innate immune cells in the tumor microenvironment.
Cancer Cell. 39:725–729. 2021. View Article : Google Scholar : PubMed/NCBI
|
|
46
|
Yang Z, Zhang B, Li D, Lv M, Huang C, Shen
GX and Huang B: Mast cells mobilize myeloid-derived suppressor
cells and Treg cells in tumor microenvironment via IL-17 pathway in
murine hepatocarcinoma model. PLoS One. 5:e89222010. View Article : Google Scholar : PubMed/NCBI
|
|
47
|
Aponte-López A and Muñoz-Cruz S: Mast
cells in the tumor microenvironment. Adv Exp Med Biol.
1273:159–173. 2020. View Article : Google Scholar : PubMed/NCBI
|
|
48
|
Komi DEA and Redegeld FA: Role of mast
cells in shaping the tumor microenvironment. Clin Rev Allerg Immu.
58:313–325. 2020. View Article : Google Scholar : PubMed/NCBI
|
|
49
|
Dalton DK and Noelle RJ: The roles of mast
cells in anticancer immunity. Cancer Immunol Immunother.
61:1511–1520. 2012. View Article : Google Scholar : PubMed/NCBI
|
|
50
|
Elieh Ali Komi D and Grauwet K: Role of
mast cells in regulation of T cell responses in experimental and
clinical settings. Clin Rev Allergy Immunol. 54:432–445. 2018.
View Article : Google Scholar : PubMed/NCBI
|
|
51
|
Kim JH, Kang YJ, Kim DS, Lee CH, Jeon YS,
Lee NK and Oh MH: The relationship between mast cell density and
tumour grade in transitional cell carcinoma of the bladder. J Int
Med Res. 39:1675–1681. 2011. View Article : Google Scholar : PubMed/NCBI
|
|
52
|
Visciano C, Liotti F, Prevete N, Cali' G,
Franco R, Collina F, de Paulis A, Marone G, Santoro M and Melillo
RM: Mast cells induce epithelial-to-mesenchymal transition and stem
cell features in human thyroid cancer cells through an
IL-8-Akt-Slug pathway. Oncogene. 34:5175–5186. 2015. View Article : Google Scholar : PubMed/NCBI
|
|
53
|
Morad G, Helmink BA, Sharma P and Wargo
JA: Hallmarks of response, resistance, and toxicity to immune
checkpoint blockade. Cell. 185:5762022. View Article : Google Scholar : PubMed/NCBI
|
|
54
|
Jiang LR, Zhang N, Chen ST, He J, Liu YH,
Han YQ, Shi XQ, Yang JJ, Mu DY, Fu GH and Gao F: PD-1-positive
tumor-associated macrophages define poor clinical outcomes in
patients with muscle invasive bladder cancer through potential
CD68/PD-1 complex interactions. Front Oncol. 11:6799282021.
View Article : Google Scholar : PubMed/NCBI
|
|
55
|
Somasundaram R, Connelly T, Choi R, Choi
H, Samarkina A, Li L, Gregorio E, Chen Y, Thakur R, Abdel-Mohsen M,
et al: Tumor-infiltrating mast cells are associated with resistance
to anti-PD-1 therapy. Nat Commun. 12:3462021. View Article : Google Scholar : PubMed/NCBI
|