Introduction
Lung cancer is the most common cause of
cancer-associated mortalities worldwide (1). The majority of cases (>85%) are
classified as non-small cell lung cancer (NSCLC), with lung
adenocarcinoma (LUAD) being the prevailing clinicopathological type
(2). Despite important advancements
in the diagnosis and treatment of lung cancer over the last few
decades, the 5-year relative survival rate for patients with lung
cancer is only 18% (3). Currently,
diagnosing lung cancer mainly relies on histopathological
examination, tumor molecular biological markers and imaging
evaluation, which makes early detection and diagnosis challenging
(4,5). This difficulty in early detection and
diagnosis may explain the high mortality rate of this disease.
Therefore, it is crucial to improve the current understanding of
the underlying mechanisms of lung cancer, and to develop effective
screening and diagnostic techniques to improve therapeutic efficacy
and the quality of life of patients (6).
Certain reports have highlighted the aberrant
expression of numerous genes within tumor cells, and these
differentially expressed genes (DEGs) are implicated in various
biological processes such as glucose metabolism and gene
transcription, which in turn influence tumorigenesis (7,8). Some
genes have been extensively investigated and found to play crucial
roles in human cancer. For instance, peroxiredoxins foster the
carcinogenesis and progression of gastric cancer via the
elimination of reactive oxygen species (9); cystatin-1 can accelerate colorectal
cancer proliferation via p65 gene regulation (10); ribonucleotide reductase regulatory
subunit M2 impedes migration, invasion and angiogenesis of breast
cancer cells by targeting MAPK signaling pathways (11,12);
cyclin B1 accelerates lung cancer proliferation and invasion by
modulating the cell cycle (13,14).
In the present study, RNA expression profile data
and clinical data of patients with LUAD were downloaded from the
Gene Expression Omnibus (GEO) and The Cancer Genome Atlas (TCGA)
databases. Through high throughput bioinformatic analysis, aberrant
DEGs were identified in cancerous and normal tissues of patients
with LUAD from the databases. Based on these DEGs, a prognostic
model was developed and validated, and a composite prognostic
column line graph that combined risk score-DEGs with clinical
features was constructed. Additionally, the present study
systematically explored the potential functions and molecular
mechanisms of key genes using in vitro and in vivo
assays.
The present findings may serve as biomarkers for
diagnosing and predicting the prognosis of LUAD. Such biomarkers
are important for understanding the mechanisms underlying LUAD and
for improving clinical prevention, diagnosis and prognosis.
Materials and methods
Data downloading and processing
A total of five LUAD RNA expression profiles
(accession nos. GSE31210, GSE118370, GSE72094, GSE30219 and
GSE68465) (15–19) were obtained from the publicly
available GEO database (http://www.ncbi.nlm.nih.gov/geo). Among these
profiles, GSE31210 consisted of 226 cases of LUAD tumor tissue and
20 cases of adjacent normal tissue; GSE118370 included 6 cases of
LUAD tumor tissue and 6 cases of adjacent normal tissue; GSE72094
contained 398 cases of LUAD tumor tissue; GSE30219 contained 85
cases of LUAD tumor tissue; and GSE68465 contained 441cases of LUAD
tumor tissue. Additionally, RNA sequencing datasets and relevant
clinical information were retrieved from 54 adjacent normal tissue
samples and 497 TCGA-LUAD samples from TCGA database (https:www.cancer.gov/ccg/research/genome-sequencing/tcga.
Detailed sample and clinical information of the patients is shown
in Table SI. Analysis was
performed using the Limma software package in R (version 3.6.2;
http://www.r-project.org/) to identify
common DEGs in the GEO datasets, applying the screening criteria of
|log2 fold-change|≥1 and P<0.05. Subsequently, the identified
DEGs were validated and screened using TCGA dataset.
Construction and module screening of a
protein-protein interaction (PPI) network
PPIs among all DEGs were assessed using the STRING
online network tool (https://string-db.org/). The resulting network was
constructed and visualized using Cytoscape 3.6.1 software
(https://cytoscape.org). To identify key modules
within this network, the Molecular Complex Detection (MCODE) plugin
was employed within Cytoscape. The selection criteria for modules
included a score and a number of nodes >5 within the PPI
network.
Gene Ontology (GO) and Kyoto
Encyclopedia of Genes and Genomes (KEGG) functional enrichment
analysis
Through GO (https://www.geneontology.org/) enrichment, the
biological functions of the identified DEGs were systematically
studied, including molecular function (MF), biological process (BP)
and cellular component (CC). KEGG (https://www.genome.jp/kegg/) was used to detect the
potential biological pathways of DEGs. All enrichment analyses were
conducted using WebGestalt (http://www.webgestalt.org/) network gene set analysis
kit. P<0.05 and false discovery rate <0.05 were considered to
indicate a statistically significant difference.
Construction of a prognostic
prediction model
Univariate and multivariate Cox regression analyses
were performed on the DEGs using the ‘Survival’ package in R to
identify DEGs associated with prognosis. Based on the screened
DEGs, a multivariate Cox proportional risk regression model was
constructed. The gene regression coefficients (Coef) of the model
were calculated by combining patient survival time, survival status
and the expression levels of prognosis-related genes using a
multifactorial Cox regression algorithm. Coef was calculated using
the following formula:
h(t,X)=h0(t)exp(β'X)=h0(t)exp(β1X1+β2X2+β3X3+…+βmXm), where h(t,X)
represents the hazard function of an individual with covariates X
at t, where t represents the survival time; X=(X1,X2,…,Xm)':
covariates that may affect the survival time. h0(t) represents the
baseline hazard function when all covariate values are set to zero.
β=(β1,β2,…,βm)› refers to Coef of the Cox model. A risk score was
used to assess the prognostic outcome of patients. The risk score
formula for each sample was as follows: Risk score =∑i=1nExpi βi, where β represents the
regression Coef and Exp represents the gene expression level. To
evaluate the performance of this prognostic model, patients with
LUAD were divided into low and high-risk groups based on the median
risk score. The log-rank test was used to compare the differences
in overall survival (OS) rate between the high and low-risk groups,
and the ‘Survival’ receiver operating characteristic (ROC) package
from R was used to assess the prediction ability of the model.
Prognostic value of different clinical
features and construction of an alignment map
An analysis of the prognostic value of different
clinical features in patients with LUAD was conducted using TCGA
and GSE31210 datasets. This analysis involved performing
univariate-multivariate Cox regression and using ROC curves to
evaluate the accuracy of the aforementioned clinical features as
independent prognostic factors for predicting OS in patients with
LUAD. To further evaluate the reliability of the prediction model,
the rms R package was utilized to create a nomogram and calibration
chart. These tools allowed the prediction of the 3 and 5-year OS
rates of patients based on the DEGs-Risk score and other clinical
characteristics. Internal validation was conducted using TCGA
cohort. To predict survival rates at specific time points (1, 3 and
5 years), Cox proportional hazards regression was employed. The
formula used for this prediction was as follows:
S(t)=S0(t)exp(β1*X1+β2*X2+β3*X3+…+βn*Xn), where S(t)
represents the predicted survival rate, S0(t) denotes the baseline
survival rate, exp() represents the exponential function, β refers
to the regression Coef, and X represents the independent variables
selected for the model, such as age, sex and gene expression.
Validation of key gene expression
levels and prognostic significance
The protein expression level of key prognostic genes
was examined using the Human Protein Atlas (HPA) database
(http://www.proteinatlas.org/). The mRNA
expression levels, prognostic correlations and expression
differences of these genes at different stages of LUAD were
analyzed using the Gene Expression Profiling Interactive Analysis
(GEPIA) database (http://gepia.cancer-pku.cn/). Furthermore, the
association between the identified key prognostic genes and patient
prognosis was validated using the cancer prognosis Kaplan-Meier
plotter database (http://kmplot.com/). High expression
was defined as above the median expression level and low expression
was defined as below the median expression level.
Cell culture
Cells, including human normal lung epithelial cells
[BEAS-2B; American Type Culture Collection (ATCC)], human lung
cancer cells (A549; ATCC), human LUAD cells (NCI-H1975; ATCC),
mouse lung cancer cells (Lewis) and 293T cells (Procell Life
Technology Co., Ltd.), were cultured in RPMI-1640 medium containing
10% fetal bovine serum and 1% penicillin/streptomycin (all Gibco;
Thermo Fisher Scientific, Inc.). All cells were cultured in a
constant-temperature incubator at 37°C with 5% CO2.
Before use, all cell lines were tested for mycoplasma contamination
and authenticated by STR analysis.
Small interference RNA (siRNA)
transfection assay
A549 and NCI-H1975 Cells in the logarithmic growth
phase were selected for transfection when the cell density reached
70%. For transfection, Lipofectamine 3000 transfection medium
mixture (Thermo Fisher Scientific, Inc.) was added dropwise to the
siRNA (20 µM) oligo medium mixture, mixed gently with a pipette and
allowed to sit at room temperature for 15–20 min. After adding the
transfection mixture to the cells, the plate was gently shaken to
ensure an even distribution of the complexes. Next, the cells were
incubated in a 37°C, 5% CO2 incubator for 4–6 h before
replacing the medium with complete culture medium and continuing
the incubation. CDC6 protein expression was detected 48 h
post-transfection. The sequences for si_cell division cycle 6
(CDC6) and si_negative control (NC) were as follows:
5′-GAGCUCUGGAUUUCCACCGTT-3′ and 5′-CAUUCUGGUACUGUCUGGATT-3′,
respectively (Shanghai GenePharma Co., Ltd.).
Wound healing experiment
After trypsin digestion, the cells were centrifuged
at 300 × g for 5 min at room temperature. The cell pellet was then
resuspended in 1640 serum-free medium, and cell counting was
performed in a biosafety cabinet. The cell concentration was
adjusted to ~4×10⁵ cells/ml. Next, the cells were
inoculated into 6-well plates with three replicate wells for each
group. Cell proliferation was observed until a ≥70% confluency was
reached. Next, parallel scratches were made in each well using a
10-µl pipette tip. The cells were then cultured in serum-free
RPMI-1640 medium, and the width of the scratches was observed under
a light microscope at 0, 24 and 48 h. Images were taken at each
time point (20).
MTS assay for detecting cell
proliferation
Cells from both the si_NC and si_CDC6 groups were
collected and inoculated into a 96-well plate, with each well
containing 1,500 cells. To ensure accuracy, three replicate wells
were prepared for each group. The plate was then incubated for 12,
24, 36 and 48 h at 37°C. Subsequently, 20 µl MTS (Abcam) reagent
was added to each well, and the plate was incubated for a further 2
h. Next, the optical density of the samples at 490 nm was
determined using an ELISA plate reader.
Colony formation experiment
The cell concentration was adjusted to
2×10³ cells/ml using cell culture medium. Next, 2 ml of
cells were added to each well of a 6-well plate and cultured for 3
days. During this period, the status of the cells was observed
daily, and the culture medium was replaced as necessary. Next, the
cells were washed twice with PBS and fixed with 4% paraformaldehyde
for 15 min at room temperature, followed by another wash with PBS.
Next, the cells were stained overnight with Giemsa solution (2
ml/well) at room temperature for 20 min and the cell clones were
counted. A cluster of ≥50 cells was counted as a single cell
colony, and the number of colonies was manually counted in the
field of view.
Transwell migration and invasion
assays
For the migration assay, cells from the si_NC and
si_CDC6 groups were collected and diluted with serum-free culture
medium. Then, the cells were plated at a density of
5×10⁴ cells/well in the upper chamber of Transwell
plates (200 µl/well), with complete culture medium added to the
lower chamber. For the invasion assay, Matrigel matrix (Corning,
Inc.) was diluted with serum-free culture medium at a 1:9 ratio and
incubated at 37°C for 4 h. Then, 60 µl of the diluted Matrigel
matrix was added to the upper chamber of the Transwell plates.
Following Matrigel coating, the cells were plated at a density of
5×10⁴ cells/well in the upper chamber (200 µl/well),
with complete culture medium added to the lower chamber. After 24 h
at 37°C both sides of the chamber were washed with PBS, and the
cells were fixed with 10% formalin for 20 min at room temperature.
Subsequently, the cells were stained with crystal violet at room
temperature for 20 min, and the migration/invasion status of cells
was observed and random field images were captured (21) using a light microscope (IXplore
Standard; Olympus Corporation).
Western blotting
After the cells were lysed with RIPA buffer (cat.
no. P0013C; Beyotime Institute of Biotechnology), the supernatant
was extracted, 5X SDS sample buffer was added to each sample and
the samples were mixed thoroughly. The mixture was heated at 95°C
for 5 min to denature the isolated proteins, and the denatured
proteins were separated using SDS-PAGE (12% gel). The proteins were
then transferred from the gel onto PVDF membranes. Next, the target
protein strips were cut and the strips were blocked in 5% skim milk
for 1 h at room temperature. The membranes were then incubated
overnight at 4°C with specific primary antibodies, and then for 1 h
at room temperature with the secondary antibody (prepared in 5%
skim milk). The membranes were then washed three times in TBS-Tween
20 (0.1%) for 5 min each. Finally, the membranes were incubated
with ECL for 30 sec, and the results were collected using an
imager. Additionally, the expression level of β-actin in the
samples was detected prior to loading, and protein gray value
analysis was performed using ImageJ (version 1.52a; National
Institutes of Health). According to the gray value, 1X SDS was used
to dilute the protein concentration in different samples to
maintain consistency, with 15–20 µl of protein sample added to each
lane. The primary antibodies used in the study included CDC6
(1:500; cat. no. A18249; ABclonal Biotech Co., Ltd.), CDK2
(1:1,000; cat. no. A0294; ABclonal Biotech Co., Ltd.),CDK4 (1:500;
cat. no. A0366; ABclonal Biotech Co., Ltd.) and β-Actin (1:1,000;
cat. no. AC026; ABclonal Biotech Co., Ltd.). The secondary antibody
used was HRP Goat Anti-Rabbit IgG (H+L) (1:10,000; cat. no. AS014;
ABclonal Biotech Co., Ltd.).
Flow cytometry analysis of the cell
cycle
Treated cells were collected in a flow tube, washed
with 3–4 ml PBS and centrifuged (300 × g for 10 min at 4°C). Upon
discarding the supernatant, ≥5 ml pre-cooled 70–80% ethanol was
slowly added, and the cells were then vortexed and mixed overnight
at 4°C. Next, the cells were centrifuged at 300 × g for 10 min at
4°C and the supernatant was discarded. The cells were then washed
twice to remove all ethanol. Next, the cells were stained by
resuspending in 0.5 ml FxCycle™ PI/RNase Staining Solution (cat.
no. F10797; Thermo Fisher Scientific, Inc.), and incubating for 15
min at room temperature in the dark. Next, the cells were analyzed
using a flow cytometer (FACSDiva™; V8.0; BD Biosciences) within 1 h
(22). ModFit software (ModFit LT;
version 3.3; BD Biosciences) was used for processing and analyzing
the results.
EdU staining assay for detecting cell
proliferation
A549 and H1975 cells in the logarithmic growth phase
were digested to prepare a single-cell suspension. A total of
8×10⁴ cells were inoculated into a confocal dish
(23). After overnight cell
culture, the cells were treated with SAHA (1.25 µmol/l) for 48 h at
4°C. In the blank control group, the same quantity of DMSO was
used. EdU (cat. no. C0078S; Beyotime Institute of Biotechnology)
stock solution was then diluted to 10 µM and 100 µl was added to
each well (final concentration of 5 µM). The cells were then
incubated for 2 h. The medium was then discarded, and the cells
were washed with PBS three times. Next, the cells were fixed with
4% paraformaldehyde for 30 min at room temperature, and then
incubated with 100 µl 0.3% Triton X-100 (cat. no. P0096; Beyotime
Institute of Biotechnology) at room temperature for 15 min. The
click reaction solution (from the aforementioned EdU kit) was then
prepared and incubated with the cells in the dark at room
temperature for 35 min. The reaction solution was then discarded,
and the samples were washed with 1 ml PBS three times. Next, a
1,000X Hoechst reaction solution was prepared and stored away from
the light. A total of 100 µl 1X Hoechst reaction solution was then
added to each well and incubated at room temperature for 35 min in
the dark. The reaction solution was then discarded, and each well
was washed three times with 1 ml PBS. Then, cells were observed
under a fluorescent microscope and images were captured.
Cell line construction
Gene interference nucleotides were designed based on
the National Center for Biotechnology Information gene sequence for
CDC6 (NM_001025779.2). The CDC6 small hairpin RNA (shRNA) and sh_NC
sequences used were as follows: 5′-CAGAAGAATGGTACAAATCCAAG-3′ and
5′-GACAAAGGTAGAACAGTACCAGA-3′, respectively. The total amount of
plasmid used for transfection was 4 µg, with a ratio of
pLVX_sh-RNA_cdc6:psPAX2:pMD.2g (second-generation lentiviral
system) (all from Shanghai GeneChem Co., Ltd.) of 2:1:1.
Transfection was conducted at 37°C, and after 48 h, the viral
supernatant was collected. was transfected into 293T cells. Upon
centrifugation (300 × g for 5 min at 4°C) and filtration, the virus
was collected. Subsequently, Lewis cells in an optimal growth state
(in the logarithmic growth phase and exhibiting a regular and
translucent morphology) were counted and seeded at a density of
2×10⁴ cells/well. Transfection was performed 24 h later,
when the cell confluency reached 60–80%. Each well was then
supplemented with an appropriate amount of virus supernatant and an
equal volume of complete medium (MOI value of 20). At 12 h
post-infection, the supernatant was discarded, and fresh complete
medium was added for further culture passages. Puromycin was added
to each well containing infected Lewis cells at a final
concentration of 1 µg/ml, and GFP expression in Lewis cells was
detected using a fluorescence microscope every 24 h until all
uninfected control cells were killed by puromycin.
Lung cancer mouse model
construction
Animal experiments were conducted in accordance with
the guidelines of The Biomedical Ethics Committee of Anhui
University of Science and Technology (Huainan; China; approval no.
2022-019). C57BL/6 mice (6–8 weeks old, male, weighing 20–23 g)
were acquired from Henan SKBS Laboratory Animal Co., Ltd. These
mice were housed under controlled conditions with free access to
food and water, with a consistent temperature (22–25°C) and
humidity (50–60%), and an alternating 12-h light/dark cycle.
Drinking water was continuously provided and food was supplemented
three times a week. The mice were divided into two groups, and in
each group (n=3), sh_NC or sh_CDC6 transfected Lewis cells
(1×10⁵) in 100 µl PBS were injected into the posterior
tail vein of each mouse in a single administration (24). The duration of the experiment was 30
days. In strict accordance with the principles of animal welfare,
the research team monitored animal health (weight and appetite) and
behavior twice daily. No animals reached the euthanasia criteria
before the end of the study. The criteria for euthanasia of animals
in this experiment were as follows: i) The animal was close to
death (in the absence of anesthesia, the animal was in a state of
mental depression with a body temperature below 37°C) or unable to
move; ii) diarrhea or incontinence; iii) weight loss of 20%
compared to the weight before the experiment; iv) inability to eat
or drink; v) paralysis, persistent seizures or stereotyped behavior
(in the absence of external stimuli, mice exhibited spontaneous
rotation, digging, jumping and grooming behaviors); and vi) other
conditions determined by a veterinarian that require humane
termination. At the end of the study, the mice were administered 2%
isoflurane (cat. no. R510-22-10; RWD Life Science Co., Ltd.) by
mask inhalation and sacrificed by cervical dislocation. Then, the
volume (<1,000 mm3) and number of lung tumors were
recorded. Tumor volume was calculated based on the formula:
V=0.52 × (tumor length) × (tumor width)2.
Statistical analysis
All measurements were performed in triplicate in
three independent experiments, and the quantitative data are
presented as the mean ± SEM. To compare differences between two
groups, the Student's unpaired t-test was employed using GraphPad
Prism 8.0 software (Dotmatics). The ‘Survival’ package in R
(version 3.6.2) was used to plot Kaplan-Meier survival curves, and
the log-rank test was used to calculate the P-value for the
survival curves. Candidate genes were identified using the R
package ‘Venn Diagram’ and univariate Cox regression analysis.
Furthermore, GO and KEGG analyses were conducted using the R
package, ‘Cluster Profiler’. P<0.05 was considered to indicate a
statistically significant difference.
Results
Screening of DEGs in LUAD
The GSE31210 and GSE118370 datasets were obtained
from the GEO database, while RNA sequencing data covering the
transcriptome of 551 patients with LUAD were obtained from TCGA
database. A comprehensive analysis identified a total of 252 DEGs,
comprising 120 upregulated and 132 downregulated genes (Fig. 1A and B, respectively). Notably, the
expression patterns of these 252 DEGs in the GEO and TCGA datasets
differed from those observed in both tumor and normal tissues
(Fig. 1C and D). A detailed outline
of the research process is presented in Fig. S1.
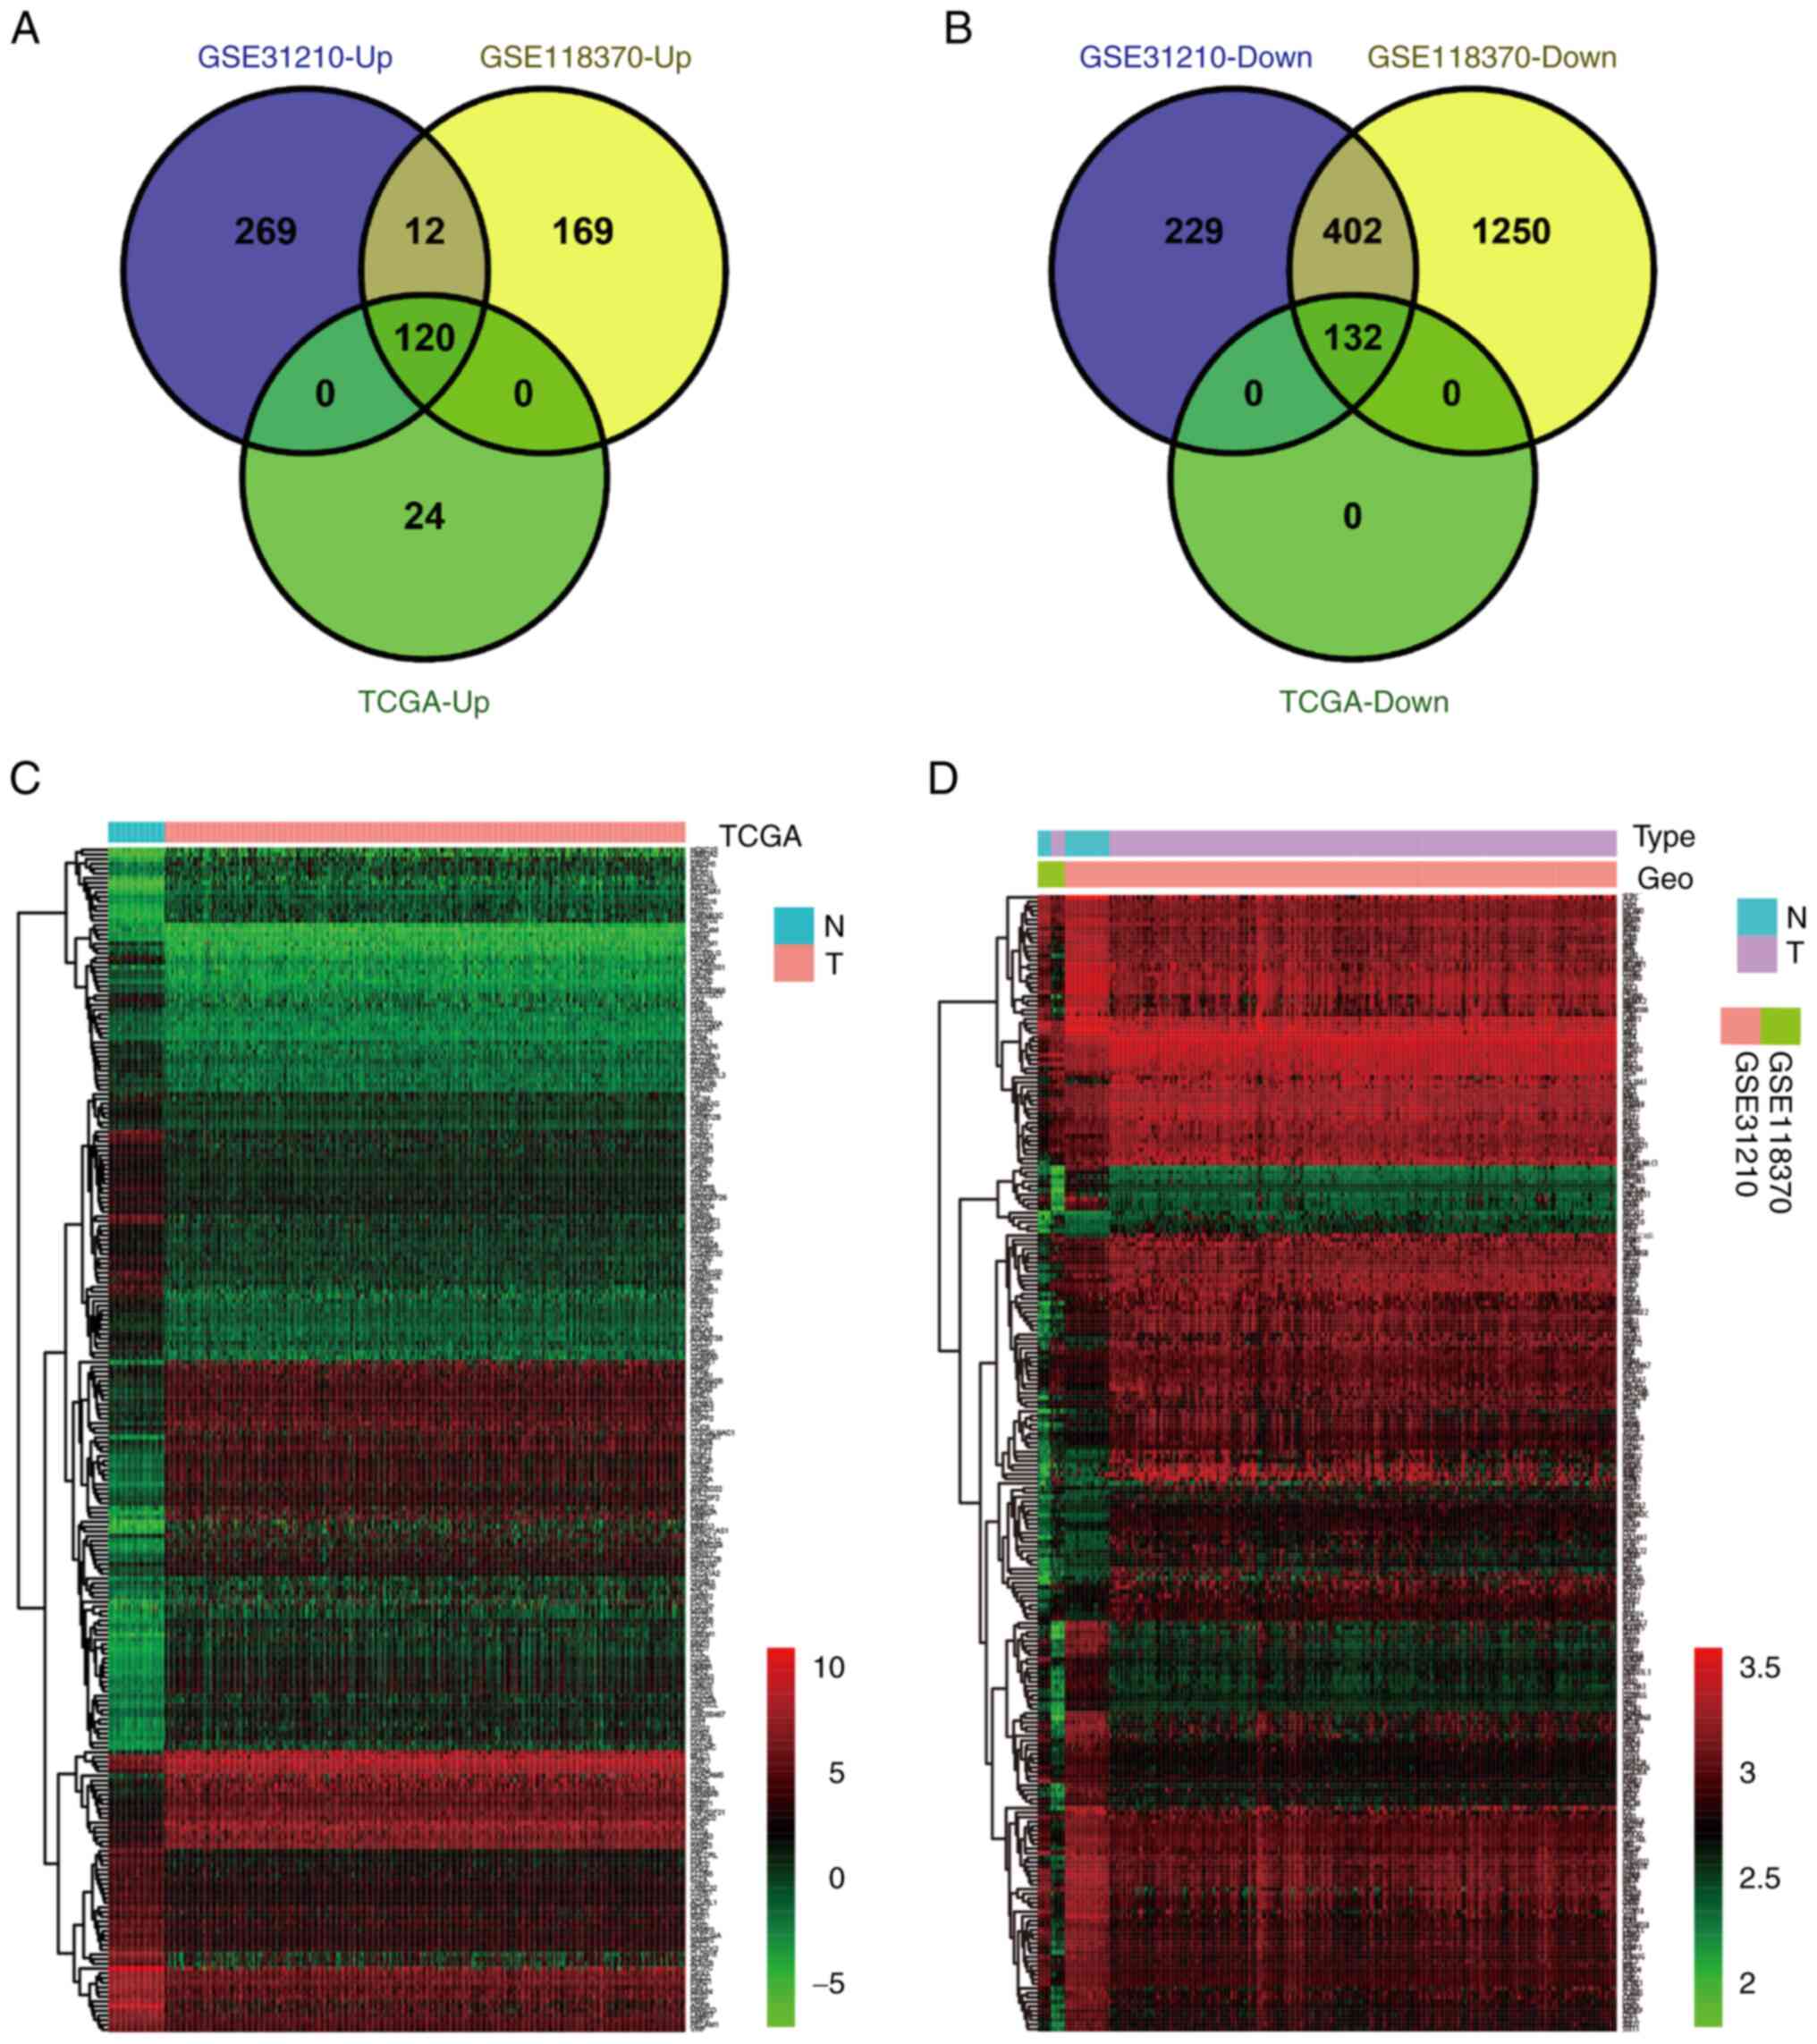 | Figure 1.Screening and identifying DEGs in
LUAD. (A) The 120 upregulated DEGs identified in the GEO datasets
were verified using the TCGA dataset. |log2 (FC)|≥1 and P<0.05.
(B) The 132 downregulated DEGs identified in the GEO datasets were
verified using the TCGA dataset. |log2 (FC)|≥1 and P<0.05. (C)
Expression heat map of 252 DEGs identified in the TCGA dataset.
Red, high expression; green, low expression. (D) Expression heat
map of 252 DEGs identified in the GEO datasets. Red, high
expression; green, low expression. DEGs, differentially expressed
genes; Down, downregulated; GEO, Gene Expression Omnibus; LUAD,
lung adenocarcinoma; N, normal tissue; T, tumor tissue; TCGA, The
Cancer Genome Atlas; Up, upregulated. |
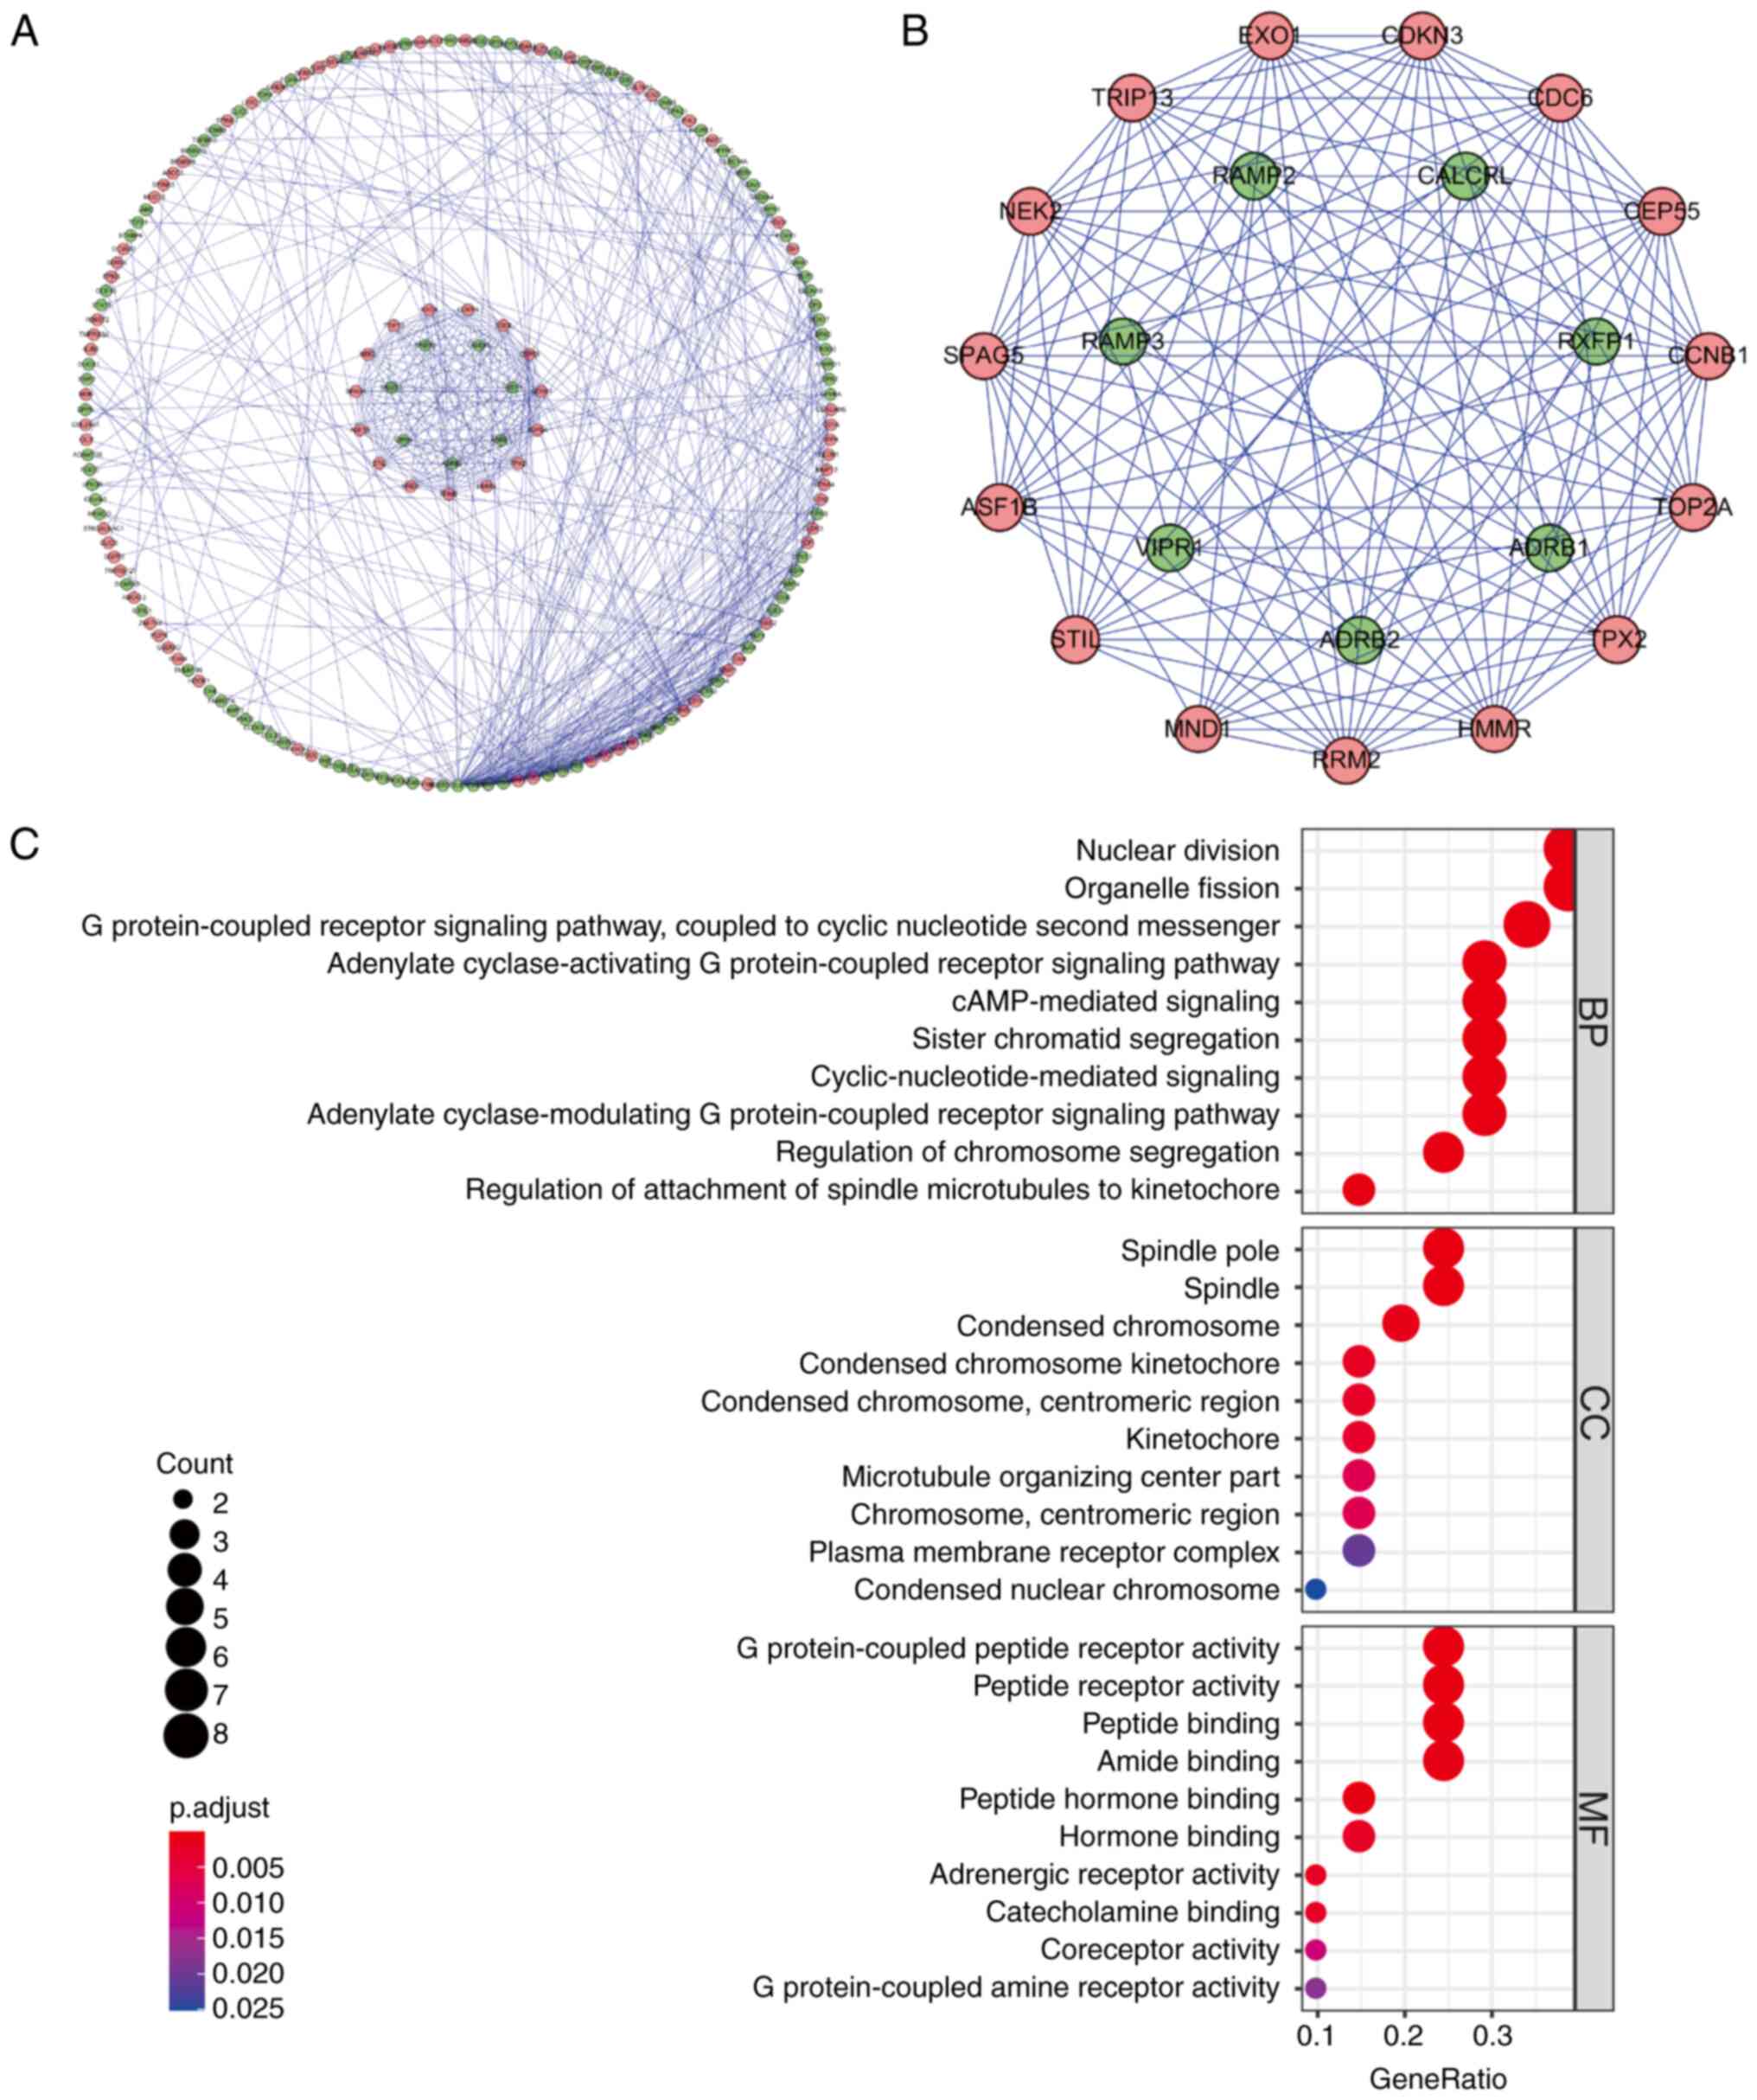
Identification of hub protein-coding
genes based on PPIs
To further investigate the role of DEGs in LUAD, the
252 DEGs were submitted to the STRING database to construct a PPI
network. The resulting network was visualized, and a subnetwork was
created using Cytoscape 3.6.1. The analysis revealed 189 nodes and
507 edges in the network (Fig. 2A),
where each node represented a key protein within the PPI network.
Nodes with a higher number of edges indicated their relevance as
network hubs. Co-expression analysis utilizing the MCODE tool was
then conducted to identify potential key modules. As a result, one
key module comprising 22 nodes and 121 edges was obtained (Fig. 2B). Following KEGG analysis, the DEGs
within this module were determined to be primarily associated with
processes such as mitosis, G protein-coupled receptor signaling
pathways, cyclic nucleotide second messenger signaling, organelle
fission, cAMP signaling, chromosome segregation, regulation of
spindle microtubule to centromere connection, peptide receptor
activity and meiotic cell cycle (Fig.
2C).
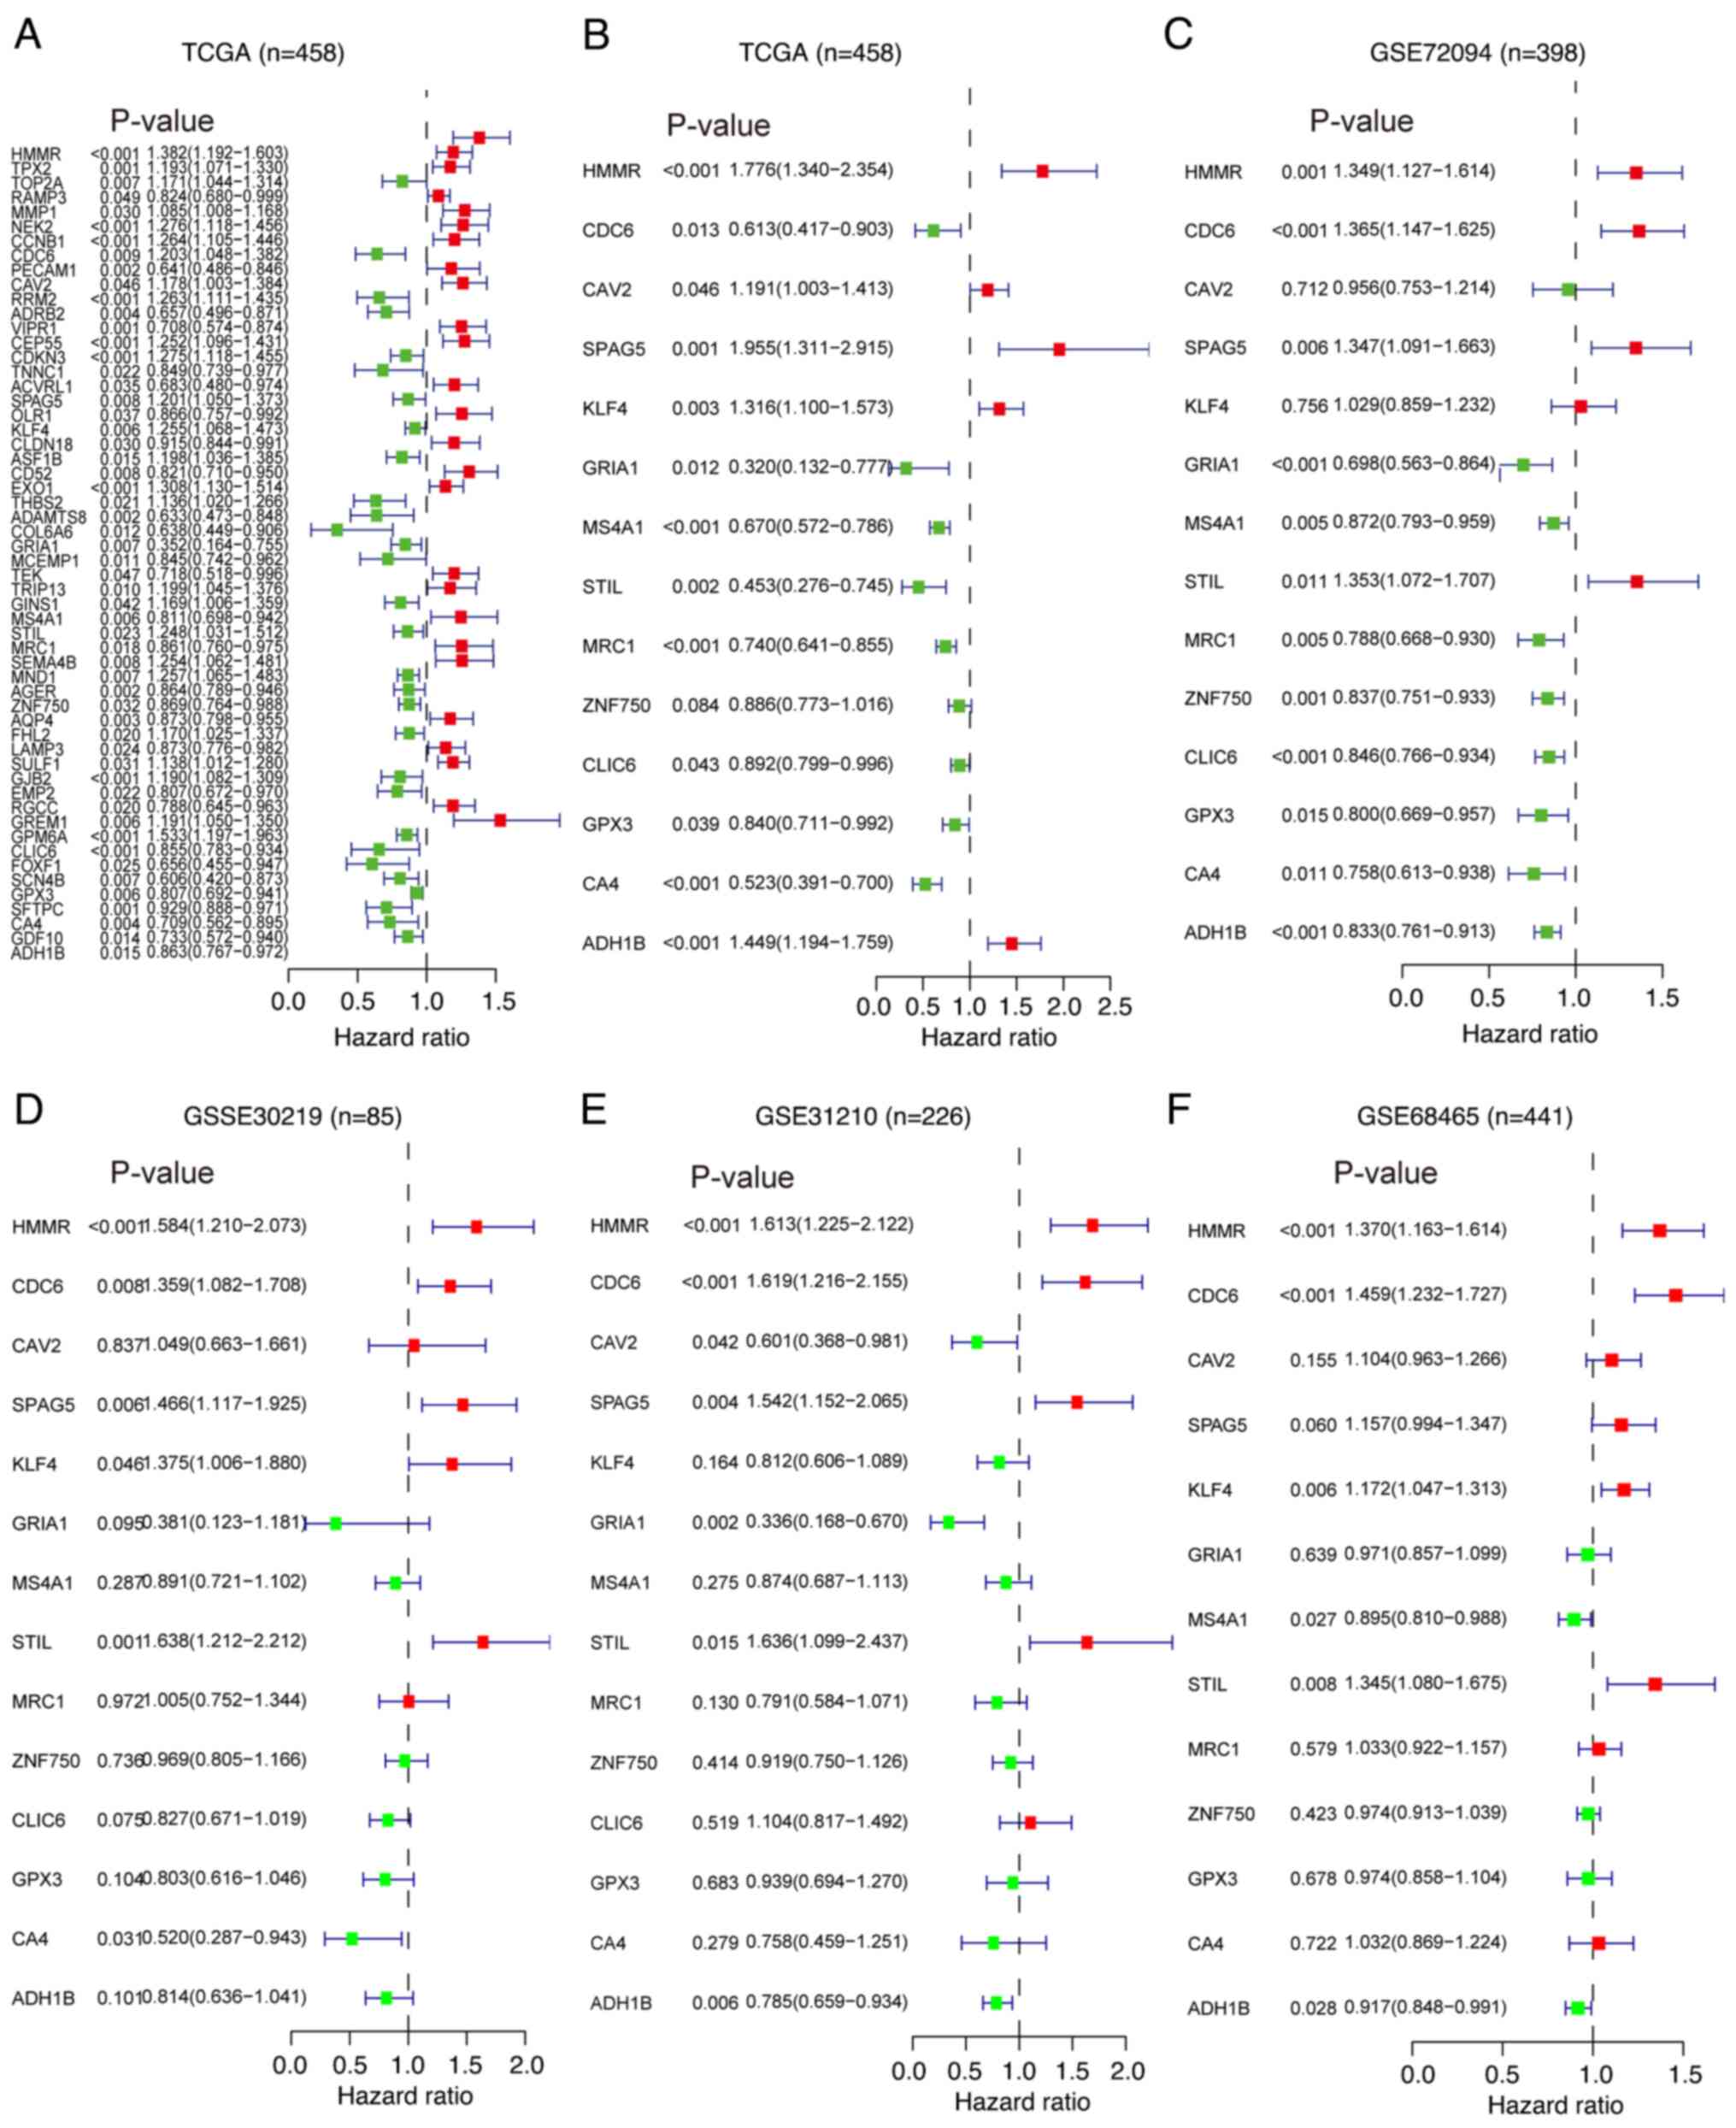
Screening of prognosis-related
differential genes
Analyses were performed using the PPI network to
investigate the interactions between proteins, and thus 189 DEGs
were identified. To investigate the prognostic significance of
these 189 DEGs, the expression data of the DEGs were integrated
with the survival data of patients with LUAD from TCGA. Through
univariate Cox regression analysis, 56 DEGs that were significantly
associated with prognosis were identified (Fig. 3A). Subsequently, multivariate Cox
regression analysis was performed on these 56 prognosis-related
DEGs to evaluate their independent effects on survival time and
clinical outcomes. It was found that 14 of these prognosis-related
DEGs were independent predictors of LUAD in TCGA dataset (Figs. 3B and S2). Furthermore, additional multivariate
Cox regression analyses were conducted on the selected 14 key
prognosis-related DEGs using four GEO datasets (GSE72049, GSE30219,
GSE31210 and GSE68456). Notably, 3 genes [hyaluronan mediated
motility receptor (HMMR), CDC6 and STIL centriolar assembly protein
(STIL)] were identified as independent prognostic factors for
patients with LUAD (Fig. 3C-F).
These findings highlighted the pivotal role of HMMR, CDC6 and STIL
in the prognosis of LUAD.
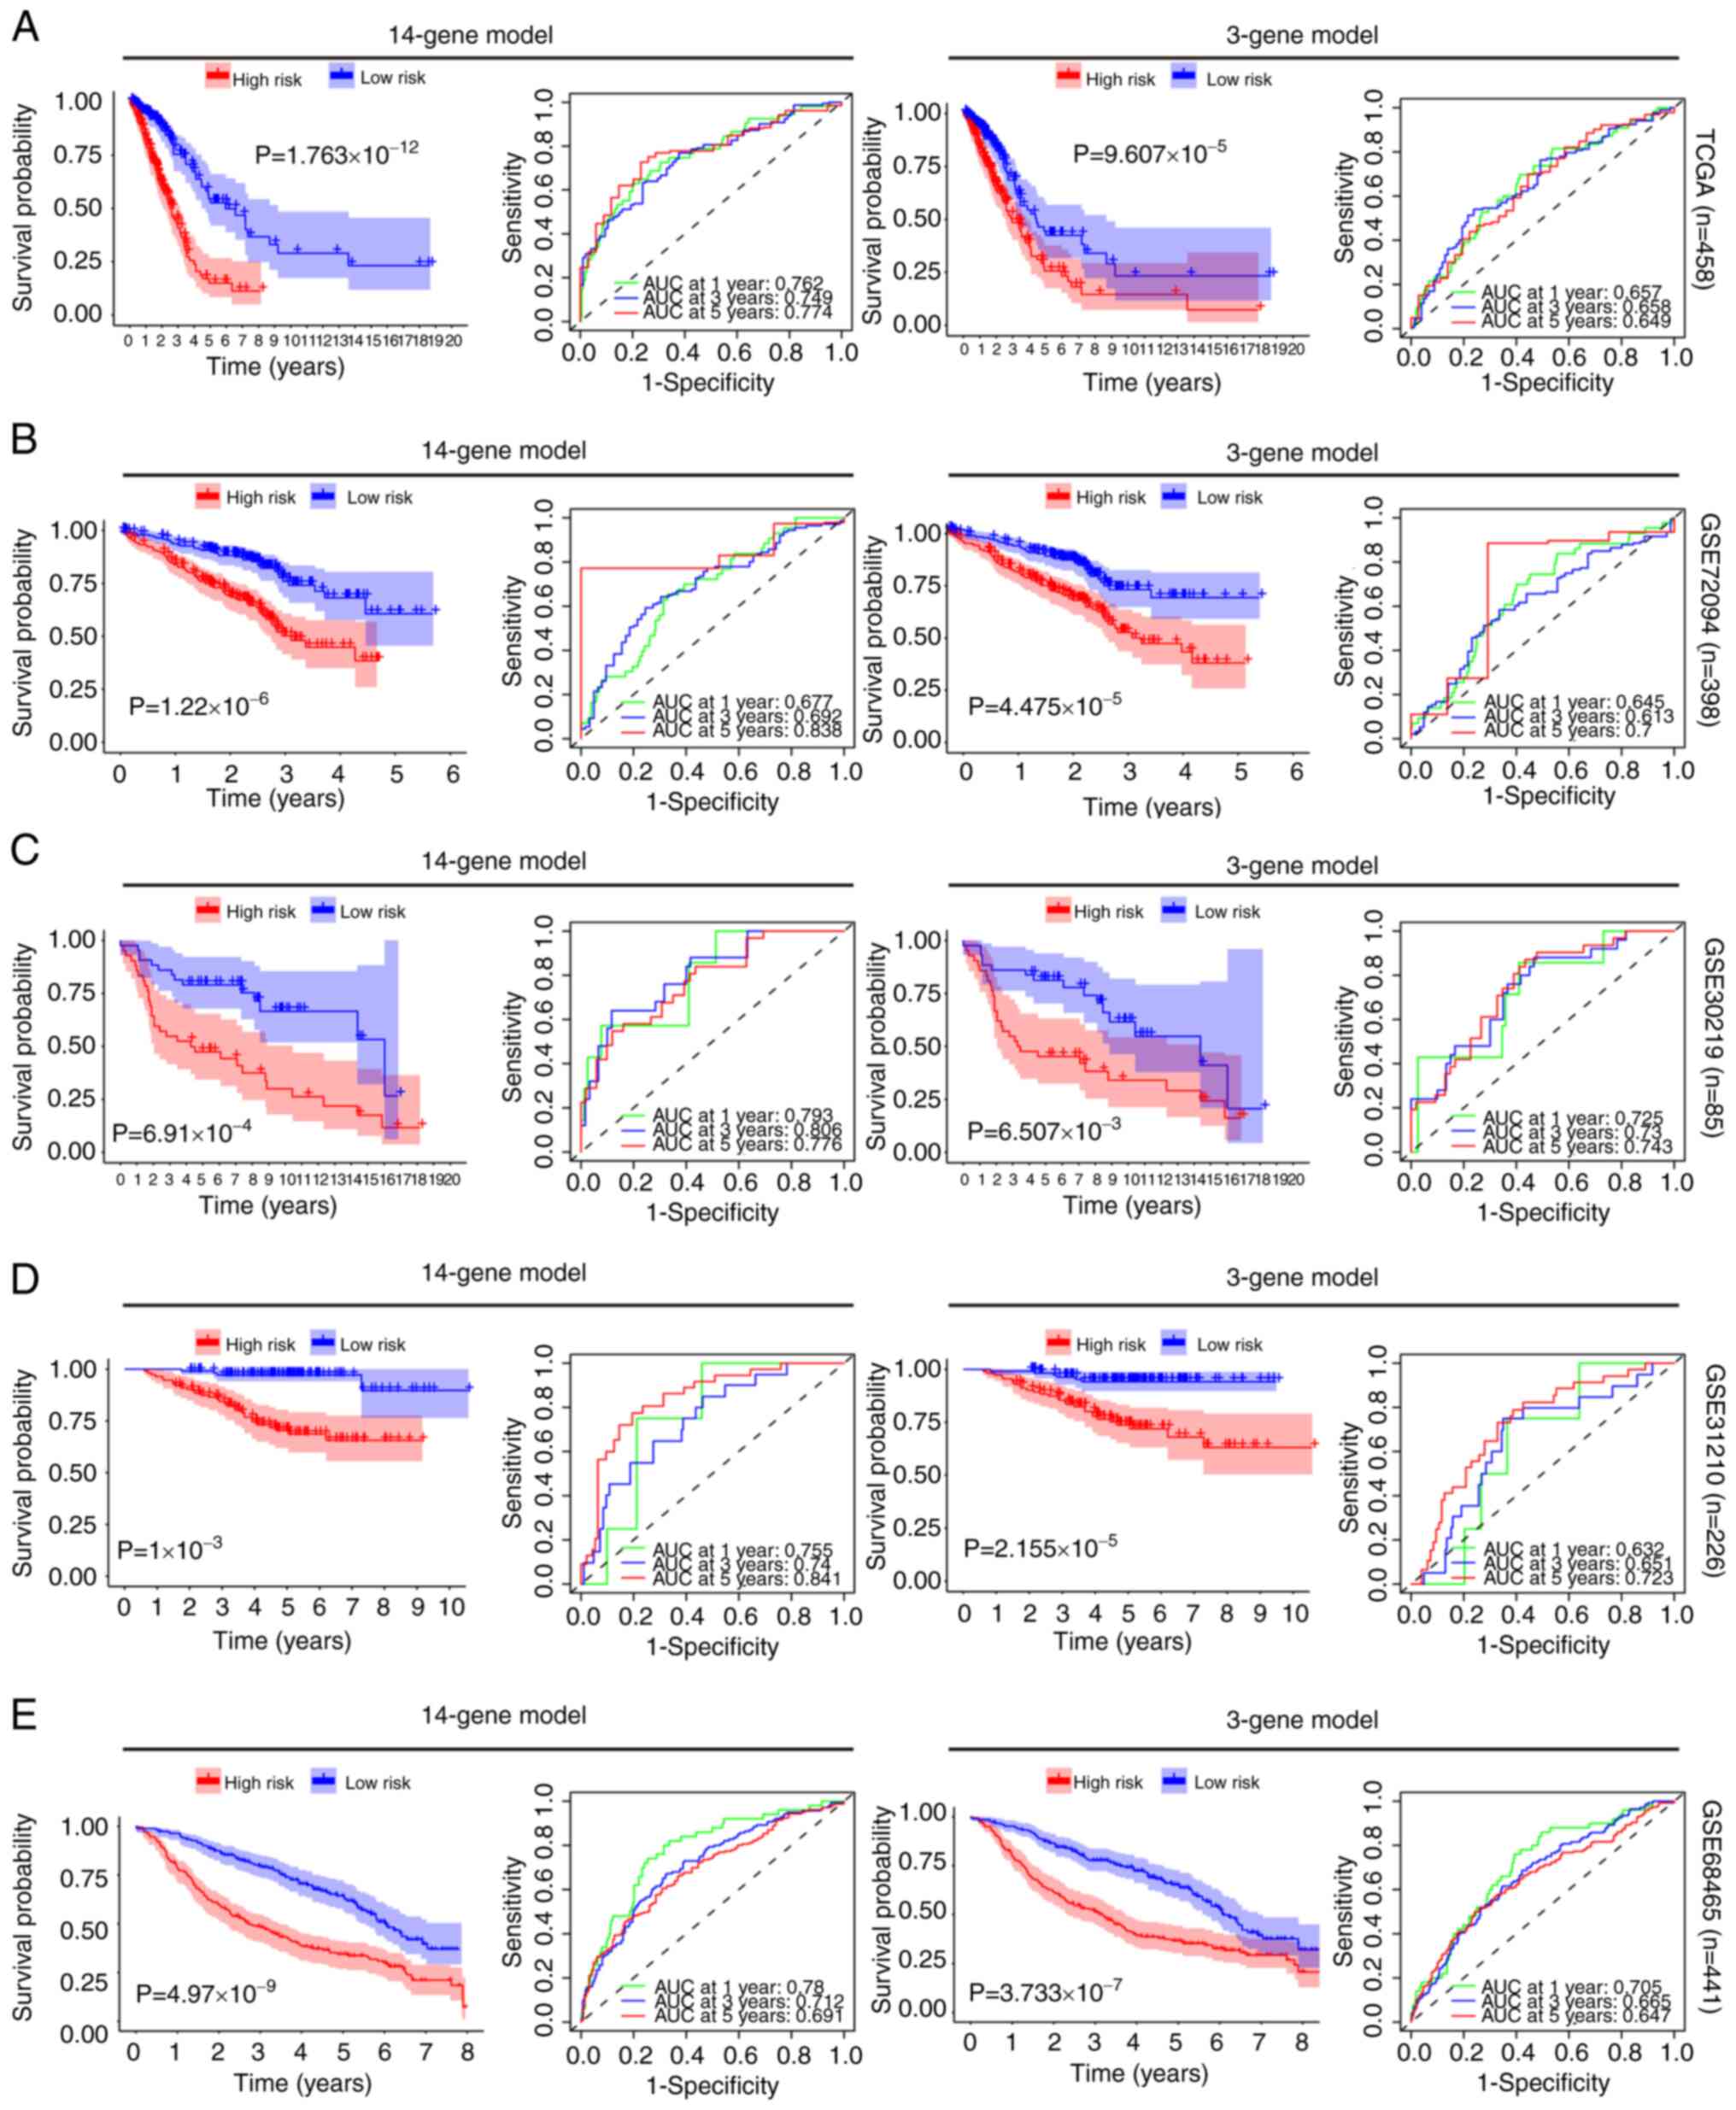
Construction and analysis of a
risk-score model for prognostic-related genes
Multivariate Cox regression analyses were conducted
using the DEGs identified from both TCGA and GEO datasets. Based on
this analysis, 14 and 3-gene prediction models were constructed for
comparison. Patients with LUAD were categorized into high and
low-risk groups based on the median risk score obtained from the
survival analysis in each dataset. By prognosis evaluation, it was
found that, in all 5 datasets, the high-risk group had a worse
prognosis than the low-risk group for both the 14-gene and 3-gene
prediction models (Fig. 4). To
assess the accuracy of the 14 and 3-gene models in predicting 1, 3
and 5-year survival rates, ROC curve [area under the curve (AUC)]
was employed. In TCGA dataset, the effectiveness of the 14 and
3-gene models in predicting the 5-year survival rate was 0.774 and
0.649, respectively. In GSE72049, their effectiveness was 0.838 and
0.700, respectively. In GSE30219, their effectiveness was 0.776 and
0.743, respectively. In GSE31210, their effectiveness was 0.841 and
0.723, respectively. Lastly, in GSE68456, their effectiveness was
0.691 and 0.647, respectively. These findings indicated that both
models demonstrated effective predictive performance (Fig. 4). Moreover, when the gene expression
heatmaps and patient survival status for the high and low-risk
groups were analyzed using both the 14 and 3-gene models, a
significantly higher mortality rate was observed in the high-risk
group (Fig. S3).
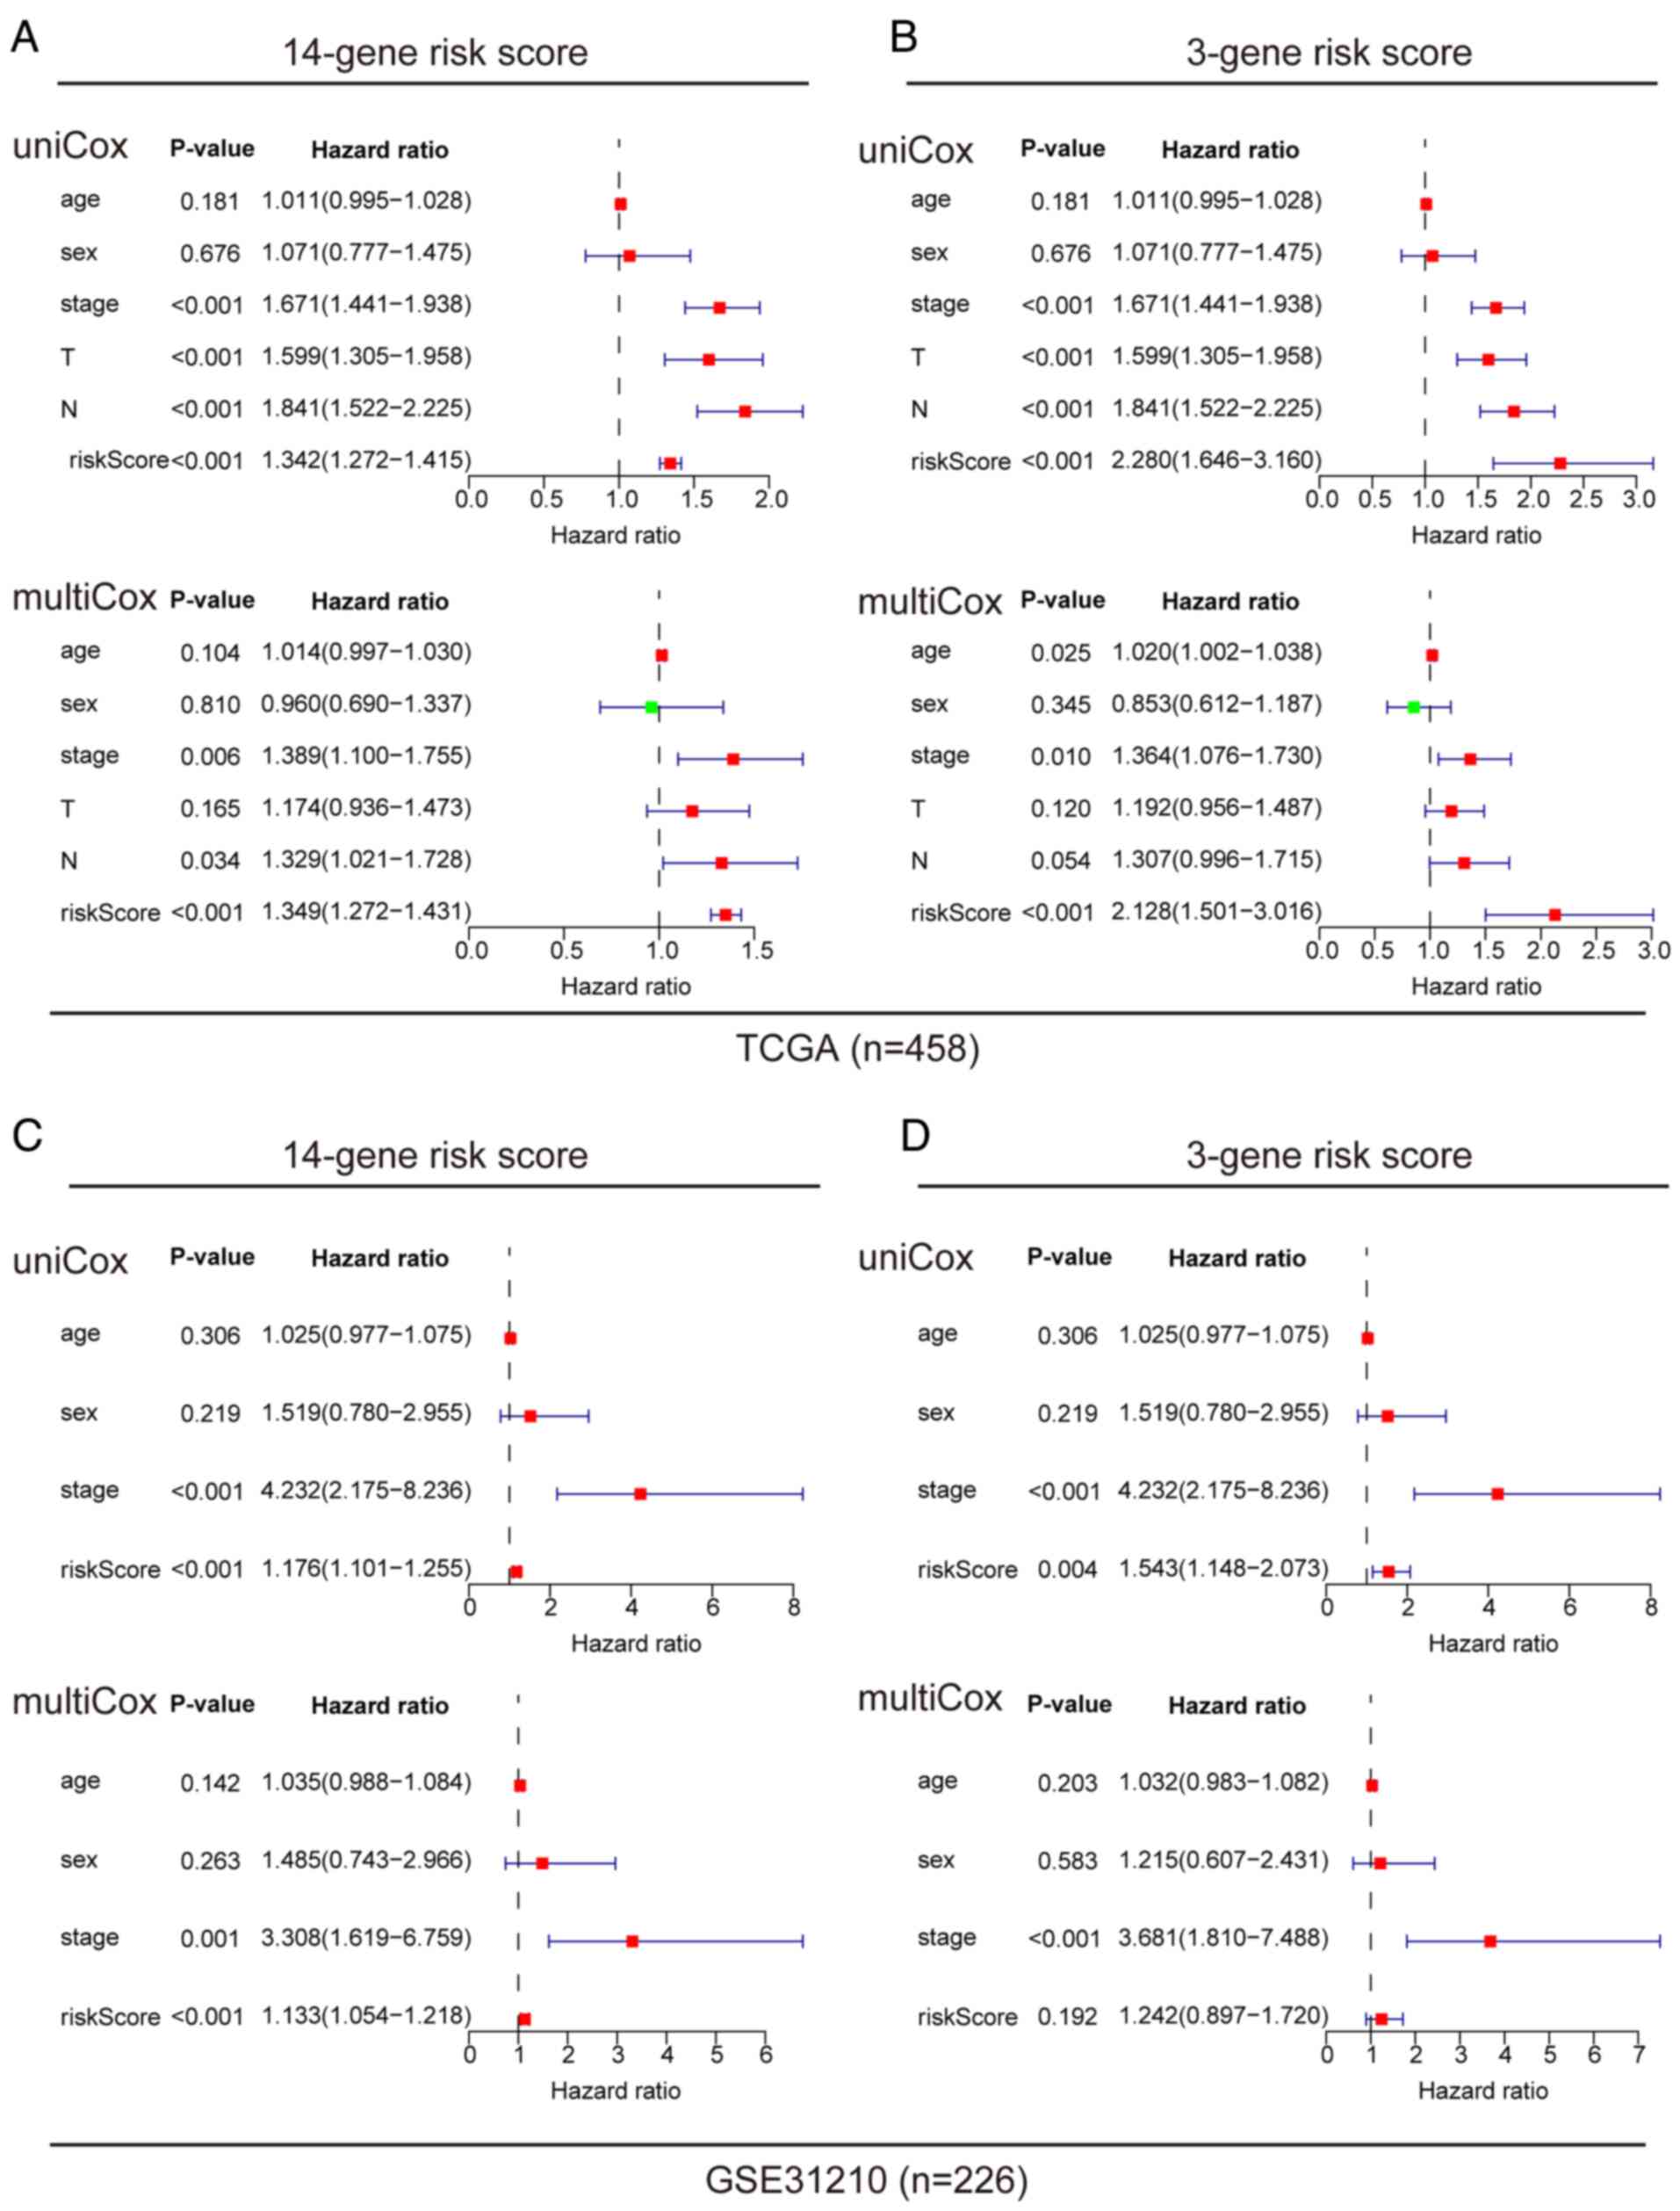
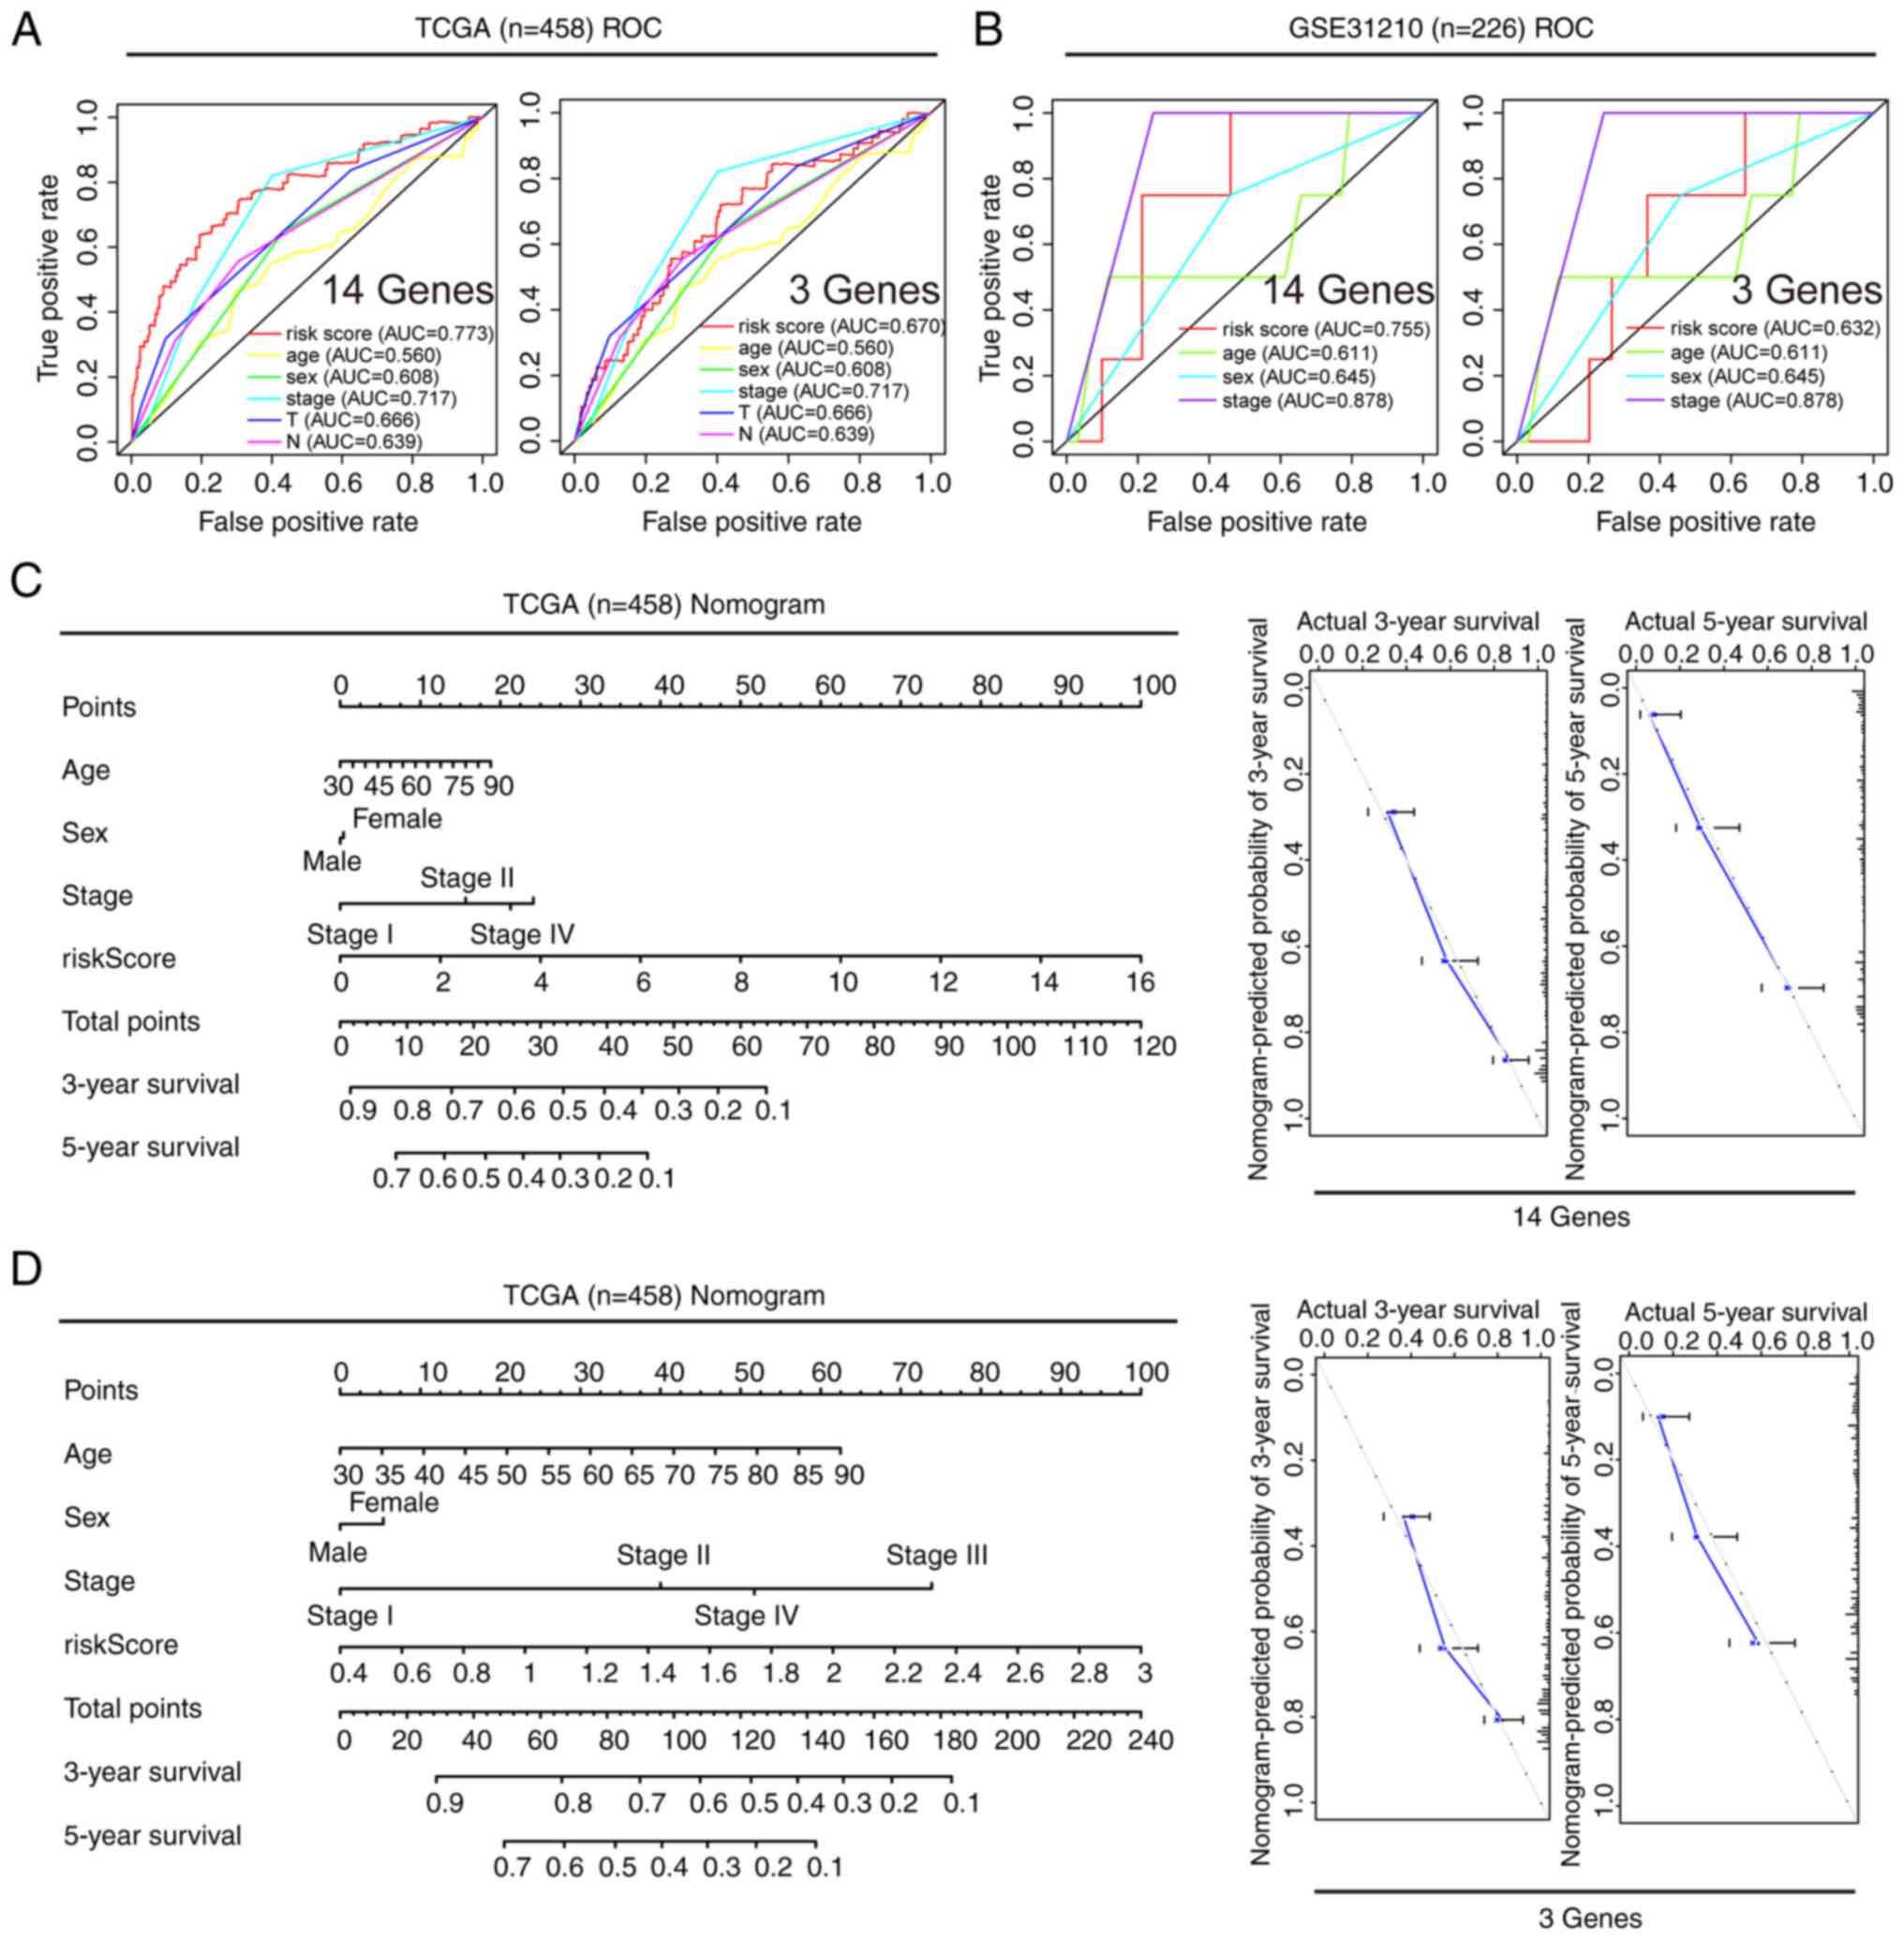
Prognostic value of different clinical
features, and construction and verification of a nomogram
A comprehensive analysis of the prognostic value of
the 14 and 3-gene risk scores was conducted using both TCGA and
GSE31210 datasets, by employing Cox regression analysis. In TCGA
dataset, univariate Cox analysis revealed associations between the
OS rates of patients with LUAD with both the 14 and 3-gene risk
scores, along with clinical factors such as clinical stage, primary
tumor and lymph node metastasis (Fig.
5A and B). Multivariate Cox regression analysis identified that
clinical stage and risk scores were independent prognostic factors
influencing survival (Fig. 5A and
B). In the GSE-31210 dataset, univariate Cox analysis similarly
displayed associations between clinical stage and risk score with
the OS rates of patients with LUAD (Fig. 5C and D). Upon further analysis using
multivariate Cox regression, clinical stage and 14-gene risk score
were identified as independent prognostic factors associated with
survival in this dataset (Fig. 5C and
D). To ensure the robustness of these findings, the predictive
reliability of both the 14 and 3-gene risk scores was evaluated, in
conjunction with clinical features, using ROC curves with both TCGA
and GSE31210 datasets. ROC analysis demonstrated that the AUCs for
both the 14 and 3-gene risk scores were >0.6, underscoring their
reasonable predictive accuracy (Fig. 6A
and B). Furthermore, nomograms were developed to predict the 3
and 5-year survival rates of patients by combining the 14 and
3-gene risk scores with other clinical features. Subsequently,
these nomograms were internally validated within TCGA cohort. Using
a vertical line to intersect the total point axis and each
prognostic axis, the 3 and 5-year survival rates of patients with
LUAD were calculated. Notably, the calibration plot provided
further evidence of the robustness of these predictions, as it
demonstrated a strong consistency between the predicted outcomes
and the observed results (Fig. 6C and
D).
Expression and prognostic value
analysis of the 14 key genes
To further investigate the biological processes
related to the 14 prognostic DEGs, KEGG enrichment analysis was
conducted. The results revealed that these DEGs were primarily
associated with pathways including cell cycle, Huntington's
disease, neuropathies and myasthenic scoliosis (Fig. 7A). Notably, the HMMR, CDC6,
Krüppel-like factor 4 (KLF4), glutathione peroxidase 3 (GPX3),
glutamate ionotropic receptor AMPS subunit 1 (GRIA1) and mannose
receptor C-type 1 (MRC1) genes were significantly enriched within
these pathways. Subsequently, the characteristics of key prognostic
genes (HMMR, CDC6, KLF4, GPX3, GRIA1 and MRC1) were further
investigated, including their protein and mRNA levels, prognostic
relevance and gene expression profiles in different LUAD stages.
This comprehensive analysis was conducted using three distinct
databases: HPA, GEPIA and Kaplan-Meier Plotter. The findings
demonstrated that HMMR and CDC6 were upregulated in LUAD tissues
compared with normal lung tissues (Fig.
7B). This pattern was consistent with the mRNA expression trend
(Fig. 7C). By contrast, the
expression of GRIA1, MRC1, KLF4 and GPX3 remained relatively low in
LUAD tissues, which was likewise consistent with the mRNA
expression trend (Fig. 7B and C).
Regarding prognostic analysis, the results revealed that HMMR,
CDC6, GRIA1, KLF4, MRC1 and GPX3 all displayed associations with
patient prognosis (Fig. 7D). This
association was verified across two separate databases, with
survival curves that did not have crossing interferences, meeting
the requirements of proportional hazard rates (25). Furthermore, during staging analysis,
it was observed that the expression levels of the HMMR and CDC6
genes showed an upregulation with increasing patient staging
(Fig. 7D). By contrast, the
expression levels of the other genes did not exhibit significant
changes. This suggested that different genes may play distinct
roles in the development of LUAD. For instance, CDC6 may exert
influence on patient disease progression by regulating the cell
cycle (26), while HMMR may impact
patient prognosis through its role in receptor binding. Among them,
HMMR has been widely investigated in the context of LUAD (27,28).
By contrast, studies on CDC6 in the context of LUAD have been
relatively scarce, thus CDC6 was chosen for further study.
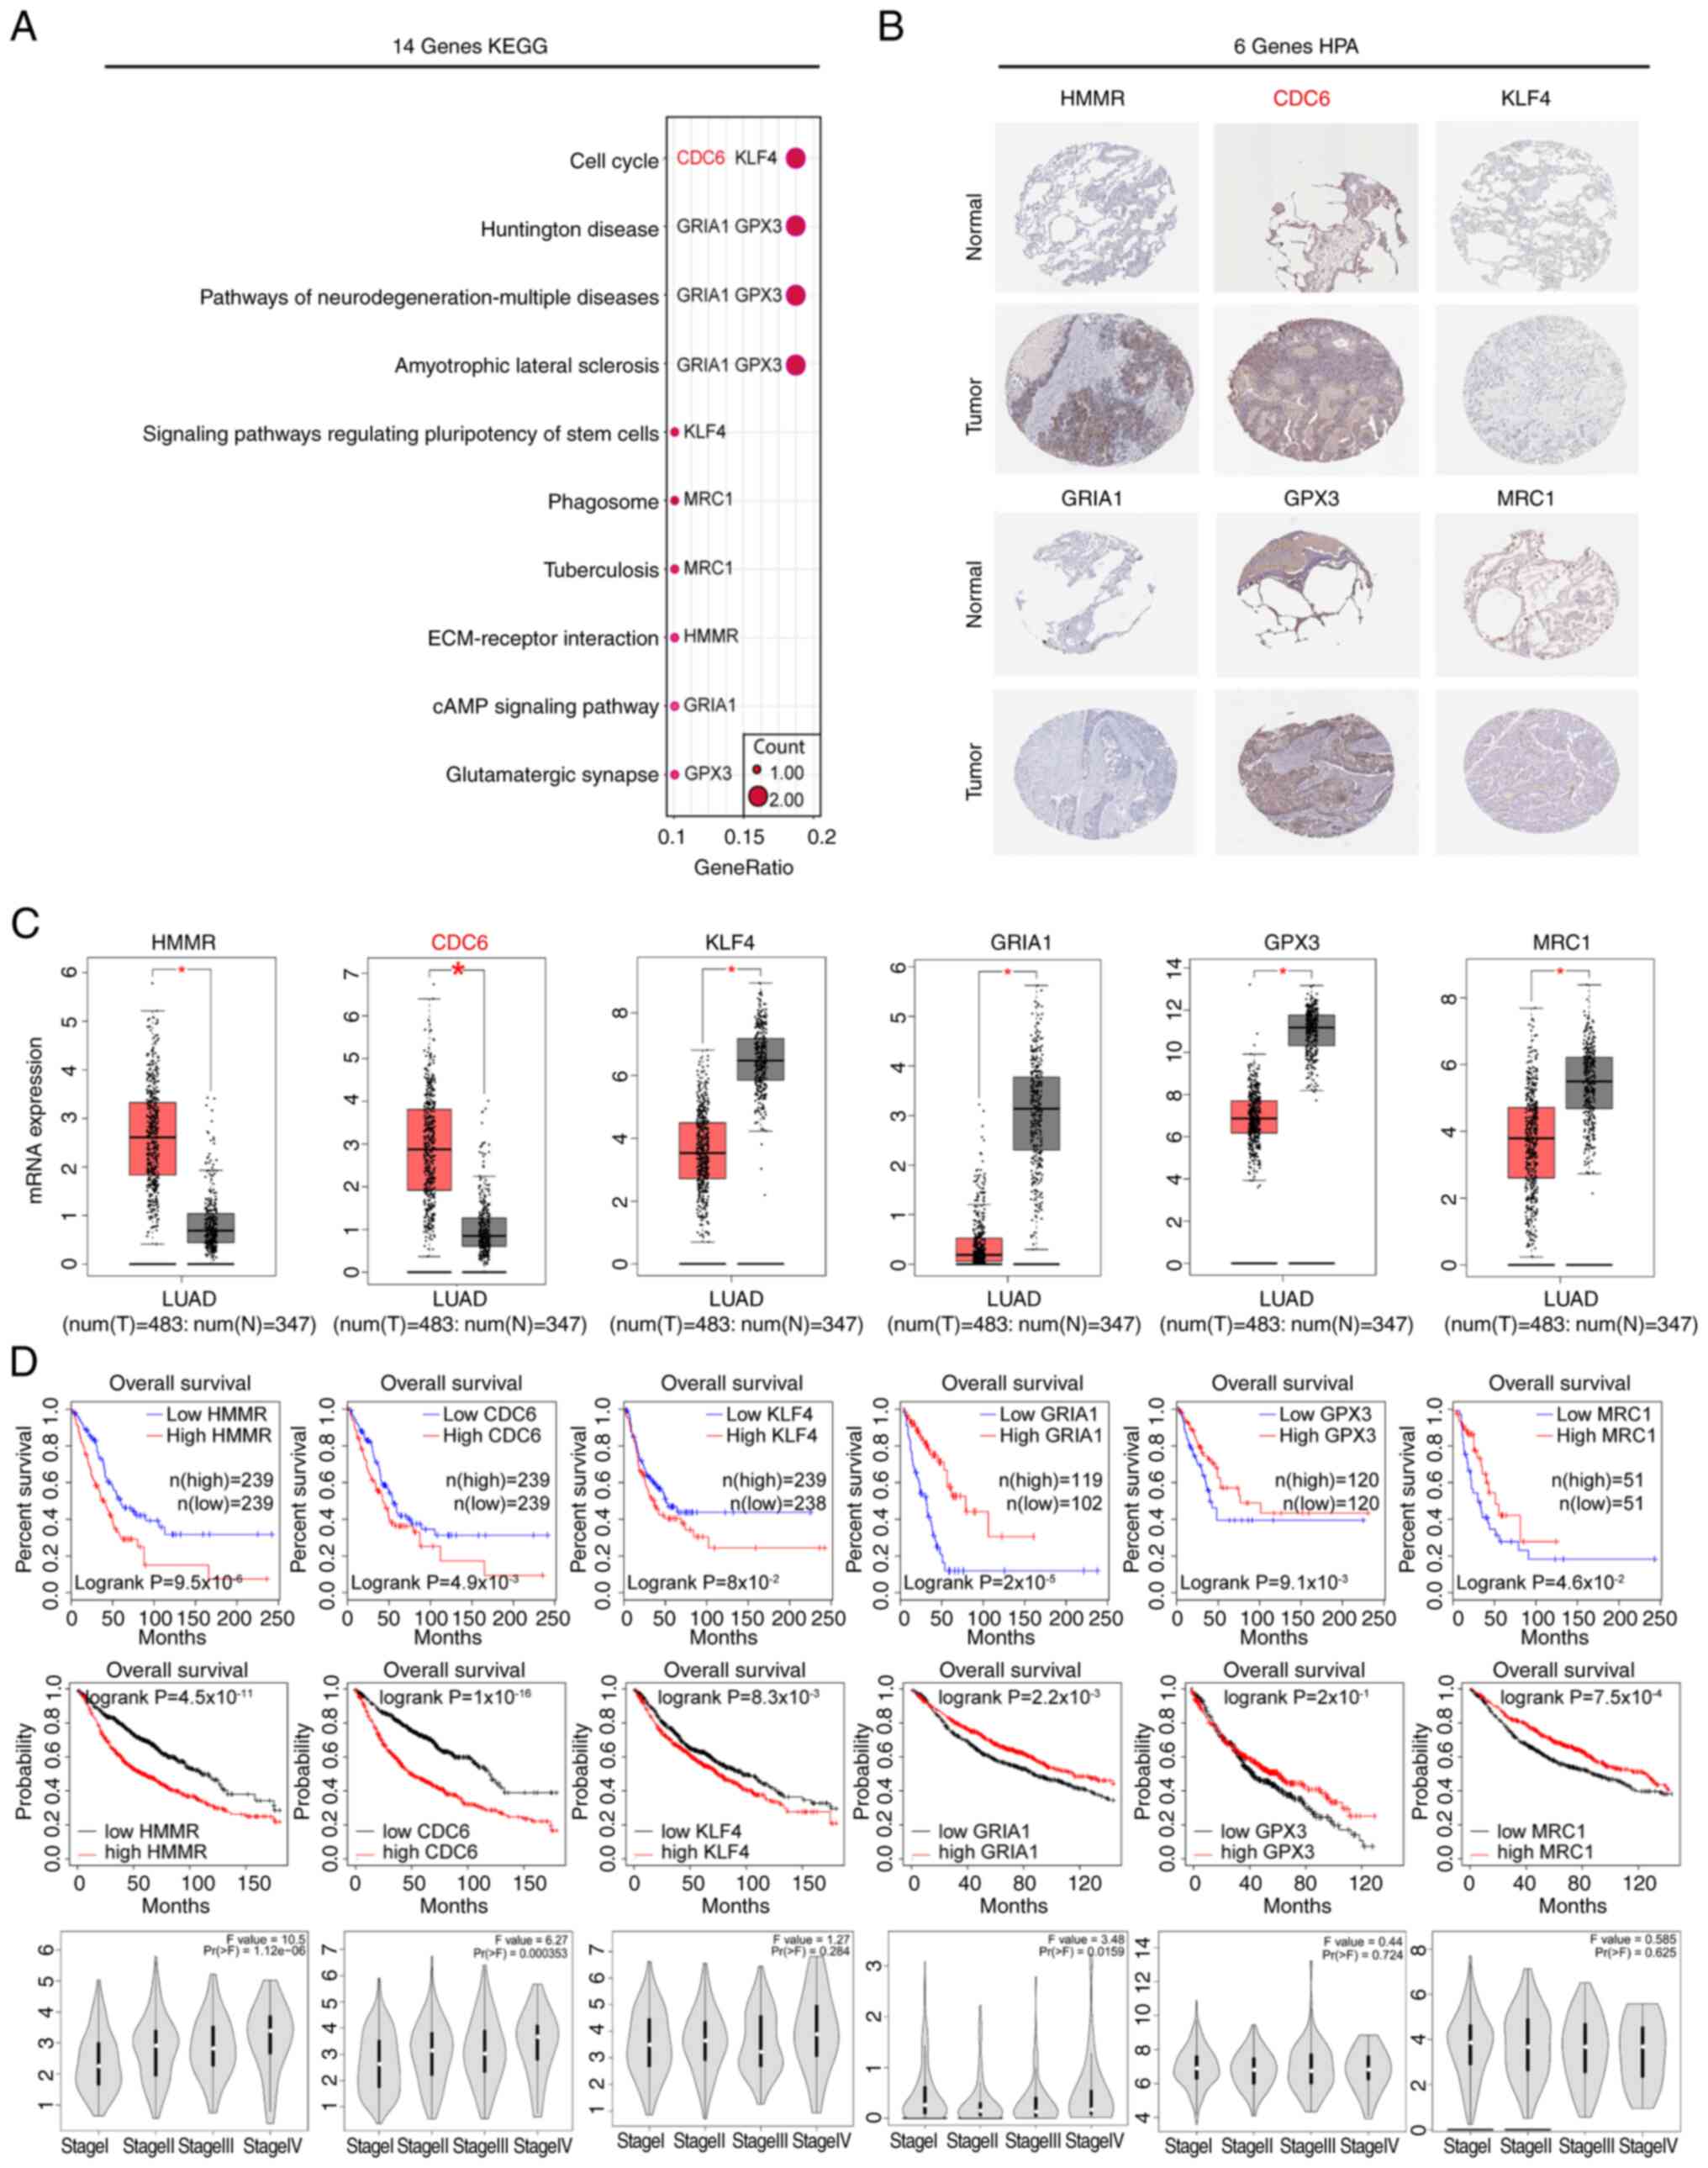 | Figure 7.KEGG enrichment analysis and protein
expression and prognosis of Hub-DEGs. (A) KEGG enrichment analysis
of the 14 prognostic DEGs. (B) Protein expression levels of 6 key
genes. (C) GEPIA database analysis of the mRNA expression levels of
the 6 key genes. *P<0.05. (D) GEPIA and Kaplan-Meier database
analysis of the relationship between patient prognosis and
expression of the 6 key genes, as well as their expression in
different stages of LUAD. CDC6, cell division cycle 6; ECM,
extracellular matrix; GEPIA, Gene Expression Profiling Interactive
Analysis; GPX3, glutathione peroxidase 3; GRIA1, glutamate
ionotropic receptor AMPS subunit 1; HMMR, hyaluronan mediated
motility receptor; HPA, Human Protein Atlas; KEGG, Kyoto
Encyclopedia of Genes and Genomes; KLF4, Krüppel-like factor 4;
LUAD, lung adenocarcinoma; MRC1, mannose receptor C-type 1; N,
normal; T, tumor. |
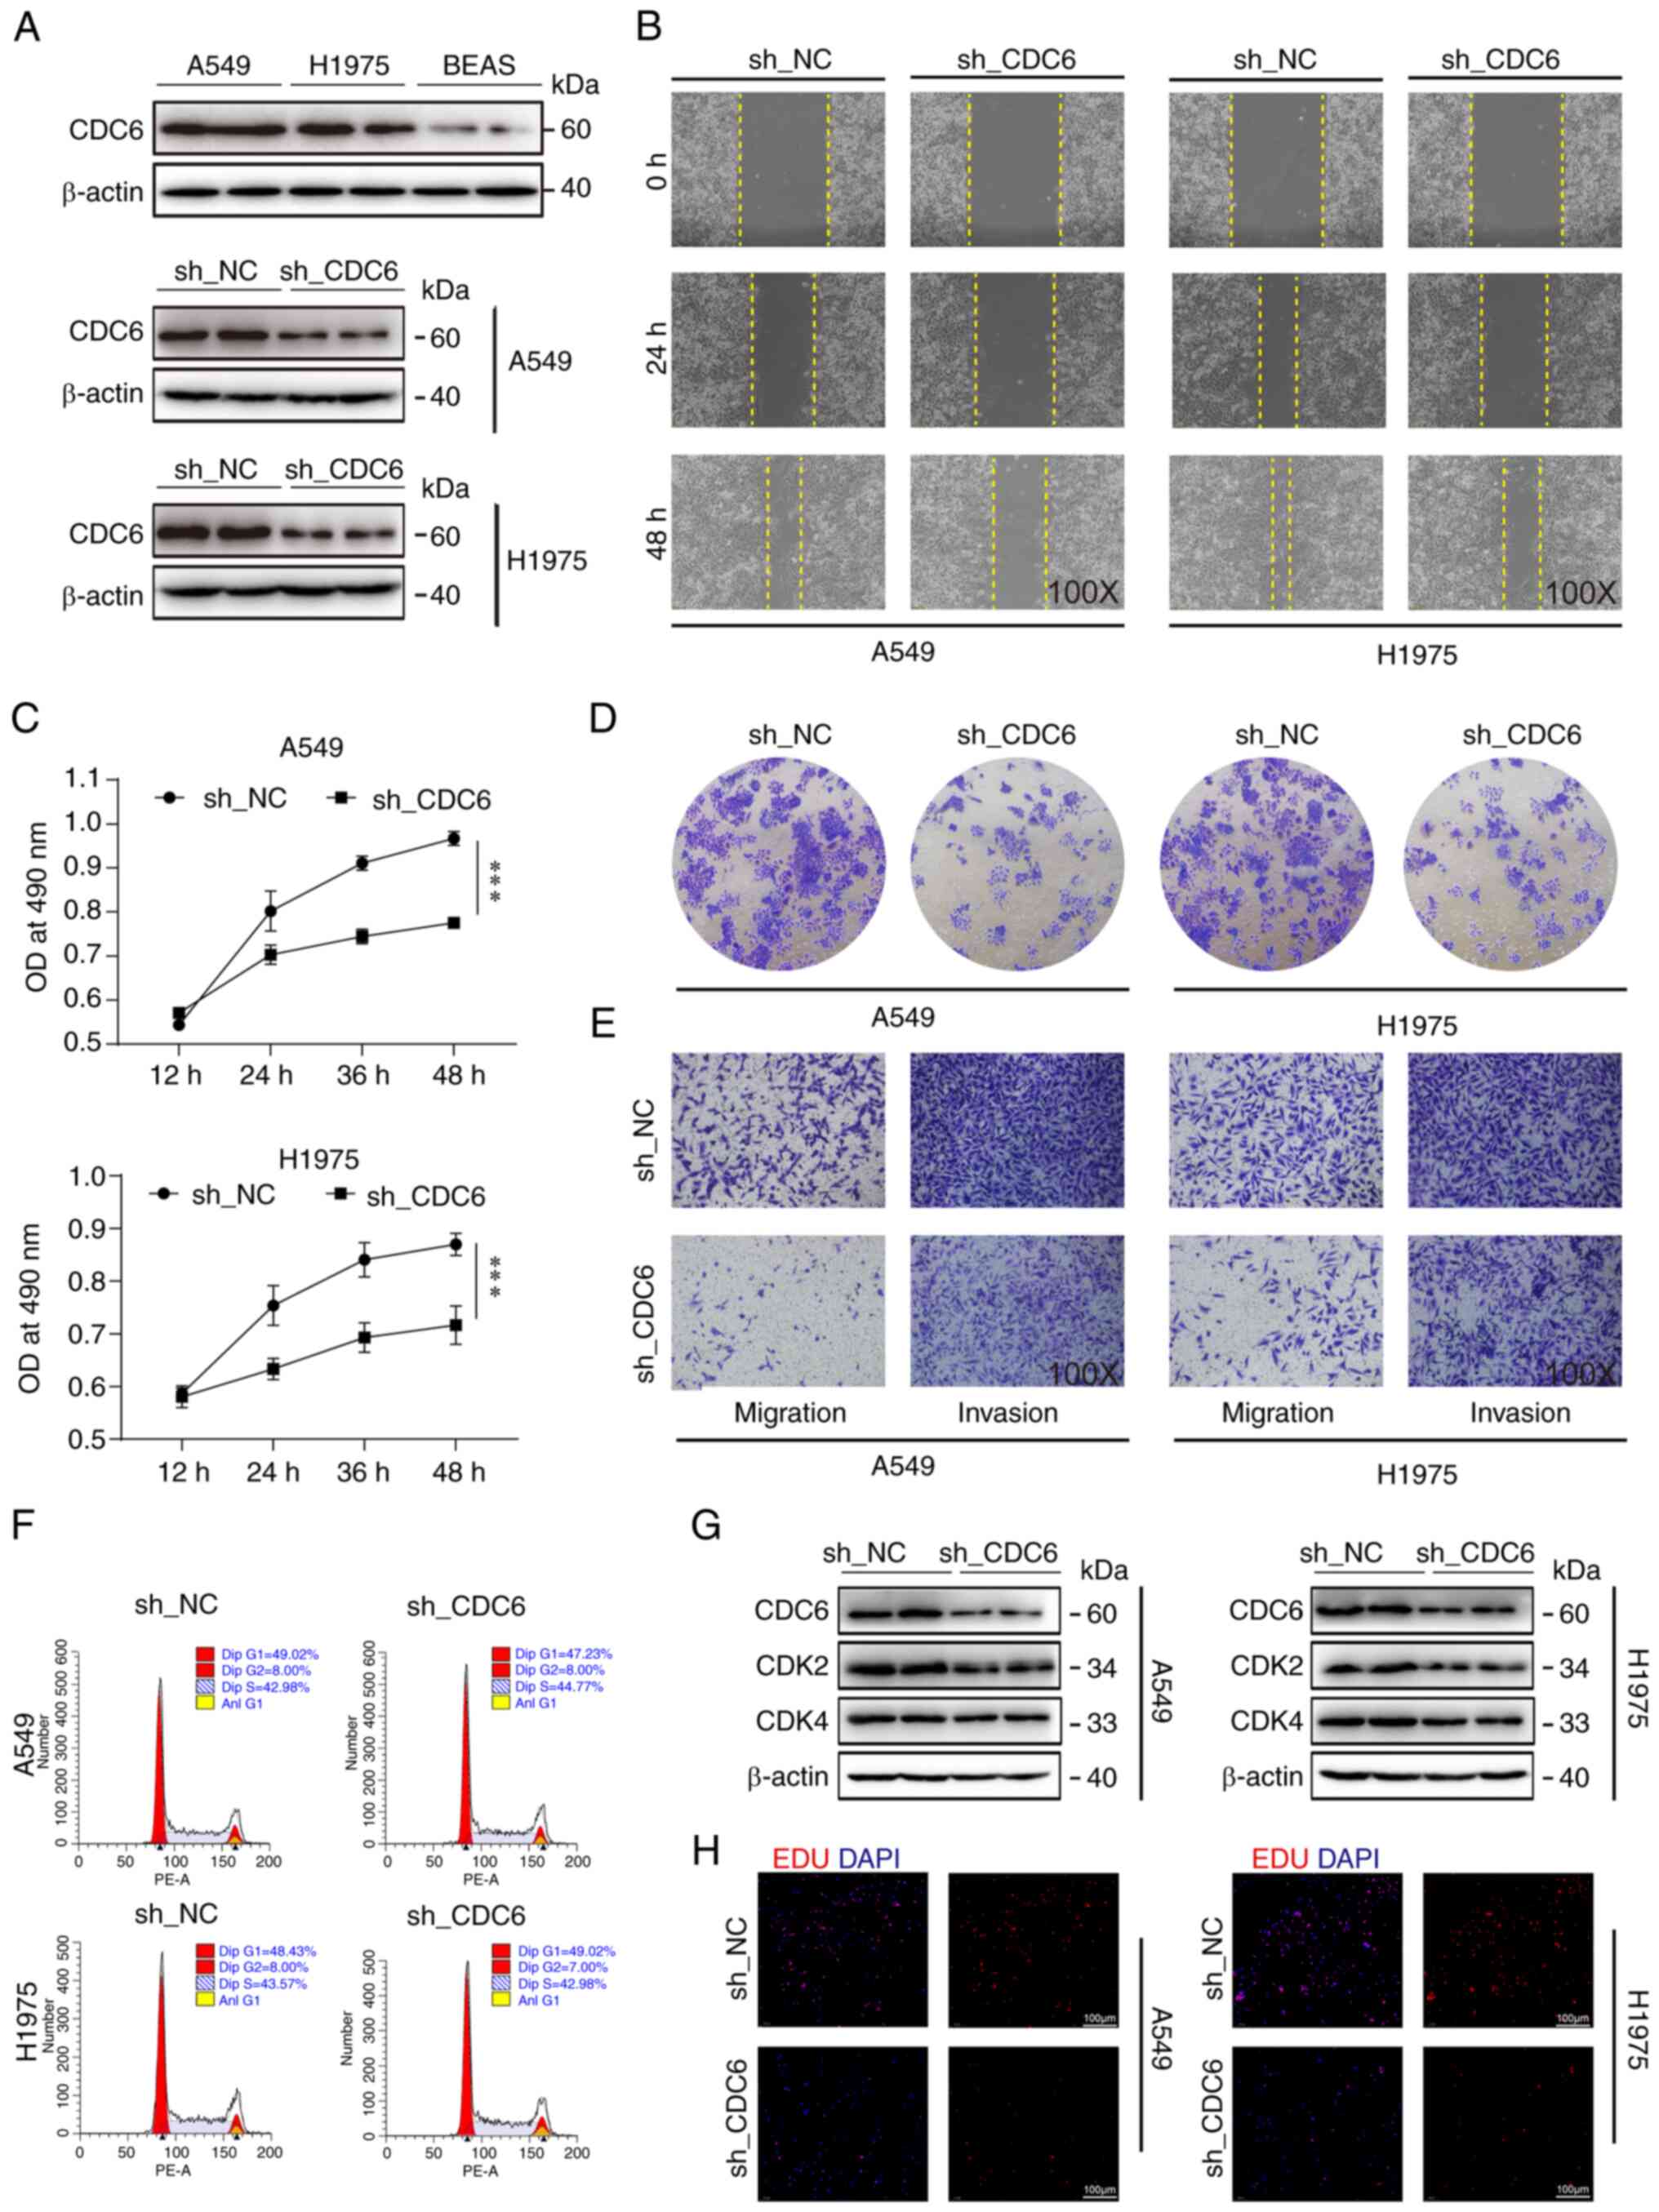
CDC6 affects tumor growth by possibly
regulating cell function
Previous analyses have shown a negative correlation
between high CDC6 expression and patient prognosis, while reporting
a positive association with clinical staging, this indicated that
high expression of CDC6 was associated with adverse clinical
outcomes and prognosis (Fig. 7D).
To further investigate CDC6, CDC6 protein levels were measured in
LUAD A549 and H1975 cells, and in the BEAS-2B normal lung cell
line. Notably, CDC6 exhibited higher expression in the tumor cell
lines compared with BEAS-2B cells (Fig.
8A). Subsequently, a series of cell-based assays were
conducted, including cell scratch, MTS viability and EdU assays,
all of which consistently demonstrated that CDC6 knockdown resulted
in reduced tumor cell migration and proliferation (Fig. 8B, C and H). Colony formation and
Transwell assays further confirmed that CDC6 knockdown decreased
tumor cell migration and invasion (Figs. 8D and E, and S4A-C).
The flow cytometry results showed that knockdown of
CDC6 had no effect on the cell cycle of H1975 and A549 cells
(Fig. 8F). However, due to the
close association of CDC6 with the cell cycle, two cell cycle
indicator proteins, CDK2 and CDK4, were investigated, and it was
observed that their expression levels decreased following CDC6
knockdown in both cell types, indicating that CDC6 inhibition may
influence cell cycle-related protein expression (Fig. 8G).
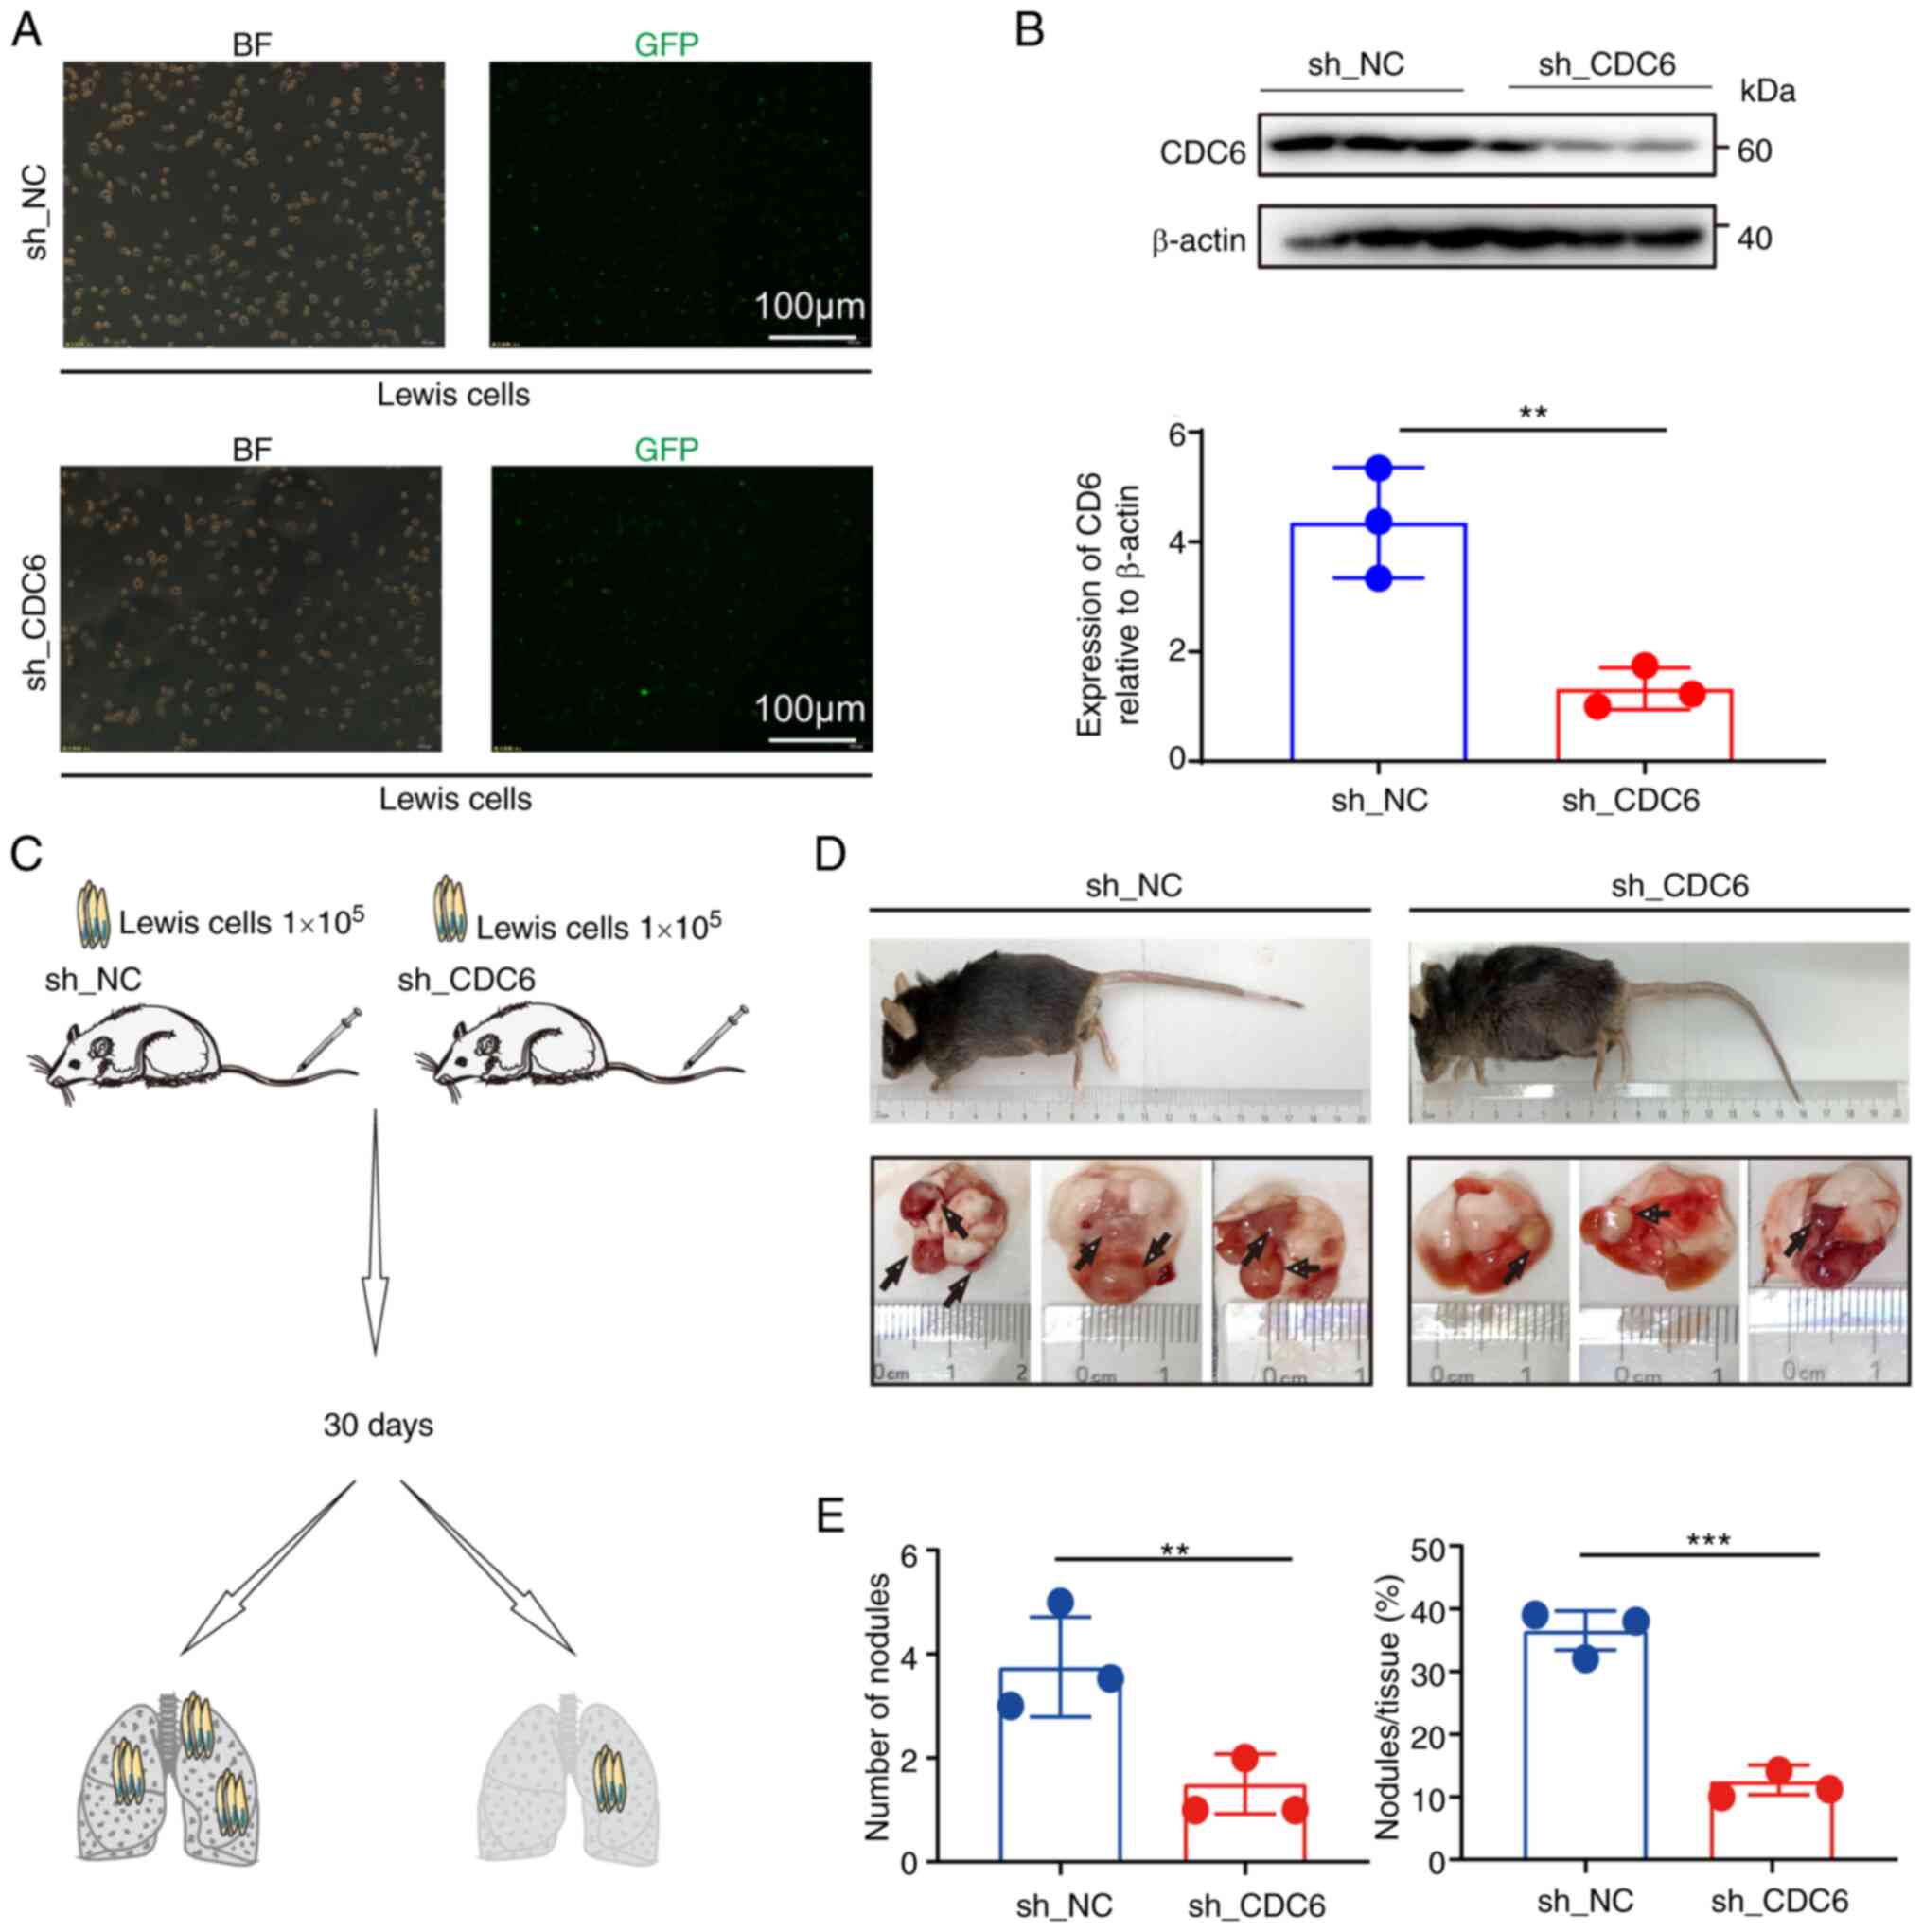
In vivo experiments demonstrated that
knockdown of CDC6 expression in a lung cancer mouse model led to a
reduction in tumor size, tumor number and overall tumor burden in
the lungs of mice (Fig. 9). The
animal weight data indicated a decline in the weight of mice in
both groups after day 17, indicating that the lung tumors may have
had an impact on mouse metabolism, leading to decreased body weight
(Fig. S4). To summarize, the
present findings suggested that CDC6 expression had an impact on
tumor cell proliferation through its regulatory role in cell
function, potentially influencing patient prognosis.
Discussion
Previous studies have demonstrated that DEGs between
tumor and normal tissues in patients with LUAD can be used to
assess patient prognosis (29,30).
To better predict the risk of mortality and prognosis of patients
with LUAD, the present study selected 252 DEGs from TCGA and GEO
datasets of patients with LUAD, and identified 14 prognostic genes
(namely HMMR, CDC6, caveolin-2, sperm-associated antigen 5, KLF4,
GRIA1, membrane spanning 4-domains A1 (MS4A1), STIL, MRC1, zinc
finger protein 750, chloride intracellular channel 6, GPX3,
carbonic anhydrase 4 and alcohol dehydrogenase 1B) based on
single-factor and multi-factor Cox analyses. However, the inclusion
of an excessive number of genes in models can affect its practical
application potential. Therefore, these 14 genes were further
screened using 4 external GEO datasets, and 3 genes (HMMR, CDC6 and
STIL) were selected for model construction.
In the present study, a prognostic model was built
using the comprehensive risk scores of the aforementioned 3 genes,
and the results showed that the predictive effectiveness of the
model was good when using multiple datasets. As the risk score
increased, the number of mortalities in the high-risk group
significantly increased compared with those in the low-risk group.
Consistent with this, the clinical data showed that the risk scores
of these 3 genes were independent predictive factors when using
both TCGA and GEO datasets. In addition, a prognostic model was
constructed using the aforementioned 14 genes identified by
single-factor and multi-factor Cox analyses. When comparing the
predictive efficacy of the 3 and 14-gene risk scores in multiple
datasets, it was found that both models had good predictive
ability. Furthermore, the 3-gene model still had a good predictive
performance despite using fewer genes to construct the model. This
indicated that HMMR, CDC6 and STIL were core genes that affected
the prognosis of patients with LUAD.
To study the functions of these core genes, KEGG
pathway analysis was performed using the identified 14 genes. The
results demonstrated that HMMR, CDC6, KLF4, GRIA1, GPX3 and MRC1
were core pathway genes. Previous studies have found that HMMR is
significantly upregulated in LUAD tissues and negatively correlates
with patient prognosis, and inhibiting HMMR can promote apoptosis
in LUAD cells (31–34). Consistent with this, the present
study found that patients with LUAD who exhibited high HMMR
expression had significantly worse prognosis. By contrast, KLF4 is
downregulated in various human cancer types such as gastric,
bladder and lung cancer, and its degradation and downregulation can
promote tumorigenesis, playing an important role in the development
of various invasive cancer types (35,36).
MS4A1 is a member of the CD20 family and is associated with immune
deficiency diseases. This gene encodes a B-cell surface molecule
involved in the development and differentiation of B-cells into
plasma cells (37,38). STIL participates in the positive
feedback activation of cytoskeleton remodeling mediated by Rho
guanine nucleotide factor 7 and plays a vital role in the migration
and invasion of cancer cells (39–41).
MRC1 mainly exists on the surface of macrophages, immature
dendritic cells and hepatic sinusoidal endothelial cells, and
participates in major histocompatibility complex-I type-mediated
antigen processing and presentation, as well as in the innate
immune system (42). In NSCLC, the
upregulation of GPX3 reduces the phosphorylation of JNK and c-JUN,
while its downregulation activates the JNK signaling pathway and
promotes the development of NSCLC (43,44).
CDC6 is closely related to the cell cycle and is positively
correlated with patient clinical stage (45). A previous study has reported that
CDC6 can regulate the cell cycle and promote tumor progression
(46).
By reducing the expression of CDC6 in tumor cells
and conducting in vitro experiments, the present study
confirmed its ability to regulate the expression of the CDK2 and
CDK4 kinases. Furthermore, downregulation of CDC6 also suppressed
the migration and invasion of tumor cells. In vivo
experiments were conducted to establish an orthotopic lung cancer
mouse model, which revealed that downregulation of CDC6 also
suppressed the proliferation and migration of mouse lung tumor
cells. These results suggested that CDC6 was a critical gene
affecting the proliferation and migration of tumor cells in
LUAD.
In conclusion, the present study developed and
constructed a prognostic model with potential clinical application.
The functional role of the key gene, CDC6, in LUAD was identified,
providing evidence for its potential application as a prognostic
biomarker and therapeutic target in LUAD. However, the present
study had some limitations. First, the analysis was based on data
from several publicly available databases, which may have inherent
biases and inaccuracies, and issues such as limitations in database
samples, constraints on research objects and the continuous
updating of databases may lead to insufficient comprehensive data.
To further validate this prognostic model, it is necessary to
collect clinical sample data and conduct multicenter testing to
assess the accuracy of the model. Second, due to limitations in
external experimental conditions, more complex and advanced
research could not be conducted and thus, further in-depth research
should include more empirical studies and in vitro
experiments to investigate the functional role of the CDC6 gene in
lung adenocarcinoma. Finally, further research is needed to
investigate the in vivo molecular mechanisms of CDC6
regulation in tumor cells.
Supplementary Material
Supporting Data
Supporting Data
Acknowledgements
Not applicable.
Funding
This study was supported by the Research Center for Medical and
Health Science and Technology Development of the National Health
Commission (grant nos. WA2020HK60 and W2016FWAH07) and Bozhou
Science and Technology Bureau (grant no. bzzc2020001). The funders
had no role in the study design, data collection, analysis and
decision to publish or preparation of the manuscript.
Availability of data and materials
The datasets used and/or analyzed during the current
study are available from the corresponding author on reasonable
request.
Authors' contributions
GW was responsible for the conception and design of
the study. HL and ZW conducted the experiments. GW, HL and ZW
confirm the authenticity of all the raw data. GW, HL and ZW wrote
the manuscript. GW, HL and ZW edited the manuscript. All authors
read and approved the final version of the manuscript.
Ethics approval and consent to
participate
The animal experiments were approved by The
Biomedical Ethics Committee of Anhui University of Science and
Technology (Huainan, China; approval no. 2022-019).
Patient consent for publication
Not applicable.
Competing interests
The authors declare that they have no competing
interests.
References
|
1
|
Sung H, Ferlay J, Siegel RL, Laversanne M,
Soerjomataram I, Jemal A and Bray F: Global cancer statistics 2020:
GLOBOCAN estimates of incidence and mortality worldwide for 36
cancers in 185 countries. CA Cancer J Clin. 71:209–249. 2021.
View Article : Google Scholar : PubMed/NCBI
|
|
2
|
Lawrence MS, Stojanov P, Polak P, Kryukov
GV, Cibulskis K, Sivachenko A, Carter SL, Stewart C, Mermel CH,
Roberts SA, et al: Mutational heterogeneity in cancer and the
search for new cancer-associated genes. Nature. 499:214–218. 2013.
View Article : Google Scholar : PubMed/NCBI
|
|
3
|
Bray F, Ferlay J, Soerjomataram I, Siegel
RL, Torre LA and Jemal A: Global cancer statistics 2018: GLOBOCAN
estimates of incidence and mortality worldwide for 36 cancers in
185 countries. CA Cancer J Clin. 68:394–424. 2018. View Article : Google Scholar : PubMed/NCBI
|
|
4
|
Park CK, Cho HJ, Choi YD, Oh IJ and Kim
YC: A phase II trial of osimertinib in the second-line treatment of
non-small cell lung cancer with the EGFR T790M mutation, detected
from circulating tumor DNA: LiquidLung-O-Cohort 2. Cancer Res
Treat. 51:777–787. 2019. View Article : Google Scholar : PubMed/NCBI
|
|
5
|
Chen S, Ren Y and Duan P: Biomimetic
nanoparticle loading obatoclax mesylate for the treatment of
non-small-cell lung cancer (NSCLC) through suppressing Bcl-2
signaling. Biomed Pharmacother. 129:1103712020. View Article : Google Scholar : PubMed/NCBI
|
|
6
|
Zhou J, Hui X, Mao Y and Fan L:
Identification of novel genes associated with a poor prognosis in
pancreatic ductal adenocarcinoma via a bioinformatics analysis.
Biosci Rep. 39:BSR201906252019. View Article : Google Scholar : PubMed/NCBI
|
|
7
|
Bakht MK, Lovnicki JM, Tubman J, Stringer
KF, Chiaramonte J, Reynolds MR, Derecichei I, Ferraiuolo RM,
Fifield BA, Lubanska D, et al: Differential expression of glucose
transporters and hexokinases in prostate cancer with a
neuroendocrine gene signature: A mechanistic perspective for
18F-FDG imaging of PSMA-suppressed tumors. J Nucl Med.
61:904–910. 2020. View Article : Google Scholar : PubMed/NCBI
|
|
8
|
Kim S, Shin W, Lee YM, Mun S and Han K:
Differential expressions of L1-chimeric transcripts in normal and
matched-cancer tissues. Anal Biochem. 600:1137692020. View Article : Google Scholar : PubMed/NCBI
|
|
9
|
Zhang J, Guo X, Hamada T, Yokoyama S,
Nakamura Y, Zheng J, Kurose N, Ishigaki Y, Uramoto H, Tanimoto A
and Yamada S: Protective effects of peroxiredoxin 4 (PRDX4) on
cholestatic liver injury. Int J Mol Sci. 19:25092018. View Article : Google Scholar : PubMed/NCBI
|
|
10
|
Jiang J, Liu HL, Tao L, Lin XY, Yang YD,
Tan SW and Wu B: Let-7d inhibits colorectal cancer cell
proliferation through the CST1/p65 pathway. Int J Oncol.
53:781–790. 2018.PubMed/NCBI
|
|
11
|
Du SM: The SNHG16/miR-30a axis promotes
breast cancer cell proliferation and invasion by regulating RRM2.
Neoplasma. 67:567–575. 2020. View Article : Google Scholar : PubMed/NCBI
|
|
12
|
Zhuang S, Li L, Zang Y, Li G and Wang F:
RRM2 elicits the metastatic potential of breast cancer cells by
regulating cell invasion, migration and VEGF expression via the
PI3K/AKT signaling. Oncol Lett. 19:3349–3355. 2020.PubMed/NCBI
|
|
13
|
Xia P, Zhang H, Xu K, Jiang X, Gao M, Wang
G, Liu Y, Yao Y, Chen X, Ma W, et al: MYC-targeted WDR4 promotes
proliferation, metastasis, and sorafenib resistance by inducing
CCNB1 translation in hepatocellular carcinoma. Cell Death Dis.
12:6912021. View Article : Google Scholar : PubMed/NCBI
|
|
14
|
Zhang H, Zhang X, Li X, Meng WB, Bai ZT,
Rui SZ, Wang ZF, Zhou WC and Jin XD: Effect of CCNB1 silencing on
cell cycle, senescence, and apoptosis through the p53 signaling
pathway in pancreatic cancer. J Cell Physiol. 234:619–631. 2018.
View Article : Google Scholar : PubMed/NCBI
|
|
15
|
Okayama H, Kohno T, Ishii Y, Shimada Y,
Shiraishi K, Iwakawa R, Furuta K, Tsuta K, Shibata T, Yamamoto S,
et al: Identification of genes upregulated in ALK-positive and
EGFR/KRAS/ALK-negative lung adenocarcinomas. Cancer Res.
72:100–111. 2012. View Article : Google Scholar : PubMed/NCBI
|
|
16
|
Xu L, Lu C, Huang Y, Zhou J, Wang X, Liu
C, Chen J and Le H: SPINK1 promotes cell growth and metastasis of
lung adenocarcinoma and acts as a novel prognostic biomarker. BMB
Rep. 51:648–653. 2018. View Article : Google Scholar : PubMed/NCBI
|
|
17
|
Schabath MB, Welsh EA, Fulp WJ, Chen L,
Teer JK, Thompson ZJ, Engel BE, Xie M, Berglund AE, Creelan BC, et
al: Differential association of STK11 and TP53 with KRAS
mutation-associated gene expression, proliferation and immune
surveillance in lung adenocarcinoma. Oncogene. 35:3209–3216. 2016.
View Article : Google Scholar : PubMed/NCBI
|
|
18
|
Rousseaux S, Debernardi A, Jacquiau B,
Vitte AL, Vesin A, Nagy-Mignotte H, Moro-Sibilot D, Brichon PY,
Lantuejoul S, Hainaut P, et al: Ectopic activation of germline and
placental genes identifies aggressive metastasis-prone lung
cancers. Sci Transl Med. 5:186ra662013. View Article : Google Scholar : PubMed/NCBI
|
|
19
|
Director's Challenge Consortium for the
Molecular Classification of Lung Adenocarcinoma, . Shedden K,
Taylor JM, Enkemann SA, Tsao MS, Yeatman TJ, Gerald WL, Eschrich S,
Jurisica I, Giordano TJ, et al: Gene expression-based survival
prediction in lung adenocarcinoma: A multi-site, blinded validation
study. Nat Med. 14:822–827. 2008. View
Article : Google Scholar : PubMed/NCBI
|
|
20
|
Tungsukruthai S, Sritularak B and
Chanvorachote P: Cycloartobiloxanthone inhibits migration and
invasion of lung cancer cells. Anticancer Res. 37:6311–6319.
2017.PubMed/NCBI
|
|
21
|
Stoellinger HM and Alexanian AR:
Modifications to the transwell migration/invasion assay method that
eases assay performance and improves the accuracy. Assay Drug Dev
Technol. 20:75–82. 2022. View Article : Google Scholar : PubMed/NCBI
|
|
22
|
Xu L, Wang X, Wang W, Sun M, Choi WJ, Kim
JY, Hao C, Li S, Qu A, Lu M, et al: Enantiomer-dependent
immunological response to chiral nanoparticles. Nature.
601:366–373. 2022. View Article : Google Scholar : PubMed/NCBI
|
|
23
|
Cheng Y, Shen Z, Gao Y, Chen F, Xu H, Mo
Q, Chu X, Peng CL, McKenzie TT, Palacios BE, et al: Phase
transition and remodeling complex assembly are important for
SS18-SSX oncogenic activity in synovial sarcomas. Nat Commun.
13:27242022. View Article : Google Scholar : PubMed/NCBI
|
|
24
|
Li HJ, Ke FY, Lin CC, Lu MY, Kuo YH, Wang
YP, Liang KH, Lin SC, Chang YH, Chen HY, et al: ENO1 promotes lung
cancer metastasis via HGFR and WNT signaling-driven
epithelial-to-mesenchymal transition. Cancer Res. 81:4094–4109.
2021. View Article : Google Scholar : PubMed/NCBI
|
|
25
|
Li H, Han D, Hou Y, Chen H and Chen Z:
Statistical inference methods for two crossing survival curves: A
comparison of methods. PLoS One. 10:e01167742015. View Article : Google Scholar : PubMed/NCBI
|
|
26
|
Kim GS, Kang J, Bang SW and Hwang DS: Cdc6
localizes to S- and G2-phase centrosomes in a cell cycle-dependent
manner. Biochem Biophys Res Commun. 456:763–767. 2015. View Article : Google Scholar : PubMed/NCBI
|
|
27
|
Li Z, Qi F and Li F: Establishment of a
gene signature to predict prognosis for patients with lung
adenocarcinoma. Int J Mol Sci. 21:84792020. View Article : Google Scholar : PubMed/NCBI
|
|
28
|
Qin J, Xu Z, Deng K, Qin F, Wei J, Yuan L,
Sun Y, Zheng T and Li S: Development of a gene signature associated
with iron metabolism in lung adenocarcinoma. Bioengineered.
12:4556–4568. 2021. View Article : Google Scholar : PubMed/NCBI
|
|
29
|
Siegel RL, Miller KD and Jemal A: Cancer
statistics, 2020. CA Cancer J Clin. 70:7–30. 2020. View Article : Google Scholar : PubMed/NCBI
|
|
30
|
Behera M, Owonikoko TK, Gal AA, Steuer CE,
Kim S, Pillai RN, Khuri FR, Ramalingam SS and Sica GL: Lung
adenocarcinoma staging using the 2011 IASLC/ATS/ERS classification:
A pooled analysis of adenocarcinoma in situ and minimally invasive
adenocarcinoma. Clin Lung Cancer. 17:e57–e64. 2016. View Article : Google Scholar : PubMed/NCBI
|
|
31
|
Ye S, Liu Y, Fuller AM, Katti R, Ciotti
GE, Chor S, Alam MZ, Devalaraja S, Lorent K, Weber K, et al: TGFβ
and hippo pathways cooperate to enhance sarcomagenesis and
metastasis through the hyaluronan-mediated motility receptor
(HMMR). Mol Cancer Res. 18:560–573. 2020. View Article : Google Scholar : PubMed/NCBI
|
|
32
|
Yang D, Ma Y, Zhao P, Ma J and He C:
Systematic screening of protein-coding gene expression identified
HMMR as a potential independent indicator of unfavorable survival
in patients with papillary muscle-invasive bladder cancer. Biomed
Pharmacother. 120:1094332019. View Article : Google Scholar : PubMed/NCBI
|
|
33
|
Man Y, Cao J, Jin S, Xu G, Pan B, Shang L,
Che D, Yu Q and Yu Y: Newly identified biomarkers for detecting
circulating tumor cells in lung adenocarcinoma. Tohoku J Exp Med.
234:29–40. 2014. View Article : Google Scholar : PubMed/NCBI
|
|
34
|
Li W, Pan T, Jiang W and Zhao H:
HCG18/miR-34a-5p/HMMR axis accelerates the progression of lung
adenocarcinoma. Biomed Pharmacother. 129:1102172020. View Article : Google Scholar : PubMed/NCBI
|
|
35
|
Wang X, Xia S, Li H, Wang X, Li C, Chao Y,
Zhang L and Han C: The deubiquitinase USP10 regulates KLF4
stability and suppresses lung tumorigenesis. Cell Death Differ.
27:1747–1764. 2020. View Article : Google Scholar : PubMed/NCBI
|
|
36
|
Roberts MS, Anstine LJ, Finke VS, Bryson
BL, Webb BM, Weber-Bonk KL, Seachrist DD, Majmudar PR and Keri RA:
KLF4 defines the efficacy of the epidermal growth factor receptor
inhibitor, erlotinib, in triple-negative breast cancer cells by
repressing the EGFR gene. Breast Cancer Res. 22:662020. View Article : Google Scholar : PubMed/NCBI
|
|
37
|
Kawabata KC, Ehata S, Komuro A, Takeuchi K
and Miyazono K: TGF-β-induced apoptosis of B-cell lymphoma ramos
cells through reduction of MS4A1/CD20. Oncogene. 32:2096–2106.
2013. View Article : Google Scholar : PubMed/NCBI
|
|
38
|
Kubota T, Sasaki Y, Shiozawa E, Takimoto
M, Hishima T and Chong JM: Age and CD20 expression are significant
prognostic factors in human herpes virus-8-negative effusion-based
lymphoma. Am J Surg Pathol. 42:1607–1616. 2018. View Article : Google Scholar : PubMed/NCBI
|
|
39
|
Ito H, Tsunoda T, Riku M, Inaguma S, Inoko
A, Murakami H, Ikeda H, Matsuda M and Kasai K: Indispensable role
of STIL in the regulation of cancer cell motility through the
lamellipodial accumulation of ARHGEF7-PAK1 complex. Oncogene.
39:1931–1943. 2020. View Article : Google Scholar : PubMed/NCBI
|
|
40
|
Wang J, Zhang Y, Dou Z, Jiang H, Wang Y,
Gao X and Xin X: Knockdown of STIL suppresses the progression of
gastric cancer by down-regulating the IGF-1/PI3K/AKT pathway. J
Cell Mol Med. 23:5566–5575. 2019. View Article : Google Scholar : PubMed/NCBI
|
|
41
|
Patwardhan D, Mani S, Passemard S,
Gressens P and El Ghouzzi V: STIL balancing primary microcephaly
and cancer. Cell Death Dis. 9:652018. View Article : Google Scholar : PubMed/NCBI
|
|
42
|
von Ehr A, Attaai A, Neidert N, Potru PS,
Ruß T, Zöller T and Spittau B: Inhibition of microglial TGFβ
signaling increases expression of Mrc1. Front Cell Neurosci.
14:662020. View Article : Google Scholar : PubMed/NCBI
|
|
43
|
Liu Q, Bai W, Huang F, Tang J and Lin X:
Downregulation of microRNA-196a inhibits stem cell self-renewal
ability and stemness in non-small-cell lung cancer through
upregulating GPX3 expression. Int J Biochem Cell Biol.
115:1055712019. View Article : Google Scholar : PubMed/NCBI
|
|
44
|
Worley BL, Kim YS, Mardini J, Zaman R,
Leon KE, Vallur PG, Nduwumwami A, Warrick JI, Timmins PF, Kesterson
JP, et al: GPx3 supports ovarian cancer progression by manipulating
the extracellular redox environment. Redox Biol. 25:1010512019.
View Article : Google Scholar : PubMed/NCBI
|
|
45
|
Sun Y, Hou L, Yang Y, Xie H, Yang Y, Li Z,
Zhao H, Gao W and Su B: Two-gene signature improves the
discriminatory power of IASLC/ATS/ERS classification to predict the
survival of patients with early-stage lung adenocarcinoma. Onco
Targets Ther. 9:4583–4591. 2016. View Article : Google Scholar : PubMed/NCBI
|
|
46
|
Borlado LR and Méndez J: CDC6: From DNA
replication to cell cycle checkpoints and oncogenesis.
Carcinogenesis. 29:237–243. 2008. View Article : Google Scholar : PubMed/NCBI
|