Introduction
Cardiovascular diseases (CVDs) are the primary cause
of mortality worldwide (1). The
prevalence of cardiovascular risk factors, particularly low
high-density lipoprotein-cholesterol (HDL-C) levels, was high (32%)
in participants of the Tehran Lipid and Glucose Study (TLGS)
(2). Several previous studies have
found an inverse correlation between plasma HDL-C and the risk of
CVDs (3,4). Since HDL-C levels are predominantly
under genetic control, with heritability estimates of >80%
(5), the detection and
characterization of genetic variants associated with HDL-C
concentration may provide novel insights in the field of life
expectancy. A large number of genes contributing to HDL-C
concentration have been identified; however, the variants detected
in these genes together explain only a small amount (<10%) of
the HDL-C variances (6).
Therefore, more studies are required to identify genetic variants,
and this may be achieved by sequence-based approaches on the
identified genes (6).
While loss-of-function mutations in apolipoprotein
A-I (APOA1), LCAT or ATP cassette transporter A1 (ABCA1) cause
monogenic HDL-C deficiencies, single gene defects in hepatic lipase
(LIPC) or cholesteryl ester transfer protein (CETP) are associated
with high HDL-C levels in humans (7,8).
LCAT, first described in 1962 (9),
is a soluble enzyme that has a central role in the formation and
maturation of HDL-C. The majority of the LCAT is synthesized by the
liver and circulates in the blood, reversibly bound to
lipoproteins. In the blood, LCAT preferentially binds to HDL and is
then activated by apoA-I, the major protein component of HDL, and
converts phosphatidylcholines and cholesterol of HDL into
lysophosphatidylcholines and cholesteryl esters (10). The LCAT gene, located on chromosome
16q22.1 reverse strand, spans 4,382 bp (11) and contains six exons with ~1.5 kb
of coding sequence that encodes a 416-amino acid protein (12).
Mutations in the LCAT gene have been found to cause
fish-eye disease, as well as familial LCAT deficiency (13). A meta-analysis genome-wide
association study (GWAS) on >100,000 individuals (14) and a Mendelian randomization study
identified a single-nucleotide polymorphism (SNP) in LCAT as the
strongest indicator of isolated variation in levels of HDL-C
(15).
The present study was performed to evaluate the role
of genetic variation in LCAT (a biological candidate gene involved
in HDL metabolism) in relation to HDL-C levels in epidemiological
samples from the TLGS.
Materials and methods
Study population
In this cross-sectional study, 150 individuals, aged
between 15 and 75 years, with HDL-C levels <5th percentile
adjusted for age and gender (84 individuals) and those with levels
of HDL-C >95th percentile adjusted for age and gender (66
individuals), without any other lipid abnormalities, were selected
among TLGS participants. The TLGS is a prospective population-based
longitudinal cohort study with >15,000 participants designed to
determine the risk factors for major noncommunicable disorders in
Tehran (16).
To increase the likelihood of genetic causes, only
individuals who had the same trait in all four TLGS phases
consistently and had at least one family member with the same trait
were included. Obese individuals [body mass index (BMI) ≥30
kg/m2] and those receiving drugs affecting HDL-C levels
were excluded from the study. A standardized questionnaire was used
to collect data on demographics and medication usage for lipid
disorders and hypertension treatment.
The study was conducted at the Research Institute
for Endocrine Sciences in Shahid Beheshti University of Medical
Sciences (Tehran, Iran) following approval by the Institutional
Ethics Committee. Each participant signed a written informed
consent form.
Biochemical assessment
Details of collection, preparation and lipid
determination methods, together with details regarding quality
control have been previously published (17). Briefly, a venous blood sample was
obtained from each subject, and fasting blood glucose (FBS), total
cholesterol (TC), triglycerides (TG), low-density lipoprotein
cholesterol (LDL-C) and HDL-C were measured using a Selectra 2
Auto-Analyzer (Vital Scientific, Spankeren, The Netherlands) the
same day. TC and TG were measured using the cholesterol enzymatic
colorimetric assay kit (Pars Azmoon Inc., Tehran, Iran). Serum
HDL-C levels were measured following precipitation of apo
B-containing lipoproteins with dextran-magnesium sulfate (18). LDL-C was calculated in serum
samples with TG <400 mg/dl using the Friedwald formula (19).
Gene resequencing
In order to analyze the genetic polymorphisms of
LCAT, genomic DNA was isolated from the blood of the participants
using the standard proteinase K salting-out method (20). Sequences of human LCAT coding
regions (GenBank NM_000229.1) were acquired from the University of
California, Santa Cruz (UCSC) Genome Browser (http://genome.ucsc.edu/) (21). Six DNA fragments were amplified,
covering 857 bp upstream of exon 1, all six exons of LCAT and the
exon-intron boundaries. Primers were designed using web-based
Primer3 software (22) and
National Center for Biotechnology Information (NCBI) primer blast
programs (23). Primers were
verified using electronic PCR on the UCSC Genome Browser to ensure
one unique genomic hit, and were also inspected for known SNPs
using the SNP Database (dbSNP) (24) and Ensembl (25). Polymerase chain reaction (PCR)
conditions and primer sequences are provided in Table I.
 | Table IPolymerase chain reaction primers used
for the analysis of the lecithin cholesterol acyltransferase
gene. |
Table I
Polymerase chain reaction primers used
for the analysis of the lecithin cholesterol acyltransferase
gene.
| Primer name | Primer sequence (5′
to 3′) | Annealing (°C) | Product size
(bp) |
|---|
| Promoter | F:
TGTTGCCTCCTTGACTTGAG
R: GGGAAGAGCACATTGAGGAGa | 53 | 957 |
| Exon | 1 F:
CCTTTCCGGCAATCTCTGa
R: TCACAGTGTGGTGGGAGAAG | 56 | 481 |
| Exons 2 and 3 | F:
CCAGACTGGGTGTTTGCTC
R: TGTGTGCAGGTACCCTGTG | 59 | 731 |
| Exon 4 | F:
AGCAAGCTGGCAGGTTTGTGTCAa
R: AAGACAGGCTTCCCATAGGCAG | 63 | 362 |
| Exon 5 | F:
AACAATGGCTACGTGCGGGACGAa
R: AGTGGTAGATAGCACCCCTAGAG | 62 | 485 |
| Exon 6 | F:
TGAGCCTACACTCAGCAGGTTGTGa
R: CCCATCTTGCCTCACTGCACACA | 69 | 781 |
Each PCR amplification was performed with 100 ng
genomic DNA in a 30-μl final volume reaction, containing 40 pmol
each primer, 0.2 mmol/l each deoxynucleotide triphosphate, 1.5
mmol/l MgCl2, 10 mmol/l Tris (pH 8.4) and 0.25 units Taq
polymerase (Fermentase Co., Burlington, ON, Canada). Hybridization
was conducted in a DNA Thermal Cycler (Corbett Life Sciences,
Sydney, Australia), in which, following pre-denaturation for 5 min
at 96°C, there were 32 cycles of 96°C for 50 sec, an annealing step
at the temperature given for the primer pair (Table I) for 35 sec and an elongation step
at 72°C for 50 sec, followed by a final extension at 72°C for 5
min. The PCR products were run on 1.5% agarose gel and the gel was
then treated with 1 mg/dl ethidium bromide solution for 10 min. The
DNA fragments were subsequently visualized using the gel
documentation system OptiGo (Isogen Life Science, De Meern,
Netherlands).
Purification and sequencing of the PCR
product
The PCR product was purified using the Qiagen kit
(Germantown, MD, USA) in order to eliminate excess nucleotides,
dimers and nonspecific bands, and the PCR product was then
processed through direct sequencing using an Applied Biosystems
3730/3730xl DNA Analyzer (Applied Biosystems, Foster City, CA,
USA). Sequence alignment analysis was performed using the Basic
Local Alignment Search Tool (BLAST) (26), ClastalW (http://www.ebi.ac.uk/clustalw/) and chromas
programs.
Statistical analysis
The allele frequency and consistency with the
Hardy-Weinberg equilibrium were calculated using the PowerMarker
software version 3.25 (27). The
SPSS Version 15 software package (SPSS, Inc., Chicago, IL, USA) and
STATA version 9.1 (StataCorp LP, College Station, TX, USA) were
used to analyze the data. Categorical variable distribution was
analyzed using the χ2 test. Multivariate logistic
regressions were used to control the effects of potential
confounders, including age, BMI, smoking and gender. For all tests,
P<0.05 was considered to indicate a statistically significant
difference.
Results
Characteristics of the study
population
The mean ages of individuals in the low and high
HDL-C groups were 41±13 and 37±16 years, respectively. Table II summarizes the demographic and
biochemical parameters, as well as the clinical characteristics of
the studied population. The BMI, FBS, TC, TG and LDL-C in the low
HDL-C group were significantly different from those in the high
HDL-C group.
| Table IICharacteristics of the study
population. |
Table II
Characteristics of the study
population.
| Variables | Subjects with high
HDL-C | Subjects with low
HDL-C | P-value |
|---|
| Gender, M/F
(%/%) | 59.1/40.9 | 75/25 | NS |
| Age (years) | 37±16 | 41±13 | NS |
| TC (mg/dl) | 194±42 | 168±47 | 0.001 |
| LDL-C (mg/dl) | 104±35 | 90±28 | 0.012 |
| TG (mg/dl) | 81±42 | 251±179 | <0.001 |
| BMI
(kg/m2) | 23±3 | 26±3 | <0.001 |
| FBS (mg/dl) | 93±9 | 108±34 | 0.001 |
| SBP (mmHg) | 113±19 | 114±17 | NS |
| DBP (mmHg) | 73±11 | 77±9 | 0.016 |
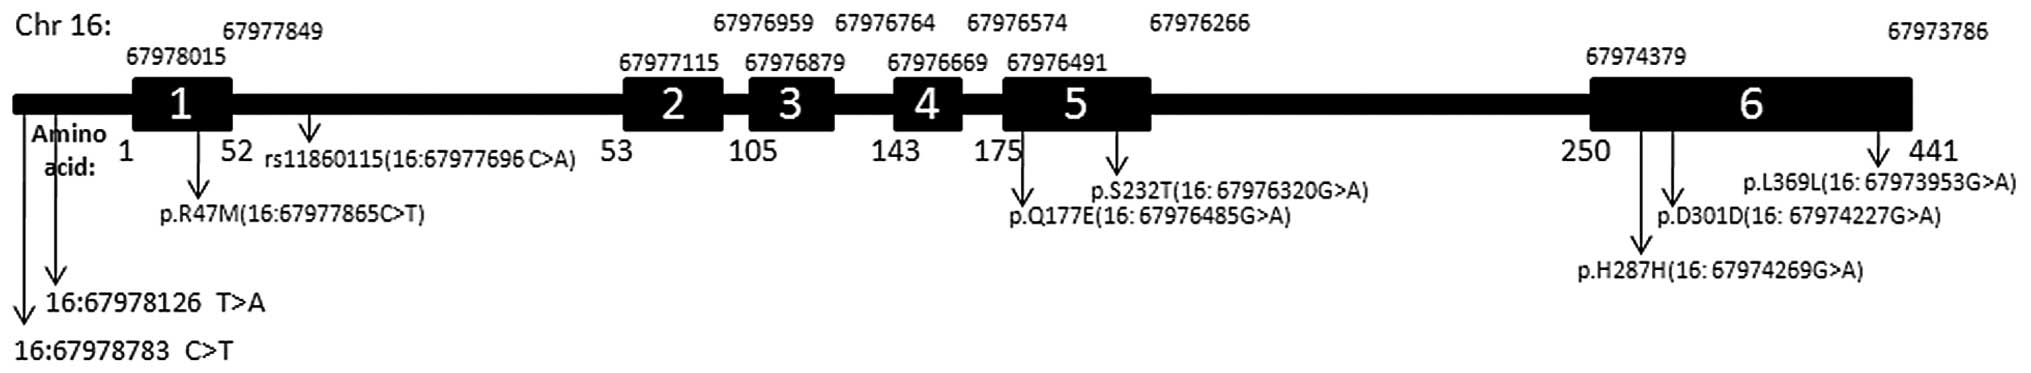
Identification of SNPs in the LCAT
gene
The region (~1,500 bp) of the LCAT gene encoding 440
amino acids was determined by sequencing and NCBI BLAST. A total of
14 SNPs were identified through the sequencing of 300 chromosomes
(Fig. 1). The type and position of
the SNPs, as well as their frequency of occurrence, are listed in
Table III. Six of the nucleotide
substitutions were found to be in exons, whilst six SNPs occurred
in introns and two were located in the promoter. The nucleotide
variations in the 5′ regulatory region occurred in one gene copy.
These substitutions included a C instead of T at position 4,233
(g.4233T>A) and G instead of A at position 4,890 (g.4890C>T)
(positions given according to GenBank entry NG_009778.1).
| Table IIISummary of variations identified in
lecithin cholesterol acyltransferase. |
Table III
Summary of variations identified in
lecithin cholesterol acyltransferase.
| Variants | HGVS names/SNP
ID | Location | Amino acid
position | Amino acid
change | MAF | Predicted effect
(PolyPhen) | Score |
|---|
| Chr:
16:67978783 | g.4233T>A | Promoter | NA | NA | 0.004 | | |
| Chr:
16:67978126 | g.4890C>T | Promoter | NA | NA | 0.004 | | |
| Chr:
16:67977696a | g.5320T>G
rs11860115 | Intron | NA | NA | 0.007 | | |
| Chr:
16:67977865a | g.5151G>A
COSM972635 (R47M) | Exon 1 | 47 | Arg-Met | 0.004 | Possibly
damaging | 0.739 |
| Chr:
16:67976686 | g.6330G>A | Intron | NA | NA | 0.004 | | |
| Chr:
16:67976682 | g.6334G>A | Intron | NA | NA | 0.007 | | |
| Chr:
16:67976555 | g.6461G>A | Intron | NA | NA | 0.004 | | |
| Chr:
16:67976261 | g.6755G>A | Intron | NA | NA | 0.004 | | |
| Chr:
16:67973791 | g.9225A>G | Intron | NA | NA | 0.004 | | |
| Chr:
16:67976485 | g.6531C>G or
c.529C>G (Q177E) | Exon 5 | 177 | Gln-Glu | 0.046 | Possibly
damaging | 0.953 |
| Chr:
16:67976320a | g.6696T>A or
c.694T>A rs4986970 (S232T) | Exon 5 | 232 | Ser-Thr | 0.004 | Probably
damaging | 0.977 |
| Chr:
16:67973953a | g.9063C>T or
c.1177C>T rs5923 (L369L) | Exon 6 | 393 | Leu-Leu | 0.050 | | |
| Chr:
16:67974227 | g.8789C>T
(D301D) | Exon 6 | 301 | Asp-Asp | 0.004 | | |
| Chr:
16:67974269 | g.8747C>T
(H287H) | Exon 6 | 287 | His-His | 0.004 | | |
Three of the SNPs in the protein coding regions were
non-synonymous, whilst the others were synonymous. One SNP in exon
1 was observed in only one individual. No polymorphisms were found
in exon 2. Three of the SNPs were in exon 6, two of which were
synonymous and one of which was non-synonymous. Whilst all
nucleotide substitutions in the 5′ sequences were transition
mutations, two of the substitutions within the coding sequences and
two of the substitutions within the intron sequences were
transversions.
A review of the dbSNP found that, to date (May
2013), 161 SNPs in the human LCAT gene have been submitted
(24). Additionally, the Ensembl
Genome Browser (25) has indexed
1,029 variants in the human LCAT gene with 1,136 downstream gene
variants and 1,872 upstream gene variants (http://www.ensembl.org/Homo_sapiens/Gene/Variation_Gene/Table?g=ENSG00000213398;r=16:67973653-67978034).
In addition, >80 causative mutations in LCAT have been described
(28) in the Human Gene Mutation
Database (HGMD; http://www.hgmd.cf.ac.uk/ac/) (29).
Ten of the identified SNPs were found to be novel.
The L393L, S232T and 16:67977696 C>A polymorphisms have been
previously reported in the dbSNP Human Build 137 (as rs5923,
rs4986970 and rs11860115, respectively), and the non-synonymous
R47M mutation (COSM972635) was observed in Ensembl (release 18,
2013) and has been reported in the Catalogue of Somatic Mutations
in Cancer (http://cancer.sanger.ac.uk/cosmic/mutation/overview?id=972635)
(30).
Six of the 14 polymorphisms were found only in the
high-HDL-C group, whilst six were only in the low-HDL-C group.
Three of the 150 individuals carried two of the SNPs of LCAT. The
most common variant was L393L in exon 6, found in 15 of 300
alleles, and the Q177E in exon 5, found in 14 of 300 alleles.
Allele frequencies of low and high HDL-C groups are shown in
Table IV. No significant
differences were detected between the study groups. Evaluating
genotype frequencies in low versus high HDL-C groups using Fisher’s
exact test demonstrated a significant association for the
synonymous L393L (P=0.04) and the non-synonymous Q177E (P=0.02)
SNPs. Univariate conditional logistic regression odds ratios (ORs)
were nominally significant for Q177E models only [OR, 5.64; P=0.02;
95% confidence interval (CI), 1.2–26.2]. Multivariate logistic
models with adjustment for age, gender, smoking, FBS and BMI
attenuated the effect (OR, 2.58; P=0.47; 95% CI, 0.16–39.5).
| Table IVAllele frequencies of lecithin
cholesterol acyltransferase variants. |
Table IV
Allele frequencies of lecithin
cholesterol acyltransferase variants.
| | Allele frequency
(%) | |
|---|
| |
| |
|---|
| Number | Variant | High HDL group | Low HDL group | P-valuea |
|---|
| 1 | Chr: 16:67978783
C>T | 0.9 | 0.0 | 0.41 |
| 2 | Chr: 16:67978126
G> A | 0.0 | 0.6 | 0.52 |
| 3 | Chr: 16:67977696
A> C | 0.0 | 1.2 | 0.37 |
| 4 | Chr: 16:67977865
C> T | 0.0 | 0.6 | 0.52 |
| 5 | Chr: 16:67976687
G> T | 1.5 | 0.0 | 0.44 |
| 6 | Chr: 16:67976682 C
>T | 0.0 | 1.2 | 0.37 |
| 7 | Chr: 16:67976555
C> T | 0.9 | 0.0 | 0.41 |
| 8 | Chr: 16:67976261 C
>T | 0.0 | 0.6 | 0.52 |
| 9 | Chr: 16:67973791 T
>C | 0.0 | 0.6 | 0.52 |
| 10 | Chr: 16:67976485
G> C | 1.5 | 7.5 | 0.09 |
| 11 | Chr: 16:67976320
A> T | 0.9 | 0.0 | 0.41 |
| 12 | Chr: 16:67973953
G> A | 2.6 | 8.2 | 0.16 |
| 13 | Chr: 16:67974227
G>A | 0.9 | 0.0 | 0.41 |
| 14 | Chr: 16:67974269
G> C | 0.9 | 0.0 | 0.41 |
Three of the identified SNPs (position 6,531 in exon
5, position 6,696 in exon 5 and position 5,151 in exon 1) gave rise
to amino acid substitutions. Computational tools, for example
Sorting Intolerant From Tolerant (31) and Polymorphism Phenotyping
(PolyPhen) (32) are able to
predict 90% of damaging SNPs. Table
III shows analysis using PolyPhen, which revealed that two of
the missense SNPs were possibly damaging, and one of them is
probably damaging (available at http://genetics.bwh.harvard.edu/pph2/index.shtml).
Discussion
In the present study, enzymatic amplification and
direct sequencing of the LCAT gene from individuals with high and
low HDL-C were performed in order to investigate the association
between LCAT and HDL-C levels in a population-based study in
Tehran. Since LCAT is a biological candidate for HDL-C levels, the
common and/or rare variants of LCAT are hypothesized to contribute
to variation in HDL-C levels between individuals.
To date, candidate genes, genome-wide linkage and
GWASs have identified several genetic variations that may account
for plasma HDL-C levels (8). GWASs
independently identified numerous genetic loci for HDL-C (33–35).
For example, eight GWASs analyzing HDL-C levels have confirmed the
following genes that were recognized from functional studies: LCAT,
CETP, LIPC, lipoprotein lipase, ABCA1, endothelial lipase and the
gene cluster APOA1C3A4A5 (6). A
meta-analysis GWAS, including >100,000 individuals, identified
an SNP in the LCAT gene as the strongest marker of isolated
variation in HDL-C levels (14).
This indicates that variants in the LCAT gene associated with
levels of HDL-C may be useful for a formal causality test of HDL-C
levels for determining the risk of CVDs (15).
The genotyping platforms typically used in GWASs
include mostly common variants [minor allele frequency
(MAF)>0.05] that are unlikely to tag most of the rare variants
in the genome or to identify the true causative variant due to the
small effect sizes of common variants. One of the strategies used
to identify these rare variants is the resequencing of extreme
phenotypes, for which individuals at both extremes of the phenotype
(e.g. highest and lowest five percentiles) are selected for further
sequencing. These individuals may be part of a population-based
cohort or a case-control study (36). Variants with major phenotypic
effects are likely to be found only at one extreme, while alleles
found in both the high and low HDL-C groups are most likely neutral
with respect to HDL-C levels (37). Resequencing, unlike GWASs, requires
a decision as to which gene to target. Resequencing is usually used
to analyze the regions within a gene rather than the region between
genes, and within exons rather than introns, and it is able to
detect not only SNPs, but also structural variations such as
copy-number variations (deletions and insertions) and copy-neutral
variants (inversions and translocations) (36). Furthermore, resequencing requires
smaller sample sizes, and previous studies have obtained positive
results with initial sample sizes of ≤200 (100 from each phenotypic
extreme) (38). These positive
findings may then be followed by studies on populations enriched
for the variants, for example families of individuals who carry the
risk alleles.
Cohen et al (37) resequenced three candidate genes
(ABCA1, APOA1 and LCAT) in 256 individuals constituting the upper
and lower 5% of the distribution of plasma HDL-C levels in a
population-based study. The number of synonymous variants was
similar in high and low HDL-C groups. Non-synonymous sequence
variants were significantly more common (16 vs. 2%) in individuals
with low HDL-C compared with those with high HDL-C (six LCAT
non-synonymous sequence variations were unique to the low-HDL-C
group) (37). Therefore, it was
concluded in the study that multiple rare, non-synonymous sequence
variants of the genes that are involved in HDL metabolism may
influence HDL-C levels. The results of the study supported the
‘rare variant-common disease’ hypothesis (39).
In the present study, a similar approach was used as
Cohen et al (37); however,
the entire gene and flanking regions were sequenced so that the
regulatory variants were also identified. A total of 150
individuals with HDL-C levels in the extremes were sequenced, and
14 variants were identified. Three of the variants were
non-synonymous sequence variants, of which one was significantly
more common in individuals with low HDL-C compared with those with
high HDL-C. The other two were present only in the high HDL-C
group. Three synonymous mutations were found in exon 6; only one of
these mutations had an MAF of 5%, and this mutation was more common
in the low HDL-C group. The majority of identified variants (71.4%)
were absent from the dbSNP Human Build 137; however, some of them
(21.4%) were present in the 1,000 Genomes Project (http://www.1000genomes.org) and one SNP (COSM972635)
was present in Ensembl (24). A
synonymous H287H mutation in the coding region of exon 6 of the
LCAT gene was observed in an individual with HDL-C levels of 75
mg/dl. CD952176 is the accession number of the coding sequence
variant from the HGMD-PUBLIC dataset December 2012 (release 2012.4)
that is present at 16:67974268. A previous study (40) demonstrated that point mutations
(deletion or frameshift mutations) at this position result in LCAT
deficiency.
Tietjen et al (41) resequenced 178 unrelated probands
with HDL-C <10th percentile and showed that mutations were most
frequent in LCAT, followed by ABCA1 and APOA1; together, these
explain >40% of familial hypoalphalipoproteinemia. Furthermore,
they observed a clear elevation in coronary artery disease risk
among individuals with the mutations and a large reduction in HDL-C
(41). Holleboom et al
(28) found high mutation
frequencies of LCAT in individuals with low levels of HDL-C in the
Netherlands, and 50% of the LCAT mutations were a p.T147I mutation
(28).
Due to time constraints and technical issues in the
present study, the identified variants were not genotyped. When all
variants are genotyped in the entire population, it may be possible
to determine the extent to which LCAT variants influence HDL-C
levels in the TLGS population.
Acknowledgements
This study was supported by the grant
SBUMS/M-1391/278 from Shahid Beheshti University of Medical
Sciences. The participation of the staff of the Research Institute
for Endocrine Sciences and the TLGS unit is gratefully
acknowledged. The authors would also like to thank Ms. Niloofar
Shiva for the critical editing of the English grammar and syntax of
the manuscript.
References
|
1
|
Malaguarnera M, Vacante M, Russo C, et al:
Lipoprotein(a) in cardiovascular diseases. Biomed Res Int.
2013:6509892013. View Article : Google Scholar : PubMed/NCBI
|
|
2
|
Azizi F, Rahmani M, Emami H, et al:
Cardiovascular risk factors in an Iranian urban population: Tehran
lipid and glucose study (phase 1). Soz Praventivmed. 47:408–426.
2002. View Article : Google Scholar : PubMed/NCBI
|
|
3
|
Gordon T, Castelli WP, Hjortland MC,
Kannel WB and Dawber TR: High density lipoprotein as a protective
factor against coronary heart disease. The Framingham Study. Am J
Med. 62:707–714. 1977. View Article : Google Scholar : PubMed/NCBI
|
|
4
|
Barter P, Gotto AM, LaRosa JC, et al;
Treating to New Targets Investigators. HDL cholesterol, very low
levels of LDL cholesterol, and cardiovascular events. N Engl J Med.
357:1301–1310. 2007. View Article : Google Scholar : PubMed/NCBI
|
|
5
|
Wang X and Paigen B: Genetics of variation
in HDL cholesterol in humans and mice. Circ Res. 96:27–42. 2005.
View Article : Google Scholar : PubMed/NCBI
|
|
6
|
Boes E, Coassin S, Kollerits B, Heid IM
and Kronenberg F: Genetic-epidemiological evidence on genes
associated with HDL cholesterol levels: a systematic in-depth
review. Exp Gerontol. 44:136–160. 2009. View Article : Google Scholar
|
|
7
|
Holleboom AG, Vergeer M, Hovingh GK,
Kastelein JJ and Kuivenhoven JA: The value of HDL genetics. Curr
Opin Lipidol. 19:385–394. 2008. View Article : Google Scholar : PubMed/NCBI
|
|
8
|
Weissglas-Volkov D and Pajukanta P:
Genetic causes of high and low serum HDL-cholesterol. J Lipid Res.
51:2032–2057. 2010. View Article : Google Scholar : PubMed/NCBI
|
|
9
|
Glomset JA: The mechanism of the plasma
cholesterol esterification reaction: plasma fatty acid transferase.
Biochim Biophys Acta. 65:128–135. 1962. View Article : Google Scholar : PubMed/NCBI
|
|
10
|
Jonas A: Lecithin cholesterol
acyltransferase. Biochim Biophys Acta. 1529:245–256. 2000.
View Article : Google Scholar
|
|
11
|
Safran M, Dalah I, Alexander J, et al:
GeneCards Version 3: the human gene integrator. Database (Oxford).
2010:baq0202010. View Article : Google Scholar : PubMed/NCBI
|
|
12
|
McLean J, Wion K, Drayna D, Fielding C and
Lawn R: Human lecithin-cholesterol acyltransferase gene: complete
gene sequence and sites of expression. Nucleic Acids Res.
14:9397–9406. 1986. View Article : Google Scholar : PubMed/NCBI
|
|
13
|
Calabresi L, Simonelli S, Gomaraschi M and
Franceschini G: Genetic lecithin: cholesterol acyltransferase
deficiency and cardiovascular disease. Atherosclerosis.
222:299–306. 2012. View Article : Google Scholar : PubMed/NCBI
|
|
14
|
Teslovich TM, Musunuru K, Smith AV, et al:
Biological, clinical and population relevance of 95 loci for blood
lipids. Nature. 466:707–713. 2010. View Article : Google Scholar : PubMed/NCBI
|
|
15
|
Haase CL, Tybjærg-Hansen A, Qayyum AA,
Schou J, Nordestgaard BG and Frikke-Schmidt R: LCAT, HDL
cholesterol and ischemic cardiovascular disease: a Mendelian
randomization study of HDL cholesterol in 54,500 individuals. J
Clin Endocrinol Metab. 97:E248–E256. 2012. View Article : Google Scholar : PubMed/NCBI
|
|
16
|
Azizi F, Ghanbarian A, Momenan AA, et al:
Prevention of non-communicable disease in a population in nutrition
transition: Tehran Lipid and Glucose Study phase II. Trials.
10:52009. View Article : Google Scholar : PubMed/NCBI
|
|
17
|
Azizi F, Raiszadeh F, Salehi P, et al;
Tehran Lipid and Glucose Study Group. Determinants of serum HDL-C
level in a Tehran urban population: the Tehran Lipid and Glucose
Study. Nutr Metab Cardiovasc Dis. 12:80–89. 2002.PubMed/NCBI
|
|
18
|
Warnick GR, Benderson J and Albers JJ:
Dextran sulfate-Mg2+ precipitation procedure for
quantitation of high-density-lipoprotein cholesterol. Clin Chem.
28:1379–1388. 1982.PubMed/NCBI
|
|
19
|
Friedewald WT, Levy RI and Fredrickson DS:
Estimation of the concentration of low-density lipoprotein
cholesterol in plasma, without use of the preparative
ultracentrifuge. Clin Chem. 18:499–502. 1972.
|
|
20
|
Truett GE, Heeger P, Mynatt RL, Truett AA,
Walker JA and Warman ML: Preparation of PCR-quality mouse genomic
DNA with hot sodium hydroxide and tris (HotSHOT). Biotechniques.
29:52542000.PubMed/NCBI
|
|
21
|
Meyer LR, Zweig AS, Hinrichs AS, Karolchik
D, Kuhn RM, Wong M, Sloan CA, Rosenbloom KR, Roe G, Rhead B, Raney
BJ, Pohl A, Malladi VS, Li CH, Lee BT, Learned K, Kirkup V, Hsu F,
Heitner S, Harte RA, Haeussler M, Guruvadoo L, Goldman M, Giardine
BM, Fujita PA, Dreszer TR, Diekhans M, Cline MS, Clawson H, Barber
GP, Haussler D and Kent WJ: The UCSC Genome Browser database:
extensions and updates 2013. Nucleic Acids Res. 41:D64–D69. 2013.
View Article : Google Scholar : PubMed/NCBI
|
|
22
|
Rozen S and Skaletsky H: Primer3 on the
WWW for general users and for biologist programmers. Methods Mol
Biol. 132:365–386. 2000.PubMed/NCBI
|
|
23
|
Ye J, Coulouris G, Zaretskaya I,
Cutcutache I, Rozen S and Madden TL: Primer-BLAST: a tool to design
target-specific primers for polymerase chain reaction. BMC
Bioinformatics. 13:1342012. View Article : Google Scholar : PubMed/NCBI
|
|
24
|
National Institues of Health (NIH).
Database of Single Nucleotide Polymorphisms (dbSNP). NIH; Bethseda,
MD: http://www.ncbi.nlm.nih.gov/snp.
Accessed May, 2013
|
|
25
|
Flicek P, Ahmed I, Amode MR, et al:
Ensembl 2013. Nucleic Acids Res. 41:D48–D55. 2013. View Article : Google Scholar : PubMed/NCBI
|
|
26
|
Altschul SF, Gish W, Miller W, Myers EW
and Lipman DJ: Basic local alignment search tool. J Mol Biol.
215:403–410. 1990. View Article : Google Scholar
|
|
27
|
Liu K and Muse SV: PowerMarker: an
integrated analysis environment for genetic marker analysis.
Bioinformatics. 21:2128–2129. 2005. View Article : Google Scholar : PubMed/NCBI
|
|
28
|
Holleboom AG, Kuivenhoven JA, Peelman F,
et al: High prevalence of mutations in LCAT in patients with low
HDL cholesterol levels in The Netherlands: identification and
characterization of eight novel mutations. Hum Mutat. 32:1290–1298.
2011. View Article : Google Scholar : PubMed/NCBI
|
|
29
|
Stenson PD, Ball E, Howells K, Phillips A,
Mort M and Cooper DN: Human Gene Mutation Database: towards a
comprehensive central mutation database. J Med Genet. 45:124–126.
2008. View Article : Google Scholar : PubMed/NCBI
|
|
30
|
Forbes SA, Bindal N, Bamford S, et al:
COSMIC: mining complete cancer genomes in the Catalogue of Somatic
Mutations in Cancer. Nucleic Acids Res. 39:D945–D950. 2011.
View Article : Google Scholar : PubMed/NCBI
|
|
31
|
Sim NL, Kumar P, Hu J, Henikoff S,
Schneider G and Ng PC: SIFT web server: predicting effects of amino
acid substitutions on proteins. Nucleic Acids Res. 40:W452–W457.
2012. View Article : Google Scholar : PubMed/NCBI
|
|
32
|
Adzhubei IA, Schmidt S, Peshkin L, et al:
A method and server for predicting damaging missense mutations. Nat
Methods. 7:248–249. 2010. View Article : Google Scholar : PubMed/NCBI
|
|
33
|
Willer CJ, Sanna S, Jackson AU, et al:
Newly identified loci that influence lipid concentrations and risk
of coronary artery disease. Nat Genet. 40:161–169. 2008. View Article : Google Scholar : PubMed/NCBI
|
|
34
|
Aulchenko YS, Ripatti S, Lindqvist I, et
al; ENGAGE consortium. Loci influencing lipid levels and coronary
heart disease risk in 16 European population cohorts. Nat Genet.
41:47–55. 2009. View
Article : Google Scholar : PubMed/NCBI
|
|
35
|
Kathiresan S, Willer CJ, Peloso GM, et al:
Common variants at 30 loci contribute to polygenic dyslipidemia.
Nat Genet. 41:56–65. 2009. View
Article : Google Scholar : PubMed/NCBI
|
|
36
|
Khor CC and Goh DL: Strategies for
identifying the genetic basis of dyslipidemia: genome-wide
association studies vs. the resequencing of extremes. Curr Opin
Lipidol. 21:123–127. 2010. View Article : Google Scholar : PubMed/NCBI
|
|
37
|
Cohen JC, Kiss RS, Pertsemlidis A, Marcel
YL, McPherson R and Hobbs HH: Multiple rare alleles contribute to
low plasma levels of HDL cholesterol. Science. 305:869–872. 2004.
View Article : Google Scholar : PubMed/NCBI
|
|
38
|
Kathiresan S, Melander O, Guiducci C, et
al: Six new loci associated with blood low-density lipoprotein
cholesterol, high-density lipoprotein cholesterol or triglycerides
in humans. Nat Genet. 40:189–197. 2008. View Article : Google Scholar : PubMed/NCBI
|
|
39
|
Iyengar SK and Elston RC: The genetic
basis of complex traits: rare variants or ‘common gene, common
disease’? Methods Mol Biol. 376:71–84. 2007.
|
|
40
|
Moriyama K, Sasaki J, Arakawa F, et al:
Two novel point mutations in the lecithin:cholesterol
acyltransferase (LCAT) gene resulting in LCAT deficiency: LCAT
(G873 deletion) and LCAT (Gly344→Ser). J Lipid Res. 36:2329–2343.
1995.PubMed/NCBI
|
|
41
|
Tietjen I, Hovingh GK, Singaraja R, et al:
Increased risk of coronary artery disease in Caucasians with
extremely low HDL cholesterol due to mutations in ABCA1, APOA1, and
LCAT. Biochim Biophys Acta. 1821:416–424. 2012. View Article : Google Scholar : PubMed/NCBI
|