Introduction
There are two primary risk factors for type 2
diabetes mellitus (T2DM): Genetic predisposition and environmental
factors, in which the latter has a more important role. After a
period of growth inhibition, the linear growth rate usually exceeds
the normal range; this phenomenon, known as catch-up growth, was
first described >40 years ago by Prader et al (1). Catch-up growth has become the
predominant cause for the accelerated spread of T2DM in developing
countries (2), such as China, in
which rapid economical growth lead to an increase in the prevalence
of T2DM in populations who were subjected to nutritional deficiency
at a young age. A previous study demonstrated that low birth weight
is an independent risk factor for type 2 diabetes in China
(3). Further studies demonstrated
that catch-up growth following intra-uterine growth retardation in
rats (IUGR rats) resulted in increased liver peroxisome
proliferator-activated receptor (PPAR)-γ coactivator (PGC)-1
promoter histone 3/lysine 9 acetylation levels (4,5), and
increased mRNA and protein expression levels of PGC-1α and PGC-1,
resulting in increased hepatic glucose output (6). In addition to causing the epigenetic
histone deacetylation changes in IUGR rats, sirtuin 1 (SIRT1)
deacetylation also results in the de-acetylation of PGC-1α/PPARα
and nuclear factor (NF)-κB (7), as
well as other non-histone molecules, thereby improving liver
glucose levels, lipid metabolism and inflammation, and regulating
insulin secretion. Epidemiological studies regarding catch-up
growth are difficult to perform due to the absence of ideal
catch-up growth research platforms and data. The high fat diet
weight-matching method following a long period or calorie
restriction may better reflect the characteristics of a catch-up
growth population (8,9). Therefore, the study of the
association between PGC-1α/PPARα acetylation levels, inflammation,
steatosis and hepatic insulin resistance in a liver model may
further elucidate the high incidence of T2DM in developing
countries. An increase in liver SIRT1 deacetylation levels results
in abnormal epigenetic changes, improved liver lipid metabolism and
reduced inflammation (7), as well
as facilitating early prevention of T2DM. Astragalus exerts
antioxidative effects (10) and
increases neural activation in two important central
glucose-sensing regions of the brain (the paraventricular
hypothalamus and the nucleus tractus solitarius) thereby augmenting
the counterregulatory response to hypoglycemia (11). The present study aimed to
investigate the effects of astragalus on the suppression of
hypoglycemia via the liver, as well as the underlying mechanism of
these effects. APS is an active component of astragalus, which
prevents the development of diabetic cardiomyopathy in diabetic
rats via the PPARα-mediated regulatory signaling pathway (12). The association between APS and
hepatocyte SIRT1-PGC-1α/PPARα-mediated regulation of hepatic
glucose and lipid metabolism, as well as the therapeutic potential
of APS in T2DM merits further research.
Materials and methods
Ethical approval
All experimental procedures were approved by the
Ethics of Animal Experiments Committee of the Tongji University
School of Medicine (Shanghai, China; approval no. TJMED-012-006).
The present study was conducted according to internationally
recognized guidelines on animal welfare, as well as the regulations
regarding animal welfare in Shanghai, China, and was conducted in
accordance with the guidelines of the Chinese Council on Animal
Care.
Animals
A total of 28 six-week-old male Sprague-Dawley rats
(Center of Experimental Animals, Tongji University School of
Medicine, Shanghai, China), weighing 140–160 g, were housed in
wire-bottomed cages in 22±1°C with a 12-h light/dark cycle. The
rats were raised on a commercial pellet diet (Center of
Experimental Animals) consisting of 22% protein, 66% carbohydrates
and 12% fat, and were provided with access to tap water ad
libitum. The rats were randomly divided into three groups: A
normal diet control group (NC; n=10), a catch-up growth APS-treated
group (APS-G; n=9) and a catch-up growth model group (CUGFR; n=9).
The rats in the NC group were raised on an ad libitum pellet
diet for 8 weeks, and the rats in the CUGFR group were subjected to
a dietary restriction for 4 weeks (60% of the diet intake of the NC
group) following which they were fed with a high fat diet (42%
calories from fat), which was provided ad libitum. The rats
in the APS-G group were orally treated with 700 mg/kg APS (content
of effective components, 69%), purchased from the Beijing Centre
Biology Co. Ltd., (Beijing, China), for 8 weeks. The other groups
were administrated with saline irrigation at the same dosage. The
body weight of each rat was measured every 7 days.
Animal treatment
The rats were subjected to fasting 15 h prior to
intraperitoneal injection with 20% urethane anesthetic (5 ml/kg;
Shanghai Hengyuan Biological Technology Co. Ltd, Shanghai, China).
The abdominal cavities of the rats were surgically opened following
local disinfection. Blood samples (8–10 ml) were obtained from the
abdominal aorta, maintained at room temperature for 10 min prior to
centrifugation in an Eppendorf (EP) tube containing EDTA (1 mg/ml)
and then centrifuged for 20 min at 2000 ×g. The supernatant was
placed into a sterile EP tube and preserved at −20°C. The blood
samples were used to determine the serum FGF21 levels using an
ELISA kit (BioVendor, Asheville, NC, USA). Liver function, blood
lipid levels and glycated hemoglobin (HBA1C) levels were also
analyzed. Plasma fatty acid, total cholesterol (TC) and
triglyceride levels were determined using a NEFAC kit (Wako Pure
Chemical Industries, Ltd., Osaka, Japan), which measures oxidase
and peroxidase activity (Trinder reaction). Low-density lipoprotein
(LDL) and high-density lipoprotein (HDL) were measured using an
immunoassay kit (Daiichi Pure Chemicals Co., Ltd., Tokyo, Japan),
alanine aminotransferase (ALT) was determined using an IFCC kit
(Roche Diagnostics, Basel, Switzerland). HBA1C levels were
determined by immunoturbidimetry (cat. no. D-68305; Roche
Diagnostics). The rats were fasted for 15 h prior to
intraperitoneal injection of 20% urethane anesthetic (5 ml/kg). The
abdominal cavities of the rats were surgically opened by pattern
clamps and ophthalmology scissors (Shanghai Kang Chau Medical
Instrument Co., Ltd, Shanghai, China) followed by local ethanol
disinfection (Sinopharm Co., Ltd., Shanghai, China). Subsequently,
blood was drawn from the abdominal aorta and anti-coagulated with
EDTA (1 mg/ml). Plasma was obtained by centrifuging the blood at
2000 ×g at 4°C for 20 min and frozen at 20°C for further analyses.
The liver, epididymal adipose and perirenal fat tissues were
separated and weighed under sterile conditions after the rats were
sacrificed by decapitation. The liver tissue samples were
immediately dissected, fixed in 2% glutaraldehyde (Sinopharm Co.,
Ltd) and 10% formalin or frozen in liquid nitrogen until further
analysis. The liver index (the ratio of liver weight to total body
weight of the rats) and internal body fat ratio (epididymal fat
weight plus perirenal fat weight) were calculated.
Oral glucose tolerance test (OGTT) and
lipid parameters
An OGTT test was conducted as follows: A
total of 2 g glucose/100 g body weight was orally administered
following overnight fasting for 15 h. Blood samples were collected
from the rat tail venous plexus 0, 15, 30, 60 and 120 min after
glucose treatment, in order to measure the blood glucose and plasma
insulin concentration levels. Blood glucose was measured by a
glucometer (Roche Accu-Chek Performa; Roche Diagnostics). The blood
was then centrifuged and placed into an EP tube containing 1 mg/ml
EDTA (Shanghai Zurui Biological Technology Co., Ltd, Shanghai,
China), in order to measure the blood insulin levels using an ELISA
kit (EMD Millipore, Billerica, MA, USA). The plasma was then either
immediately used for experimentation or frozen at −20°C for further
analyses.
Western blot analysis
The frozen rat liver tissue samples were homogenized
three times, for 15 sec, in ice-cold radioimmunoprecipitation assay
homogenization buffer (Merck Chemical Technology Co. Ltd, Shanghai,
China) containing Protease Inhibitor Cocktail Set III (cat. no.
539134; Invitrogen Life Technologies, Inc., Carlsbad, CA, USA) and
Phosphatase Inhibitor Cocktail Set V (cat. no. 524629; Invitrogen
Life Technologies, Inc.) using a PRO 200 homogenizer (PRO
Scientific, Inc., Oxford, CT, USA). The homogenate was centrifuged
at 4°C for 30 min at 12,000 × g and the supernatant was used as the
total protein concentration. The total protein concentration then
underwent protein quantification according to the Bradford method
(Protein Assay kit II; cat no. 5000002; Bio-Rad Laboratories, Inc.,
Hercules, CA, USA) according to the manufacturer's instructions.
Protein assay dye reagent concentrate (Bio-Rad) and BSA (Thermo
Fisher Scientific, Waltham, MA, USA) were used as the protein
standard. Protein (40 µg) was separated by 4–12%
polyacrylamide gels [depending on the protein of interest; NuPAGE
4–12% Bis-Tris Gel 1.0 mmx12 well; MOPS SDS running buffer (20X);
both from Invitrogen Life Technologies, Inc.] and transferred onto
nitrocellulose membranes (iBlot transfer stacks nitrocellulose,
regular; Invitrogen Life Technologies) using a semidry transfer
protocol. Precision Plus Protein Dual Color standards (Bio-Rad) and
Novex® Sharp Pre-stained Protein standard (Invitrogen)
were used as the protein ladder. Following membrane blocking with
Odyssey Blocking Buffer (LI-COR Biotechnology, Lincoln, NE, USA),
the membranes were incubated with the appropriate primary antibody:
Rabbit anti-NF-κB p65 polyclonal immunoglobulin (Ig)G (1:200; cat.
no. sc-372; Santa Cruz Biotechnology, Inc., Dallas, TX, USA), mouse
anti-SIRT1 monoclonal antibody (1:2,000; cat. no. ab110304; Abcam,
Cambridge, UK), and rabbit anti-human FGF21 polyclonal antibody
(0.2–1 µg/ml; cat. no. LS-B5864; 1:500 dilution; LifeSpan
BioSciences, Inc., Seattle, WA, USA) antibodies, diluted with
fluorescently-labeled secondary antibody blocking buffer
[IRDye® 800CW goat anti-mouse IgG (H+L); 1:10,000; cat.
no. 925-32210; or IRDye® 800CW goat anti-rabbit IgG
(H+L); 1:10,000; cat. no. 925-32211; both from LI-COR
Biotechnology). The membranes were then washed twice with
phosphate-buffered saline (PBS; Decent Biotech, Göttingen, Germany)
with 0.1% Tween 20 (Sigma, Santa Clara, CA, USA) to remove all
residual antibodies, and scanned using an Odyssey Infrared Imaging
system with IR fluorescence scan Odyssey 2.1 software (LI-COR
Biotechnology). Quantitative values were obtained from the
densitometric measurements of the western blotting bands using
Image Quant software (Tool, 1D gel analysis; GE Healthcare
Bio-Sciences, Pittsburgh, PA, USA).
Reverse transcription-quantitative
polymerase chain reaction (RT-qPCR)
The liver mRNA expression levels of PGC-1α and PPARα
were assessed by RT-qPCR. The total RNA was extracted using TRIzol
reagent (Invitrogen Life Technologies, Inc.; cat. no. 47122). cDNA
was reverse-transcribed from 2 µg DNase-treated total RNA
using an iScript cDNA Synthesis kit (Bio-Rad Laboratories, Inc.;
cat no. 170-8891) according to the manufacturer's instructions. The
following primer sequences, obtained from Invitrogen Life
Technologies, were used: Forward, 5′-CGCACAACTCAGCAAGTCCTC-3′ and
reverse, 5′-CCTTGCTGGCCTCCAAAGTCTC-3′ for rat PGC-1α; and forward,
5′-GTGGCTGCTATAATTTGCTGTG-3′ and reverse,
5′-GAAGGTGTCATCTGGATGGGT-3′ for PPARα. The cDNA (diluted to 1:20)
served as a template for the RT-qPCR; 100 µM primer solution
was diluted to 5 pmol/µl, and qPCR was performed using SYBR
Premix ExTaq (Takara Biotechnology Co., Ltd., Dalian, China). The
PCR mixture contained 10.5 µl SYBR Premix ExTaq, 0.5
µl of each primer, 1 µl cDNA and 7.5 µl
deionized water. PCR was performed with thermocycling conditions of
95°C for 30 sec, 40 cycles at 95°C for 5 sec, and 60°C for 30 sec
in a DNA cycler apparatus (ABI Prism 7900HT; Applied Biosystems,
Thermo Fisher Scientific). Genes were quantified using the ΔΔCt
method with GAPHD as a housekeeping gene. For each set of
reactions, the samples were analyzed in triplicate.
Immunohistochemistry and morphometry
Following sacrifice, the livers of the rats were
excised, and the liver wet weights were measured. A section of
hepatic tissue (~3×3×10 mm) was removed via a horizontal incision 1
cm away from the edge of the right lobe. The hepatic tissue samples
were fixed in 10% formalin, dehydrated with a graded series of
ethanol, ethanol uranyl acetate and acetone (all from Sinopharm
Co., Ltd.), and stained with hematoxylin and eosin (H&E; n=3
rats/group). Observation and image capture were conducted using a
CKX31 light microscope (Olympus Corporation, Tokyo, Japan).
Transmission electron microscopy
(TEM)
Three 1-mm3 liver sections were fixed
with 2.5% glutaraldehyde and stored at 4°C. The samples were
subsequently analyzed at the Electron Microscopy Laboratory at the
Shanghai University of Traditional Chinese Medicine (Shanghai,
China). Following fixing, samples were rinsed with 0.1 M phosphate
buffer and treated with 1% OsO4 solution (Alfa Aesar
Chemical Co., Ltd., Shanghai, China) for 3 h, dehydrated with a
graded series of ethanol (30, 50, 80 and 90%) and propylene oxide,
and embedded in epoxy resin (Shanghai Resin Factory Co., Ltd,
Shanghai, China). Semi-thin (thickness, 500 nm) hepatic sections
were stained with 1% toluidine blue (Sinopharm Co., Ltd) for
histopathology. Suitable areas of ultrathin (thickness, 80–90 nm)
hepatic sections were selected for ultrastructural analysis. These
were sectioned using a diamond knife (diamond knife(cat no. 706602;
Leica Microsystems, Wetzlar, Germany), mounted on a copper grid
(Shanghai Chemical Experiment Audio Supplies Company Ltd, Shanghai,
China), and stained with uranyl acetate and lead citrate. The
sections were analyzed using a Tecnai-12 Bio T min TEM (Philips,
Amsterdam, Netherlands), and observation and image capture were
performed at an acceleration voltage of 80 kV.
Statistical analysis
Statistical differences between the groups were
evaluated using Student' unpaired t-test. The homeostasis model
assessment of insulin resistance (HOMA-IR) was used, where: HOMA-IR
= [fasting plasma glucose (mmol/l) × fasting plasma insulin
(mU/l)]/22.5. The data were presented as the mean ± standard
deviation. Data analyses were performed using SPSS 18.0 (SPSS,
Inc., Chicago, IL, USA). P<0.05 was considered to indicate a
statistically significant difference.
Results
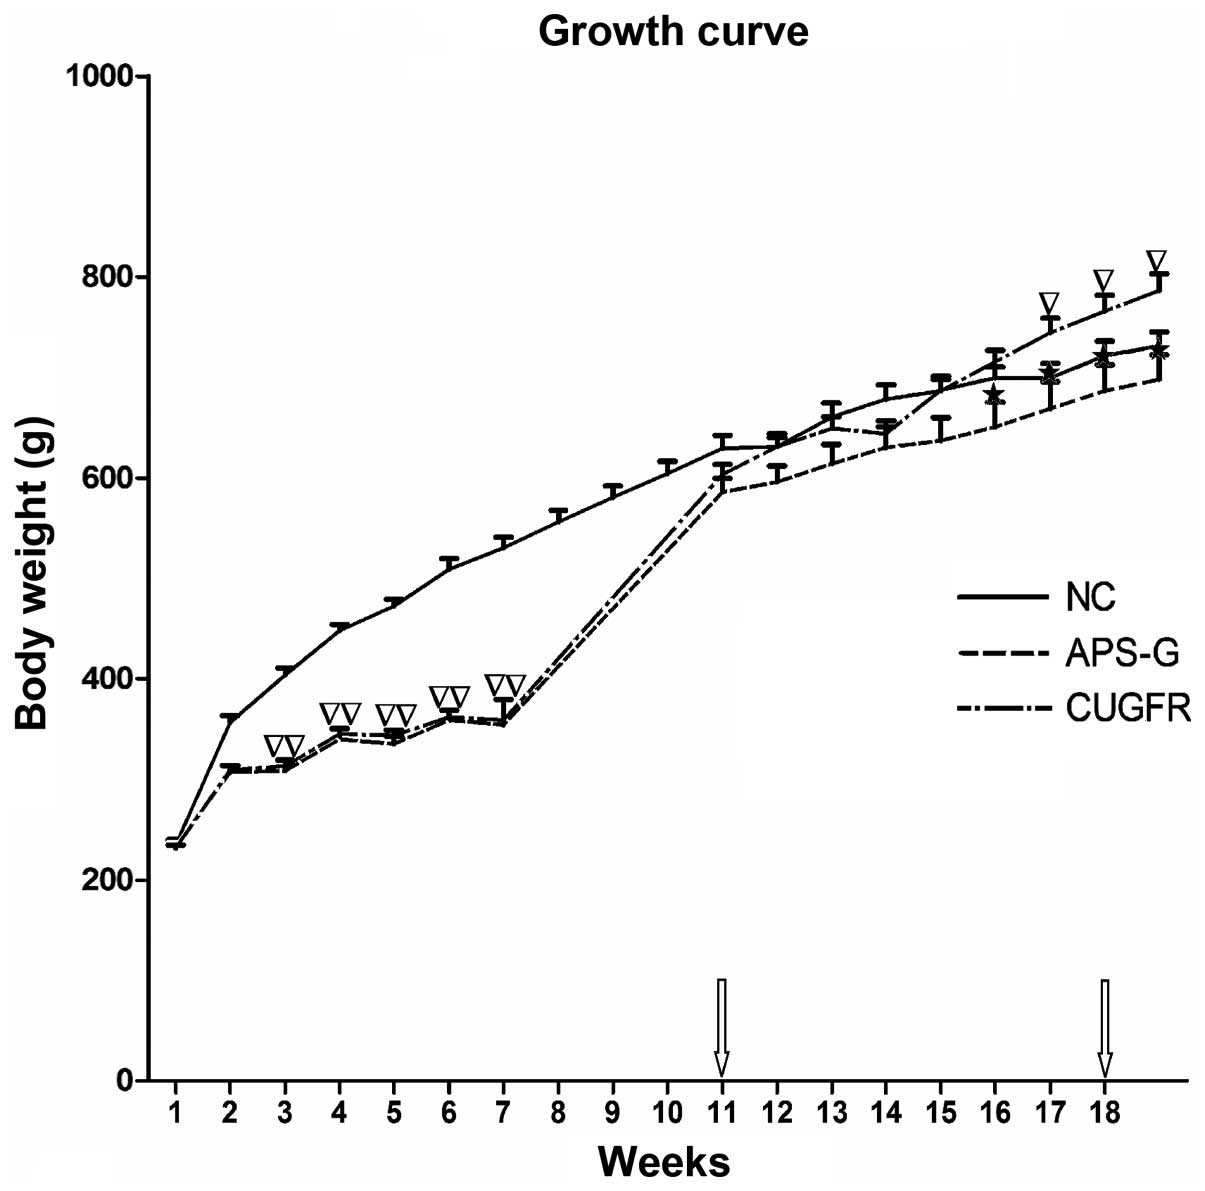
Growth of the rats
The growth curve obtained from weighing the rats
weekly demonstrated that their growth was arrested during the
period of 60% food restriction, and rapidly increased following
re-feeding on a high fat diet for 1 week; however, the rat body
weights of the CUGFR group increased less compared with the NC
group. The growth curve obtained from the rat weights demonstrated
that the APS-G group exhibited a significant trend towards weight
loss, as compared with the CUGFR group. Conversely, the rats in the
CUGFR group significantly gained weight compared to the rats in the
NC group (Fig. 1).
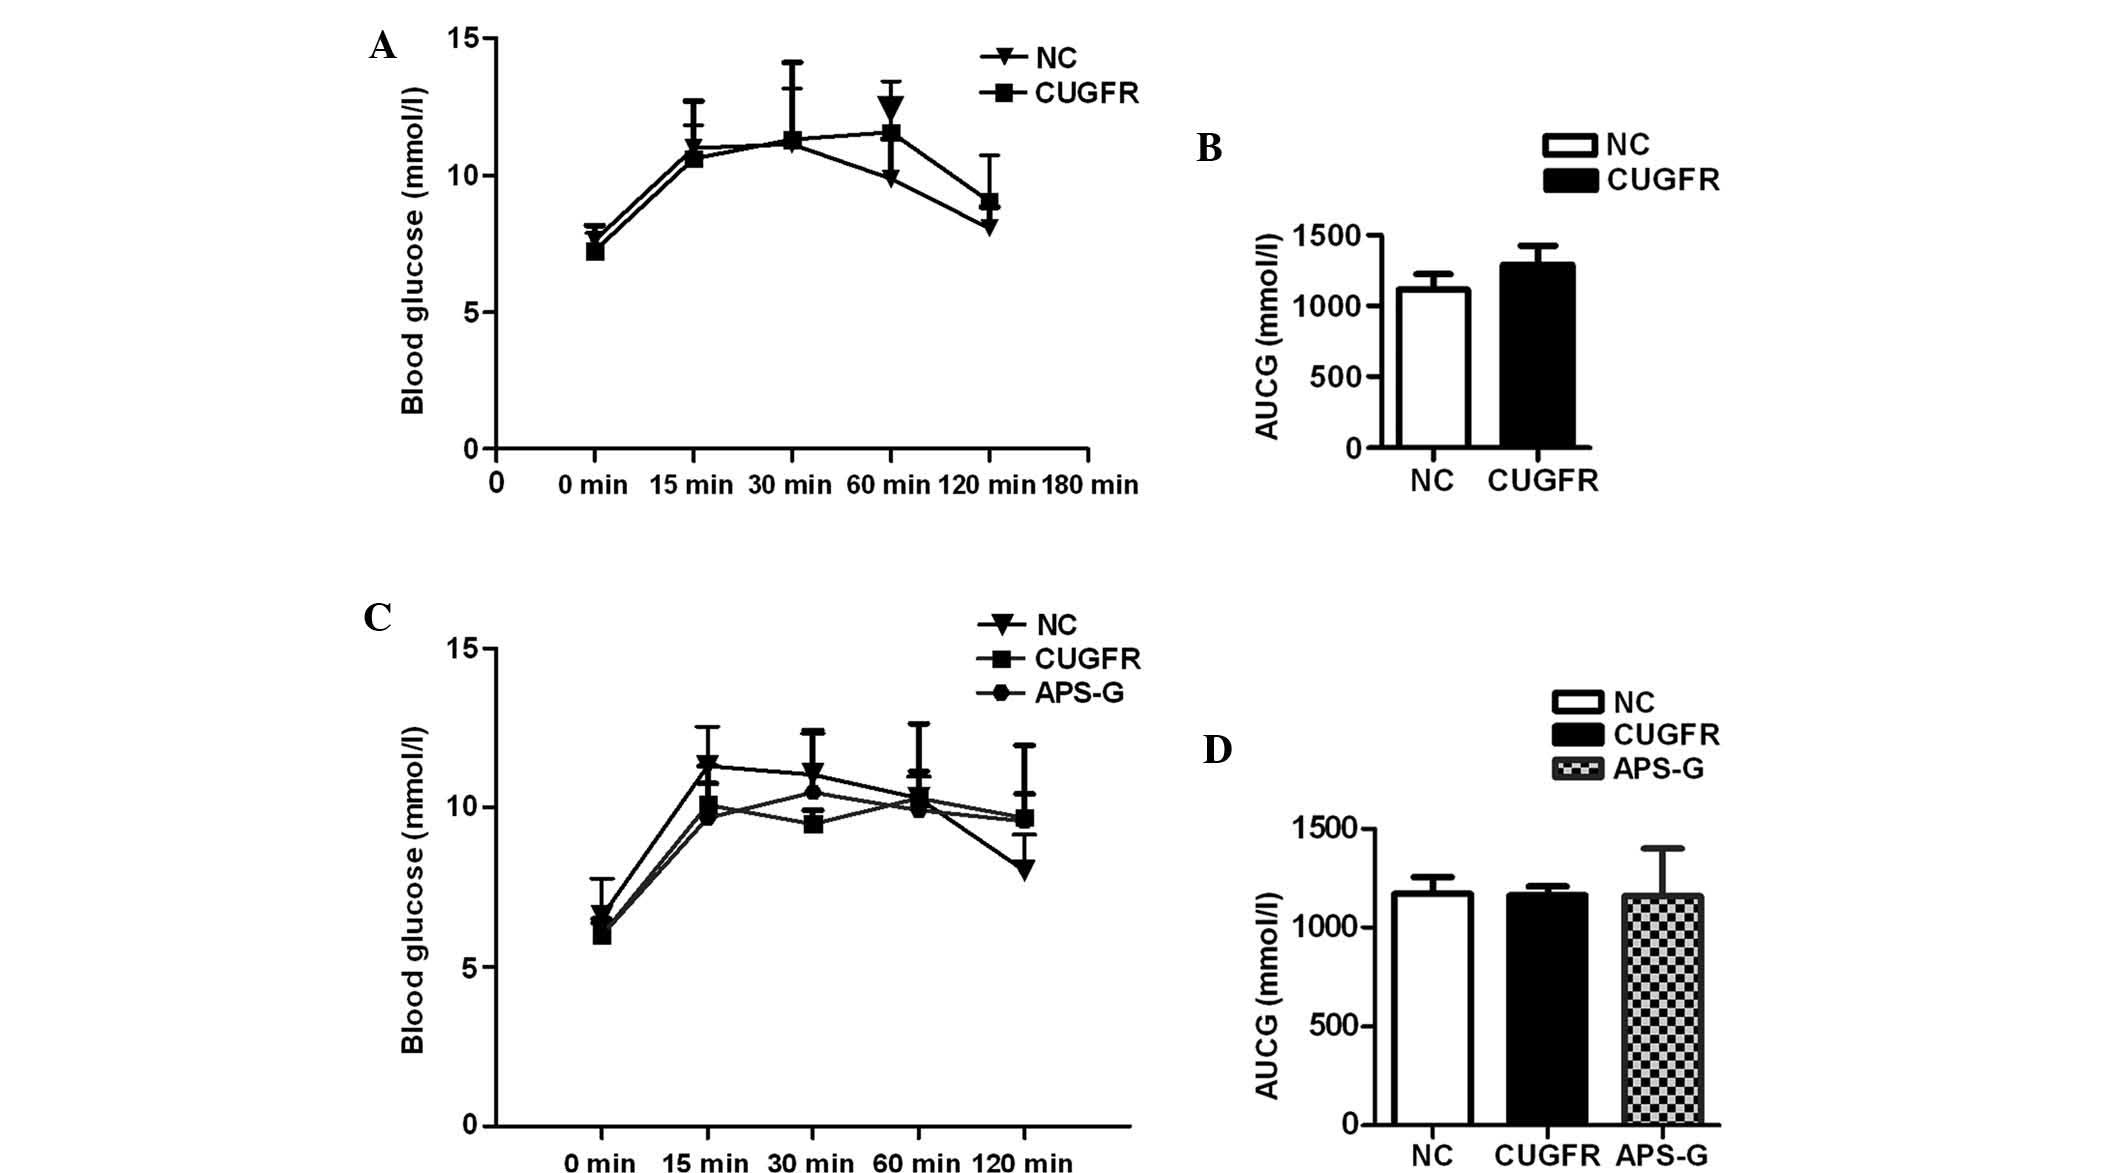
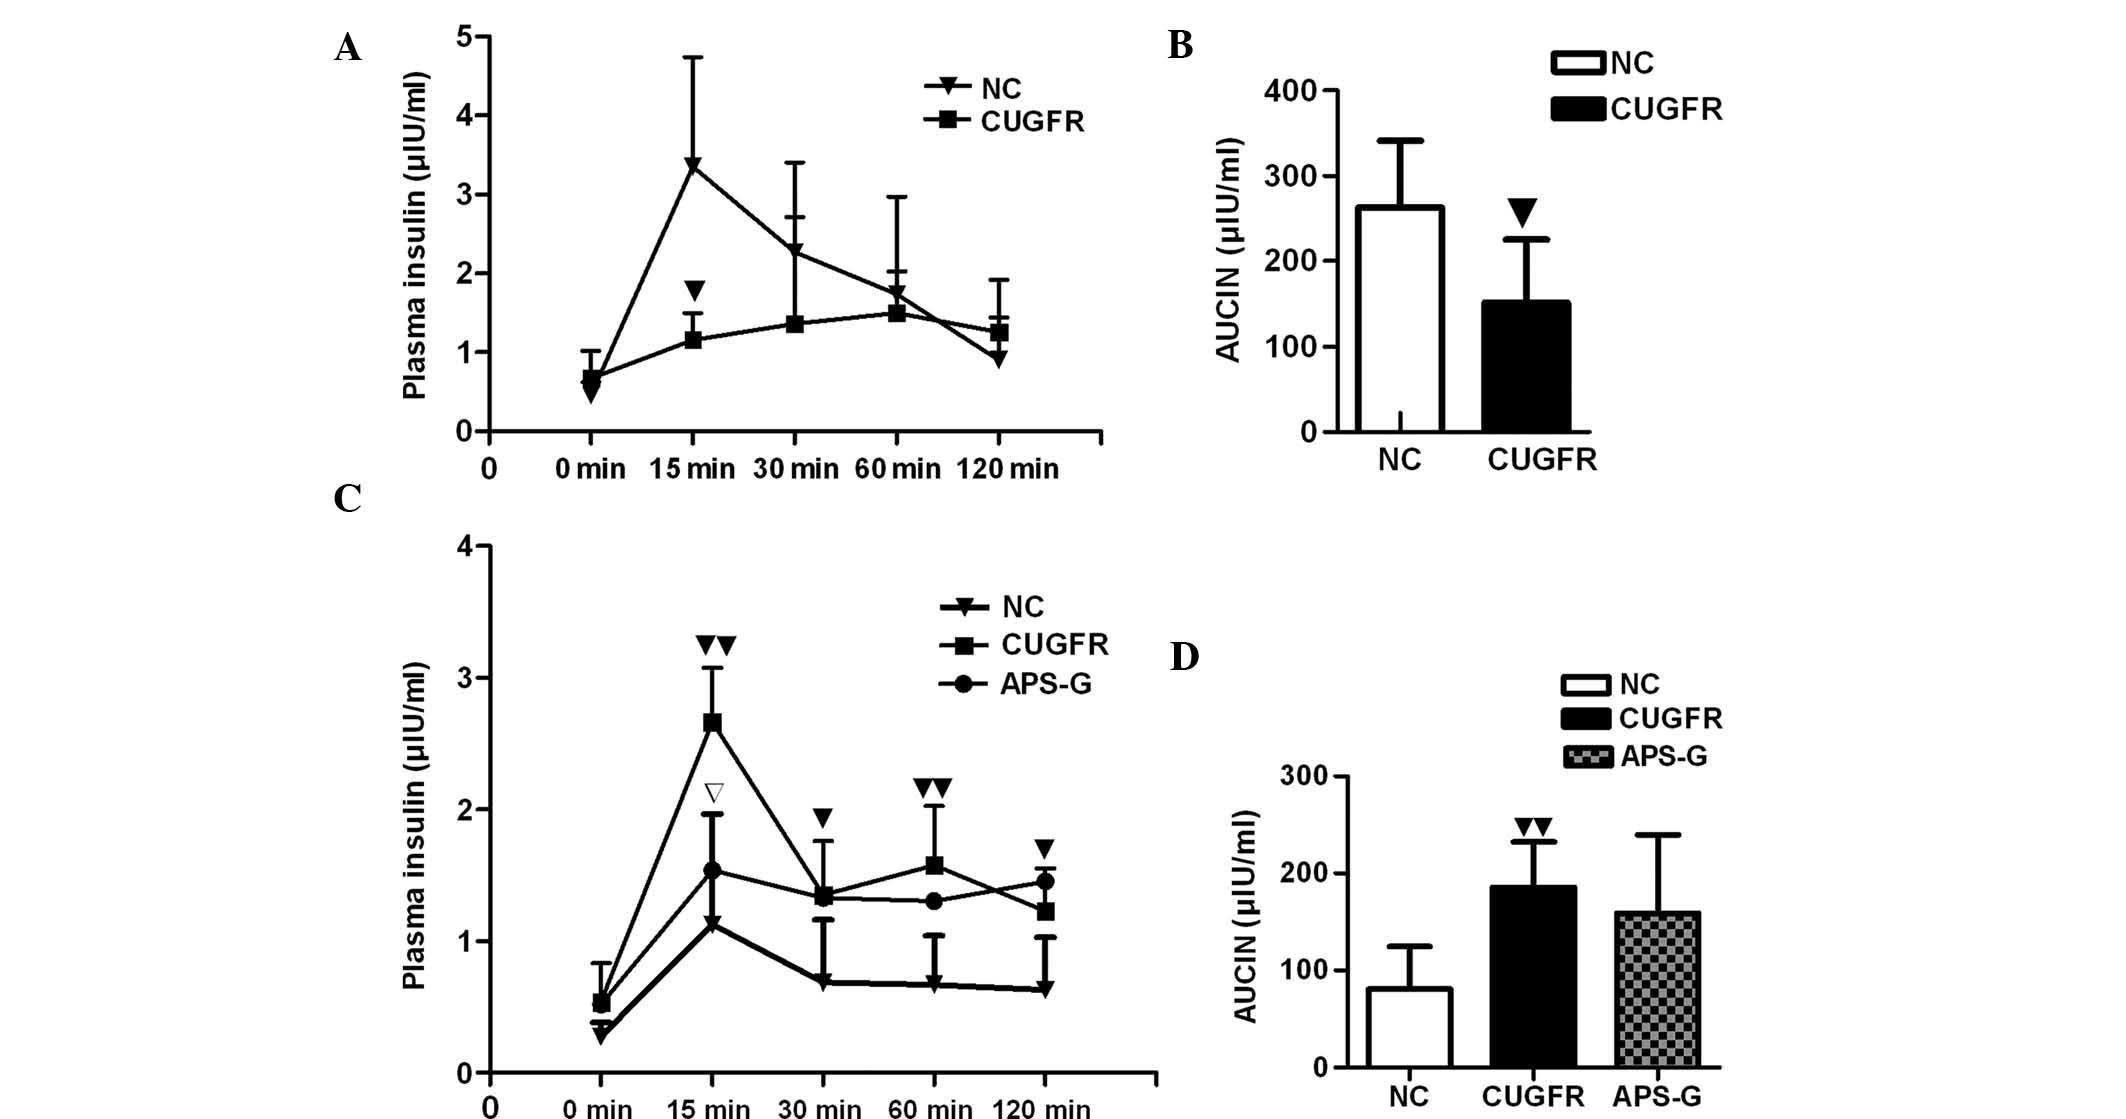
Effects of APS on insulin sensitivity,
serum lipid, serum FGF21 and alanine aminotransferase (ALT) levels
in high fat diet-fed rats following catch-up growth
Prior to treatment with APS, glucose tolerance
curves demonstrated marginally lower (although not statistically
significant) serum glucose levels in the CUGFR group rats at 0, 15
and 30 min compared with the NC group. At 60 min, following glucose
gavage, blood glucose levels were significantly higher than the NC
group; these glucose levels failed to return to pre-meal state
(Fig. 2A). The insulin curve
demonstrated significantly lower insulin levels at 15 min in the
CUGFR group compared with the NC group (P<0.05) and that insulin
increase was delayed (Fig. 3A).
The insulin levels of the APS-G group significantly decreased at 15
min, and the area under the curve of glucose increased, although no
statistically significant difference was observed (Fig. 2B, and Fig. 3A and B).
Following treatment with APS, no statistically
significant difference was observed between the blood glucose
levels of all three groups, and the blood glucose levels of the
APS-G rats did not return to their pre-meal state (Fig. 2C and D). The insulin levels of the
CUGFR group significantly increased, when compared with the NC
group (P<0.01), and treatment with APS moderately reduced this
increase, although the results were not statistically significant
(Fig. 3D). After 15 min the levels
of insulin were significantly lower in the APS-G group, when
compared with the CUGFR group, and no significant decline in these
insulin levels occurred throughout the experiment (Fig. 3C). The HOMA-IR and fasting insulin
index were significantly higher in the CUGFR group, as compared
with the NC group, and following treatment with APS, the two
decreased significantly (Table
I).
 | Table ISerum protein levels and HOMA-IR
following treatment with APS. |
Table I
Serum protein levels and HOMA-IR
following treatment with APS.
| Item | NC | CUGFR | APS-G | P1 | P2 |
|---|
| TG, mmol/l | 0.76±0.13 | 0.81±0.27 | 0.70±0.33 | 0.504 | 0.521 |
| TC, mmol/l | 1.464±0.41 | 1.545±0.29 | 1.756±0.46 | 0.787 | 0.345 |
| LDL, mmol/l | 0.193±0.12 | 0.5±0.20a | 0.728±0.28 | 0.0016 | 0.185 |
| HDL, mmol/l | 1.133±0.40 | 0.925±0.10 | 0.876±0.20 | 0.245 | 0.59 |
| FFA, mmol/l | 0.466±0.11 | 0.74±0.08b | 0.449±0.14 | 0.038 | 0.126 |
| ALT, U/l | 37.75±2.32 | 58±26.10b | 63.75±31.76 | 0.041 | 0.419 |
| FBG, mmol/l | 6.58±1.19 | 6.0±0.37 | 6.0±0.51 | 0.279 | 1.0 |
| Fins,
µIU/ml | 5.82±2.24 | 12.1±5.49b | 7.11±2.09 | 0.024 | 0.089 |
| HOMA-IR | 1.43±0.67 | 3.02±0.87b | 1.83±0.42c | 0.026 | 0.049 |
| HBA1C, % | 3.85±0.11 | 3.86±0.10 | 3.87±0.14 | 0.85 | 0.88 |
During early catch-up growth, the levels of
thyroglobulin (TG), TC, LDL and HBA1C were significantly higher in
the CUGFR group as compared with those in the NC group, while
levels of HDL were significantly lower than those in the NC group.
The levels of free fatty acid (FFA) and ALT in the GUGFR group were
not significantly different from those in the NC group. At the late
stage of catch-up growth, the levels of LDL, FFA and ALT in the
CUGFR group were markedly increased compared with those in the NC
group (Table II). No
statistically significant increase was observed in the levels of
serum lipid and HBA1C following treatment with APS (Table I).
| Table IIHBA1C, serum lipid and ALT
levels. |
Table II
HBA1C, serum lipid and ALT
levels.
| Item | NC | CUGFR | P-value |
|---|
| TG, mM/l | 1.0±0.22 | 1.49±0.45b | 0.013 |
| TC, mM/l | 2.17±0.48 | 2.77±0.71b | 0.05 |
| LDL, mM/l | 0.44±0.21 | 1.02±0.43a | 0.002 |
| HDL, mM/l | 0.77±0.28 | 0.48±0.18b | 0.012 |
| FFA, mM/l | 1.3±0.28 | 1.63±0.95 | 0.35 |
| ALT,
µM/l | 47.±7.13 | 48.46±13.6 | 0.85 |
| HBA1C, % | 3.99±0.09 | 4.18±0.13a | 0.0039 |
Effects of APS on liver index and
visceral fat content ratio of high fat diet-fed rats following
catch-up growth
The liver index and visceral fat content ratio of
the rats were significantly higher (P<0.01 and P<0.05,
respectively) in the CUGFR group, as compared with the NC group.
Following 8 weeks of APS treatment, liver weight in the APS-G group
reduced significantly compared with the CUGFR group, however the
decrease in the liver index was not significant. Although the
visceral fat content ratio of the CUGFR group was significantly
higher than that of the NC group, treatment with APS did not
significantly affect the visceral fat content (Table III).
| Table IIILiver index and visceral fat content
ratio of the rats. |
Table III
Liver index and visceral fat content
ratio of the rats.
| Item | NC | CUGFR | APS-G | P1 | P2 |
|---|
| Weight, g | 774.5±39.2 | 786±48.3 | 697.8±67.7c | 0.101 | 0.019 |
| Liver weight,
g | 17.14±1.78 | 31.67±2.47b | 27.49±4.05c | <0.001 | 0.046 |
| Liver index | 2.31±0.25 | 4.03±0.17b | 3.94±0.41 | <0.001 | 0.629 |
| E-P-fat, g | 31.94±6.41 | 42.55±10.62a | 39.36±13.26 | 0.038 | 0.638 |
| V-fat, weight
% | 4.52±0.53 | 5.75±0.99a | 5.19±1.35 | 0.018 | 0.446 |
Effects of APS on hepatic pathology and
TEM of high fat diet-fed rats following catch-up growth
Liver H&E staining demonstrated large quantities
of lipid droplet deposition in the liver tissue samples of the
CUGFR group, as compared with the NC and APS-G groups. Following
treatment with APS, the lipid droplet deposition of the APS-G group
decreased, as compared with the CUGFR group, and the tissue samples
exhibited lipid droplet fusion (Fig.
4).
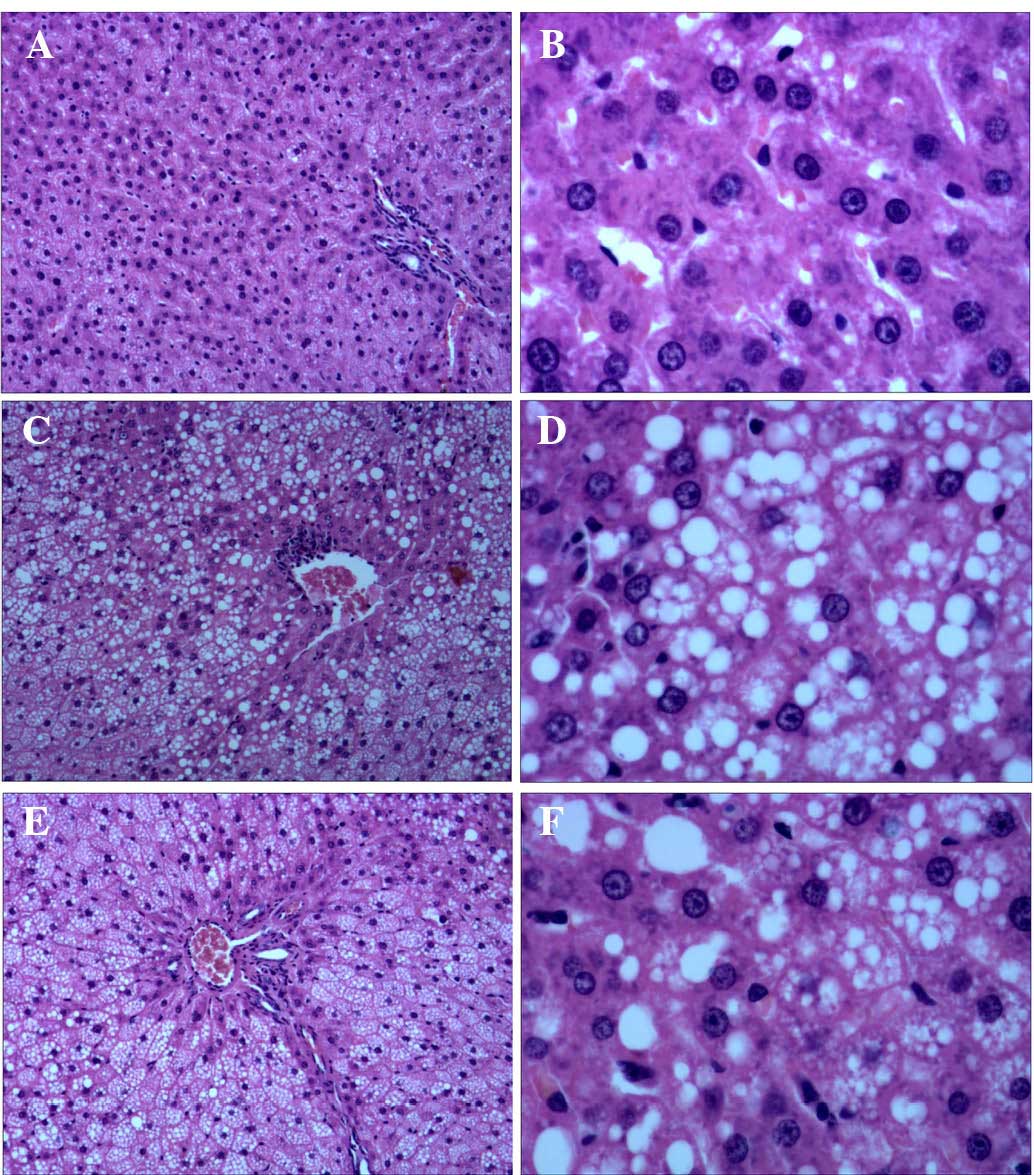 | Figure 4Representative histological
observations of hepatic cells in the (A and B) NC, (C and D) CUGFR
and (E and F) APS-G groups, as determined by hematoxylin and eosin
staining (A, C and E: Magnification, ×100; B, D and F:
Magnification, ×400). No histopathological changes were observed in
the NC group, however in the CUGFR group and the APS-G group,
cytoplasm vacuolization was observed. The CUGFR group exhibited a
large quantity of lipid droplet deposition in the liver tissue
samples, as compared with the NC and APS-G groups. The APS-G group
exhibited smaller lipid droplets, as compared with the CUGFR group.
NC, normal control group; CUGFR, catch-up growth group; APS-G,
Astragalus polysaccharide-treated group. |
TEM examination of the liver samples (Fig. 5) demonstrated that damaged
mitochondria and lipid droplets were present in the hepatocytes of
the CUGFR (Fig. 5C and D) and
APS-G groups (Fig. 5E and F). The
groups also exhibited clusters of damaged mitochondria, multi
lamellar bodies, and large lipid droplets joined to form large
lipid droplets and surrounded by autophagosomal membranes. In the
CUGFR group, numerous lipid droplets were present, including fused
lipid droplets, and the number of mitochondria and endoplasmic
reticula was decreased in the cells. In addition, the cellular
structure was severely impaired. Furthermore, the nuclear membranes
were not continuous, exhibiting visible holes.
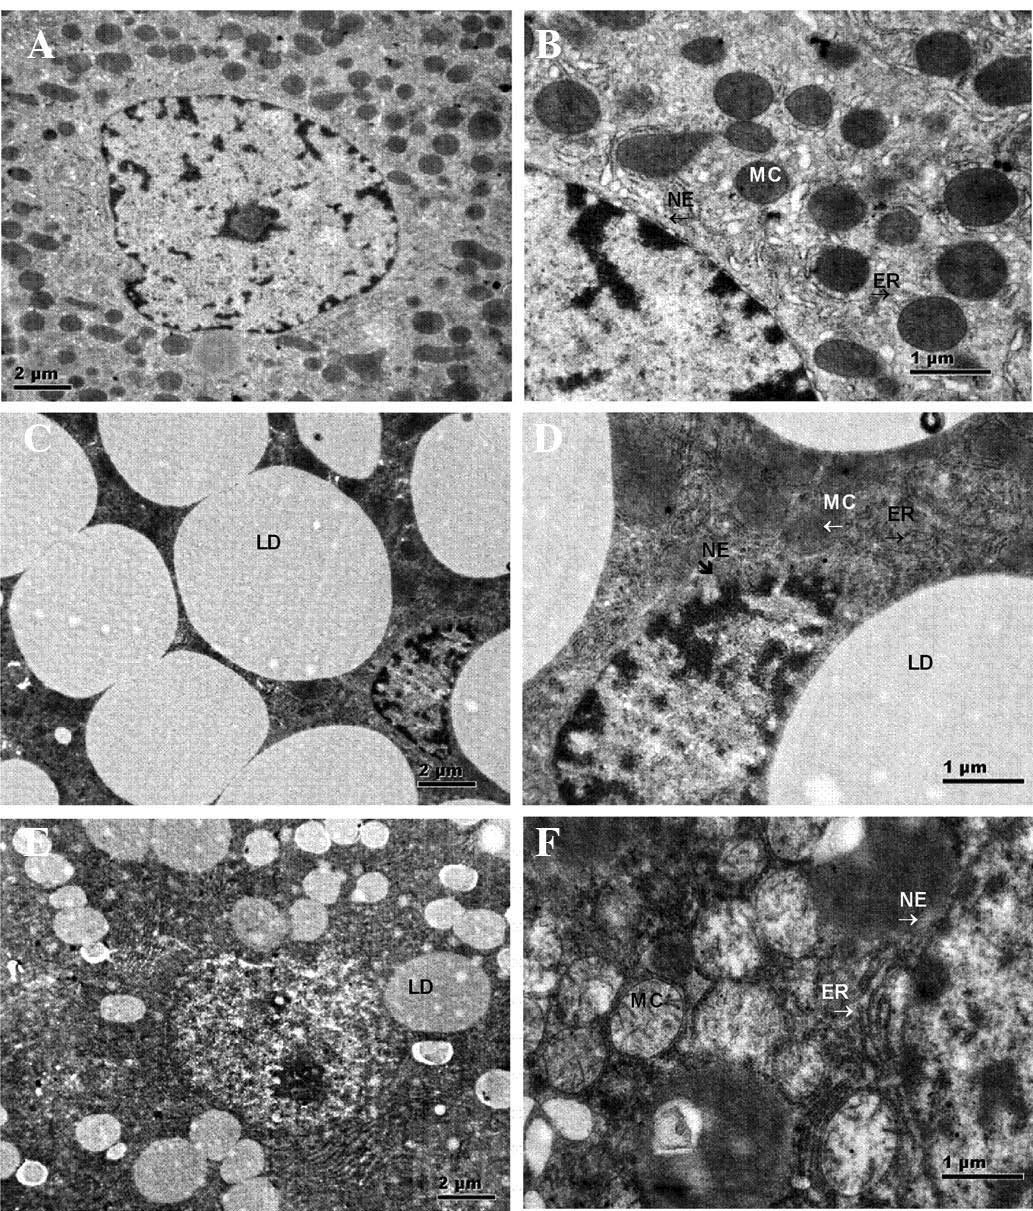 | Figure 5Representative histological
observations of hepatic cells in the (A and B) NC, (C and D) CUGFR
and (E and F) APS-G groups as determined by transmission electron
microscopy (A, C, and E: Magnification, ×11,000; scale bar=2
µm; B, D, and F: Magnification, ×14,000; scale bar=1
µm). Hepatic cells of the NC group exhibiting normal MC, ER
and NE. Hepatic cells of the CUGFR group exhibiting dilated rough
ER, swollen MC (arrow), LD fusion and incomplete NE. Hepatic cells
of the APS-G group exhibiting reduced LDs and thick continuous cell
membranes. MC, mitochondria; ER, endoplasmic reticulum; NE, nuclear
membranes; LD, lipid droplet; NC, normal control group; CUGFR,
catch-up growth group; APS-G, Astragalus polysaccharide-treated
group. |
Following treatment with APS, the number of lipid
droplets decreased in the APS-G group (Fig. 5E and F), however numerous impaired
mitochondria and endoplasmic reticula remained visible, and the
liver cells exhibited expanded endoplasmic reticula and
mitochondrial coagulation-associated degeneration. The cell
membranes were thick, but continuous (Fig. 5).
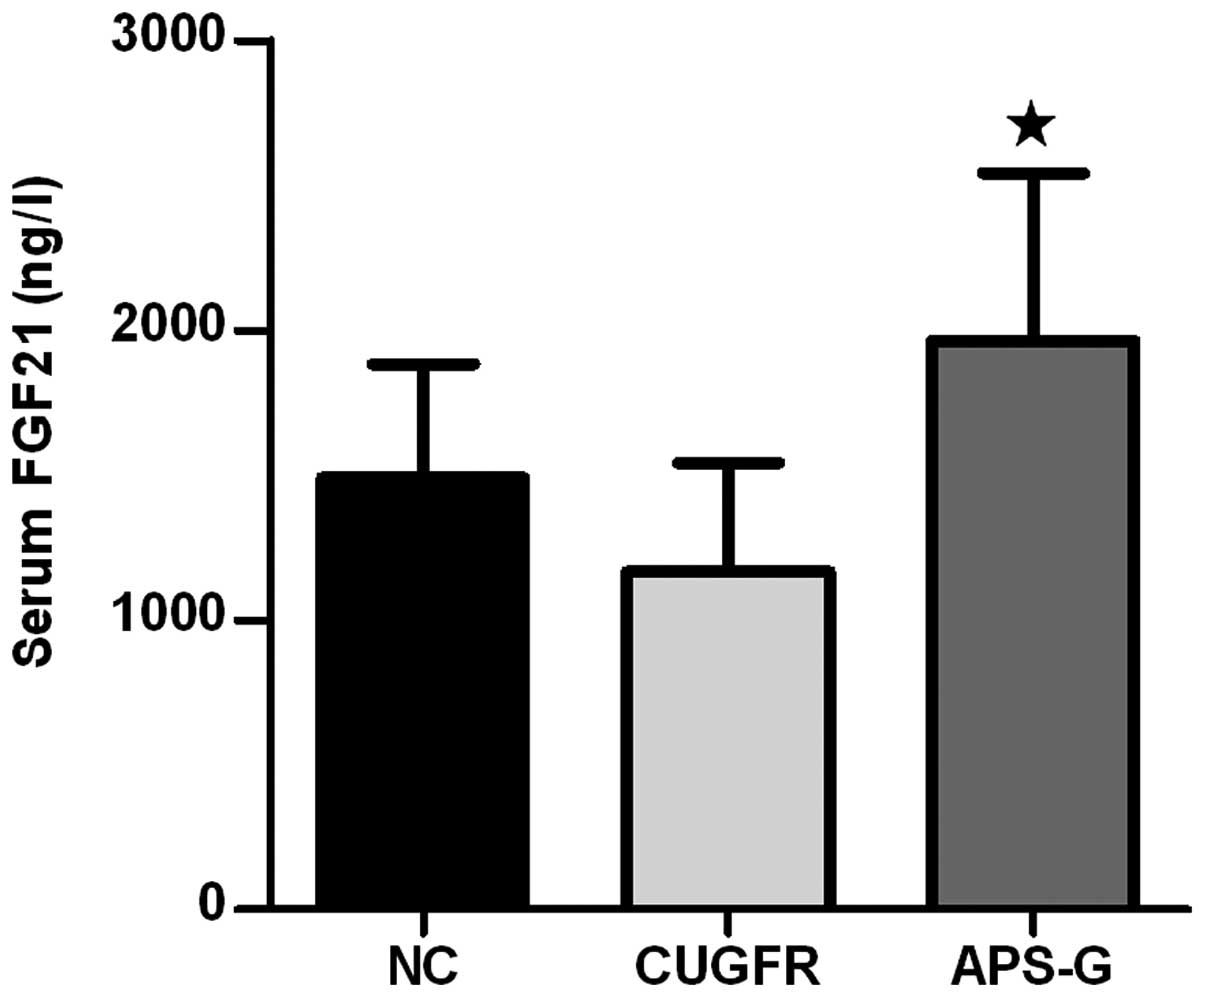
Following treatment with APS, the serum FGF21 levels
markedly decreased in the CUGFR group, whereas the serum levels of
FGF21 in the APS-G group significantly increased compared with the
CUGFR group (Fig. 6;
P<0.05).
Relative mRNA expression levels of PGC-1α
and PPARα, and protein expression levels of SIRT1, FGF21 and NF-κB
in the liver
The expression levels of PGC-1α markedly increased
in the CUGFR group when compared with the NC group, and were
marginally increased by treatment with APS (Fig. 7A). The expression levels of PPARα
in the CUGFR group were significantly lower as compared with the NC
group, and these expression levels increased following treatment
with APS (Fig. 7B; P<0.05). In
the CUGFR group, the protein expression levels of FGF21 and SIRT1
were significantly lower than the NC group (Fig. 7C and D P<0.05), whereas the
expression levels of NF-κB were significantly increased. In the
APS-G group, the previously low expression levels of FGF21 and
SIRT1 were increased (with the difference in SIRT1 being
significant compared with the CUGFR group; P<0.05). APS
treatment appeared to exert no significant effect on the activity
levels of NF-κB, where the expression levels of NF-κB had
previously been significantly increased in the CUGFR group, as
compared with the NC group (Fig. 7E
and F).
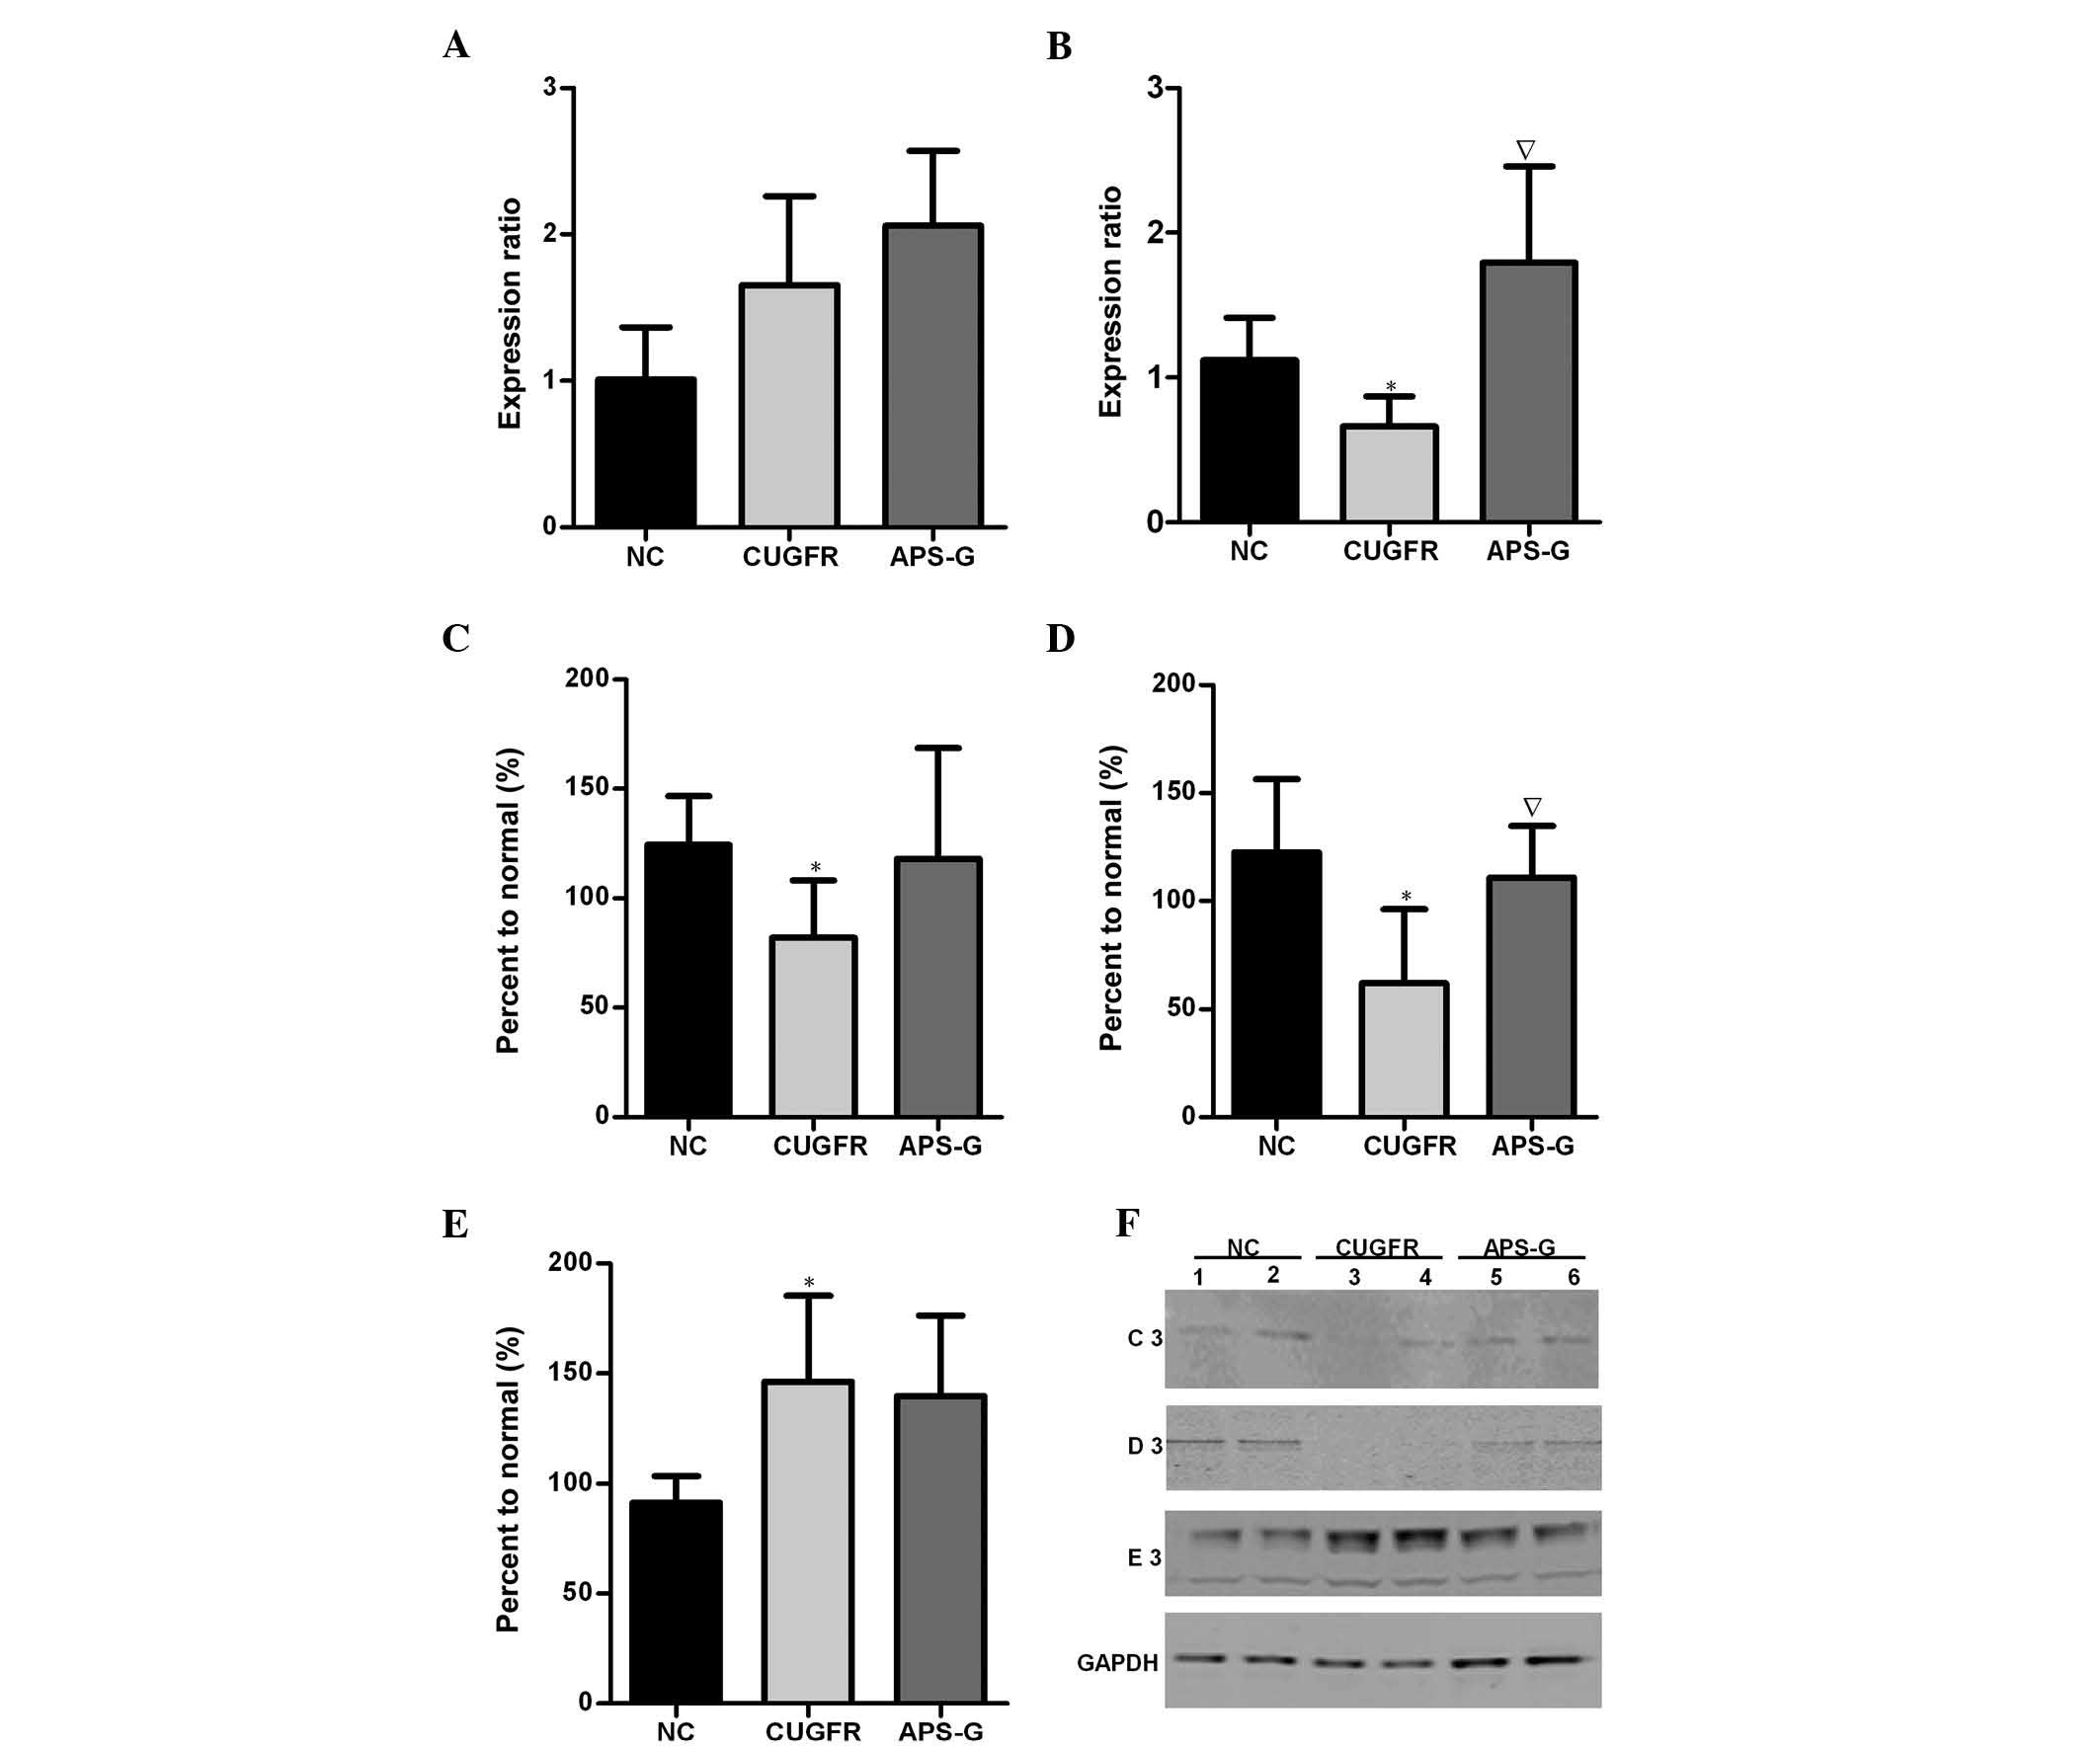 | Figure 7Relative mRNA expression levels of
(A) PGC-1α and (B) PPARα in the NC group (data are expressed as the
mean ± standard deviation). Catch-up growth-induced alterations in
PGC-1α/PPARα expression were reversed by treatment with APS.
Hepatic protein expression levels of (C) FGF21, (D) SIRT1 and (E)
NF-κB in the NC, CUGFR and APS-G groups fasted for 15 h. (F)
Western blot of the NC, CUGFR and APS-G groups fasted for 15 h. C3,
D3 and E3 are representative of the western blot lanes of FGF21,
SIRT1 and NF-κB, respectively. Lanes 1 and 2, NC group; lanes 3 and
4, CUGFR group; lanes 5 and 6, APS group. High fat diet CUGFR rats,
following calorie restriction, exhibited abnormal hepatic protein
expression levels of FGF21, SIRT and NF-κB, and lower serum
expression levels of FGF21, which were improved by treatment with
APS. Data are presented as the mean ± standard error.
*P<0.05 vs. the NC group, and ∇P<0.05
vs. the CUGFR group. APS, Astragalus polysaccharide; SIRT1, sirtuin
1; FGF21, fibroblast growth factor 21; NF-κB, nuclear factor-κB;
APS, Astragalus polysaccharides; PPARα, peroxisome
proliferator-activated receptor α; PGC-1α, PPAR γ coactivator 1α;
NC, normal control group; CUGFR, catch-up growth group; APS-G,
APS-treated group. |
Discussion
Catch-up growth may lead to non-alcoholic fatty
liver disease (NAFLD), and accumulating evidence suggests that
NAFLD is strongly associated with insulin resistance, which is an
important factor in the development of T2DM (13). FGF21 regulates hepatic glycolipid
metabolism and interacts with PPARα (14,15),
and may serve as a biological target in NAFLD to improve hepatic
insulin resistance. SIRT1 is a type of histone deacetylase that
regulates NAD+ (16),
and regulates certain transcription factors associated with
glycolipid metabolism, including PGC-1α and PPARα (17,18).
Therefore, the present study hypothesized that the
SIRT1-PGC-1α/PPARα-FGF21 signaling pathway may be significant in
the pathogenesis of hepatic insulin resistance under catch-up
growth. Following diet restriction, the expression levels of SIRT1,
PGC-1α and PPARα increased significantly, and the levels of hepatic
glucose and fatty acid B oxidation increased significantly
(19–21). In a previous study, obese mice with
genetically-engineered reduced levels of PGC-1α exhibited improved
whole-body insulin sensitivity with increased levels of hepatic and
circulating FGF21 (22). In a
model of hepatic insulin resistance, glucose absorption was
decreased due to the reduction of glucose transporter 1 and the
phosphorylation of extracellular signal-regulated kinases 1/2,
which were increased by FGF21 (23,24).
The experimental rat model in the present study reflected the
status of catch-up growth under a high fat diet following a period
of calorie restriction. The results demonstrated that the
expression levels of PGC-1α only marginally increased, whereas the
expression levels of PPARα decreased significantly. Notably, the
hepatic protein expression levels of SIRT1 and FGF21 were
significantly decreased, with serum expression levels of FGF21
being marginally decreased. Simple variations in the diet, namely a
restricted diet followed by a high-fat diet, appeared to result in
a catch-up growth effect with significant decreases in SIRT1 and
PPARa, while PGC-1 alpha increased slightly. These results
demonstrated that the effects on the expression of SIRT1 and its
downstream factors (PGC-1α/PPARα) were more complex than a simple
response to high-energy diet following calorie restriction, as the
interactions between these factors became influenced by the
increased energy levels and onset of catch-up growth. Furthermore,
the results of the present study demonstrated that the insulin
resistance index, liver index and visceral fat content ratio of the
rats significantly increased in the catch-up growth group on the
high-energy diet, with liver H&E staining and TEM indicating
the presence of NAFLD pathological changes, which induce hepatic
insulin resistance, as well as abnormal glucose and lipid
metabolism. In addition, previous studies demonstrated that liver
inflammation may cause oxidative stress, resulting in hepatic
insulin resistance and NAFLD (25,26).
The present study demonstrated that the protein expression levels
of NF-κB in the CUGFR rat livers were significantly increased, when
compared with the NC group, which indicated that inflammation
contributed to the pathogenesis of NAFLD during the catch-up growth
of rats. However, the underlying mechanism of the association
between SIRT1-PGC-1α/PPARα-FGF21 and NF-κB remains unclear and
requires further investigation.
Astragalus is a commonly administered type of
traditional Chinese medicine and APS is a type of water-soluble
polysaccharide that is purified from astragalus. APS exhibits high
biological activity (27),
regulates inflammation (28,29)
and protects the liver (30,31).
APS is able to increase insulin sensitivity and lower blood glucose
levels by decreasing endoplasmic reticulum stress in liver of
patients with T2DM (32). APS
treatment reduces the protein expression and activity levels of
hepatic glycogen synthase kinase (GSK)3β, promotes hepatic insulin
signal transduction, and decreases insulin resistance in the liver
of diabetic KKAy mice (33).
Furthermore, APS promotes the expression of myocardial PPARα, and
increases the myocardial lipid metabolism of diabetic hamsters
(12). However, to the best of our
knowledge, no previous study has observed the effects of APS on the
SIRT1-PGC-1α/PPARα-FGF21 signaling pathway in the liver of catch-up
growth rats.
The results of the present study demonstrate that
following treatment with APS, liver cells stained with H&E and
observed by TEM exhibited markedly decreased lipid droplets, and
the mitochondria, endoplasmic reticula and cell membrane
ultrastructures were improved, as compared with those of the CUGFR
group. In addition, the expression level of PPARα was markedly
increased and the change in PGC-1α expression was not statistically
significant. Furthermore, the protein expression levels of SIRT1
and FGF21 were significantly increased. The index of insulin
resistance decreased, although not significantly. These results
suggest that APS may counteract the pathology of NAFLD, by acting
upon liver endoplasmic reticula, and reducing the protein
expression and activity levels of hepatic GSK3β. Furthermore, APS
may prevent NAFLD by increasing insulin sensitivity and promoting
hepatic insulin signal transduction (32,33).
The results of the present study also suggest that APS may improve
hepatic glycolipid metabolism and suppress insulin resistance via
modulation of SIRT1-PGC-1α/PPARα-FGF21. PGC-1α enhances the effects
of PPARα through a conformational change, however, the present
study demonstrated that APS did not increase the expression levels
of PGC-1α and, therefore, there must be another mechanism that
results in the increased protein expression levels of PPARα and
FGF21. Previous studies have reported that SIRT1 increases the
expression levels of PPARα (34,35)
and the present study demonstrated that APS increases the protein
expression levels of SIRT1. Therefore, the increased expression
levels of PPARα and FGF21 in the liver may be due to an increase in
PPARα deacetylation levels in liver cells; however, this hypothesis
requires further investigation. Whether the effects of APS
treatment act via the various polysaccharide groups, or via the
β-D-(1→3) galactan or β-D-(1→6) activity groups of
galactooligosaccharide side-chains also requires further
investigation. In addition, a previous study on the effects of APS
on blood glucose in rats demonstrated that APS treatment for 4
weeks exhibited no significant effect on the blood glucose levels
of diabetic rats; however, following treatment with APS for 8
weeks, the decreasing effects on blood glucose levels became
apparent. Furthermore, no effects were observed in the glucose
levels of normal rats (36).
Therefore, the results of the present study on the effects of APS
on the morphological pathological changes of the liver, and on
glucose and lipid metabolism further suggest that the active
components of astragalus exerted significant effects on HOMA–IR and
fasting insulin levels, although it did not affect hepatic insulin
resistance. A study of longer duration would be required to observe
the effects of APS on pathological and morphological changes in the
liver, as well as on glucose and lipid metabolism. In addition
various APS doses and purity levels require investigation to
observe their effects on insulin resistance, glycolipid metabolism
and NAFLD, to elucidate the ranges and determine guidelines for APS
administration to provide early intervention strategies for the
prevention of T2DM.
In conclusion, the suppressive effects of APS on
liver acetylation levels and on associated glycolipid metabolism
molecules contribute to decreasing insulin resistance. However, the
mechanism underlying these effects remains to be elucidated, and
requires further investigation. Early treatment with APS over
longer time periods may provide a novel, safe and effective
therapeutic strategy for the treatment of T2DM.
Acknowledgments
The present study was supported by grants from The
National Natural Science Fund (grant no. 81370932) and the Special
Fund for the Development of Science and Technology of the Pudong
Health Bureau of Shanghai (grant no. PW2012A-29).
The authors of the present study would like to thank
Professor Zhixiong Shen of the University of Engineering Science in
Shanghai (Shanghai, China) for his contribution to animal
experimentation, and to the Pathology Department of Pudong Hospital
(Shanghai, China) for hepatic pathological analysis and TEM.
References
|
1
|
Prader A, Tanner JM and von Harnack GA:
Catch-up growth following illness or starvation. An example of
developmental canalization in man. Pediatrics. 62:646–659. 1963.
View Article : Google Scholar
|
|
2
|
Chen LL: Catch-up growth - a new territory
for understanding insulin resistance. Chin J Endocrinol Metab.
24:235–238. 2008.
|
|
3
|
Xiao XH, Zhang ZX, Cohen HJ, Wang H, Li W,
Wang T, Xu T, Liu A, Gai MY, Ying S, et al: Evidence of a
relationship between infant birth weight and later diabetes and
impaired glucose regulation in a Chinese population. Diabetes Care.
31:483–487. 2008. View Article : Google Scholar
|
|
4
|
Fu Q, McKnight RA, Yu X, Wang L, Callaway
CW and Lane RH: Uteroplacental insufficiency induces site-specific
changes in histone H3 covalent modifications and affects
DNA-histone H3 positioning in day0 IUGR rat liver. Physiol
Genomics. 20:108–116. 2004. View Article : Google Scholar : PubMed/NCBI
|
|
5
|
Lane RH, MacLennan NK, Hsu JL, Janke SM
and Pham TD: Increased hepatic peroxisome proliferator-activated
receptor-gamma coactivator-1 gene expression in a rat model of
intrauterine growth retardation and subsequent insulin resistance.
Endocrinology. 143:2486–2490. 2002.PubMed/NCBI
|
|
6
|
Yoon JC, Puigserver P, Chen G, Donovan J,
Wu Z, Rhee J, Adelmant G, Stafford J, Kahn CR, Granner DK, et al:
Control of hepatic gluconeogenesis through the transcriptional
coactivator PGC-l. Nature. 413:131–138. 2001. View Article : Google Scholar : PubMed/NCBI
|
|
7
|
Yeung F, Hoberg JE, Ramsey CS, Keller MD,
Jones DR, Frye RA and Mayo MW: Modulation of NF-kappa B-dependent
transcription and cell survival by the SIRT1 deacetylase. EMBO J.
23:2369–2380. 2004. View Article : Google Scholar : PubMed/NCBI
|
|
8
|
Nannipieri M, Gonzales C, Baldi S, Posadas
R, Williams K, Haffner SM, Stern MP and Ferrannini E; Mexico City
diabetes study: Liver enzymes, the metabolic syndrome and incident
diabetes: The Mexico City diabetes study. Diabetes Care.
28:1757–1762. 2005. View Article : Google Scholar : PubMed/NCBI
|
|
9
|
Cettour-Rose P, Samec S, Russell AP,
Summermatter S, Mainieri D, Carrillo-Theander C, Montani JP,
Seydoux J, Rohner-Jeanrenaud F and Dulloo AG: Redistribution of
glucose from skeletal muscle to adipose tissue during catch-up fat:
A link between catch-up growth and later metabolic syndrome.
Diabetes. 54:751–756. 2005. View Article : Google Scholar : PubMed/NCBI
|
|
10
|
Chen R, Shao H, Lin S, Zhang JJ and Xu KQ:
Treatment with Astragalus membranaceus produces antioxidative
effects and attenuates intestinal mucosa injury induced by
intesti-nalischemia-reperfusion in rats. Am J Chin Med. 39:879–887.
2011. View Article : Google Scholar
|
|
11
|
Sang Z, Zhou L, Fan X and McCrimmon RJ:
Radix astragali (huangqi) as a treatment for defective hypoglycemia
counter-regulation in diabetes. Am J Chin Med. 38:1027–1038. 2010.
View Article : Google Scholar
|
|
12
|
Chen W, Xia Y, Zhao X, Wang H, Chen W, Yu
M, Li Y, Ye H and Zhang Y: The critical role of Astragalus
polysaccharides for the improvement of PPARα [correction of
PPRAα]-mediated lipotoxicity in diabetic cardiomyopathy. PLoS One.
7:e455412012. View Article : Google Scholar
|
|
13
|
Magee TR, Han G, Cherian B, Khorram O,
Ross MG and Desai M: Down-regulation of transcription factor
peroxisome proliferator-activated receptor in programmed hepatic
lipid dysregulation and inflammation in intrauterine
growth-restricted offspring. Am J Obstet Gynecol. 199:271 el–5.
2008. View Article : Google Scholar
|
|
14
|
Dushay J, Chui PC, Gopalakrishnan GS,
Varela-Rey M, Crawley M, Fisher FM, Badman MK, Martinez-Chantar ML
and Maratos-Flier E: Increased fibroblast growth factor 21 in
obesity and nonalcoholic fatty liver disease. Gastroenterology.
139:456–463. 2010. View Article : Google Scholar : PubMed/NCBI
|
|
15
|
Li H, Fang Q, Gao F, Fan J, Zhou J, Wang
X, Zhang H, Pan X, Bao Y, Xiang K, et al: Fibroblast growth factor
21 levels are increased in nonalcoholic fatty liver disease
patients and are correlated with hepatic triglyceride. J Hepatol.
53:934–940. 2010. View Article : Google Scholar : PubMed/NCBI
|
|
16
|
Leibiger IB and Berggren PO: Sirt1: A
metabilic a master switch that modulates lifespan. Nat Med.
12:34–36. 2006. View Article : Google Scholar
|
|
17
|
Gerhart-Hines Z, Rodgers JT, Bare O, Lerin
C, Kim SH, Mostoslavsky R, Alt FW, Wu Z and Puigserver P: Metabolic
control of muscle mitochondrial function and fatty acid oxidation
through SIRT1/PGC-1 alpha. Embo J. 26:1913–1923. 2007. View Article : Google Scholar : PubMed/NCBI
|
|
18
|
Picard F, Kurtev M, Chung N, Topark-Ngarm
A, Senawong T, Machado De Oliveira R, Leid M, McBurney MW and
Guarente L: Sirt1 promotes fat mobilization in white adpecytes by
repressing PPAR-gamma. Nature. 429:771–776. 2004. View Article : Google Scholar : PubMed/NCBI
|
|
19
|
Ma L, Dong W, Wang R, Li Y, Xu B, Zhang J,
Zhao Z and Wang Y: Effect of caloric restriction on the SIRT1/mTOR
signaling pathways in senile mice. Brain Res Bull. 116:67–72. 2015.
View Article : Google Scholar : PubMed/NCBI
|
|
20
|
Zhao Y, Ling F, Griffin TM, He T, Towner
R, Ruan H and Sun XH: Up-regulation of the Sirtuin 1 (Sirt1) and
peroxisome proliferator-activated receptor γ coactivator-1α
(PGC-1α) genes in white adipose tissue of Id1 protein-deficient
mice: Implications in the protection against diet and age-induced
glucose intolerance. J Biol Chem. 289:29112–29122. 2014. View Article : Google Scholar : PubMed/NCBI
|
|
21
|
Lee J, Hong SW, Park SE, Rhee EJ, Park CY,
Oh KW, Park SW and Lee WY: Exendin-4 regulates lipid metabolism and
fibroblast growth factor 21 in hepatic steatosis. Metabolism.
63:1041–1048. 2014. View Article : Google Scholar : PubMed/NCBI
|
|
22
|
Estall JL, Ruas JL, Choi CS, Laznik D,
Badman M, Maratos-Flier E, Shulman GI and Spiegelman BM: PGC-1α
negatively regulates hepatic FGF21 expression by modulating the
heme/Rev-Erbα axis. Proc Natl Acad Sci USA. 106:22510–22515. 2009.
View Article : Google Scholar
|
|
23
|
Yu D, Sun CY, Sun GP, Ren GP, Ye XL, Zhu
SL, Wang WF, Xu PF, Li SJ, Wu Q, et al: The synergistic effect of
FGF-21 and insulin on regulating glucose metabolism and its
mechanism. Yao Xue Xue Bao. 49:977–984. 2014.in Chinese. PubMed/NCBI
|
|
24
|
Ge X, Chen C, Hui X, Wang Y, Lam KS and Xu
A: Fibroblast growth factor 21 induces glucose transporter-1
expression through activation of the serum response factor/Ets-like
protein-1 in adipocytes. J Biol Chem. 286:34533–34541. 2011.
View Article : Google Scholar : PubMed/NCBI
|
|
25
|
Li L, Hai J, Li Z, Zhang Y, Peng H, Li K
and Weng X: Resveratrol modulates autophagy and NF-κB activity in a
murine model for treating non-alcoholic fatty liver disease. Food
Chem Toxicol. 63:166–173. 2013. View Article : Google Scholar
|
|
26
|
Gariani K, Philippe J and Jornayvaz FR:
Non-alcoholic fatty liver disease and insulin resistance: From
bench to bedside. Diabetes Metab. 39:16–26. 2013. View Article : Google Scholar
|
|
27
|
Wu F and Chen X: A review of
pharmacological study on Astragalus membranaceus (Fisch) Bge. Zhong
Yao Cai. 27:232–234. 2004.In Chinese. PubMed/NCBI
|
|
28
|
Lu J, Chen X, Zhang Y, Xu J, Zhang L, Li
Z, Liu W, Ouyang J, Han S and He X: Astragalus polysaccharide
induces anti-inflammatory effects dependent on AMPK activity in
palmitate-treated RAW264.7 cells. Int J Mol Med. 31:1463–1470.
2013.PubMed/NCBI
|
|
29
|
He X, Shu J, Xu L, Lu C and Lu A:
Inhibitory effect of Astragalus polysaccharides on
lipopolysaccharide-induced TNF-a and IL-1β production in THP-1
cells. Molecules. 17:3155–3164. 2012. View Article : Google Scholar : PubMed/NCBI
|
|
30
|
Li XT, Zhang YK, Kuang HX, Jin FX, Liu DW,
Gao MB, Liu Z and Xin XJ: Mitochondrial protection and anti-aging
activity of astragalus polysaccharides and their potential
mechanism. Int J Mol Sci. 13:1747–1761. 2012. View Article : Google Scholar : PubMed/NCBI
|
|
31
|
Wang LX and Han ZW: The effect of
astragalus polysaccharide on endotoxin-induced toxicity in mice.
Yao Xue Xue Bao. 27:5–9. 1992.In Chinese.
|
|
32
|
Wang N, Zhang D, Mao X, Zou F, Jin H and
Ouyang J: Astragalus polysaccharides decreased the expression of
PTP1B through relieving ER stress-induced activation of ATF6 in a
rat model of type 2 diabetes. Mol Cell Endocrinol. 307:89–98. 2009.
View Article : Google Scholar : PubMed/NCBI
|
|
33
|
Mao XQ, Wu Y, Wu K, Liu M, Zhang JF, Zou F
and Ou-Yang JP: Astragalus polysaccharide reduces hepatic
endoplasmic reticulum stress and restores glucose homeostasis in a
diabetic KKAy mouse model. Acta Pharmacol Sin. 28:1947–1956. 2007.
View Article : Google Scholar : PubMed/NCBI
|
|
34
|
Chen W, Chen WJ, Xia YP, Lu Y and Yu MH:
Effects of astragalus polysaccharides on lipid metabolism and
PPAR-α gene expression in myocardium of diabetic hamsters. Fudan
Univ J Med Sci. 37:194–197. 2010.
|
|
35
|
Caton PW, Holness MJ, Bishop-Bailey D and
Sugden MC: PPAR α-LXR as a novel metabolostatic signalling axis in
skeletal muscle that acts to optimize substrate selection in
response to nutrient status. Biochem J. 437:521–530. 2011.
View Article : Google Scholar : PubMed/NCBI
|
|
36
|
Zou F, Mao XQ, Wang N, Liu J and Ou-Yang
JP: Astragalus polysaccharides alleviates glucose toxicity and
restores glucose homeostasis in diabetic states via activation of
AMPK. Acta Pharmacol Sin. 30:1607–1615. 2009. View Article : Google Scholar : PubMed/NCBI
|