Introduction
Allogenic hematopoietic stem cell transplantation
(HSCT) is the predominant treatment used to cure malignant and
non-malignant hematological disorders. The number of HSCTs
conducted has increased due to an overall improvement in the safety
of the procedure resulting from reduced-intensity conditioning
regimens, and the availability of new donor sources, available in
the national registries (1,2).
Reduced-intensity conditioning is widely used to
avoid the complications of myeloablative conditioning to prepare
for HSCT in the adult population. However, this procedure is
associated with a high risk of complications that may result in
graft loss. To prevent this, it is important to monitor chimerism
for early intervention (3).
Evaluation of chimerism status at regular intervals is useful to
prevent risk of early graft rejection and relapse in patients
suffering from malignant diseases. Quantification of the chimerism
percentage is also a potential marker of minimal residual disease
(MRD) for patients without suitable MRD markers and it provides
useful information on graft vs. host disease and graft vs. tumor
effects (4–6).
Chimerism analysis is a tool that allows to
determination of the genotypic origin of post-transplantation
hematopoiesis. Subsequent to HSCT, a patient presenting with 100.0%
donor-origin cells during follow up is considered to have the
status of complete chimerism (CC), patients in which the donor- and
recipient-origin cells coexist have the status of mixed chimerism
(MC) (7). Informative genetic
markers are used to discriminate between recipient and donor
genomes in order to detect the chimerism status (8).
At present, different approaches based on polymerase
chain reaction (PCR) amplification of polymorphic DNA sequences
(short tandem repeat, STR; single nucleotide polymorphism, SNP; and
insertion/deletion, INDEL) are used for chimerism analysis. In the
vast majority of laboratories, semi-quantitative fluorescent PCR of
STRs is the procedure of choice for diagnostic purposes. The key
advantage offered by this method is the highly polymorphic nature
of the STR markers, which allow for a high probability of
two-genome discrimination. Laboratories currently use different
commercial multiplex kits for forensic identifications or in house
assays, however have formed consortiums to standardize procedures
and set guidelines for the correct interpretation of results, in
order to improve this intrinsically semi-quantitative platform with
a sensitivity of 1.0–3.0% (9).
Next generation sequencing (NGS) technologies are an
innovation in human and animal genomics research, as they are
capable of producing 100-fold more data than the most powerful
Sanger based capillary sequencers; thus enabling researchers to
investigate the large number of queries that remain to addressed
(10).
NGS generates hundreds of giga-bases of nucleotide
sequences per instrument run and produces this data at a lower
cost, thus motivating researchers to use NGS for various purposes:
To identify rare variations on the whole genome or on a target
sequence, to analyze transcriptome profiling of cells, tissues and
organisms and to identify epigenetic markers for disease diagnosis.
Progress in the optimization of procedures, in addition to further
reduction of costs, are the key factors that will lead to a more
extensive uptake of this technique in diagnosis and for practical
clinical applications.
NGS provides qualitative and quantitative data.
Quantitative data depends on the depth of sequence data collected
on each sample and on the quality of the target to expose. For
samples with a lower abundance target, many more sequence reads are
required to achieve accurate quantification (11). A previous study demonstrated that
NGS exhibits sensitivity comparable to that of quantitative PCR
(qPCR) in the evaluation of MRD in B cell disorders (12).
In the present study, an Ion AmpliSeq custom
chimerism (ACCh) panel and a custom bioinformatic pipeline was
created for chimerism quantification by NGS. The first aim was to
detect the existence of cells of two origins in chimera samples and
then to evaluate the capability of NGS to determine the percentage
of the recipient cells.
Materials and methods
DNA sample preparation
The Ethics Committee of the Institute for Maternal
and Child Health, IRCCS 'Burlo Garofolo' approved the present study
(approval number: Prot. 18/2015, Cl. M/11). Written informed
consent was obtained from all the participants.
Total peripheral blood was collected from 10
volunteer donors (V01-V10; 4 males and 6 females) with ages ranging
from 20–50 years, and from 2 pediatric patients that underwent
allogeneic HSCT (pR1, male, 5 years; and pR2, male, 12 years) and
their donors (pD1, male, 9 years; and pD2, female, 25 years;
Table I). Written informed consent
was obtained from all the participants.
 | Table IList of the patient DNA samples used
in the present study. |
Table I
List of the patient DNA samples used
in the present study.
| DNA ID | Chimera ID | Chimera
information | Notes |
|---|
| pD1 | pR1 | Samples used to
evaluate panel informativity in consanguinity | Brothers,
pre-HSCT |
| pD2 | pR2 | pCh1 | MC by STR-CE
analysisa | +1 month
post-HSCT |
| pD2 | pR2 | pCh2 | CC by STR-CE
analysis | +2 months
post-HSCT |
| pD2 | pR2 | pCh3 | MC by STR-CE
analysis | +3 months
post-HSCT |
| pD2 | pR2 | pCh4 | MC by STR-CE
analysis | +4 months
post-HSCT |
| pD2 | pR2 | pCh5 | MC by STR-CE
analysis | +6 months
post-HSCT |
| pD2 | pR2 | pCh6 | CC by STR-CE
analysis | +10 months
post-HSCT |
All DNA samples were isolated using the QIAamp DNA
Blood kit according to manufacturer's protocol (Qiagen GmbH,
Hilden, Germany). The DNA status was evaluated using the NanoDrop
1000 spectrophotometer (Thermo Fisher Scientific, Inc., Waltham,
MA, USA) and the Qubit dsDNA HS Assay kit and the Qubit fluorometer
(Thermo Fisher Scientific, Inc.). A DNA stock solution was prepared
for all DNA samples at 20.0 ng/μl.
DNA samples from the 10 volunteer donors were
randomly paired. A total of 5 artificial chimeric DNA mixtures, as
the donor/recipient chimera, were created by diluting DNA with its
paired DNA at several percentages of the first DNA for each
artificial DNA mixture (aCh).
Ion AmpliSeq custom chimerism panel
design
A multi phase strategy was employed to evaluate the
main characteristics of the ACCh panel: i) The panel average
heterozygosity was assessed around 0.5 for the European population
(HapMap Phase 3 CEU population); ii) two SNPs per somatic
chromosome, termed 'main SNPs' (mSNPs), were selected and located
in two different regions of the same chromosome; iii) the amplicon
composition was evaluated according to the following requirements:
a) GC percentage ranging between 40.0 and 60.0%; b) presence of one
mSNP inside each amplicon; c) mSNP location preferably in the
centre of the amplicon; d) absence of INDEL SNPs; e) absence of
homopolymers and potential homopolymer generation from SNP variants
and their flanking regions; f) absence of flanking SNPs to the
mSNPs.
In total, 44 single-nucleotide, biallelic,
polymorphisms were selected from the NCBI dbSNPs database
(http://www.ncbi.nlm.nih.gov/SNP/, build
138, last database update 28.03.2014; Table II). A total of 4 base sequences
including mSNPs were used as target regions for primer design. The
primer pool, intended for DNA library construction through
multiplex PCR, was defined by Ion AmpliSeq Designer software,
version 3.0.1 (Thermo Fisher Scientific, Inc.). A single-tube, 44
primer pair pool was purchased from Life Technologies (Thermo
Fisher Scientific, Inc.).
| Table IIList of all main SNPs included in the
Ion AmpliSeq custom chimerism panel. |
Table II
List of all main SNPs included in the
Ion AmpliSeq custom chimerism panel.
| SNP ID | Genome position | Alleles | European
heterozygosity | Informativity of
recipient allelea % |
|---|
| rs12070036 | chr1:g.227819514 | A/G | 0.407 | 41 |
| rs1234315 | chr1:g.173178463 | C/T | 0.513 | 37 |
| rs10496711 |
chr2:g.134516742 | C/G | 0.407 | 40 |
| rs12612347 |
chr2:g.219057338 | A/G | 0.442 | 40 |
| rs1984630 |
chr3:g.134414219 | G/T | 0.522 | 36 |
| rs9831477 |
chr3:g.30693522 | A/T | 0.483 | 38 |
| rs10033900 |
chr4:g.110659067 | C/T | 0.496 | 37 |
| rs5335 |
chr4:g.148463840 | C/G | 0.492 | 37 |
| rs983889 |
chr5:g.15555486 | A/C | 0.487 | 38 |
| rs10038113 |
chr5:g.25902342 | C/T | 0.469 | 38 |
| rs552655 |
chr6:g.13370488 | A/G | 0.504 | 37 |
| rs2077163 |
chr6:g.33636907 | C/T | 0.460 | 39 |
| rs39395 |
chr7:g.103489729 | A/G | 0.425 | 40 |
| rs2270188 |
chr7:g.116140524 | G/T | 0.496 | 38 |
| rs10505477 |
chr8:g.128407443 | C/T | 0.531 | 36 |
| rs532841 |
chr8:g.12957475 | C/T | 0.549 | 35 |
| rs2297313 |
chr9:g.91669362 | A/G | 0.960 | 37 |
| rs424539 |
chr9:g.14442595 | C/G | 0.467 | 38 |
| rs1561570 |
chr10:g.13155726 | C/T | 0.522 | 36 |
| rs619824 |
chr10:g.104581288 | G/T | 0.407 | 41 |
| rs198464 |
chr11:g.61521621 | C/T | 0.504 | 37 |
| rs178503 |
chr11:g.44082931 | A/G | 0.442 | 40 |
| rs1126758 |
chr12:g.103248924 | A/G | 0.416 | 40 |
| rs8608 |
chr12:g.53294381 | A/G | 0.522 | 36 |
| rs1061472 |
chr13:g.52524488 | A/G | 0.504 | 37 |
| rs504544 |
chr13:g.19735891 | A/T | 0.508 | 37 |
| rs10143250 |
chr14:g.104723433 | C/T | 0.434 | 39 |
| rs1957779 |
chr14:g.63669647 | C/T | 0.449 | 39 |
| rs634990 |
chr15:g.35006073 | A/G | 0.492 | 38 |
| rs2117215 |
chr15:g.94879684 | C/T | 0.603 | 32 |
| rs121893 |
chr16:g.66183995 | C/T | 0.414 | 39 |
| rs2191125 |
chr16:g.7720923 | T/C | 0.550 | 34 |
| rs6808 |
chr17:g.62400575 | C/G | 0.450 | 39 |
| rs744166 |
chr17:g.40514201 | T/C | 0.441 | 40 |
| rs620898 |
chr18:g.48509148 | A/T | 0.467 | 38 |
| rs633265 |
chr18:g.57831468 | A/C | 0.496 | 37 |
| rs108295 |
chr19:g.34224816 | A/G | 0.496 | 37 |
| rs892086 |
chr19:g.10837677 | C/T | 0.451 | 39 |
| rs753381 |
chr20:g.39797465 | T/C | 0.451 | 39 |
| rs715147 |
chr20:g.50055350 | G/A | 0.367 | 43 |
| rs225436 |
chr21:g.43729034 | A/G | 0.517 | 36 |
| rs8128316 |
chr21:g.35721560 | C/T | 0.542 | 35 |
| rs4444 |
chr22:g.31205334 | A/G | 0.483 | 38 |
| rs132985 |
chr22:g.38563471 | C/T | 0.517 | 37 |
Ion torrent library preparation and
sequencing
DNA sample library preparation was performed
according to the AmpliSeq Library Preparation protocol (Life
Technologies; Thermo Fisher Scientific, Inc.). For each DNA sample,
a library was constructed using 10.0 ng genomic DNA through the Ion
AmpliSeq Library kit, version 2.0. Subsequently, according to the
library preparation protocol, each DNA library was indexed using
the Ion Xpress Barcode Adapters kit (Thermo Fisher Scientific,
Inc.) and was purified using AMPure XP magnetic beads (Beckman
Coulter, Inc., Brea, CA, USA). Each DNA library was then quantified
by qPCR using the thermo-cycler 7900HT Fast Real-Time PCR system
with the Ion Library TQMN Quantification kit (Thermo Fisher
Scientific, Inc.). Template Ion Sphere Particles were arranged
using the Ion Personal Genome Machine (PGM) Template OT2 200 kit
(Thermo Fisher Scientific, Inc.) and a single end 200 base-read
sequencing run was conducted using the Ion Torrent PGM system.
Libraries were pooled at 8 pM using the following rates:
Donor/recipient, 1:1; and chimera/chimera, 1:1. The
recipient/chimera rate was fixed at 1:40 in order to obtain an
average coverage of the above libraries around 250X:10,000X.
Library pools were sequenced on ion 314 and 316 chip (Table III).
| Table IIIList of the library pools sequenced
by next generation sequencing. |
Table III
List of the library pools sequenced
by next generation sequencing.
| DNA ID | Chimera ID | Chimera notes | Ion chip |
|---|
| V01, V02 |
aCh1 | Chimera: 1.0% of
V01; 99.0% of V02 | 314 |
| V03, V04 |
aCh2 | Chimera: 1.25% of
V03; 98.75% of V04 | 314 |
| V03, V04 |
aCh3 | Chimera: 2.5% of
V03; 97.5% of V04 | 314 |
| V05, V06 |
aCh4 | Chimera: 5.0% of
V05; 95.0% of V06 | 314 |
| V05, V06 |
aCh5 | Chimera: 10.0% of
V05; 90.0% of V06 | 314 |
| V07, V08 |
aCh6,7,8,9,10,11 | Chimeras: 0.5%,
1.0%, 4.0%, 8.0%, 12.0%, 20.0% of V07; 99.5%, 99.0%, 96.0%, 92.0%,
88%, 80.0% of V08 | 316 |
| V09, V10 |
aCh12,13 | Chimeras: 40.0% of
V09 and 100% of V09; 60.0% of V10 and 0.0% of V10 | 316 |
| pD2, pR2 |
pCh1,2,3,4,5,6 | Chimeras: MC, CC,
MC, MC, MC, CC of pR2a | 316 |
| pD2, pR2 |
pCh2 | Technical
replication | 314 |
| pD1, pR1 |
pCh6 | Technical
replication | 314 |
Hotspot panel bed file
A hotspot panel bed file was created using the UCSC
Genome Browser (https://genome.ucsc.edu). All SNPs located in the
central region of each amplicon were included (NCBI dbSNPs build
138; 'Common SNPs' =286). All the INDELs present across the
amplicons, and the SNPs near the 5′ and 3′ ends of the amplicons
were excluded from the file. All the above 44 selected SNPs were
marked as 'mSNP' and the SNPs belonging to the same amplicon were
indexed with the same chromosome/amplicon ID number. Finally, a
hotspot panel bed file was created: 'HP286SNPs'.
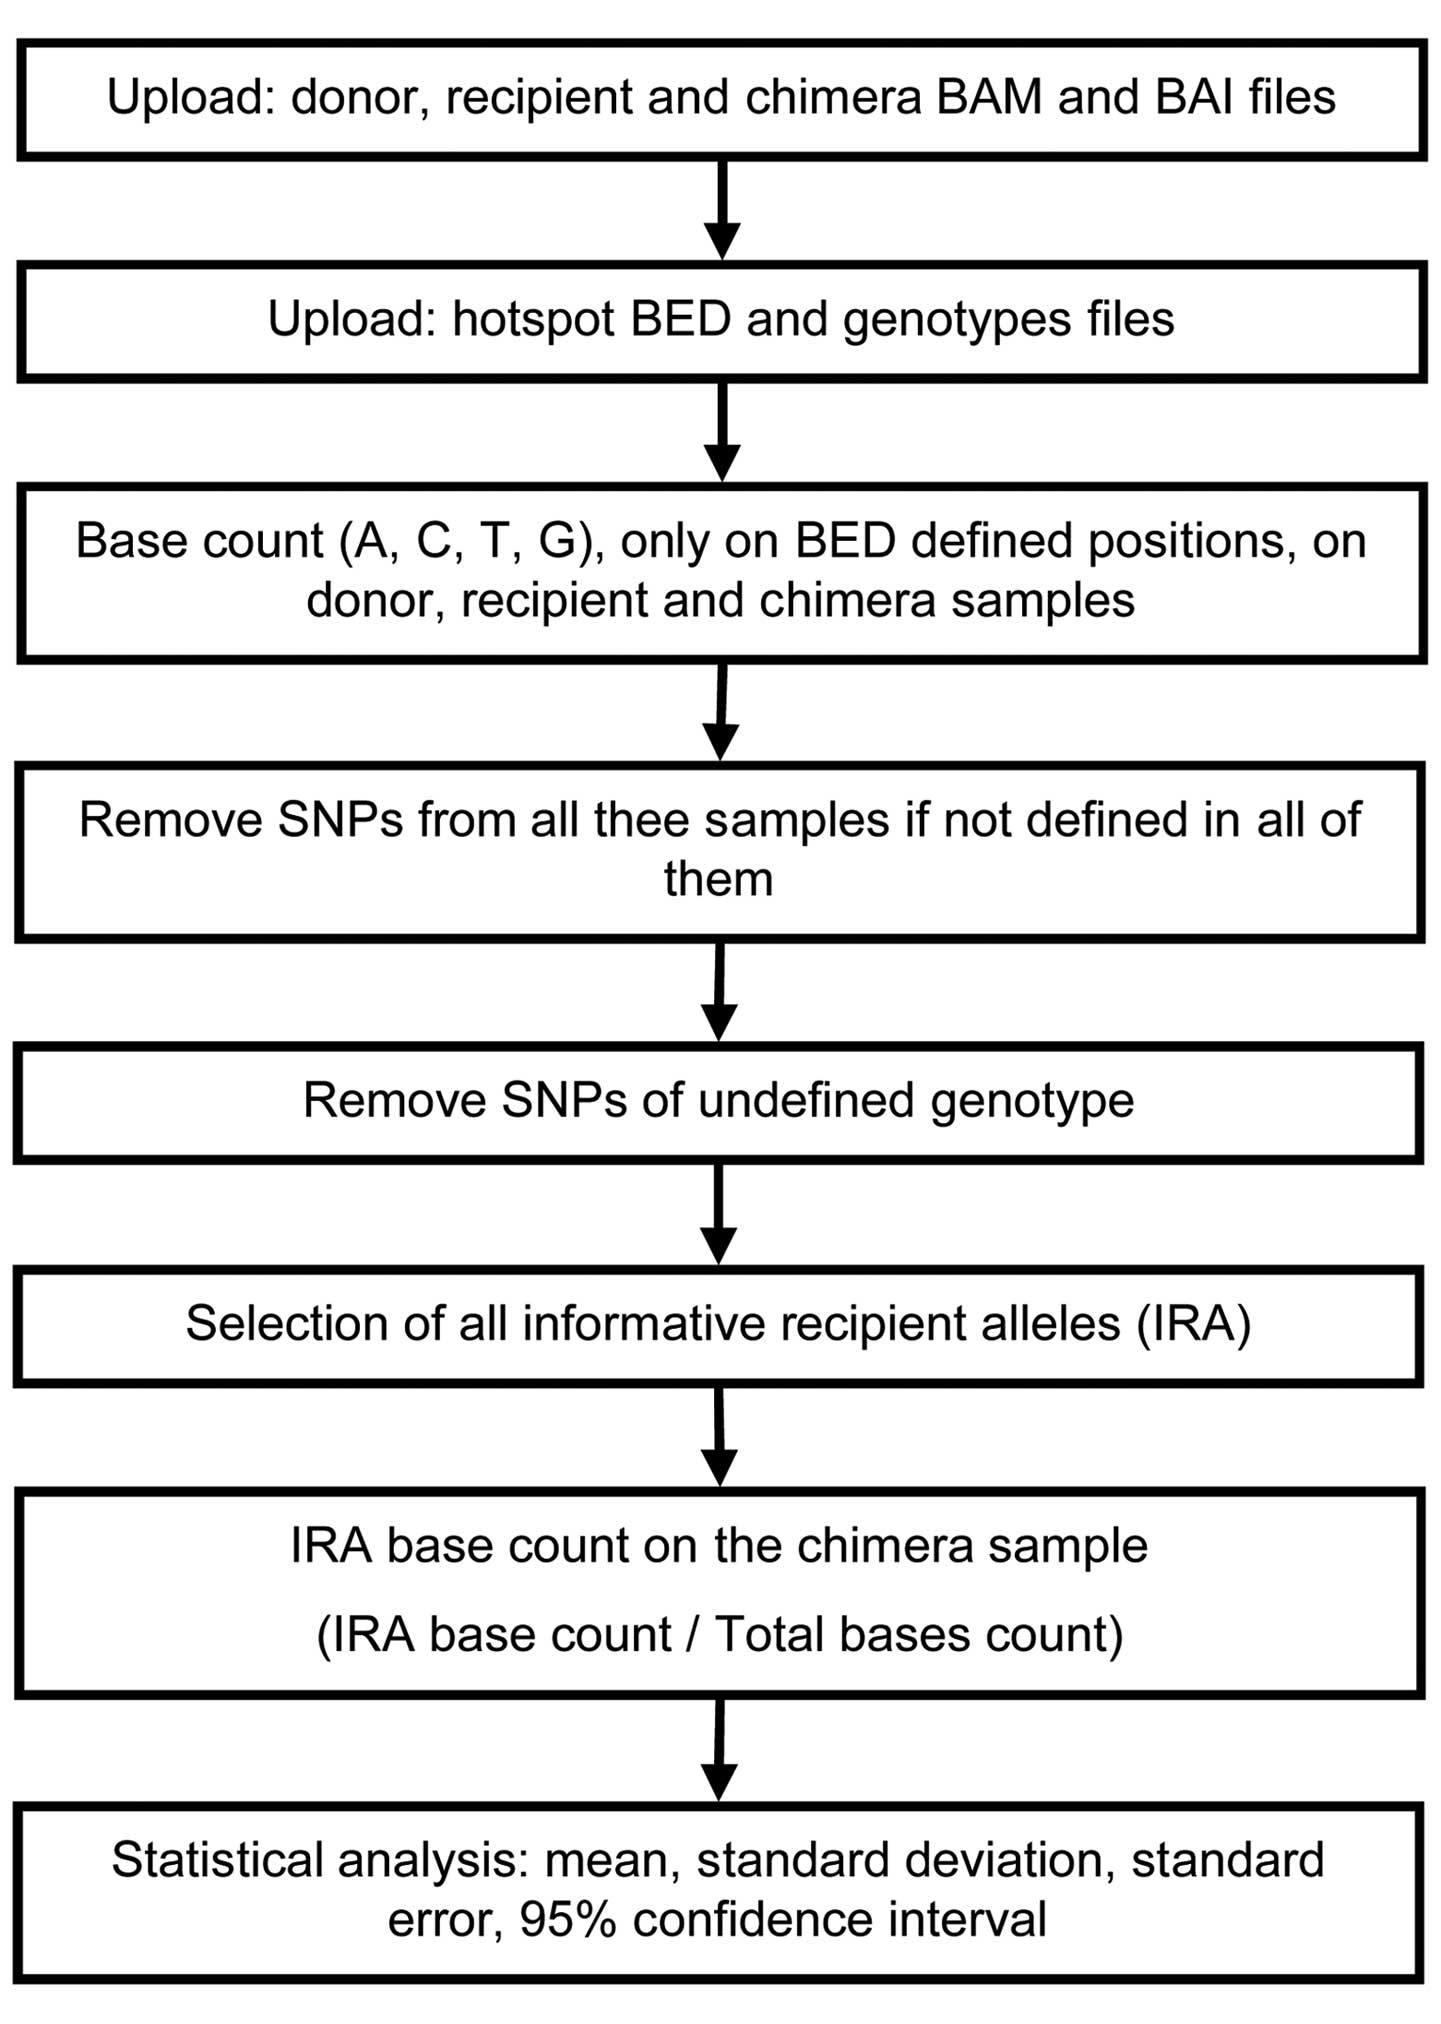
Genotyping and quantification
Genotyping of all DNA was performed automatically,
together with the quantification of all the chimeras, using a
custom bioinformatics tool. The code of our tool was written using
the Shiny package in R, a web framework to build interactive web
applications (https://cran.r-project.org/web/packages/shiny/index.html).
A functional diagram of the code is presented in Fig. 1 and the full code is available on
request. The code is based on dependencies of the Bioconductor
package that must be pre-installed for proper tool
functionality.
The custom tool requires as input the sequencing bam
files of 'Donor', ' Recipient' and 'Chimeric' patient. Briefly, it
uses readGAlignments and pileLettersAt functions, from the
GenomicAlignments package (13),
to read bam files and extracts the letters/nucleotides into a set
of individual genomic positions defined from the bed file.
Thresholds for 'Donor' and 'Recipient', homozygous and heterozygous
genotyping calls, are settled in base counts frequency ranges of
90.0–100.0% and 30.0–60.0%, respectively. Genotyping calls not
included in the thresholds ranges were excluded as unreliable;
users can modify the thresholds according to their needs from the
user interface. Genotypes from each library were crosschecked to
select only SNPs comparable in all conditions. Selected SNPs from
donors and recipients were labelled as informative recipient
alleles (IRA) according to the following schema: Donor homozygous
and recipient heterozygous [Donor (AA) and Recipient (Aa); Donor
(aa) and Recipient (Aa)]; donor and recipient homozygous for
different alleles [Donor (AA) and Recipient (aa); Donor (aa) and
Recipient (AA)].
Only the IRA SNPs tagged as informative were used to
calculate the chimera's donor:recipient ratio as median of the
allele frequency ratio, while standard error was used to calculate
confidence intervals of prediction at 95.0%.
To cross validate the tool, genotyping of all donor
and recipient samples was also performed manually obtaining the
variant data from the Ion Torrent plugin Variant Caller, version
4.4 using the 'Generic-PGM-Germ Line-Low Stringency' configuration
coupled by the HP286SNPs hotspot bed file.
Microsatellite analysis and patient data
validation
Multiplex PCR amplification of V01-V10 and
aCh1–13 samples, in addition to the patient samples pD2,
pR2 and pCh1–6, was performed according to the
manufacturer's instructions of the AmpFlSTR Identifiler Plus PCR
Amplification kit (Thermo Fisher Scientific, Inc.). Amplicons were
resolved on a Genetic Analyzer 3130 and analyzed with GeneMapper
software, version 4.1 (Life Technologies; Thermo Fisher Scientific,
Inc.).
Patient samples (pCh1–6) were also
analyzed by qPCR (data not shown), as previously investigated by
Bai et al (14). This
analysis was performed as an additional validation method of NGS
data, where a discrepancy between NGS and STR data was present.
Results
Ion chips and ACCh panel performance
A total of 7 library pools were loaded and sequenced
on ion chip 314. Each pool was comprised of one donor, one
recipient and one chimera. In addition, three additional pools were
run on ion 316 chip (Table III).
The mean values of performance of the 10 runs and of all samples
are summarized in Table IV.
| Table IVIn-house Ion Torrent Personal Genome
Machine analysis observed average performances using the Ion
AmpliSeq custom chimerism panel on ion 314 and 316 chips. |
Table IV
In-house Ion Torrent Personal Genome
Machine analysis observed average performances using the Ion
AmpliSeq custom chimerism panel on ion 314 and 316 chips.
| A, In-house
observed performance | Ion 314 chip | Ion 316 chip |
|---|
| Ion sphere
particles loading | 84.3% | 70.0% |
| Total bases
(Mb) | 105.1 | 677.0 |
| Total reads | 533,535 | 3,474,065 |
| Reads
on-target | 99.7% | 99.3% |
| Panel
uniformity | 97.6% | 96.0% |
| B, Coverage
performance | Ion 314 chip | Ion 316 chip |
|---|
| Chimera samples -
amplicons over 2,500X | 43/44 range
4,069X–23,944X) | 43/44 (range
4,777X–28,314X) |
| Donor &
recipient samples - amplicons over 50X | 44/44 (range
105X–952X) | 44/44 (range
75X–2328X) |
NGS genotyping performances using the
ACCh panel
A total of 14 DNA samples were genotyped on Ion
Torrent PGM using the ACCh panel with the HP286SNPs bed file.
Regarding the mSNPs, the Variant Caller output identified that 2
mSNPs (rs121893 and rs12612347) were assigned as 'No Call' in over
50.0% of the genotyping runs due to low quality. The remaining 42
mSNPs were successfully genotyped. Concerning the remaining 242
SNPs, 27 SNPs were assigned as 'No Call', with an average of 10
SNPs per patient. The call of these SNPs failed in two Variant
Caller filtering steps: 'Maximum common signal shift' and 'minimum
coverage on either strand'.
Genotyping of all samples was additionally performed
using our tool with the HP286SNPs bed file (Table V). To identify the IRAs, the data
of the donor was compared with the recipient using the tool and
manually cross-validated with the Variant Caller genotypes. Inside
the genotyping calls of 242 SNPs, a small bias was present between
these 2 tools; this is due to the high conserved filters of variant
caller, dedicated predominantly for standard sequencing
applications, and due to the absence of these filters in our custom
tool.
| Table VList of the number of IRAs identified
in each DNA pair using the custom pipeline. |
Table V
List of the number of IRAs identified
in each DNA pair using the custom pipeline.
| DNA pair
'Donor'/'Recipient' | Custom pipeline
| IRA genotypes
| Total IRAs
(%)a |
|---|
| 44 mSNPs | 242 SNPs | Heterozygous | Homozygous |
|---|
| V01/V02 | 15 | 3 | 10 | 8 | 18 (43) |
| V03/V04 | 18 | 4 | 19 | 3 | 22 (52) |
| V05/V06 | 14 | 4 | 14 | 4 | 18 (43) |
| V07/V08 | 13 | 5 | 10 | 8 | 18 (43) |
| V09/V10 | 8 | 3 | 8 | 3 | 11 (26) |
| V02/V01 | 15 | 5 | 12 | 8 | 20 (48) |
| V04/V03 | 7 | 2 | 6 | 3 | 9 (21) |
| V06/V05 | 14 | 2 | 12 | 4 | 16 (38) |
| V08/V07 | 16 | 4 | 12 | 8 | 20 (48) |
| V10/V09 | 19 | 3 | 19 | 3 | 22 (52) |
| pD1/pR1 | 9 | 2 | 9 | 2 | 11 (26) |
| pD2/pR2 | 17 | 4 | 18 | 3 | 21 (50) |
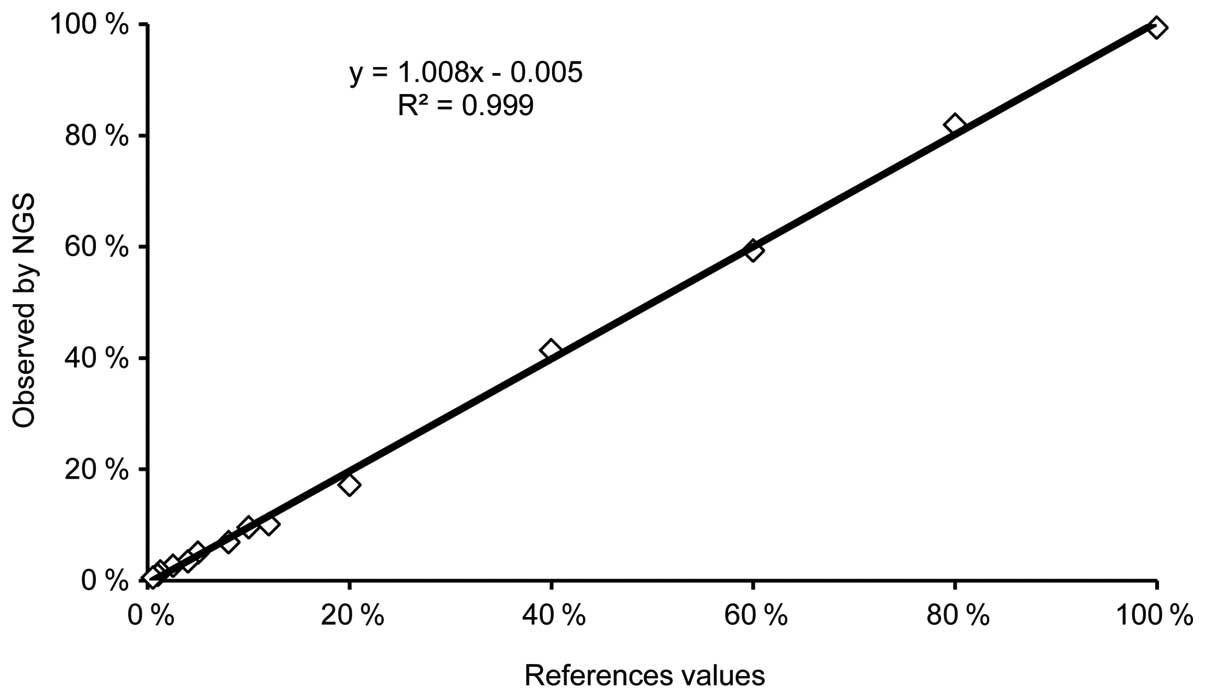
NGS linearity, detection limit and
accuracy with the ACCh panel
In order to test the linearity of Ion Torrent PGM
with the ACCh panel in a fixed detection range (0.5–100.0%), a
series of DNA mixtures was developed, diluting a DNA with its
paired DNA at several percentages of the original. In order to
increase the genetic marker variability in addition to the
biological variability, a total of 12 artificial chimeras
(aCh1–12) were prepared from 5 different DNA pairs.
Finally a pure DNA (V09) was run as 100.0% DNA (aCh13).
Subsequent to Ion Torrent sequencing, using the custom tool,
quantitative data for all IRAs of each artificial chimera were
obtained.
In addition, to increase the putative points in the
dynamic range, the informative alleles of both DNA in the chimeras
aCh12 (40.0% of V09 and 60.0% of V10) and
aCh11 (20.0% of V07 and 80.0% of V08) were calculated
and quantified.
Least-squares analysis of the above putative points
identified a clear linearity (R2=0.999; Y=1.008X-0.005)
between NGS and the reference values (Fig. 2).
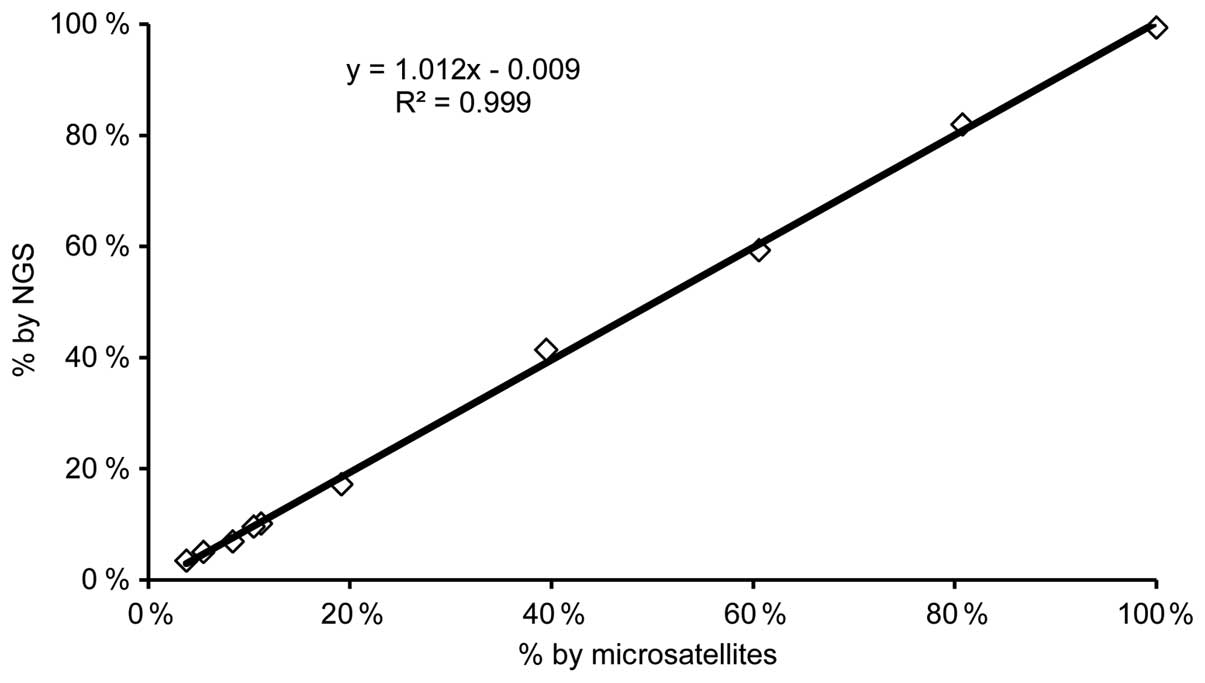
Analyzing the artificial chimeras aCh6–13
by capillary electrophoresis using the STRs markers, chimerism
ranging from 4.0–100.0% was detected. Least-squares analysis
identified a clear linearity (R2=0.999; Y=1.012X-0.009)
between NGS and STRs values (Fig.
3).
In addition, the background of Ion Torrent generated
by the ACCh panel was estimated. In this case, the custom tool was
used, considering the 'donor' samples as chimera. The average
background value at each SNP was estimated at 0.3% (range,
0.0–0.8%) and with a 95.0% confidence interval between 0.1 and
0.5%. Considering the background values and the reported literature
on the error rates at each base of NGS technologies (range from
0.04–1.0%) (15), the detection
limit of the NGS protocol with the ACCh panel was set at 1.0%,
although an artificial chimera was detected at 0.5%.
Finally, considering that the method determined each
chimera, calculating the average value of all IRA, the average
standard error was used as an indirect marker of accuracy, using
the data of all artificial chimeras ranging from 1.0–99.0%
(excluding 0.5 and 100.0%). For the dynamic range of 1.0–20.0% of
chimeras, the average standard error was calculated at 0.3% with a
deviation at 0.2%. For higher values of chimeras, up to 99.0%, the
standard error increased up to 1.8% with a maximum deviation at
2.0%.
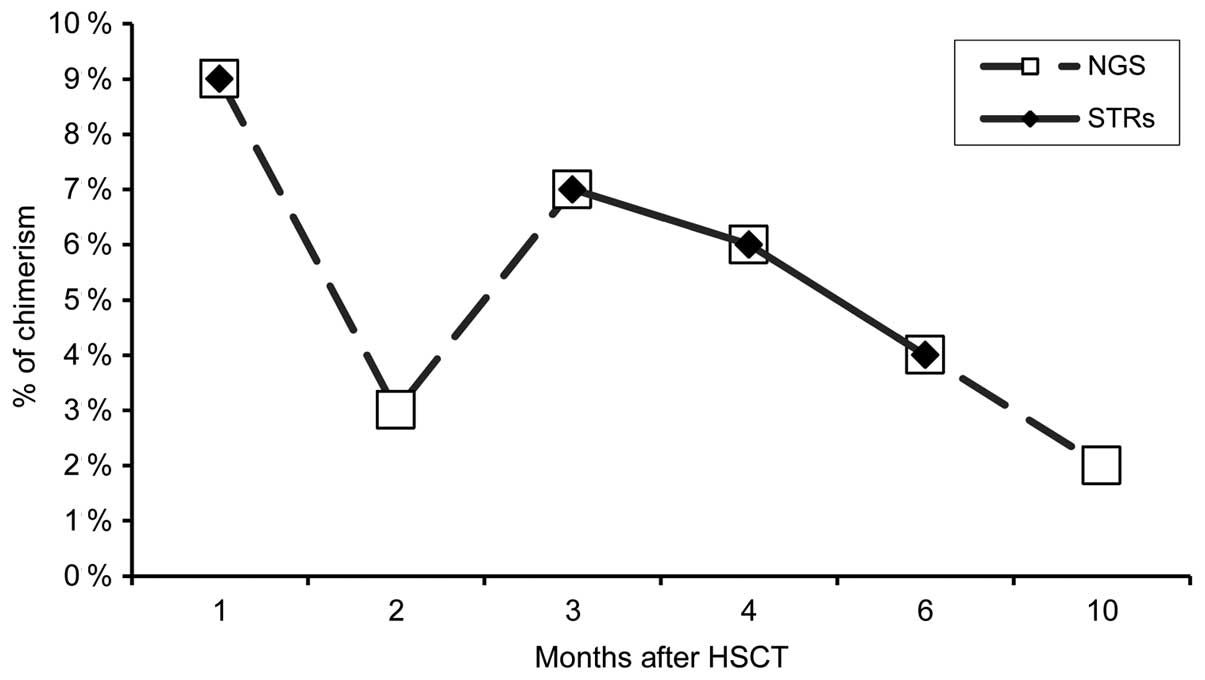
Patient chimerism evaluation on the NGS
platform
Considering the linearity between NGS and reference
values and between NGS and STR values using the standard NGS
workflow and the custom tool, our workflow was tested in 6 samples
of the same patient (pCh1–6) in which the chimerism
quantification report, previously performed by microsatellite
analysis at different times in an external laboratory (Department
of Molecular Medicine, University of Padova, Padova, Italy),
presented at least one CC between two MCs (Table I).
NGS analysis detected a mixed chimerism in all
samples (pCh1, pCh2, pCh3,
pCh4, pCh5 and pCh6) while the
microsatellite analysis only in 4 of them (pCh1,
pCh3, pCh4 and pCh5). For these 4
MC samples, the percentage of predicted chimerism was equal between
the 2 methods of analysis (Fig.
4). In regard to the pCh2 and pCh6
samples, NGS analysis evaluated a mixed chimerism at 3.0 and 2.0%,
respectively (Fig. 4).
To confirm the obtained NGS data for the
pCh2 and pCh6 samples, the NGS analysis was
repeated, and qPCR was additionally perfomed in all patient
samples. The results of qPCR analysis were in agreement with that
of the NGS and microsatellite data for the pCh1,
pCh3, pCh4 and pCh5, and confirmed
the NGS data for the pCh2 and pCh6
samples.
Discussion
NGS technologies have revolutionized the field of
genomics, and its application has been extended to different fields
such as clinical diagnostics and forensic science (15–17).
As a result of the continuous development of NGS, several
applications previously performed on Sanger sequencing with
capillary electrophoresis have been transferred onto the NGS
platform, enabling fast and cost-effective generation sequence data
with high resolution and accuracy. For this reason, different
panels are being developed for the sequencing of genetic mutations
involved in human diseases (e.g. MiSeqDx Cystic Fibrosis Clinical
Sequencing Assay; Illumina, Inc., San Diego, CA, USA) or in cancer
(Ion AmpliSeq BRCA1 and BRCA2 Panel; Life Technologies; Thermo
Fisher Scientific, Inc.).
In the field of chimerism quantification by NGS
platforms, Debeljak et al (18) reported an innovative and well
performed study, using haplotype counting. In addition, Kim et
al (19) briefly reported a
relative quantification analysis of SNP markers by NGS in one human
bone marrow chimerism sample. However, the study by Kim et
al (19) was conducted in a
4.9% chimerism sample without any detail concerning the limit of
detection, the technical error or additional important technical
information and validation data of NGS application in chimerism
quantification.
In the present study, a full workflow was designed,
and the proposed protocols and a bioinformatics tool were tested
for chimerism quantification by NGS. A 44-amplicon custom chimerism
panel based on Ion AmpliSeq technology was designed, and in
addition a bioinformatics tool dedicated to the genotyping and
quantification of NGS data was coded. These resources were created
in order to provide a novel tool for the evaluation of the
chimerism following allogenic HSCT, thus potentially increasing the
number of clinical analyses supported on NGS platforms.
The ACCh proposed panel is composed of 44 amplicons,
containing 44 selected mSNPs, of which 2 mSNPs are located in
different regions of each somatic chromosome. It is suggested that
the different mSNP locations in all somatic chromosome may be
useful to avoid predominantly false negatives results caused by
chromosomal deletions characteristic of certain malignancies
(20). In addition, the bed file
uploaded in the custom tool, containing all targeted SNPs, can be
modified in order to exclude the SNPs present in chromosome target
regions subjected to deletions in a specific patient.
The panel average heterozygosity was assessed around
0.5 for the European population in order to obtain different
informative markers for each transplanting pair, for a more precise
and robust quantification. The theoretical panel informativity for
unrelated donor:recipient values, calculated according to the data
present on the NCBI dbSNPs database, was estimated to be
approximately 16/42 mSNPs, while for siblings the informativity was
estimated at 50.0% (approximately 8/42 mSNPs). In order to increase
the informativity of the ACCh panel, an additional 242 selected
SNPs present in the targeted regions were included in the bed file.
This addition of SNPs experimentally increased the average
informativity (Table V).
The ACCh panel reached the limit of detection on the
Ion Torrent PGM platform of 0.5%, however, this was updated to the
conservative value of 1.0% for two reasons: i) The Ion Torrent
error is defined to be between 0.04 and 1.0% (21); and ii) the background of the ACCh
panel, based on the IRA data of our experiments, ranges between 0.1
and 0.5%.
Regarding the timing of chimerism analysis, the UK
NEQAS Consortium has recommended that results should be assessed in
5 working days from the reception of the sample and in 3 working
days for urgent requests (6). The
protocol suggested in the current study is feasible in 2 days; the
first day for library preparation and quantification and the second
for template preparation, run sequence and data analysis. In
addition, due to the fact the ACCh protocol suggested in the
current study does not present any differences from the standard
AmpliSeq Library Preparation and Ion Torrent PGM Run Sequence
protocols, it is possible to introduce it to a standard manual
library preparation workflow or in a library preparation
workstation.
Considering the AmpliSeq library construction
protocol (based on multiplex PCR) from Life Technologies (Thermo
Fisher Scientific, Inc.), the same concept could be tested on
additional NGS platforms, such as Illumina or Roche, according to
their library preparation protocols. Concerning the custom
bioinformatics tool, any bam and bai file coupled by a bed file,
generated from any platform could be used.
At present, the cost of NGS analysis, compared with
microsatellite methods, remains high, however considering the
continuously reducing cost per NGS run, an NGS-based method for
chimerism quantification could be evaluated in the future for its
adoption in laboratories with a high volume of activity, and with
NGS platforms already in use for other purposes. Although the
present study reported a clear correlation between NGS and STR
methods and identifed important technical details, further
experimental replications are required in order for the NGS
protocol to be validated for future laboratory use.
Acknowledgments
The current study was supported by a grant from the
Institute of Maternal and Child Health-IRCCS 'Burlo Garofolo'
(grant no. RC 16-2014). The authors would like to thank Dr Erika
Ferrari for assistance with SNP data crosschecking.
References
|
1
|
Gratwohl A, Baldomero H, Gratwohl M,
Aljurf M, Bouzas LF, Horowitz M, Kodera Y, Lipton J, Iida M,
Pasquini MC, et al: Quantitative and qualitative differences in use
and trends of hematopoietic stem cell transplantation: A Global
Observational Study. Haematologica. 98:1282–1290. 2013. View Article : Google Scholar : PubMed/NCBI
|
|
2
|
Passweg JR, Baldomero H, Gratwohl A,
Bregni M, Cesaro S, Dreger P, de Witte T, Farge-Bancel D, Gaspar B,
Marsh J, et al: The EBMT activity survey: 1990–2010. Bone Marrow
Transplant. 47:906–923. 2012. View Article : Google Scholar : PubMed/NCBI
|
|
3
|
Oshrine BR, Olson TS and Bunin N: Mixed
chimerism and graft loss in pediatric recipients of an
alemtuzumab-based reduced-intensity conditioning regimen for
non-malignant disease. Pediatr Blood Cancer. 61:1852–1859. 2014.
View Article : Google Scholar : PubMed/NCBI
|
|
4
|
Lawler M, McCann SR, Marsh JC, Ljungman P,
Hows J, Vandenberghe E, O'Riordan J, Locasciulli A, Socié G, Kelly
A, et al: Serial chimerism analyses indicate that mixed
haemopoietic chimerism influences the probability of graft
rejection and disease recurrence following allogeneic stem cell
transplantation (SCT) for severe aplastic anaemia (SAA): Indication
for routine assessment of chimerism post SCT for SAA. Br J
Haematol. 144:933–945. 2009. View Article : Google Scholar : PubMed/NCBI
|
|
5
|
Terwey TH, Hemmati PG, Nagy M, Pfeifer H,
Gökbuget N, Brüggemann M, Le Duc TM, le Coutre P, Dörken B and
Arnold R: Comparison of chimerism and minimal residual disease
monitoring for relapse prediction after allogeneic stem cell
transplantation for adult acute lymphoblastic leukemia. Biol Blood
Marrow Transplant. 20:1522–1529. 2014. View Article : Google Scholar : PubMed/NCBI
|
|
6
|
Clark JR, Scott SD, Jack AL, Lee H, Mason
J, Carter GI, Pearce L, Jackson T, Clouston H, Sproul A, et al:
Monitoring of chimerism following allogeneic haematopoietic stem
cell transplantation (HSCT): Technical recommendations for the use
of short tandem repeat (STR) based techniques, on behalf of the
United Kingdom national external quality assessment service for
leucocyte immunophenotyping chimerism working group. Br J Haematol.
168:26–37. 2015. View Article : Google Scholar
|
|
7
|
Bader P, Kreyenberg H, Hoelle W, Dueckers
G, Handgretinger R, Lang P, Kremens B, Dilloo D, Sykora KW,
Schrappe M, et al: Increasing mixed chimerism is an important
prognostic factor for unfavorable outcome in children with acute
lymphoblastic leukemia after allogeneic stem-cell transplantation:
Possible role for pre-emptive immunotherapy? J Clin Oncol.
22:1696–1705. 2004. View Article : Google Scholar : PubMed/NCBI
|
|
8
|
Gineikiene E, Stoskus M and Griskevicius
L: Single nucleotide polymorphism-based system improves the
applicability of quantitative PCR for chimerism monitoring. J Mol
Diagn. 11:66–74. 2009. View Article : Google Scholar :
|
|
9
|
Lion T, Watzinger F, Preuner S, Kreyenberg
H, Tilanus M, de Weger R, van Loon J, de Vries L, Cavé H, Acquaviva
C, et al: The EuroChimerism concept for a standardized approach to
chimerism analysis after allogeneic stem cell transplantation.
Leukemia. 26:1821–1828. 2012. View Article : Google Scholar : PubMed/NCBI
|
|
10
|
Pareek CS, Smoczynski R and Tretyn A:
Sequencing technologies and genome sequencing. J Appl Genet.
52:413–435. 2011. View Article : Google Scholar : PubMed/NCBI
|
|
11
|
Xuan J, Yu Y, Qing T, Guo L and Shi L:
Next-generation sequencing in the clinic: Promises and challenges.
Cancer Lett. 340:284–295. 2013. View Article : Google Scholar
|
|
12
|
Ladetto M, Brüggemann M, Monitillo L,
Ferrero S, Pepin F, Drandi D, Barbero D, Palumbo A, Passera R,
Boccadoro M, et al: Next-generation sequencing and real-time
quantitative PCR for minimal residual disease detection in B-cell
disorders. Leukemia. 28:1299–1307. 2014. View Article : Google Scholar
|
|
13
|
Lawrence M, Huber W, Pagès H, Aboyoun P,
Carlson M, Gentleman R, Morgan MT and Carey VJ: Software for
computing and annotating genomic ranges. PLoS Comput Biol.
9:e10031182013. View Article : Google Scholar : PubMed/NCBI
|
|
14
|
Bai L, Deng YM, Dodds AJ, Milliken S,
Moore J and Ma DD: A SYBR green-based real-time PCR method for
detection of haemopoietic chimerism in allogeneic haemopoietic stem
cell transplant recipients. Eur J Haematol. 77:425–431. 2006.
View Article : Google Scholar : PubMed/NCBI
|
|
15
|
Mwaigwisya S, Assiri RA and O'Grady J:
Emerging commercial molecular tests for the diagnosis of
bloodstream infection. Expert Rev Mol Diagn. 15:681–692. 2015.
View Article : Google Scholar : PubMed/NCBI
|
|
16
|
D'Argenio V, Esposito MV, Telese A,
Precone V, Starnone F, Nunziato M, Cantiello P, Iorio M,
Evangelista E, D'Aiuto M, et al: The molecular analysis of BRCA1
and BRCA2: Next-generation sequencing supersedes conventional
approaches. Clin Chim Acta. 446:221–225. 2015. View Article : Google Scholar : PubMed/NCBI
|
|
17
|
Børsting C and Morling N: Next generation
sequencing and its applications in forensic genetics. Forensic Sci
Int Genet. 18:78–89. 2015. View Article : Google Scholar : PubMed/NCBI
|
|
18
|
Debeljak M, Freed DN, Welch AJ, Haley L,
Beierl K, Iglehart BS, Pallavajjala A, Gocke CD, Leffell MS, Lin
MT, et al: Haplotype counting by next-generation sequencing for
ultrasensitive human DNA detection. J Mol Diagn. 16:495–503. 2014.
View Article : Google Scholar : PubMed/NCBI
|
|
19
|
Kim J, Hwang IS, Kim HS, Joo DJ, Hong KR
and Choi JR: Bone marrow chimerism detection using next generation
sequencing based on single nucleotide polymorphisms following liver
transplantation: Comparison with short tandem repeat-PCR. Ann Lab
Med. 36:82–84. 2016. View Article : Google Scholar :
|
|
20
|
Chen DP, Tsai SH, Tseng CP, Wu TL, Chang
PY and Sun CF: Bone marrow transplant relapse with loss of an
allele. Clin Chim Acta. 387:161–164. 2008. View Article : Google Scholar
|
|
21
|
Bragg LM, Stone G, Butler MK, Hugenholtz P
and Tyson GW: Shining a light on dark sequencing: Characterizing
errors in Ion Torrent PGM data. PLoS Comput Biol. 9:e10030312013.
View Article : Google Scholar
|