Introduction
Atherosclerosis is a chronic inflammatory disease
which mainly results from the abnormal accumulation of macrophages,
white blood cells and lipids in the artery wall, and eventually
form mature plaques (1). It causes
various types of cardiovascular disease, which account for ~50% of
all mortalities worldwide (2). To
date, the underlying molecular pathogenesis of atherosclerosis has
remained largely elusive. An understanding of the molecular basis
of atherosclerotic processes is crucial for the development of
potential therapeutic strategies.
Atherosclerosis is characterized by endothelial
dysfunction, vascular inflammation, plaque formation and diminished
oxygen supply to target organs (3,4).
Endothelial dysfunction is an initial step in atherosclerosis.
Dysfunctional endothelial cells release a large variety of
pro-inflammatory mediators, leading to the amplification of
inflammatory response (5,6), and systemic inflammation may in turn
contribute to endothelial dysfunction and accelerated
atherosclerosis (7,8). Considering the crucial roles of
inflammation in the pathogenesis of atherosclerosis, systemic
markers of inflammation may be the most obvious candidates for
potential biomarkers for early diagnosis, risk prediction and
clinical prognosis of this disease (9). C-reactive protein has been implicated
in multiple aspects of atherosclerosis and is currently the best
validated inflammatory biomarker to predict the risk of
atherosclerotic events (10,11).
Fibrinogen, apolipoproteins and interleukins are associated with
the progression of atherosclerosis and have a great relevance in
risk prediction (12).
Inflammatory molecules, including intercellular adhesion molecule-1
and vascular cell adhesion molecule-1, are also considered as
biomarkers for risk prediction of atherosclerosis (11,13).
Several studies have identified a large number of biomarkers with
potential prognostic value for atherosclerosis; their overall
clinical predictive value, however, is modest (14). Therefore, it is urgently required
to identify a reliable, specific and cost-effective biomarker for
facilitating the clinical diagnosis of atherosclerosis.
The microarray dataset no. GSE20129 from the Gene
Expression Omnibus database (GEO; http://www.ncbi.nlm.nih.gov/geo/) has been utilized to
reveal variations in gene expression associated with coronary
artery calcification between Caucasian and African Americans based
on a multi-ethnic study of atherosclerosis (15); furthermore, the dataset has been
used to reveal systemic transcriptional alterations of innate and
adaptive immune signaling pathways in atherosclerosis (16). The present study used the
microarray dataset GSE20129 to identify differentially expressed
genes (DEGs) associated with atherosclerosis using comprehensive
bioinformatics methods. In addition, the recursive feature
elimination (RFE) algorithm was applied for feature selection via
iterative classification, and the support vector machine (SVM)
classifier was used for the validation of prediction accuracy. The
present study aimed to identify potential biomarkers for
atherosclerosis via analysis of gene expression profiles.
Materials and methods
Microarray data
The array dataset GSE20129, which was provided by
Huang et al (15), was
downloaded from the GEO database. A total of 118 samples from the
peripheral blood of females, including 47 atherosclerotic and 71
non-atherosclerotic patients, was used for expression profiling.
The raw CEL data and annotation files were obtained based on the
Illumina human Ref-8 v2.0 expression beadchip platform (Illumina
Inc., San Diego, CA, USA) for subsequent analyses.
Data processing and screening of
DEGs
All probe IDs of the dataset were transformed into
gene symbols based on probe annotation files. If multiple probes
corresponded to the same gene symbol, the mean value was calculated
as the expression value of this gene. Z-score normalization of
expression values was preformed and then the expression value (X)
of each sample was corrected. The corrected expression value (X′)
was calculated as follows: X′=(X-mean)/standard deviation.
The DEGs in samples from atherosclerotic patients
compared with those in non-atherosclerotic patients were screened
using the Limma package (http://www.biocon-ductor.org/packages/release/bioc/html/limma.html)
(17) in R. P<0.01 was defined
as the cut-off value for DEG screening.
Unsupervised hierarchical clustering
analysis
Unsupervised hierarchical clustering analysis
(18) for DEGs was performed to
effectively distinguish atherosclerotic and non-atherosclerotic
samples using cluster 3.0 (19)
and to visualize these samples using the heatmap tool in TreeView
(20). Filtering and normalization
of all the expression data were performed using cluster 3.0. Genes
with expression in at least 80% of all samples were retained, while
others were discarded. All of the genes and samples were median
centered (21) and normalized. The
similarity matrixes were correlation centered (22) and normalized.
Functional enrichment analyses
The Gene Ontology (GO) tool (23) provides functional annotations for
large-scale genomic or transcription data. The Kyoto Encyclopedia
of Genes and Genomes database (KEGG; http://www.genome.ad.jp/kegg/) (24) holds information on pathways and
networks of molecules or genes. The Database for Annotation,
Visualization and Integrated Discovery (DAVID; http://david.abcc.ncifcrf.gov/) software
(25) is an integrated biological
database and analytic tool for systematic annotation of biological
meaning for large lists of genes or proteins.
To understand the biological significance of DEGs,
GO term and KEGG pathway analyses for up-and downregulated DEGs
were performed using the DAVID online tool. The significance
threshold was set at P<0.05.
Feature selection with the RFE
algorithm
Feature selection offers classification models with
high relevance by eliminating irrelevant features (26). In order to obtain candidates for
diagnostic and prognostic biomarkers of atherosclerosis, the RFE
algorithm (27,28) in python was applied for feature
selection from the constellation of DEGs via iterative
classification. Classification analyses were performed using a
linear Support Vector Classification (SVC; linear kernel, step=1;
cross-validation=5) provided by the python module scikit-learn
(29). This recursive procedure
adopted a backward elimination strategy to iteratively remove
irrelevant features and was iterated until all relevant features
were obtained.
Prediction with SVM classifier
All of the relevant features were processed with a
linear SVM classifier (30) for
classification prediction, which was repeated five times. Linear
kernel and five-fold cross-validation of all samples were performed
in this prediction procedure to assess classification performance.
To further illustrate the prediction accuracy of this method, a
receiver operating characteristic curve (ROC) was implemented and
the area under curve (AUC) was calculated.
Results
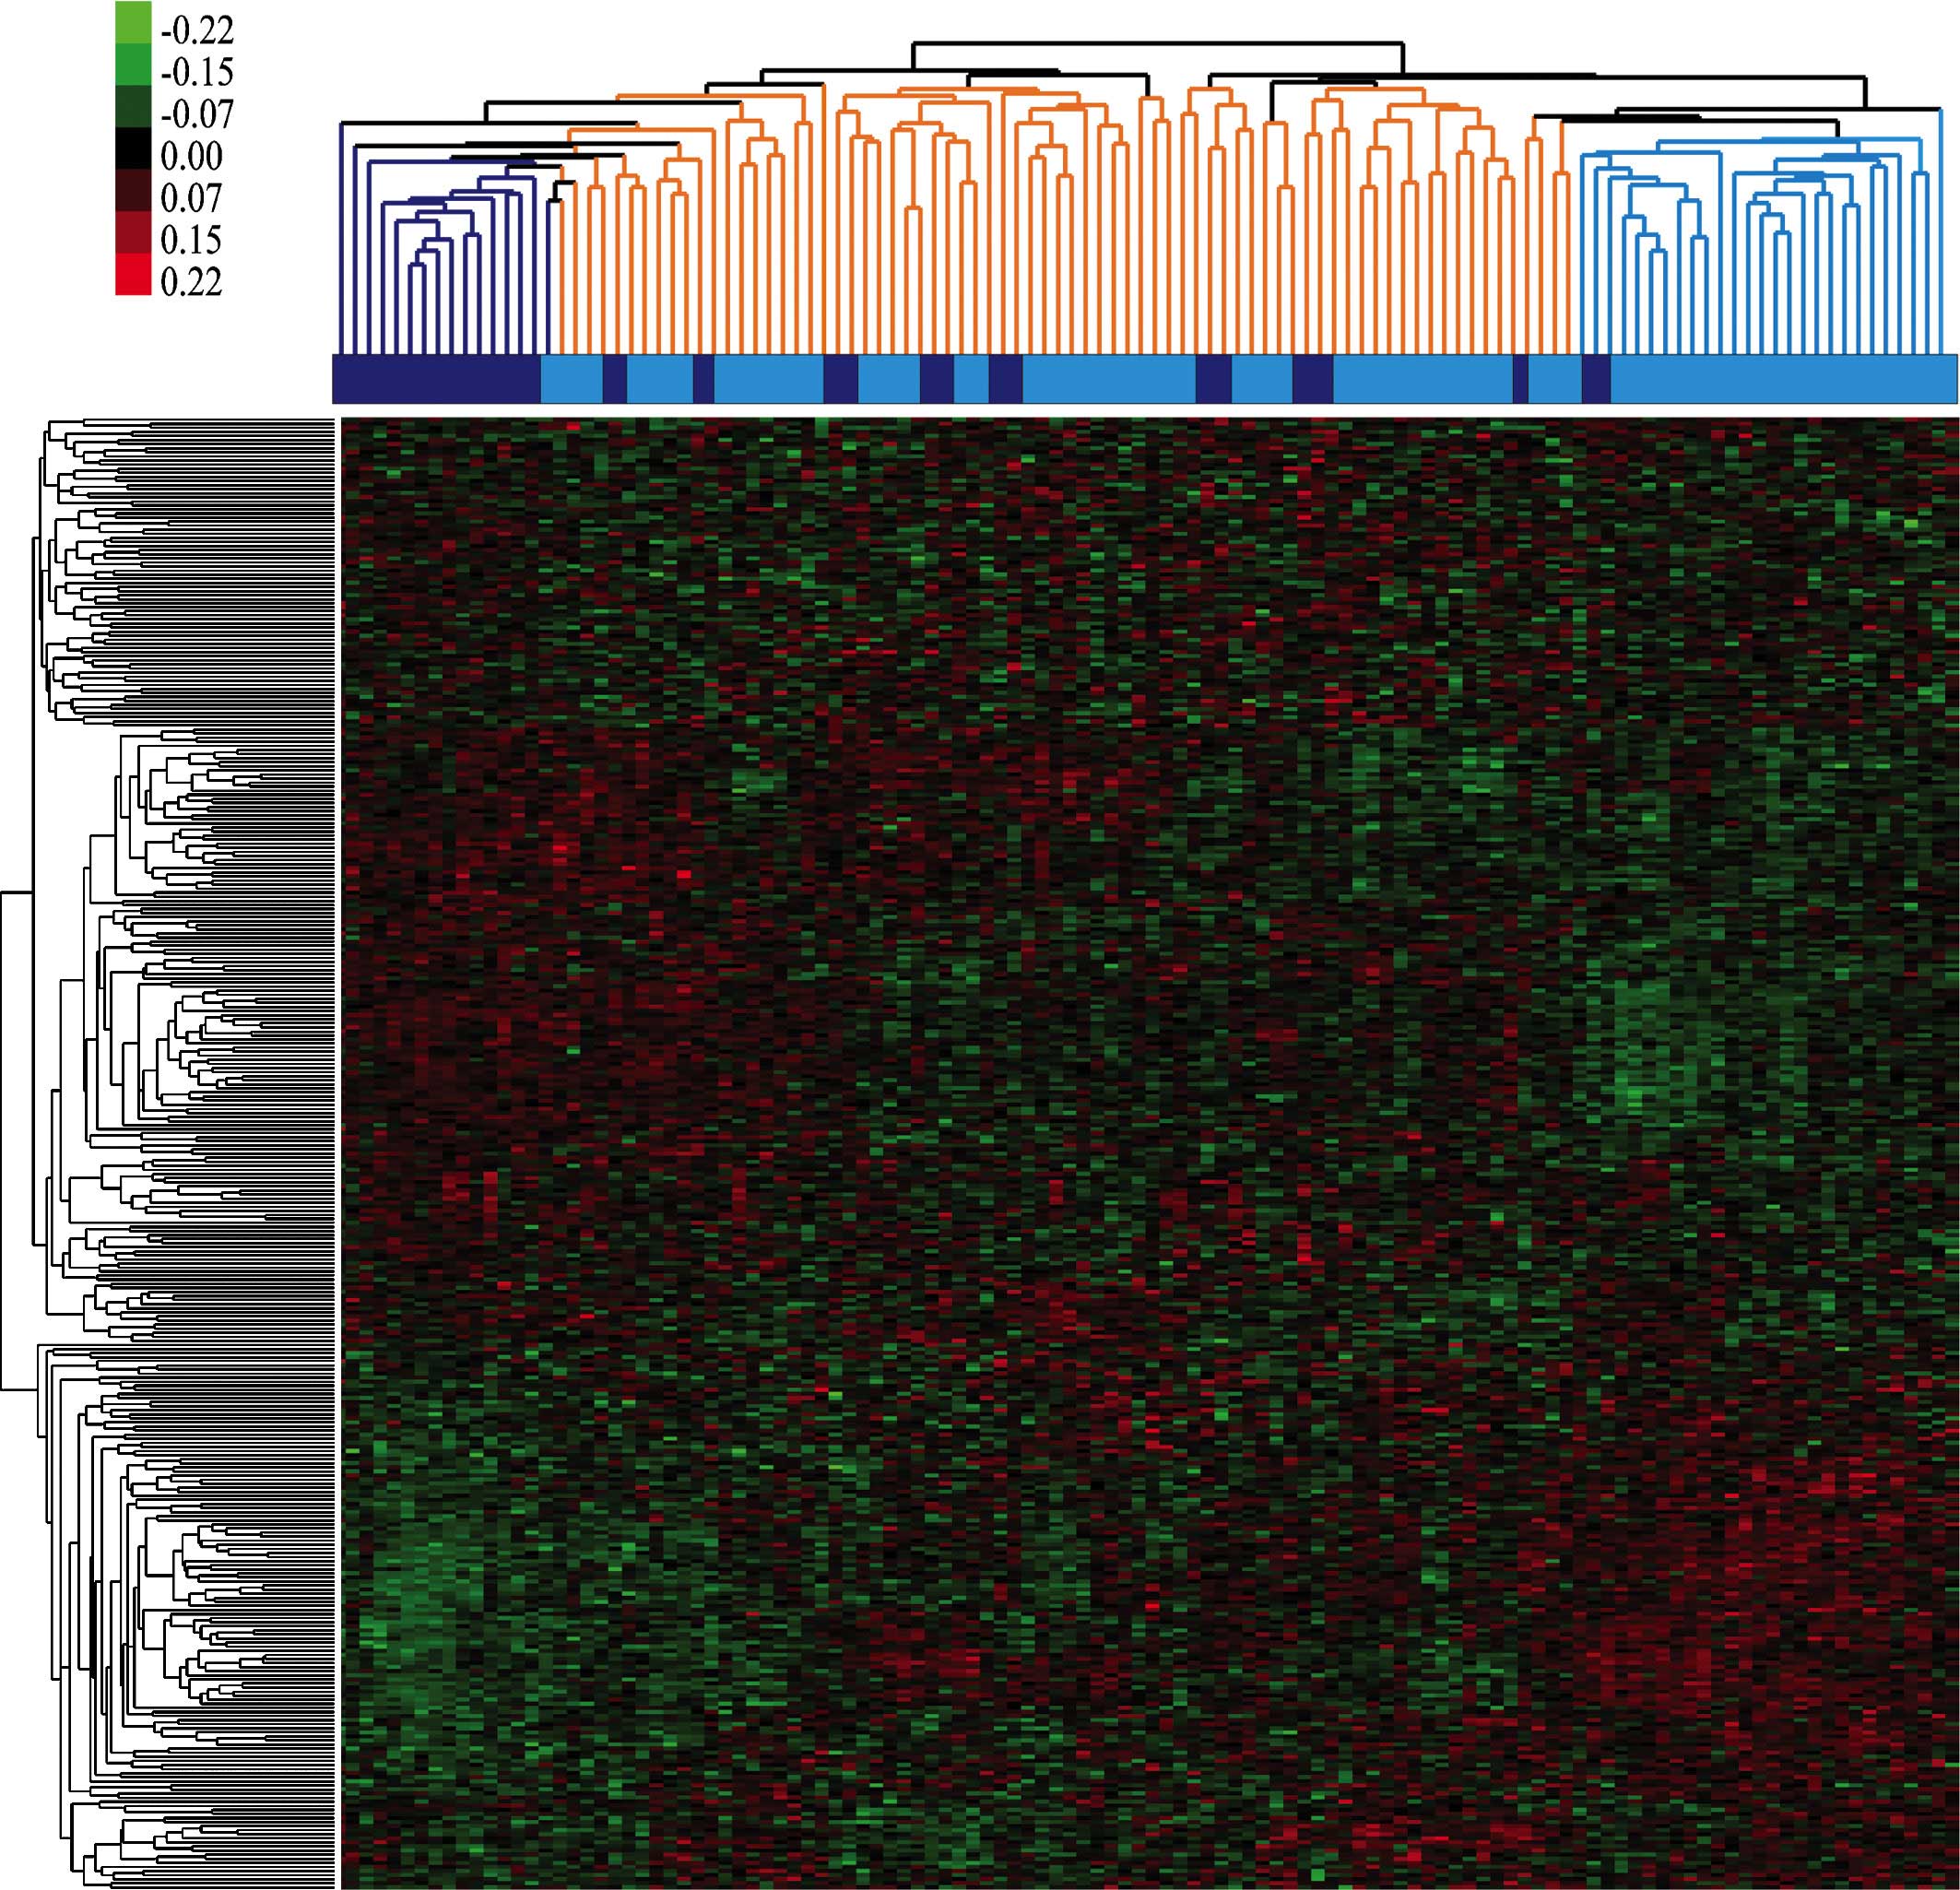
DEG screening and hierarchical clustering
analysis
Based on probe annotation files, a total of 18,196
gene symbols were acquired after transformation. A total of 430
DEGs with P<0.01 were screened using the Limma package,
including 149 upregulated and 281 downregulated genes. The results
of the unsupervised hierarchical clustering analysis were
visualized in a heatmap (Fig.
1).
Functional enrichment analyses
Functional enrichment analyses for DEGs were
performed using DAVID, and the significantly enriched GO terms and
KEGG pathways are shown in Tables
I and II, respectively.
According to the enrichment results, the over-represented GO terms
of upregulated genes were mainly associated with ribonucleoprotein
complex biogenesis, ribosome biogenesis and positive regulation of
T-cell proliferation, while downregulated genes were mainly
associated with response to lipopolysaccharides, immune response
and responses to molecules of bacterial origin (Table I). In addition, upregulated genes
were significantly enriched in viral myocarditis and purine
metabolism, while downregulated genes were significantly involved
in leukocyte transendothelial migration and the Notch signaling
pathway (Table II).
 | Table IOver-represented GO terms enriched by
differentially expressed genes. |
Table I
Over-represented GO terms enriched by
differentially expressed genes.
| Term | Count | P-value |
|---|
| Upregulated
genes | | |
| GO:0022613 -
Ribonucleoprotein complex biogenesis | 6 | 0.010748 |
| GO:0042254 -
Ribosome biogenesis | 5 | 0.012705 |
| GO:0042102 -
Positive regulation of T-cell proliferation | 3 | 0.033574 |
| GO:0007010 -
Cytoskeletal organization | 8 | 0.042602 |
| GO:0006941 -
Striated muscle contraction | 3 | 0.045367 |
| Downregulated
genes | | |
| GO:0032496 -
Response to lipopolysaccharides | 7 |
9.36×10⁻⁴ |
| GO:0006955 -
Immune response | 22 | 0.001271 |
| GO:0002237 -
Response to molecules of bacterial origin | 7 | 0.001665 |
| GO:0009611 -
Response to wounding | 18 | 0.002148 |
| GO:0002684 -
Positive regulation of immune system processes | 11 | 0.002768 |
| GO:0001892 -
Embryonic placenta development | 4 | 0.005054 |
| GO:0045936 -
Negative regulation of phosphate metabolic processes | 5 | 0.005334 |
| GO:0010563 -
Negative regulation of phosphorus metabolic processes | 5 | 0.005334 |
| GO:0050778 -
Positive regulation of immune response | 8 | 0.005621 |
| GO:0042127 -
Regulation of cell proliferation | 22 | 0.005981 |
| GO:0006954 -
Inflammatory response | 12 | 0.008674 |
| Table IISignificantly enriched Kyoto
Encyclopedia of Genes and Genomes pathways among differentially
expressed genes. |
Table II
Significantly enriched Kyoto
Encyclopedia of Genes and Genomes pathways among differentially
expressed genes.
| Term | Count | P-value |
|---|
| Upregulated | | |
| hsa05416: Viral
myocarditis | 3 | 0.02366 |
| hsa00230: Purine
metabolism | 4 | 0.03880 |
| Downregulated | | |
| hsa04670:
Leukocyte transendothelial migration | 7 | 0.01940 |
| hsa04330: Notch
signaling pathway | 4 | 0.04248 |
Feature selection with the RFE algorithm
and prediction with SVM classifier
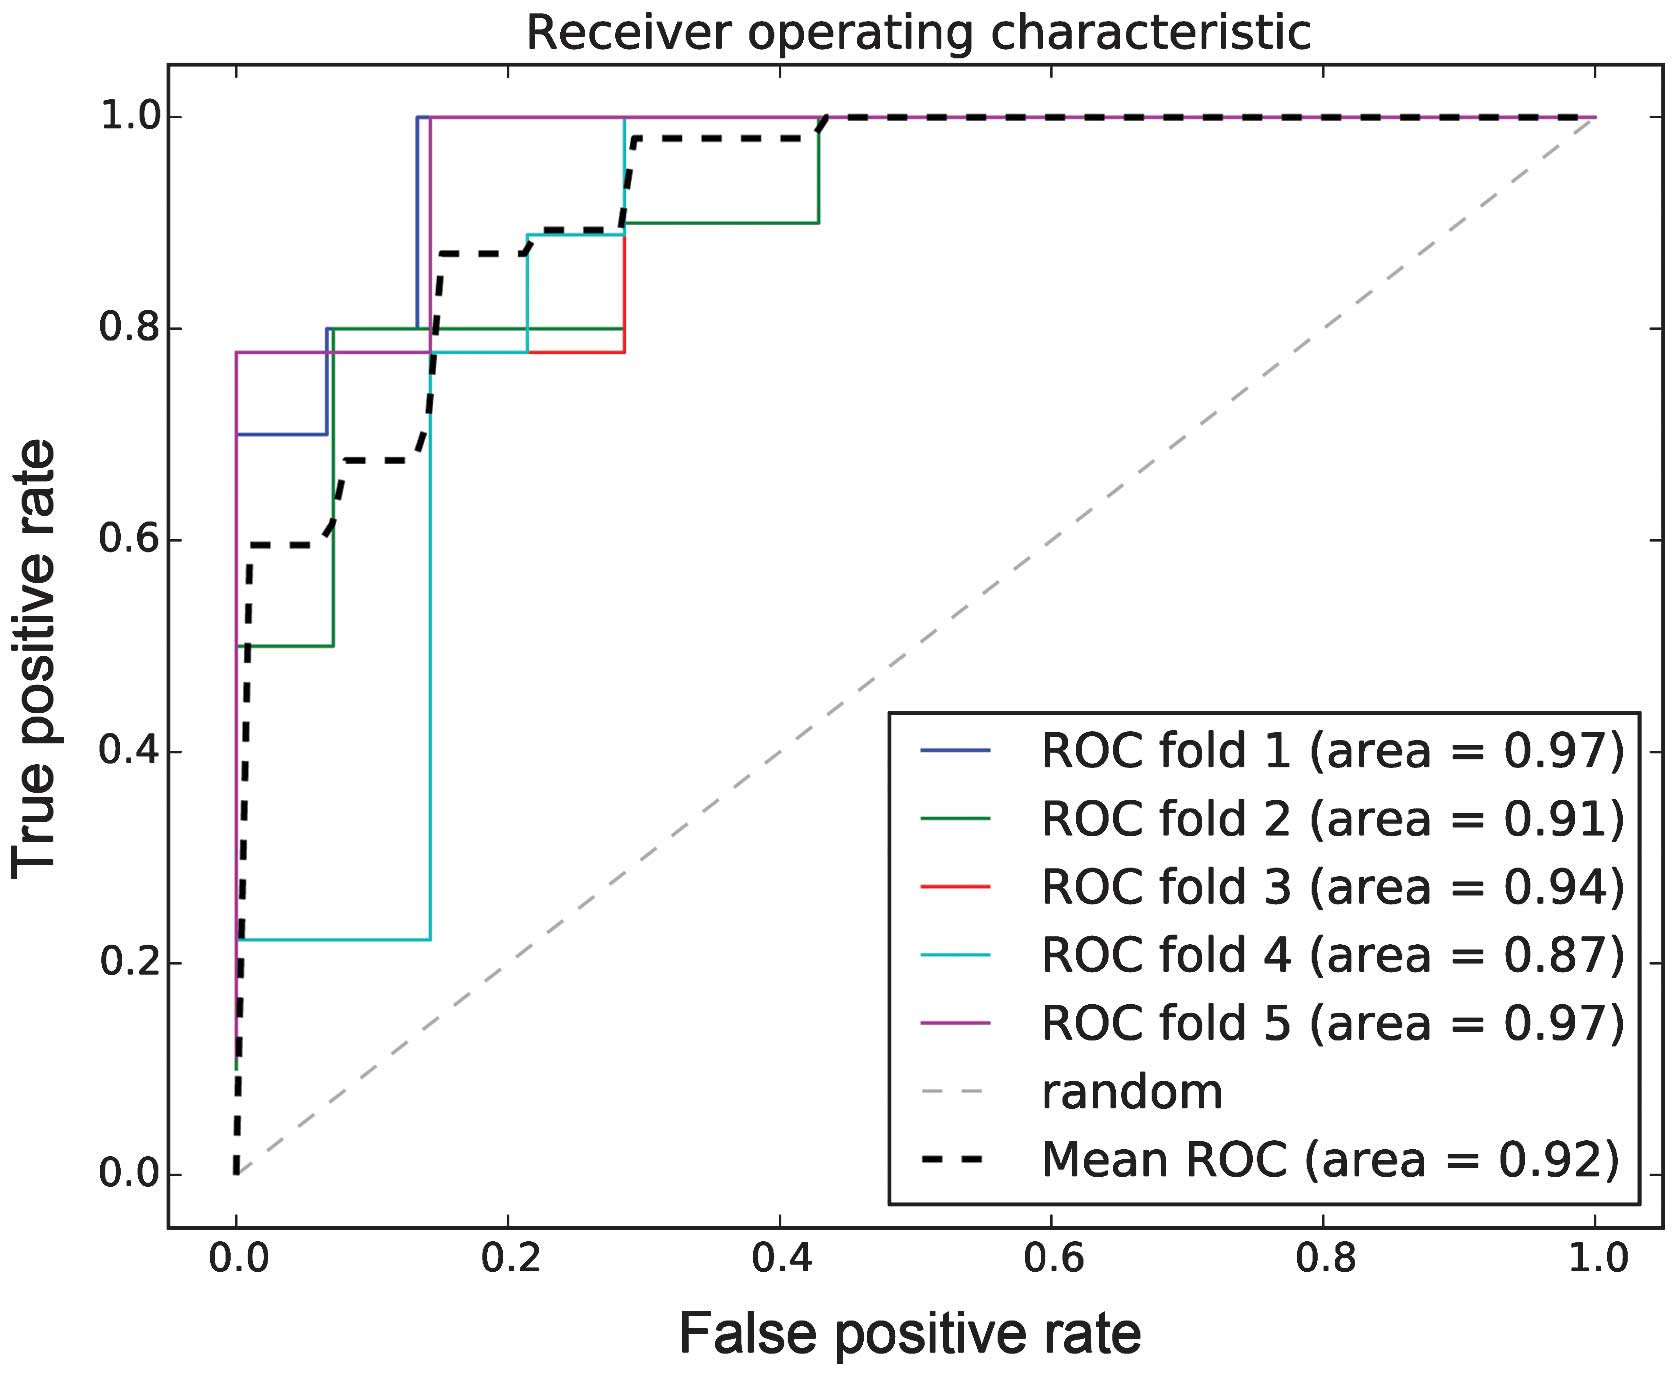
By applying the RFE algorithm, a total of 11
biomarkers were obtained, including APH1B, JAM3, FBLN2, CSAD and
PSTPIP2 (Table III). These 11
biomarkers were then processed with the SVM classifier for
classification prediction. The AUC of the ROC obtained with the SVM
classifier was calculated as 0.92 (Fig. 2), indicating that the identified 11
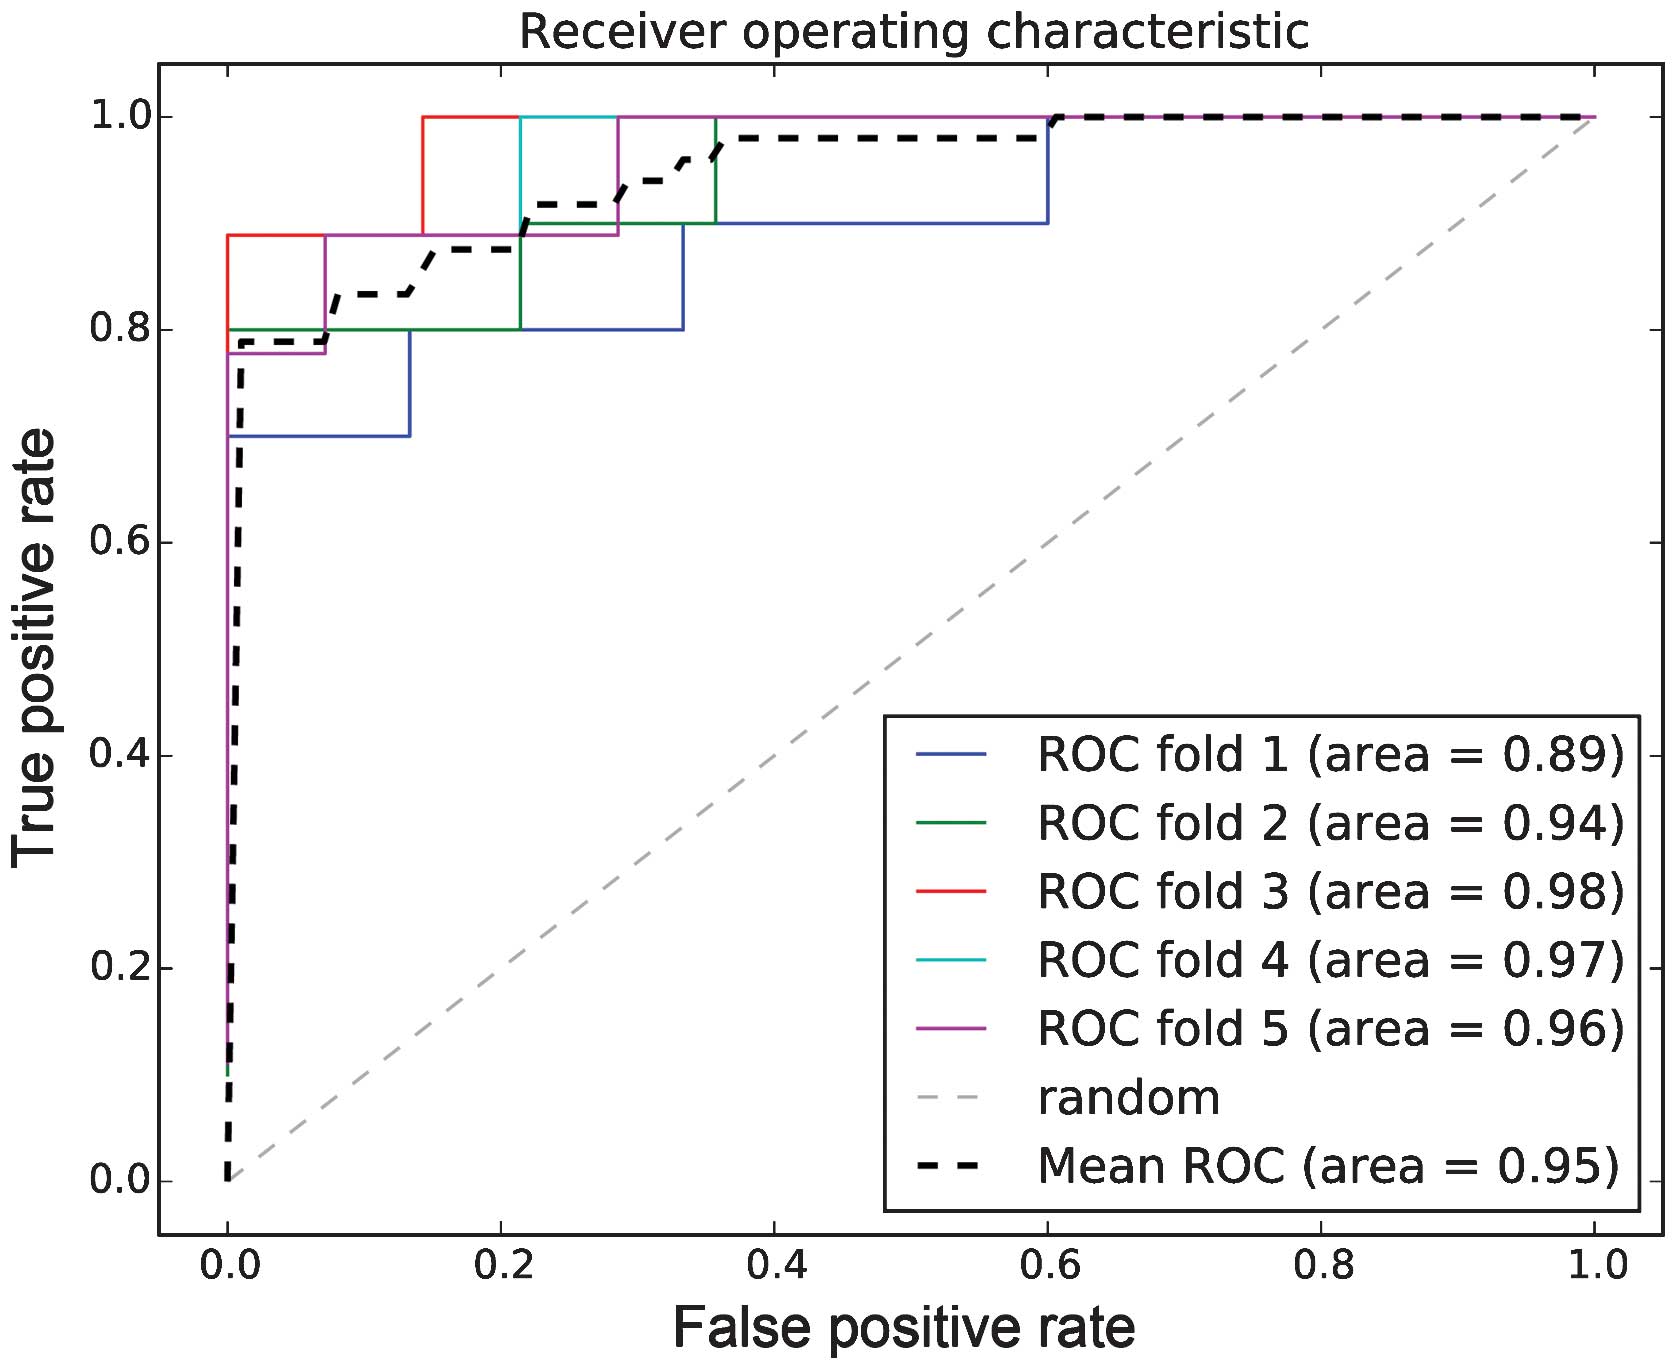
biomarkers were representative. In order to verify that the
biomarkers that we screened were representative for the DEGs in
atherosclerotic patients, all 430 DEGs were processed with the SVM
classifier, resulting in an AUC of the ROC of 0.95 (Fig. 3), which confirmed that the 11
biomarkers were representative as the prediction accuracy of the
identified 11 biomarkers was markedly higher than the randomly
selected 11 DEGs. In addition, to rule out any randomization, the
11 DEGs were randomly selected as features which were subjected to
the process of classification for 100,000 times, and the AUC of
every step was calculated. The results showed that the rank
position of the AUC corresponding to 11 biomarkers screened was 33
(P=0.0033), suggesting that the prediction accuracy of the screened
biomarkers was significantly higher than that of random
results.
| Table IIIBiomarkers screened using the
recursive feature elimination algorithm. |
Table III
Biomarkers screened using the
recursive feature elimination algorithm.
| Biomarker | P-value | logFC |
|---|
| APH1B |
5.81×10⁻⁴ | −0.089736 |
| HIATL1 |
1.44×10⁻³ | −0.111004 |
| JAM3 |
2.24×10⁻³ |
0.164411 |
| HOXB13 |
2.25×10⁻³ | −0.031921 |
| FBLN2 |
2.35×10⁻³ |
0.049115 |
| RNF148 |
2.82×10⁻³ | −0.030481 |
| RALB |
2.84×10⁻³ | −0.093036 |
| CPEB3 |
3.07×10⁻³ | −0.059267 |
| ABHD14B |
6.30×10⁻³ |
0.069626 |
| CSAD |
7.75×10⁻³ | −0.041617 |
| PSTPIP2 |
9.45×10⁻³ | −0.096693 |
Discussion
Atherosclerosis is the proximate cause of occlusive
arterial disease (31).
Identification of potential biomarkers that have crucial roles in
the progression of atherosclerosis is important for the development
of therapeutic approaches. In the present study, a bioinformatics
approach was used to predict potential biomarkers for the diagnosis
and treatment of atherosclerosis. The screening of gene expression
profiles of atherosclerotic patients identified 11 biomarkers,
including APH1B, JAM3, FBLN2, CSAD and PSTPIP2, and the AUC of the
ROC obtained using SVM classifier was calculated as 0.92, which
indicated that these 11 biomarkers were representative. The crucial
roles of these genes in the pathogenesis of atherosclerosis and
their potential diagnostic and therapeutic values for this disease
warrant further evaluation.
APH1B is a functional component of the
gamma-secretase enzyme complex, which catalyzes the cleavage of
transmembrane proteins such as Notch receptors and amyloid-b
precursor protein (APP) (32).
Notch activation induces senescence of endothelial cells and
results in pro-inflammatory responses, and Notch signaling has
pivotal roles in the pathogenesis of atherosclerosis (33). Blockade of Notch ligand delta-like
4 - Notch signaling attenuates the development of atherosclerosis
(34). APP has also been found to
have a potential pathogenic role in carotid atherogenesis (35). In addition, the single-nucleotide
polymorphism Phe217Leu (rs1047552; T>G) in the APH1B gene is
associated with premature coronary atherosclerosis (36). It can therefore be speculated that
APH1B may be implicated in the progression of atherosclerosis and
function as a biomarker for risk prediction.
Junctional adhesion molecule 3 (JAM3) is a member of
vascular adhesion molecules, which mediate adhesion and
interactions among cells or between cells and the extracellular
matrix (37). Increased expression
and activation of adhesion molecules in vascular endothelial cells
and circulating leukocytes stimulate leukocyte recruitment into the
vascular endothelium, which is an important step in the development
of atherosclerosis (38,39). JAM-C has been shown to be involved
in the control of inflammatory leukocyte recruitment in
atherosclerosis (40). JAM3 may
act as a counter-receptor for Mac-1, which mediates
leukocyte-platelet interactions between vascular cells, and may
thereby provide a molecular target for antagonizing interactions
involved in several vascular pathologies, such as in
atherothrombosis (37). In the
present study, JAM3 was identified as a potential biomarker for
atherosclerosis, which was in line with the abovementioned previous
findings and suggested that JAM3 may be a potential therapeutic
target in atherosclerosis.
The FBLN2 gene encodes an the extracellular matrix
protein fibulin 2. Upregulation of FBLN2 may promote the arterial
response to injury and accelerate atherogenesis among patients with
diabetes (41). In addition, FBLN2
may lead to the aberrant regulation of activator protein-1 factors,
which have been shown to be associated with the progression of
atherosclerosis (42). Thus, FBLN2
may be implicated in the progression of atherosclerosis and serve
as a biomarker for this disease.
Cysteine sulfinic acid decarboxylase (CSAD) can
catalyze the conversion of cysteine sulfinic acid to hypotaurine,
which may limit the generation of taurine (43). Taurine has been shown to have the
potential protective effects against cardiovascular diseases and
can effectively prevent the progression of atherosclerotic diseases
(44). Therefore, it may be
hypothesized that CSAD may have roles in the progression of
atherosclerosis via limiting the generation of taurine.
Proline-serine-threonine phosphatase-interacting
protein 2 (PSTPIP2) is expressed in macrophages and is
tyrosine-phosphorylated in response to colony-stimulating factor-1
(CSF-1) (45). CSF-1 is thought to
have a role in the accumulation of cholesterol-laden macrophages
(foam cells) in atherosclerotic plaques (46). Chitu and Stanley (47) found that CSF-1 was involved in
several inflammatory disorders, such as artherosclerosis. Although
the causal roles of PSTPIP2 in the development of atherosclerosis
have not been fully elucidated, it may be speculated that PSTPIP2
has a pivotal role in the progression of atherosclerosis via
interaction with CSF-1. The results of the present study indicated
that PSTPIP2 may be a potential biomarker for atherosclerosis,
which requires further investigation.
Only gene expression profiles of
atherosclerotic/non-atherosclerotic females were investigated in
the present study. However, atherosclerosis may have different
pathologies in males and females; therefore, sex differences should
be explored. Furthermore, there was no experi mental validation in
the present study; therefore, further investigations are required
in order to verify the present findings and speculation. In
particular, additional prospective biomarkers, including HIATL1,
HOXB13, RNF148, RALB, CPEB3 and ABHD14B, were identified, which
merit further investigation and discussion.
In conclusion, the bioinformatics analysis of the
present study indicated that APH1B, JAM3, FBLN2, CSAD and PSTPIP2
may have important roles in the pathogenesis of atherosclerosis.
They may be considered as potential biomarkers for early diagnosis
and prognosis as well as therapeutic targets for this disease,
which requires experimental validation.
Acknowledgments
The present study was supported by Provincial
Science and Technology Research which is named super early
rehabilitation after acute cerebral apoplexy clinical research
(grant no. GC12C306-3).
References
|
1
|
Hansson GK, Robertson AK and
Söderberg-Nauclér C: Inflammation and atherosclerosis. Annu Rev
Pathol. 1:297–329. 2006. View Article : Google Scholar
|
|
2
|
Cooper R, Cutler J, Desvigne-Nickens P,
Fortmann SP, Friedman L, Havlik R, Hogelin G, Marler J, McGovern P,
Morosco G, et al: Trends and disparities in coronary heart disease,
stroke, and other cardiovascular diseases in the United States:
Findings of the national conference on cardiovascular disease
prevention. Circulation. 102:3137–3147. 2000. View Article : Google Scholar : PubMed/NCBI
|
|
3
|
Mannarino E and Pirro M: Molecular biology
of atherosclerosis. Clin Cases Miner Bone Metab. 5:57–62.
2008.PubMed/NCBI
|
|
4
|
Davignon J and Ganz P: Role of endothelial
dysfunction in atherosclerosis. Circulation. 109(23 Suppl 1):
SIII-27–SIII-32. 2004. View Article : Google Scholar
|
|
5
|
Vanhoutte PM: Endothelial dysfunction: The
first step toward coronary arteriosclerosis. Circ J. 73:595–601.
2009. View Article : Google Scholar : PubMed/NCBI
|
|
6
|
Mudau M, Genis A, Lochner A and Strijdom
H: Endothelial dysfunction: The early predictor of atherosclerosis.
Cardiovasc J Afr. 23:222–231. 2012. View Article : Google Scholar : PubMed/NCBI
|
|
7
|
Antoniades C, Demosthenous M, Tousoulis D,
Antonopoulos AS, Vlachopoulos C, Toutouza M, Marinou K, Bakogiannis
C, Mavragani K, Lazaros G, et al: Role of asymmetrical
dimethylarginine in inflammation-induced endothelial dysfunction in
human atherosclerosis. Hypertension. 58:93–98. 2011. View Article : Google Scholar : PubMed/NCBI
|
|
8
|
Sitia S, Tomasoni L, Atzeni F, Ambrosio G,
Cordiano C, Catapano A, Tramontana S, Perticone F, Naccarato P,
Camici P, et al: From endothelial dysfunction to atherosclerosis.
Autoimmun Rev. 9:830–834. 2010. View Article : Google Scholar : PubMed/NCBI
|
|
9
|
Ragino YI, Chernjavski AM, Polonskaja YV,
Tchimbal SY, Redjkin DA, Semaeva EV, Kashtanova EV and Voevoda MI:
Blood levels of inflammatory and destructive biomarkers in coronary
atherosclerosis of different severity. Bull Exp Biol Med.
149:587–590. 2010. View Article : Google Scholar : PubMed/NCBI
|
|
10
|
Koenig W and Khuseyinova N: Biomarkers of
atherosclerotic plaque instability and rupture. Arterioscler Thromb
Vasc Biol. 27:15–26. 2007. View Article : Google Scholar
|
|
11
|
Kampoli AM, Tousoulis D, Antoniades C,
Siasos G and Stefanadis C: Biomarkers of premature atherosclerosis.
Trends Mol Med. 15:323–332. 2009. View Article : Google Scholar : PubMed/NCBI
|
|
12
|
Montagnana M, Lippi G, Salvagno GL,
Franchini M, Targher G and Guidi GC: Role of biochemical risk
factors and markers for the risk of atherosclerosis. Recenti Prog
Med. 99:215–222. 2008.In Italian. PubMed/NCBI
|
|
13
|
Zhu YP, Shen T, Lin YJ, et al: Astragalus
polysaccharides suppress ICAM-1 and VCAM-1 expression in
TNF-α-treated human vascular endothelial cells by blocking NF-κB
activation. Acta Pharmacol Sin. 34:1036–1042. 2013. View Article : Google Scholar : PubMed/NCBI
|
|
14
|
Revkin JH, Shear CL, Pouleur HG, Ryder SW
and Orloff DG: Biomarkers in the prevention and treatment of
atherosclerosis: Need, validation, and future. Pharmacol Rev.
59:40–53. 2007. View Article : Google Scholar : PubMed/NCBI
|
|
15
|
Huang CC, Lloyd-Jones DM, Guo X,
Rajamannan NM, Lin S, Du P, Huang Q, Hou L and Liu K: Gene
expression variation between African Americans and whites is
associated with coronary artery calcification: The multiethnic
study of atherosclerosis. Physiol Genomics. 43:836–843. 2011.
View Article : Google Scholar : PubMed/NCBI
|
|
16
|
Huang CC, Chantler P, VanGilder R and Barr
T: Systemic transcriptional alterations of innate-adaptive immune
signaling pathways in atherosclerosis, ischemic stroke and
myocardial infarction. Arterioscler Thromb Vasc Biol. 34:A546.
2014.
|
|
17
|
Smyth GK: Limma: Linear models for
microarray data. Bioinformatics and Computational Biology Solutions
using R and Bioconductor. Gentleman R, Carey V, Dut S, Irizarry R
and Huber W: Springer; New York: pp. 397–420. 2005, View Article : Google Scholar
|
|
18
|
Bridges JR and Cecil C: Hierarchical
cluster analysis. Psychol Rep. 18:851–854. 1966. View Article : Google Scholar
|
|
19
|
Read T, Vance D and BluePrints S: Robust
Clustering: A Comparison of Sun™ Cluster 3.0 versus Sun Cluster 2.2
Software. Sun BluePrints™ OnLine. 2001:1–23. 2001.
|
|
20
|
Zhai Y, Tchieu J and Saier MH Jr: A
web-based Tree View (TV) program for the visualization of
phylogenetic trees. J Mol Microbiol Biotechnol. 4:69–70.
2002.PubMed/NCBI
|
|
21
|
Di Pietro C, Di Pietro V, Emmanuele G,
Ferro A, Maugeri T, Modica E, Pigola G, Pulvirenti A, Purrello M,
Scalia M, et al: Anticlustal: Multiple sequence alignment by
antipole clustering and linear approximate 1-median computation.
Proc IEEE Comput Soc Bioinform Conf. 2:326–336. 2003.
|
|
22
|
Chen X: Curve-based clustering of time
course gene expression data using self-organizing maps. J Bioinform
Comput Biol. 7:645–661. 2009. View Article : Google Scholar : PubMed/NCBI
|
|
23
|
Ashburner M, Ball CA, Blake JA, Botstein
D, Butler H, Cherry JM, Davis AP, Dolinski K, Dwight SS, Eppig JT,
et al: Gene ontology: Tool for the unification of biology. The gene
ontology consortium. Nat Genet. 25:25–29. 2000. View Article : Google Scholar : PubMed/NCBI
|
|
24
|
Kanehisa M and Goto S: KEGG: Kyoto
encyclopedia of genes and genomes. Nucleic Acids Res. 28:27–30.
2000. View Article : Google Scholar
|
|
25
|
Huang DW, Sherman BT, Tan Q, Kir J, Liu D,
Bryant D, Guo Y, Stephens R, Baseler MW, Lane HC and Lempicki RA:
DAVID Bioinformatics resources: Expanded annotation database and
novel algorithms to better extract biology from large gene lists.
Nucleic Acids Res. 35:W169–W175. 2007. View Article : Google Scholar : PubMed/NCBI
|
|
26
|
Krishnapuram B, Carin L and Hartemink A: 1
Gene expression analysis: Joint feature selection and classifier
design. Kernel Methods in Computational Biology. Schölkopf B, Tsuda
K and Vert JP: MIT Press; Cambridge: pp. 299–317. 2004
|
|
27
|
Liu T, Tao P, Li X, Qin Y and Wang C:
Prediction of subcellular location of apoptosis proteins combining
tri-gram encoding based on PSSM and recursive feature elimination.
J Theor Biol. 366:8–12. 2015. View Article : Google Scholar
|
|
28
|
Ruiz MJ, Hupé JM and Dojat M: Use of
pattern-information analysis in vision science: A pragmatic
examination. Machine learning in medical imaging. Suzuki K, Yan P,
Wang F and Shen D: Springer; New York: pp. 103–110. 2012,
View Article : Google Scholar
|
|
29
|
Ma S, Lv M, Deng F, Zhang X, Zhai H and Lv
W: Predicting the ecotoxicity of ionic liquids towards Vibrio
fischeri using genetic function approximation and least squares
support vector machine. J Hazard Mater. 283:591–598. 2015.
View Article : Google Scholar
|
|
30
|
Pedregosa F, Varoquaux G, Gramfort A,
Michel V, Thirion B, Grisel O, Blondel M, Prettenhofer P, Weiss R,
Dubourg V and Vanderplas J: Scikit-learn: Machine learning in
Python. J Mach Learn Res. 12:2825–2830. 2011.
|
|
31
|
Shah PK: Biomarkers of plaque instability.
Curr Cardiol Rep. 16:5472014. View Article : Google Scholar : PubMed/NCBI
|
|
32
|
Beel AJ and Sanders CR: Substrate
specificity of gamma-secretase and other intramembrane proteases.
Cell Mol Life Sci. 65:1311–1334. 2008. View Article : Google Scholar : PubMed/NCBI
|
|
33
|
Liu ZJ, Tan Y, Beecham GW, Seo DM, Tian R,
Li Y, Vazquez-Padron RI, Pericak-Vance M, Vance JM,
Goldschmidt-Clermont PJ, et al: Notch activation induces
endothelial cell senescence and pro-inf lammatory response:
Implication of Notch signaling in atherosclerosis. Atherosclerosis.
225:296–303. 2012. View Article : Google Scholar : PubMed/NCBI
|
|
34
|
Fukuda D, Aikawa E, Swirski FK,
Novobrantseva TI, Kotelianski V, Gorgun CZ, Chudnovskiy A, Yamazaki
H, Croce K, Weissleder R, et al: Notch ligand delta-like 4 blockade
attenuates atherosclerosis and metabolic disorders. Proc Natl Acad
Sci USA. 109:E1868–E1877. 2012. View Article : Google Scholar : PubMed/NCBI
|
|
35
|
Casserly I and Topol E: Convergence of
atherosclerosis and Alzheimer′s disease: Inflammation, cholesterol,
and misfolded proteins. Lancet. 363:1139–1146. 2004. View Article : Google Scholar : PubMed/NCBI
|
|
36
|
van Loo KM, Dejaegere T, van Zweeden M,
van Schijndel JE, Wijmenga C, Trip MD and Martens GJ: Male-specific
association between a gamma-secretase polymorphism and premature
coronary atherosclerosis. PloS One. 3:e36622008. View Article : Google Scholar : PubMed/NCBI
|
|
37
|
Santoso S, Sachs UJ, Kroll H, Linder M,
Ruf A, Preissner KT and Chavakis T: The junctional adhesion
molecule 3 (JAM-3) on human platelets is a counterreceptor for the
leukocyte integrin Mac-1. J Exp Med. 196:679–691. 2002. View Article : Google Scholar : PubMed/NCBI
|
|
38
|
Ling S, Nheu L and Komesaroff PA: Cell
adhesion molecules as pharmaceutical target in atherosclerosis.
Mini Rev Med Chem. 12:175–183. 2012. View Article : Google Scholar
|
|
39
|
Galkina E and Ley K: Vascular adhesion
molecules in atherosclerosis. Arterioscler Thromb Vasc Biol.
27:2292–2301. 2007. View Article : Google Scholar : PubMed/NCBI
|
|
40
|
Shagdarsuren E, Djalali-Talab Y,
Aurrand-Lions M, et al: Importance of Junctional adhesion
molecule-C for neointimal hyperplasia and monocyte recruitment in
atherosclerosis-prone mice-brief report. Arterioscler Thromb Vasc
Biol. 29:1161–1163. 2009. View Article : Google Scholar : PubMed/NCBI
|
|
41
|
Skov V, Knudsen S, Olesen M, Hansen ML and
Rasmussen LM: Global gene expression profiling displays a network
of dysregulated genes in non-atherosclerotic arterial tissue from
patients with type 2 diabetes. Cardiovasc Diabetol. 11:152012.
View Article : Google Scholar : PubMed/NCBI
|
|
42
|
Lin-Tsai O, Clark PE, Miller NL, et al:
Surgical intervention for symptomatic benign prostatic hyperplasia
is correlated with expression of the AP-1 transcription factor
network. Prostate. 74:669–679. 2014. View Article : Google Scholar : PubMed/NCBI
|
|
43
|
Chang L, Xu J, Yu F, Zhao J, Tang X and
Tang C: Taurine protected myocardial mitochondria injury induced by
hyper-homocysteinemia in rats. Amino Acids. 27:37–48. 2004.
View Article : Google Scholar : PubMed/NCBI
|
|
44
|
Wójcik OP, Koenig KL, Zeleniuch-Jacquotte
A, Costa M and Chen Y: The potential protective effects of taurine
on coronary heart disease. Atherosclerosis. 208:19–25. 2010.
View Article : Google Scholar :
|
|
45
|
Grosse J, Chitu V, Marquardt A, Hanke P,
Schmittwolf C, Zeitlmann L, Schropp P, Barth B, Yu P, Paffenholz R,
et al: Mutation of mouse Mayp/Pstpip2 causes a macrophage
autoinflammatory disease. Blood. 107:3350–3358. 2006. View Article : Google Scholar : PubMed/NCBI
|
|
46
|
Pixley FJ and Stanley ER: CSF-1 regulation
of the wandering macro phage: Complexity in action. Trends Cell
Biol. 14:628–638. 2004. View Article : Google Scholar : PubMed/NCBI
|
|
47
|
Chitu V and Stanley ER: Colony-stimulating
factor-1 in immunity and inflammation. Curr Opin Immunol. 18:39–48.
2006. View Article : Google Scholar
|