Introduction
Coronary atherosclerotic diseases (CADs) are a
leading contributor to morbidity and mortality rates in the modern
world, and there is increasing evidence that atherosclerosis is a
chronic inflammatory disease (1).
However, previous data obtained from animal models and clinical
studies have suggested that the complement system is important in
the pathogenesis of CADs, and is also involved in the progression
of inflammation and thrombosis (2–5).
The complement system is an innate cytotoxic host
defense system, which normally functions to eliminate foreign
pathogens and self-particles, and can be activated via three
mechanisms, termed the classical, lectin or alternative pathways.
The initiation of each pathway eventually results in the formation
of the terminal C5b-9 complex, or the membrane attack complex
(MAC), which is primarily responsible for cell lysis (6). Activation of the complement system
also results in the production of numerous effector molecules with
potent biological activities, including complement-mediated
opsonization and phagocytosis by C3b, C4b and ic3b, recognized by
complement receptors, and anaphylatoxin production through C3a, C4a
and C5a (7).
According to the results of clinical studies,
monomeric C-reactive protein, myocardial necrosis and apoptotic
cells may serve as potent activators of the complement system
(8–10). However, the extent of activation of
the complement system in different forms in CAD remain to be fully
elucidate. For stable angina pectoris (SA) in particular, a limited
number of studies have been performed, the majority of which have
produced controversial results (11–14).
The complement system is composed of >30 proteins, including
complement components, receptors and regulators, which act to
generate immunoprotective and proinflammatory products. In the
present study, human microarray analysis was used to systematically
examine the mRNA expression levels of all complement components,
receptors and regulators in peripheral blood mononuclear cells
(PBMCs) isolated from patients with acute myocardial infarction
(AMI), those with SA and clinical controls. The serum levels of
CH50, C3 and C4 were also measured in all 300 subjects. The aim of
the present in vitro study was to investigate the nature of
complement system immunity in the AMI and SA stages of CAD.
Materials and methods
Patient information
The present study recruited 100 patients with AMI,
100 patients with SA and 100 clinical controls. Human microarray
analysis was performed in 60 individuals, which were randomly
selected from the AMI, SA and control groups (20 in each group).
The sample sizes, the number of subjects per group, were based on
an assumed within-group variance of 0.50 and targeted nominal power
of 0.95 (15). The baseline
demographic data is shown in Table
I. The patients with AMI were admitted ≤12 h following onset of
symptoms to the Coronary Care Unit (Tongji Hospital, Shanghai,
China) between January and December 2013, and included 88 men and
12 women, with an age of 59±13 years (mean ± standard deviation).
The SA group contained 100 patients (82 men and 18 women aged 63±10
years). As a control group, 100 clinical inpatients (80 men and 20
women aged 61±7 years) were enrolled during the same period.
Histories, physical examination, ECG, chest radiography and routine
chemical analyses confirmed the controls had no evidence of
CAD.
 | Table I.Baseline demographic data of the
patients in the AMI, SA and Con groups. |
Table I.
Baseline demographic data of the
patients in the AMI, SA and Con groups.
|
|
|
|
| P-value |
|---|
|
|
|
|
|
|
|---|
| Index | AMI (n=100) | SA (n=100) | Con (n=100) | Total | AMI, vs. SA |
|---|
| Age | 58.6±12.7 | 63.6±11.1 | 61.1 ± 7.4 | 0.542 | 0.211 |
| Gender (M/F) | 88/12 | 82/18 | 80/20 | 0.16 | 0.08 |
| BMI (kg/m2) | 24.6±2.9 | 22.5±2.2 | 22.7±1.9 | 0.112 | 0.76 |
| Ethnicity, Han | 100 | 100 | 100 | 1 | 1 |
| Tobacco
(no./day) | 13.8±10.4 | 12.4±8.6 | 11.2±8.1 | 0.134 | 0.448 |
| SBP (mmHg) | 130±11 | 123±10 | 122±7 | 0.147 | 0.721 |
| DBP (mmHg) | 67±9 | 72.0±9 | 77±4 | 0.121 | 0.094 |
| LDL-C (mmol/l) | 2.2±1.3 | 2.3±1.7 | 2.6±1.5 | 0.123 | 0.576 |
| Triglycerides
(mmol/l) | 1.4±1.6 | 1.6±1.1 | 1.7±0.8 | 0.22 | 0.132 |
| HDL-C (mmol/l) | 0.7±0.9 | 0.8±0.6 | 1.0±0.2 | 0.067 | 0.103 |
| FBG (mmol/l) | 5.4±0.1 | 5.3±0.9 | 5.1±0.2 | 0.094 | 0.334 |
All patients with AMI were diagnosed on the basis of
the following criteria (16):
Detection of an increase in cardiac biomarker values, preferably
cardiac troponin, with at least one value above the 99th percentile
upper reference limit and with at least one of the following: i)
Symptoms of ischemia; ii) new or presumed new significant
ST-segment-T wave changes or new left bundle branch block; iii)
development of pathological Q waves on ECG; iv) imaging evidence of
new loss of viable myocardium or new regional wall motion
abnormality; v) identification of an intracoronary thrombus on
angiography.
All patients with SA had exclusively effort angina
with a positive exercise stress test and at least one coronary
stenosis detected on angiography (>70% reduction in lumen
diameter).
No significant differences were present among the
three groups in terms of age, gender, smoking status, body mass
index, systolic blood pressure, diastolic blood pressure,
low-density lipoprotein cholesterol, high-density lipoprotein
cholesterol, triglycerides and fasting plasma glucose.
The exclusion criteria for the three groups were as
follows: Venous thrombosis, history of severe renal or hepatic
diseases, hematological disorders, acute or chronic inflammatory
diseases and malignancy.
The experimental protocol was approved by the ethics
committee of Tongji University (Shanghai, China) and informed
consent was obtained.
Gene expression chips
Agilent G4112F Whole Human Genome Oligo Microarrays,
purchased from Agilent Technologies, Inc. (Santa Clara, CA, USA)
were used in the chip analysis. A microarray was composed of
>41,000 genes or transcripts, including targeted 19,596 entrez
gene RNAs. The sequence information used in the microarrays was
derived from the latest RefSeq (ncbi.nlm.nih.gov/refseq/), Goldenpath (genekeys.com/33-steps-resources-wheel)/, Ensembl
(asia.ensembl.org/index.html) and
Unigene (ncbi.nlm.nih.gov/unigene) databases (17). The functions of >70% of the
genes in the microarray were already known. A total of 60 randomly
selected patients were subjected to the chip analysis (20 in each
group).
Total RNA isolation
Peripheral blood samples (10 ml) from the median
cubital vein were drawn from all patients using a PAXgene™ tube
immediately following admission. Of each blood sample, 5 ml was
used for total RNA isolation, and the remainder was used for the
detection of CH50, C3 and C4. Leucocytes were obtained through
density gradient centrifugation at 3,000 × g for 15 min at 4°C with
Ficoll solution, and the remaining red blood cells were destroyed
using erythrocyte lysis buffer (Qiagen GmbH, Hilden, Germany).
Total RNA was extracted and purified using a PAXgene™ Blood RNA kit
(cat. no. 762174; Qiagen GmbH) following the manufacturer's
protocol. It was further assessed for an RNA integrity number (RIN)
to inspect RNA integration using an Agilent Bioanalyzer 2100
(Agilent Technologies, Inc.). The sample was considered qualified
when the 2100 RIN and 28S/18S were ≥0.7.
RNA amplification and labeling
RNA quantity was detected using a Nanodrop. The
total RNA was amplified using a reverse transcription kit (Bio-Rad
Laboratories, Inc., Hercules, CA, USA) and labeled using a Low
Input Quick Amp labeling kit, One-Color (cat. no. 5190-2305;
Agilent Technologies, Inc.), following the manufacturer's protocol.
The Labeled cRNA was purified using an RNeasy mini kit (cat. no.
74,106; Qiagen GmbH).
Microarray hybridization
Each slide was hybridized with 1.65 µg Cy3-labeled
cRNA using a Gene Expression Hybridization kit (cat. no. 5188-5242;
Agilent Technologies, Inc.) in a hybridization oven (cat. no.
G2545A; Agilent Technologies, Inc.), following the manufacturer's
protocol. After 17 h of hybridization, the slides were washed in
staining dishes (cat. no. 121; Thermo Fisher Scientific, Inc.,
Waltham, MA, USA) with a Gene Expression Wash Buffer kit (cat. no.
5188-5327; Agilent Technologies, Inc.), according to the
manufacturer's protocol.
Chip scan and data acquisition
The slides were scanned using an Agilent Microarray
Scanner (cat. no. G2565CA; Agilent Technologies, Inc.) with the
following default settings: Dye channel, green; scan resolution, 3
µm; 20 bit. Data were extracted using Feature Extraction 10.7
software (Agilent Technologies, Inc.). The raw data were normalized
using the Quantile algorithm with GeneSpring 11.0 software (Agilent
Technologies, Inc.).
Reverse transcription-quantitative
polymerase chain reaction RT-qPCR analysis
The spots in the microarray were randomly selected
and their expression levels were confirmed using RT-qPCR analysis.
Among all the genes with differential expression, three genes were
randomly selected and subjected to RT-qPCR analysis, in addition to
the housekeeping gene, GAPDH. The following RNA/primer mixture was
prepared in each tube: Total RNA 5 µg, random hexamers (50 ng/µl) 3
µl, 10 mM dNTP mix 1 µl and DEPC H2O to 10 µl. The samples were
then incubated at 65°C for 5 min and then on ice for at least 1
min. Next, the reaction master mixture was prepared. For each
reaction, the components were as follows: 10 × RT buffer 2 µl, 25
mM MgCl2 4 µl, 0.1 M DTT 2 µl and RNAaseOUT 1 µl. The
reaction mixture was added to the RNA/primer mixture was mixed
briefly, and then placed at room temperature for 2 min. Next, 1 µl
(50 U) of SuperScript II RT was added to each tube, mixed and
incubated at 25°C for 10 min. The tubes were then incubated at 42°C
for 50 min, heat inactivated at 70°C for 15 min, and chilled on
ice. Then, 1 µl RNase H was added and incubated at 37°C for 20 min.
The 1st strand cDNA was stored at −20°C until. PCR thermocycling
conditions were as follows: 50°C 2 min, 1 cycle, 95°C for 10 min 1
cycle, 95°C for 15 sec, 60°C for 30 sec, 72°C for 30 sec, 40 cycles
and 72°C for 10 min, 1 cycle. The relative expression was indicated
as the expression of the target gene normalized to the expression
of GAPDH (2-ΔΔCq). Melting curve analysis and the 2-ΔΔCq method
(18) were used to detect
differences in the levels of expression among the three groups. The
results from the RT-qPCR analysis were consistent with the
microarray analysis.
Laboratory assays
The remaining 5 ml blood sample was centrifuged at
3,000 × g for 15 min at 4°C within 1 h to obtain the serum.
Following collection, the tubes were placed on ice in order to
avoid complement inactivation, followed by immediate analyses. CH50
was detected using a liposome immune assay on a Beckman DxC-800
fully automatic biochemical analyzer (Beckman Coulter, Inc., Brea,
CA, USA; reagents from Wako Pure Chemical Industries, Ltd., Osaka,
Japan). C3 and C4 were detected using immunonephelometry (BNII
system; Siemens AG, Munich, Germany; reagents, Siemens Healthcare
Diagnostics Products GmbH, Marburg, Germany). The reference
intervals were as follows: CH50, 23–46%; C3, 0.9–1.8% and C4,
0.1–0.4%.
Statistical analysis
Descriptive statistical data are expressed as the
mean ± standard deviation. Differences between groups were examined
using one-way analysis of variance, following which all pairwise
group mean comparisons were performed using Tukey's method. Density
curves for CH50, C3 and C4 were delineated using R version 3.1.3
software (r-project.org). Data were analyzed using
SPSS 17.0 (SPSS, Inc., Chicago, IL, USA). P<0.05 was considered
to indicate a statistically significant difference
Results
Gene expression of complement
components
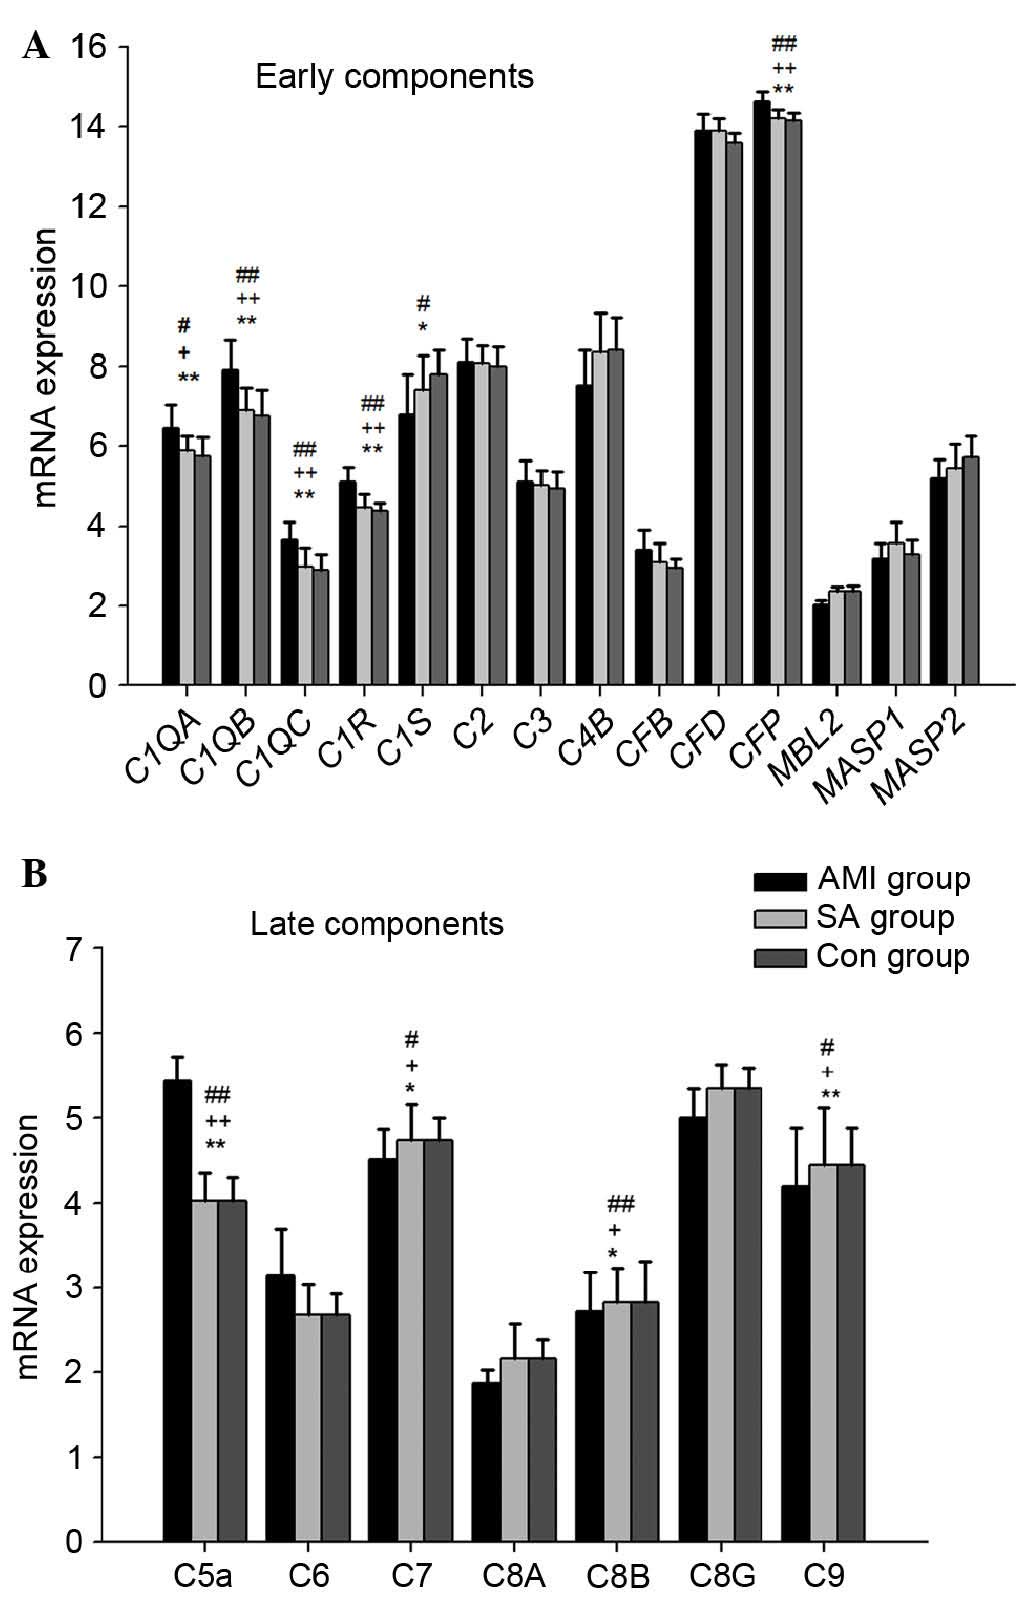
The results showed that early complement components,
including C1qα, C1qβ, C1qγ, C1r, C1s, C2, C3, C4b, Factor B, Factor
D, Factor P, MBL, MASP1, and MASP2 were expressed in the PBMCs from
the three groups of patients (Fig.
1A). In the PBMCs from the three groups, the expression levels
of genes encoding C1qα, C1qβ, C1qγ, C1r, Factor P and C1s were
significantly different (P<0.05). In the AMI group, the gene
expression levels of C1qα (P<0.05), C1qβ, C1qγ, C1r and Factor P
(all P<0.01), were significantly upregulated, compared with
those in the SA group and control group, respectively, whereas the
mRNA expression of C1s in the AMI group was downregulated
(P<0.05), compared with that in the control group. The gene
expression levels of MBL, MASP1 and MASP2 were lowest in the AMI
group among the three groups.
The gene expression levels of late complement
components, including C5a, C6, C7, C8α, C8β, C8γ and C9, were also
examined in the PBMCs from the three groups (Fig. 1B). In the AMI group, the mRNA
expression of C5a was significantly upregulated (P<0.01),
whereas the expression levels of C7, C8β and C9 were significantly
downregulated, compared with those in the SA and control groups,
respectively (P<0.05). However, no significant differences were
found in the mRNA expression of early or late complement components
between the SA and control groups.
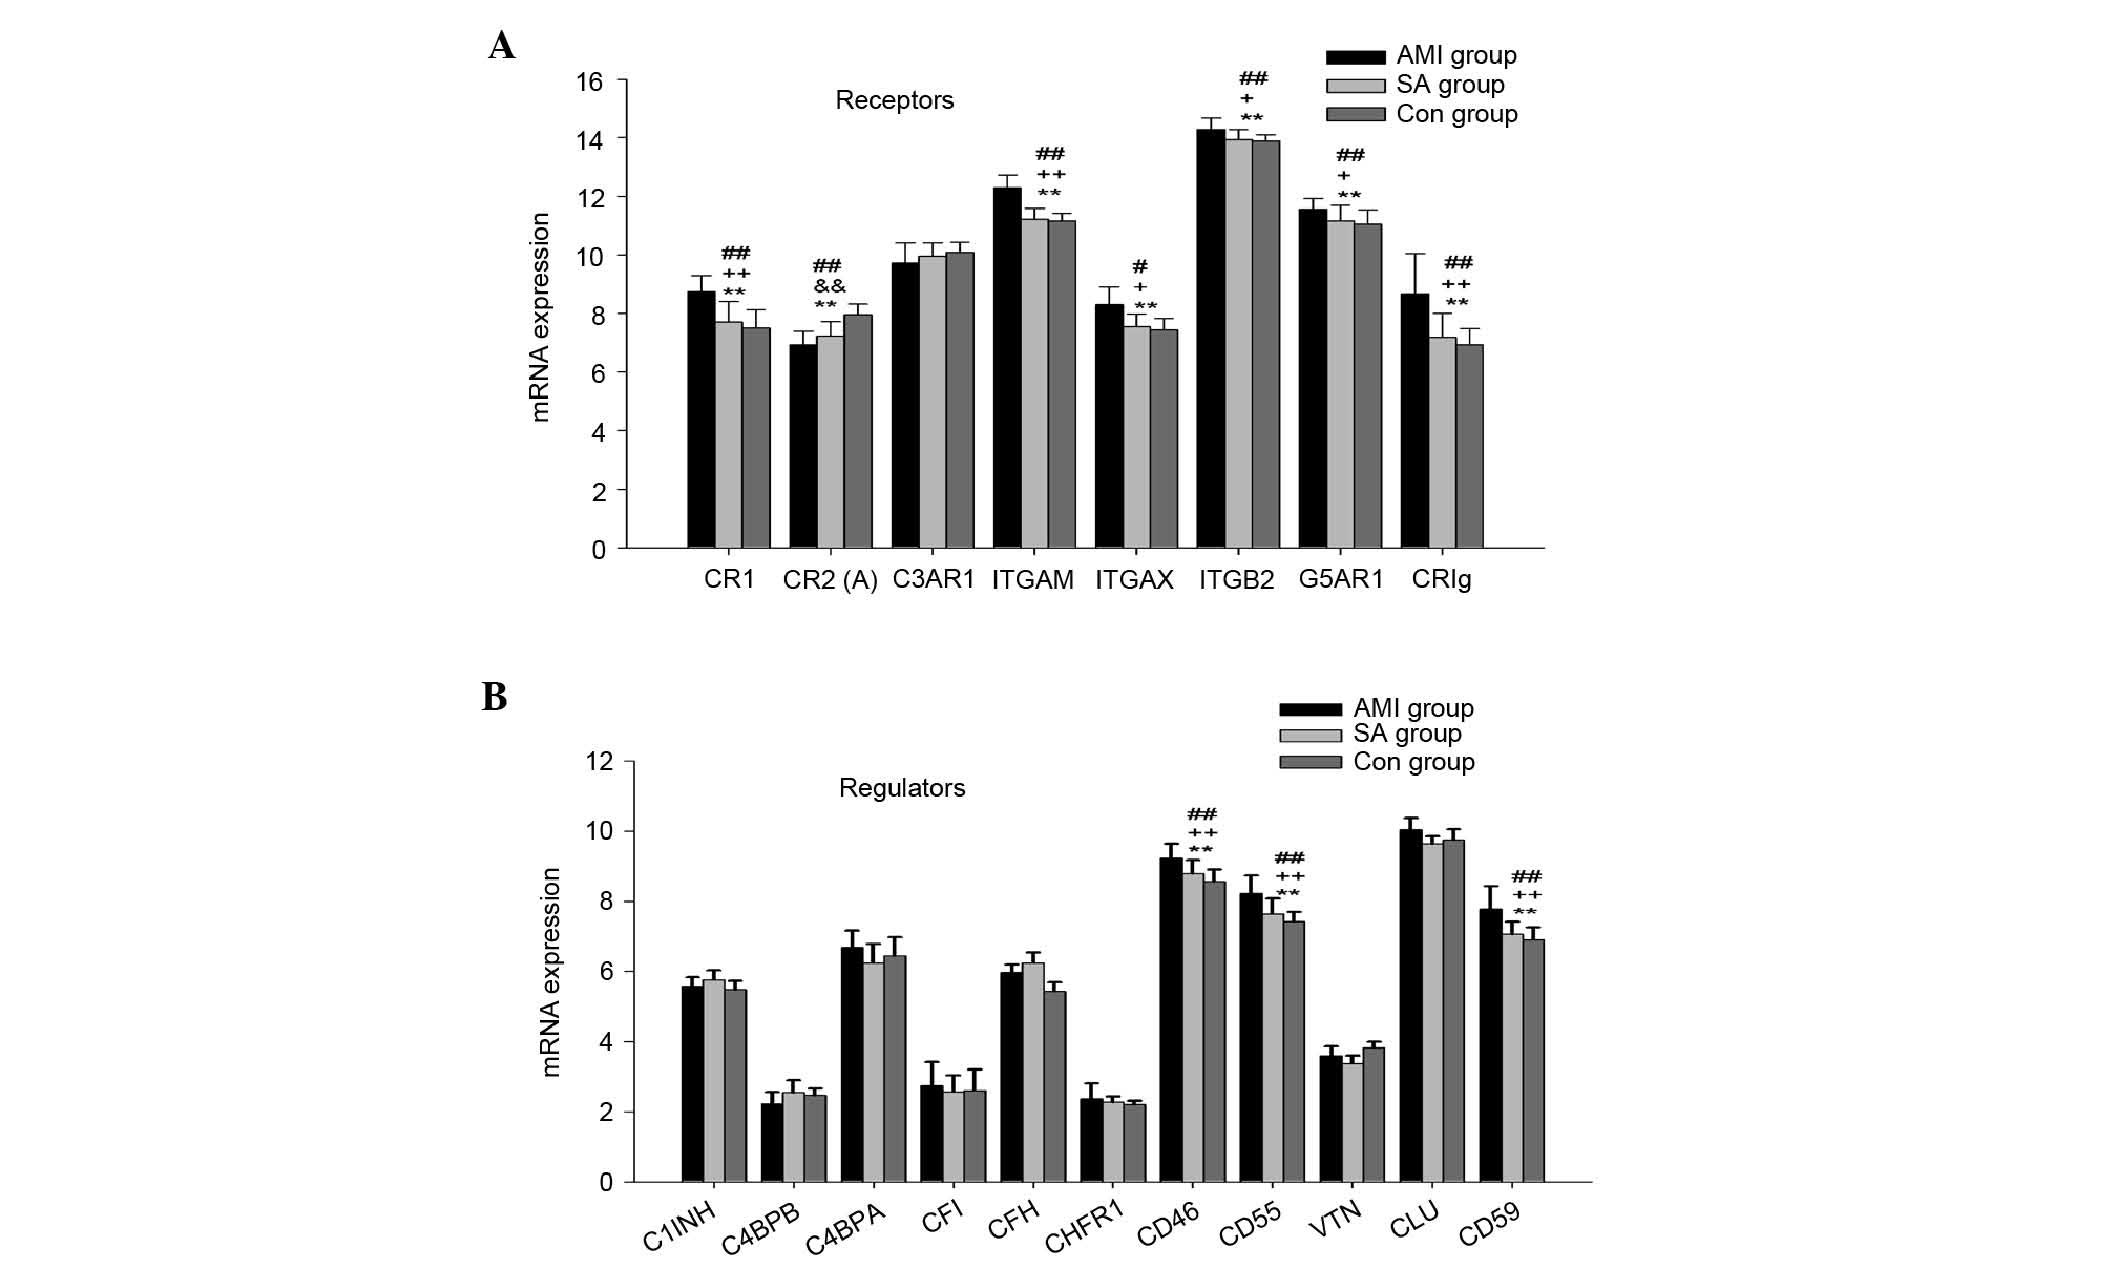
Gene expression of complement
receptors
The mRNA expression of complement receptors,
including CR1, CR2, C3aR, integrin αM, integrin αX, integrin β2,
C5aR and CRIg were also examined in the PBMCs from the three groups
(Fig. 2A). CR3 consists of
integrin αM and integrin β2, and CR4 comprises integrin αX and
integrin β2. In the PBMCs from the three groups, the expression
levels of the genes encoding CR1, CR2, integrin αM, integrin αX,
integrin β2, C5aR and CRIg were significantly different
(P<0.01). In the AMI group, the mRNA expression levels of CR1,
integrin αM, integrin αX, integrin β2, C5aR and CRIg were
significantly higher, compared with those in the SA and control
groups (P<0.05). The mRNA expression of CR2 was significantly
downregulated in the AMI and SA groups, compared with that in the
control group (P<0.01).
Gene expression of complement
regulators
The gene expression levels of complement regulators,
including C1 inhibitory factor (C1INH), C4b binding protein α
(C4bα), C4b binding protein β (C4bβ), Factor I, Factor H, Factor
H-related protein 1 (CFHR-1), CD46 (MCP), CD55 (DAF), vitronectin
(VTN), clusterin (CLU) and CD59 (MIRL) were detected in PBMCs from
the three groups of patients (Fig.
2B). The mRNA levels of CD46, CD55 and CD59 were significantly
different among the three groups (P<0.01). In the PBMCs from the
AMI group, the expression levels of genes encoding CD46, CD55 and
CD59 were significantly higher, compared with those in the other
two groups (P<0.01). No significant differences were found in
the gene expression of complement regulators between the SA and
control groups.
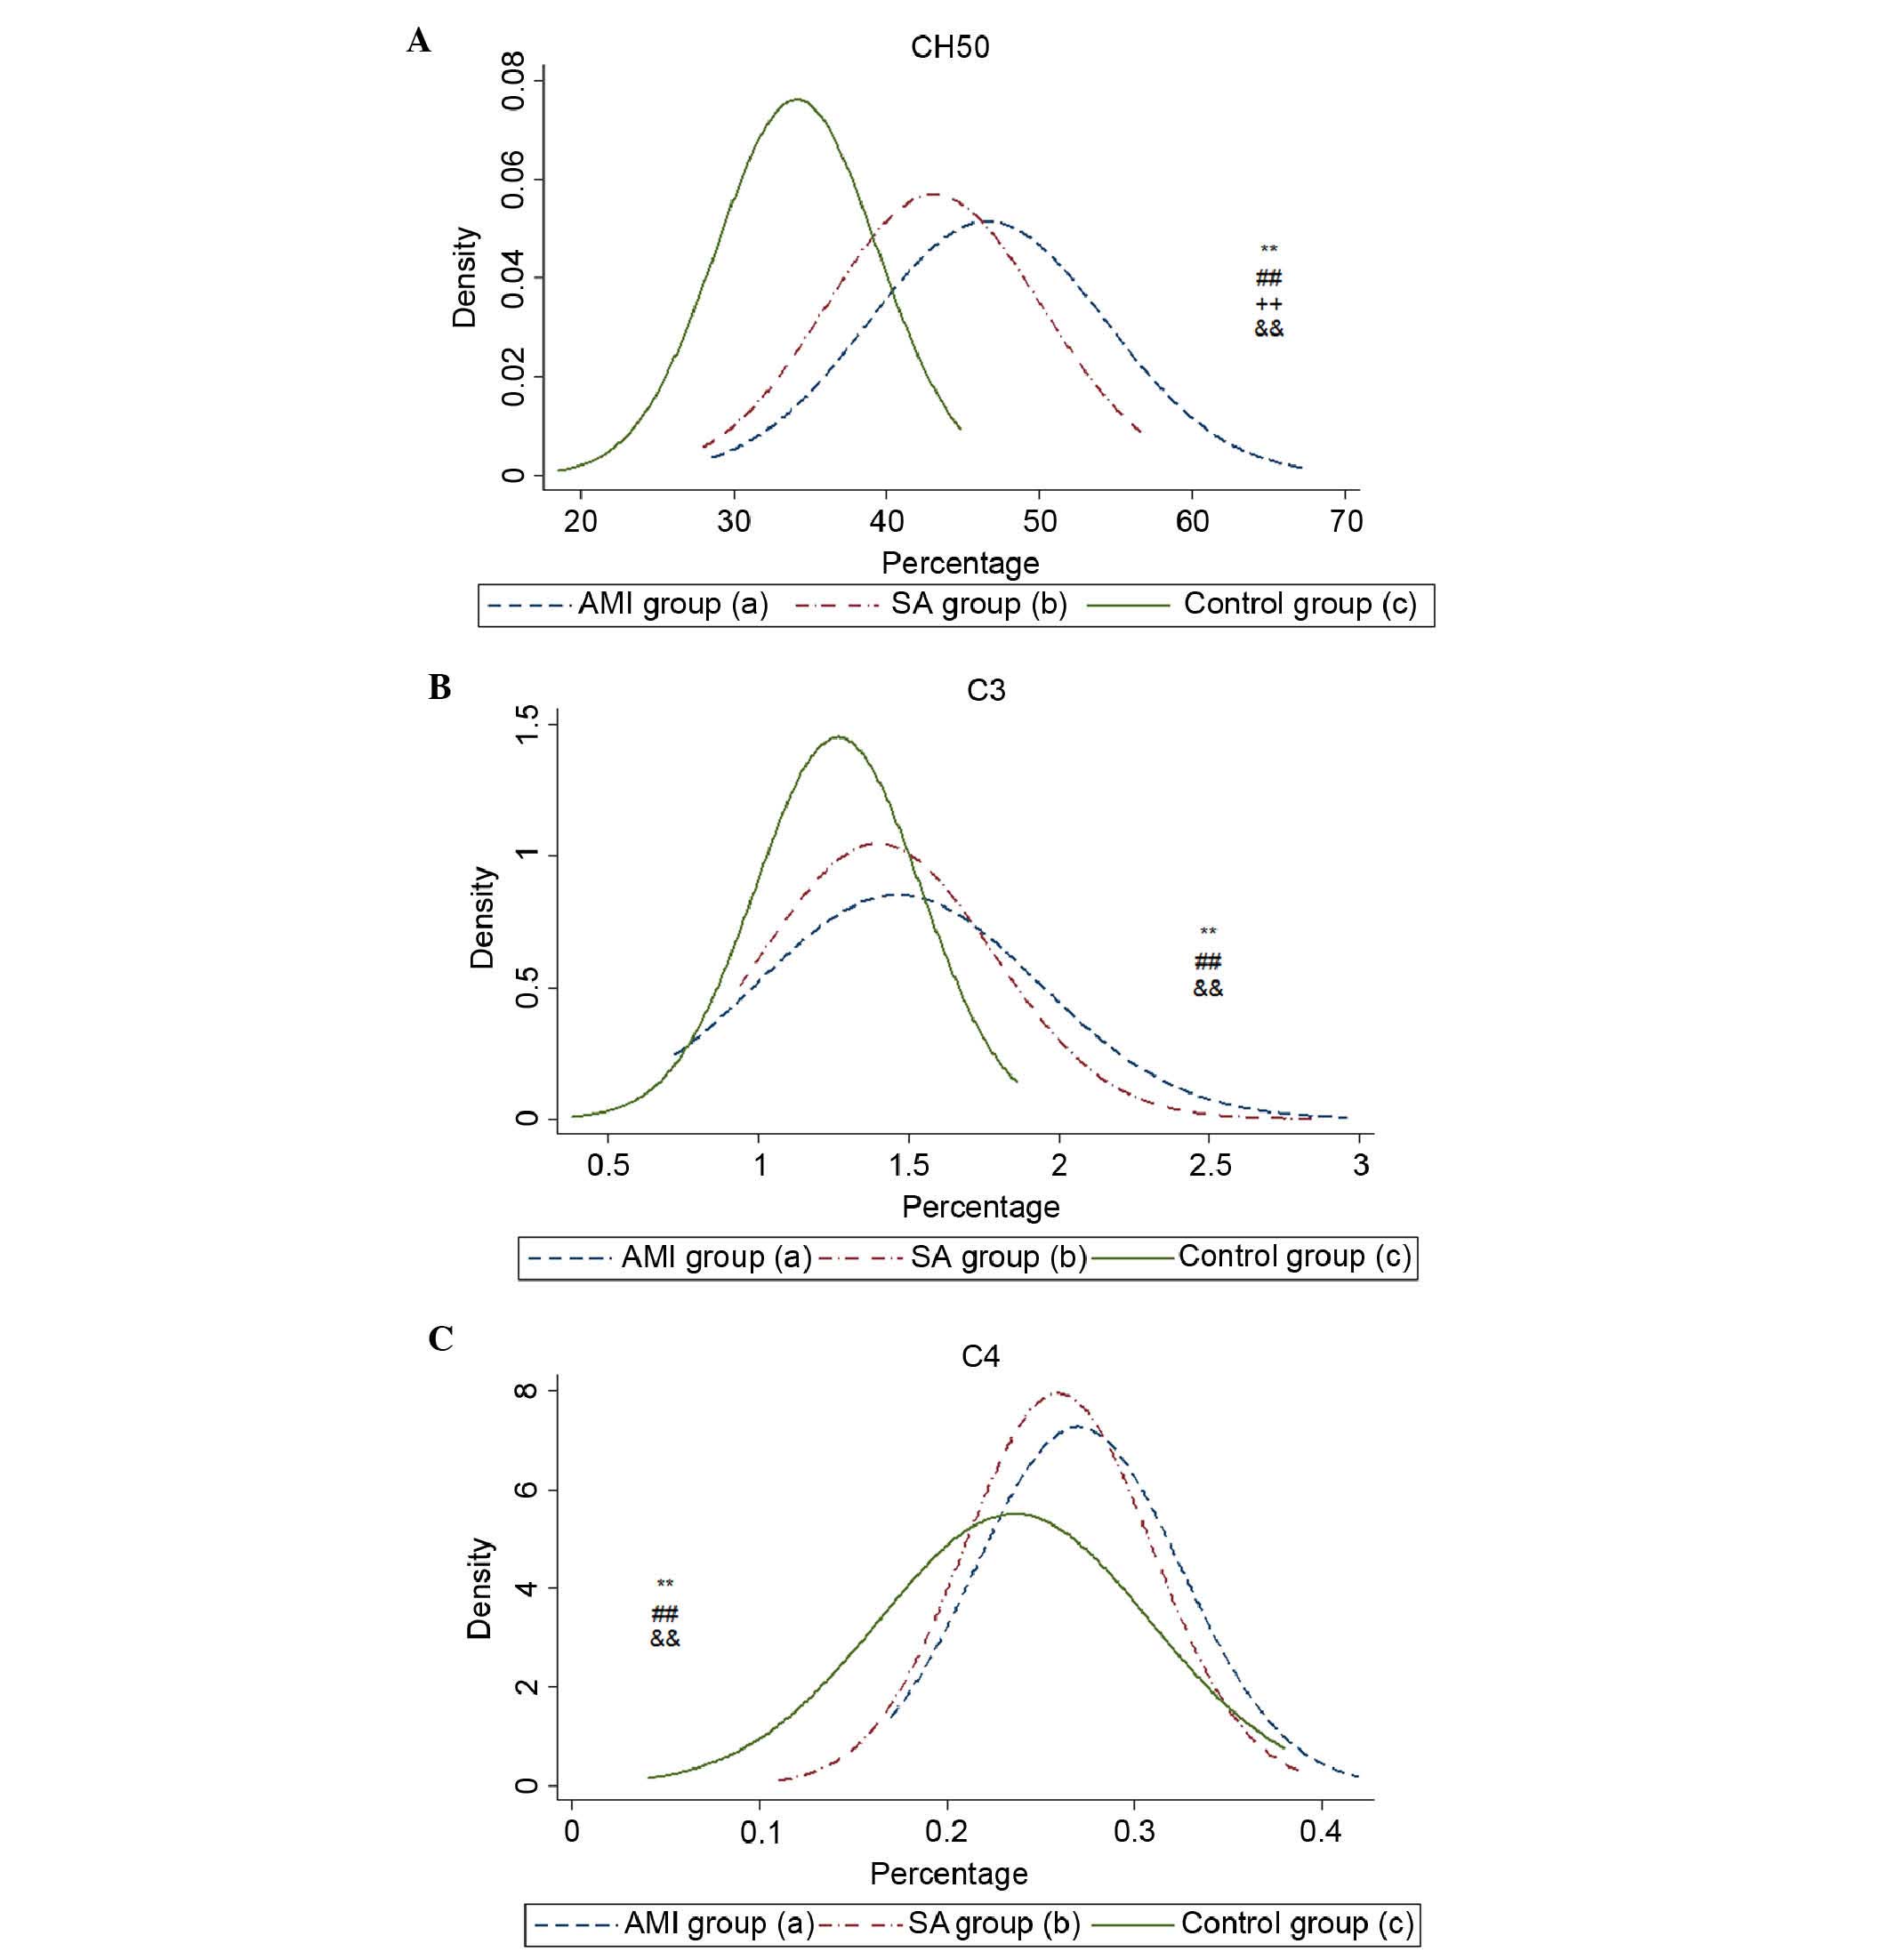
Serum levels of complement
components
The serum levels of CH50, C3 and C4 were
significantly increased in the AMI and SA groups, compared with the
control group (Table II). The
level of CH50 in the AMI group was higher, compared with that in
the SA group (P<0.01). No significant differences were found
between the AMI and SA groups in the levels of C3 or C4. The
density curves of CH50, C3 and C4 are shown in Fig. 3A-C.
| Table II.Levels of CH50, C3 and C4 among the
AMI, SA and Con groups. |
Table II.
Levels of CH50, C3 and C4 among the
AMI, SA and Con groups.
|
|
|
|
|
| P-value |
|---|
|
|
|
|
|
|
|
|---|
| Index | AMI (%; n=100) | SA (%; n=100) | Con (%; n=100) | Total | AMI, vs. Con | SA, vs. Con | AMI, vs. SA |
|---|
| CH50 | 46.60±0.77 | 43.10±0.70 | 34.10±0.52 | <0.001 | <0.001 | <0.001 | 0.003 |
| C3 | 1.46±0.47 | 1.40±0.38 | 1.27±0.27 | 0.001 | 0.001 | 0.016 | 0.609 |
| C4 | 0.27±0.05 | 0.26±0.05 | 0.24±0.07 | <0.001 | 0.001 | 0.028 | 0.391 |
Discussion
In the present study, the early complement
components of three complement pathways were examined, and it was
found that the mRNA levels of C1qα, C1qβ, C1qγ and C1r were
significantly upregulated in patients with AMI, compared with
patients with SA patients and controls (Fig. 1). The upregulation of the mRNA
levels of C1qα, C1qβ, C1qγ and C1r suggested that the classical
pathway, which is typically initiated by IgM or
IgG-antibody/antigen immune complexes, was activated in the
patients with AMI (19). The
alternative pathway is activated predominantly by ‘foreign
surfaces’, through factor P and the spontaneous hydrolysis of
C3-C3b. In the present study, the expression of factor P in the AMI
group was significantly higher, compared with the other two groups,
indicating that the alternative pathway may also have been
activated. The activation of the classical and alternative pathways
in the present study was consistent with the results from previous
clinical studies (10,11,19).
When mannose-bind lectin (MBL) or ficolin bind to carbohydrate on
the surface of a pathogen, the MBL-associated serine proteases
(MASPs) are activated, following which then the lectin pathway is
activated (20). Previous studies
have shown that individuals with MBL and MBL-associated MASP
deficiencies have immune dysfunction and are susceptible to exotic
pathogens (21–24). In the present study, the gene
expression levels of MBL, MASP1 and MASP2 were lowest in the
patients with AMI among the three groups, therefore, the
downregulated expression of these three genes indicated decreased
lectin pathway activity in the AMI group.
Three distinct pathways share a common terminal
access to form the C5b-9 complex (MAC), which forms a transmembrane
pore in the target cell membrane that causes cell lysis and death.
C5b initiates the formation of the MAC, which consists of C5b, C6,
C7, C8 and multiple molecules of C9. In the results of the present
study, the expression of seven late complement component genes was
detected, and five of these, including the C7, C8α, C8β, C8γ and C9
mRNAs were lowest in the patients with AMI. The significant decline
in the gene expression levels of C7, C8 and C9 in patients with AMI
may inhibit MAC formation.
The present study also examined the gene expression
levels of eight complement receptors (Fig. 2A), and the mRNA levels of CR1, CR3,
CR4, C5aR and CRIg were significantly higher in the AMI group among
the three groups. This suggested that the interactions between
certain complement effector molecules, including C3b, C4b, ic3b,
c3d and c3c, and their receptors were enhanced, and that the
complement effectors were involved in opsonization and
phagocytosis, also promoted the mobilization, migration and
proliferation of leukocytes The mRNA expression levels of CR2 in
the AMI and SA groups were significantly downregulated, compared
the control group. CR2 is a B cell membrane glycoprotein, which is
involved in B cell activation, survival and proliferation. In
addition, CR2 is important in the recognition of foreign DNA from
bacterium, viruses and other pathogens during host-immune responses
(25,26). In the present study the gene
expression levels of CR2 were significantly downregulated in the
AMI and SA groups, suggesting possible immune dysfunction in the B
cells, and the potential increased risk of infections in patients
with AMI and SA.
The gene expression levels of eleven complement
regulators were also detected in the present study (Fig. 2B). The results showed that the mRNA
expression levels of CD46, CD55 and CD59 were significantly
upregulated in the AMI group. CD46, a known cofactor protein, acts
as a cofactor for factor I in the degradation of C3b and C4b, and
inhibits convertase formation. CD55, a decay accelerating factor,
prevents the formation of new C3 and C5 convertases and accelerates
the decay of preformed C3 and C5 convertases. CR1 belongs to the
regulators of complement activation protein family, and exhibits
CD46 and CD55 activities (27).
CD59 is a key regulator of MAC assembly and restricts the formation
of MAC (28–30). The upregulated gene expression
levels of CR1, CD46, CD55 and CD59 in the patients with AMI
suggested the inhibition of MAC formation.
The plasma levels of CH50, C3 and C4, which reflect
the activities of C1-C9 via the classical pathway, were all
elevated in the AMI and SA groups. By analyzing the levels of genes
and proteins in the present study, complement was found to be
activated in the AMI and SA patient groups. However, the
differential mRNA expression of complement components, receptors
and regulators in AMI suggested that the inhibition of the C5b-9
complex induced cell lysis. The depression of cytolytic effects in
the complement system in patients with AMI may be associated with
the pathogenesis of AMI. As a consequence, improving
complement-mediated innate immunity may be considered as a
potential target for medical interventions in patients with
AMI.
Acknowledgements
This study was supported by the Shanghai Traditional
Chinese Medicine 3-year Development Program (grant no. 2014–2016),
the Shanghai Health Bureau (grant no. 20144Y0046) and the National
Natural Science Fund (grant no. 81570359).
References
|
1
|
Institute of Medicine (US) Committee on
Preventing the Global Epidemic of Cardiovascular Disease, . Meeting
the Challenges in Developing CountriesFuster V and Kelly BB:
Promoting cardiovascular health in the developing world: A critical
challenge to achieve global health. National Academies Press;
Washington (DC): 2010
|
|
2
|
Evora PR, Nather J, Tubino PV, Albuquerque
AA, Celotto AC and Rodrigues AJ: Curbing inflammation in the
ischemic heart disease. Int J Inflam. 2013:1830612013. View Article : Google Scholar : PubMed/NCBI
|
|
3
|
Patzelt J, Verschoor A and Langer HF:
Platelets and the complement cascade in atherosclerosis. Front
Physiol. 6:492015. View Article : Google Scholar : PubMed/NCBI
|
|
4
|
Diepenhorst GM, van Gulik TM and Hack CE:
Complement-mediated ischemia-reperfusion injury: Lessons learned
from animal and clinical studies. Ann Surg. 249:889–899. 2009.
View Article : Google Scholar : PubMed/NCBI
|
|
5
|
Speidl WS, Kastl SP, Huber K and Wojta J:
Complement in atherosclerosis: Friend or foe? J Thromb Haemost.
9:428–440. 2011. View Article : Google Scholar : PubMed/NCBI
|
|
6
|
Esser AF: The membrane attack complex of
complement. assembly, structure and cytotoxic activity. Toxicology.
87:229–247. 1994. View Article : Google Scholar : PubMed/NCBI
|
|
7
|
Francescut L, Steiner T, Byrne S,
Cianflone K, Francis S and Stover C: The role of complement in the
development and manifestation of murine atherogenic inflammation:
Novel avenues. J Innate Immun. 4:260–272. 2012. View Article : Google Scholar : PubMed/NCBI
|
|
8
|
Széplaki G, Varga L, Füst G and Prohászka
Z: Role of complement in the pathomechanism of atherosclerotic
vascular diseases. Mol Immunol. 46:2784–2793. 2009. View Article : Google Scholar : PubMed/NCBI
|
|
9
|
Cubedo J, Padró T and Badimon L:
Coordinated proteomic signature changes in immune response and
complement proteins in acute myocardial infarction: The implication
of serum amyloid P-component. Int J Cardiol. 168:5196–5204. 2013.
View Article : Google Scholar : PubMed/NCBI
|
|
10
|
Mihlan M, Blom AM, Kupreishvili K, Lauer
N, Stelzner K, Bergström F, Niessen HW and Zipfel PF: Monomeric
C-reactive protein modulates classic complement activation on
necrotic cells. FASEB J. 25:4198–4210. 2011. View Article : Google Scholar : PubMed/NCBI
|
|
11
|
Giasuddin ASM, ElMahdawi JM and ElHassadi
FM: Serum complement (C3, C4) levels in patients with acute
myocardial infarction and angina pectoris. Bangladesh Med Res Counc
Bull. 33:98–102. 2007. View Article : Google Scholar : PubMed/NCBI
|
|
12
|
Iltumur K, Karabulut A, Toprak G and
Toprak N: complement activation in acute coronary syndromes. APMIS.
113:167–174. 2005. View Article : Google Scholar : PubMed/NCBI
|
|
13
|
Kostner KM, Fahti RB, Case C, Hobson P,
Tate J and Marwick TH: Inflammation, complement activation and
endothelial function in stable and unstable coronary artery
disease. Clin Chim Acta. 365:129–134. 2006. View Article : Google Scholar : PubMed/NCBI
|
|
14
|
Yasuda M, Takeuchi K, Hiruma M, Iida H,
Tahara A, Itagane H, Toda I, Akioka K, Teragaki M, Oku H, et al:
The complement system in ischemic heart disease. Circulation.
81:156–163. 1990. View Article : Google Scholar : PubMed/NCBI
|
|
15
|
Dobbin K and Simon R: Sample size
determination in microarray experiments for class comparison and
prognostic classification. Biostatistics. 6:27–38. 2005. View Article : Google Scholar : PubMed/NCBI
|
|
16
|
Thygesen K and Alpert JS, Jaffe AS,
Simoons ML, Chaitman BR, White HD; Joint ESC/ACCF/AHA/WHF Task
Force for Universal Definition of Myocardial Infarction;
Authors/Task Force Members Chairpersons, ; Thygesen K and Alpert
JS: Third universal definition of myocardial infarction. J Am Coll
Cardiol. 60:1581–1598. 2012. View Article : Google Scholar : PubMed/NCBI
|
|
17
|
Wiltgen M and Tilz GP: DNA microarray
analysis: Principles and clinical impact. Hematology. 12:271–287.
2007. View Article : Google Scholar : PubMed/NCBI
|
|
18
|
Livak KJ and Schmittgen TD: Analysis of
relative gene expression data using real-time quantitative PCR and
the 2(−Delta Delta C(T)) Method. Methods. 25:402–408. 2001.
View Article : Google Scholar : PubMed/NCBI
|
|
19
|
Horváth Z, Csuka D, Vargova K, Kovács A,
Molnár ÁA, Gulácsi-Bárdos P, Leé S, Varga L, Kiss RG, Préda I and
Füst G: Elevated C1rC1sC1inh levels independently predict
atherosclerotic coronary heart disease. Mol Immunol. 54:8–13. 2013.
View Article : Google Scholar : PubMed/NCBI
|
|
20
|
Takahashi M, Mori S, Shigeta S and Fujita
T: Role of MBL-associated serine protease (MASP) on activation of
the lectin complement pathway. In Adv Exp Med Biol. 598:93–104.
2007. View Article : Google Scholar
|
|
21
|
Pesonen E, Hallman M, Sarna S, Andsberg E,
Haataja R, Meri S, Persson K, Puolakkainen M, Ohlin H and Truedsson
L: Mannose-binding lectin as a risk factor for acute coronary
syndromes. Ann Med. 41:591–598. 2009. View Article : Google Scholar : PubMed/NCBI
|
|
22
|
Koch A, Melbye M, Sørensen P, Homøe P,
Madsen HO, Mølbak K, Hansen CH, Andersen LH, Hahn GW and Garred P:
Acute respiratory tract infections and mannose-binding lectin
insufficiency during early childhood. JAMA. 285:1316–1321. 2001.
View Article : Google Scholar : PubMed/NCBI
|
|
23
|
Peterslund NA, Koch C, Jensenius JC and
Thiel S: Association between deficiency of mannose-binding lectin
and severe infections after chemotherapy. Lancet. 358:637–638.
2001. View Article : Google Scholar : PubMed/NCBI
|
|
24
|
Ali YM, Lynch NJ, Haleem KS, Fujita T,
Endo Y, Hansen S, Holmskov U, Takahashi K, Stahl GL, Dudler T, et
al: The lectin pathway of complement activation is a critical
component of the innate immune response to pneumococcal infection.
PLoS Pathog. 8:e10027932012. View Article : Google Scholar : PubMed/NCBI
|
|
25
|
Low HZ, Hilbrans D, Schmidt-Wolf IG and
Illges H: Enhanced CD21 expression and shedding in chronic
lymphatic leukemia: A possible pathomechanism in disease
progression. Int J Hematol. 96:350–356. 2012. View Article : Google Scholar : PubMed/NCBI
|
|
26
|
Asokan R, Banda NK, Szakonyi G, Chen XS
and Holers VM: Human complement receptor 2 (CR2/CD21) as a receptor
for DNA: Implications for its roles in the immune response and the
pathogenesis of systemic lupus erythematosus (SLE). Mol Immunol.
53:99–110. 2013. View Article : Google Scholar : PubMed/NCBI
|
|
27
|
Nuutila J, Jalava-Karvinen P, Hohenthal U,
Kotilainen P, Pelliniemi TT and Nikoskelainen J: Use of complement
regulators, CD35, CD46, CD55 and CD59, on leukocytes as markers for
diagnosis of viral and bacterial infections. Hum Immunol.
74:522–530. 2013. View Article : Google Scholar : PubMed/NCBI
|
|
28
|
Huang Y, Qiao F, Abagyan R, Hazard S and
Tomlinson S: Defining the CD59-C9 binding interaction. J Biol Chem.
281:27398–27404. 2006. View Article : Google Scholar : PubMed/NCBI
|
|
29
|
Mayilyan KR: Complement genetics,
deficiencies and disease associations. Protein Cell. 3:487–496.
2012. View Article : Google Scholar : PubMed/NCBI
|
|
30
|
Wu G, Hu W, Shahsafaei A, Song W, Dobarro
M, Sukhova GK, Bronson RR, Shi GP, Rother RP, Halperin JA and Qin
X: Complement regulator CD59 protects against atherosclerosis by
restricting the formation of complement membrane attack complex.
Circ Re. 104:550–558. 2009. View Article : Google Scholar
|