Introduction
Among women, ovarian cancer has a high mortality
rate and is the fifth leading cause of cancer-associated mortality,
behind cancer of the lung and bronchus, and colorectal, breast and
pancreatic cancer (1). The average
age of ovarian cancer onset occurs later in reproductive life
(2). The disease can advance
rapidly with transcoelomic spreading from the ovary to other organs
and peritoneal surfaces, and with ascites accumulation (3). Of cases of primary ovarian cancer,
~90% are epithelial carcinoma from the ovarian surface epithelium
(4,5). Ovarian epithelial cancer
predominantly contains four histotypes of epithelial tumor,
including endometrioid, serous, mucinous and clear cell carcinoma.
The serous type is the predominant form in women (3). It is well known that early-stage
ovarian cancer (stage I/II) is difficult to diagnose, as it is
frequently asymptomatic. Therefore, the majority of patients
suffering from ovarian cancer are in advanced stages (III and IV)
at the time of the initial diagnosis (6,7). To
date, the treatment of ovarian cancer is primarily via
platinum-based chemotherapy, debulking surgery and radiotherapy,
however, the five-year survival rate has only improved only
marginally in the last 40 years, remaining <40% (8). Thus, it is critical that effective
and sensitive diagnostic biomarkers are examined, which can be
applied in the early stage of ovarian cancer and improve survival
rates of patients.
Ovarian carcinogenesis is caused by accumulated
genetic or genomic alterations (9). DNA-microarray technology enables
examination of the expression of thousands of genes simultaneously
in tumor samples. Data-analysis software, a high-throughput
technology, has made it possible to distinguish gene expression
profiling between normal and cancer samples, and thus identify
differentially expressed genes during cancer development and
progression (10). Gene expression
profiling can provide information for the mining of novel
biomarkers. Based on oligonulceotide arrays, 275 genes have been
predicted with increased/decreased expression in ovarian cancer
(11). Several characteristic
biomarkers involved in ovarian cancer have been determined,
including E-cadherin (12),
carbohydrate antigen-125 (13),
cytochrome P450 1B1 (14),
cyclooxygenase 1 (15), AKT
serine/threonine kinase 2 (16),
BRCA (17) and the human epidermal
growth factor receptor family (16,18).
The dual detection of hepatocyte nuclear factor-1β and napsin A
have been reported to be sensitive markers for diagnosing ovarian
clear cell carcinoma, which may also be useful for distinguishing
ovarian clear cell carcinoma from endometrioid, serous carcinoma
and metastatic Krukenberg tumors (19). However, the compensatory mechanisms
in four histotypes of ovarian cancer remain to be fully elucidated,
and the underlying diagnostic and therapeutic targets require
further investigation.
It is known that protein complexes are key molecular
entities and they integrate multiple gene products to perform
cellular functions (20). Based on
advances in high-throughput analysis technologies, substantial
protein-protein interaction (PPI) data has been excavated,
therefore, it is possible to investigate protein functions
systematically (21). However, due
to the technological limitations and dynamic nature of protein
interaction maps, the protein interaction data produced by
high-throughput experiments often possess high false positive and
false negative rates, which lead to difficulties in predicting
protein complexes accurately (22). Therefore, a systematic method is
required to track gene and module behavior across diseases
conditions in a controlled manner (23).
The present study aimed to further elucidate the
mechanisms of four histotypes of ovarian cancer, therefore, the
disrupted modules from reweighted PPI networks were tracked to
systematically identify dysfunctional genes and pathways in samples
of the four histotypes of ovarian cancer. Initially, based on
Spearman's correlation coefficient (SCC) of gene interactions,
normal and disease-specific PPI networks were inferred.
Subsequently, the clique-merging algorithm was used to examine
modules in the re-weighted PPI networks, and the modules obtained
in cancer were compared with those in the normal condition to
determine altered modules. Finally, the associated functional
pathways of the different histotypes were identified, based on the
Kyoto Encyclopedia of Genes and Genomes (KEGG) database.
Materials and methods
Affymetrix chip data
The EMBL-EBI (http://www.ebi.ac.uk/) database provides freely
available data from life science experiments, performs basic
investigations in computational biology and offers a training
program to extensive users. The E-GEOD-6008 dataset, which included
99 individual ovarian tumor samples (37 endometrioid, 41 serous, 13
mucinous and eight clear cell carcinomas) and four normal ovarian
samples, was downloaded from EMBL-EBI (24). The RNA expression in each sample
was analyzed using an Affymetrix GeneChip Human Genome HG-U133A
array.
Data preprocessing
The Affy package (v1.48.0) in R (bioconductor.org/packages/release/bioc/html/affy.html)
was used for the analysis of oligonucleotide arrays to delete
undesirable values (25). The data
preprocessing was performed using the robust multichip average
method in the affy package, comprising background correction,
normalization, perfect match/mismatch matching and expression value
aggregate calculation (25).
Subsequently, the raw data in the CEL files were converted to
probe-level data, and the probe-level data were transformed to gene
symbols. The FeatureFilter function was applied to discard probes
that did not correspond to any gene symbol. A final total of 12,493
genes were obtained.
PPI network construction
As is already known, proteins rarely exert their
functions individually, however, they are important in a variety of
biological process in the form of large protein functional groups
(26). Therefore, in the present
study, the PPIs of the 12,493 genes were analyzed using the online
Search Tool for the Retrieval of Interacting Genes (STRING) tool
(string-db.org). Cytoscape software (v3.3.0;
www.cytoscape.org), a biological graph
visualization tool (27), was used
to construct the PPI networks. All 1,048,576 interactions datasets
were downloaded from the STRING database to construct the PPI
networks. Following the elimination of self-loops, a complicated
PPI network was constructed, which comprised 9,273 nodes and 58,617
interactions with a combine-score ≥0.75.
PPI network re-weighting
By obtaining intersection elements of the 12,493
genes in E-GEOD-6008 and the 9,273 nodes in the PPI network, a
sub-network of 7,264 nodes and 45,286 interactions was obtained.
The weights of interactions reflect their reliabilities, and low
absolute scores of interactions may indicate false positives
(28). In the present study, the
SCC, which describes the association between two variables, was
used to evaluate the strength of the association between two paired
proteins in the PPI networks. The SCC value ranged from −1 to +1.
The sign of the SCC indicates the direction of association between
X (the independent variable) and Y (the dependent variable). If Y
increases when X increases, the SCC is positive. If Y decreases
when X increases, the SCC is negative. A coefficient of −1
indicates that there is a perfect inverse association between X and
Y. A coefficient of +1 demonstrates that there is a perfect
positive association between X and Y. An SCC of 0 indicates that
there is no tendency for Y to either increase or decrease when X
increases. The SCC increases in magnitude as X and Y become closer
to being perfect monotone functions of each other. When X and Y are
perfectly monotonically associated, the SCC is 1.
Spearman's rank formula was used to calculate the
coefficient of two paired proteins X and Y in the PPI network. The
formula was as follows:
R=16∑di2n(n2–1)
where ‘R’ is the coefficient, ‘d’ is the difference
between the ranks of corresponding values X and Y,
‘sum(d2)’ is the total of the ‘d2’ column,
and ‘n’ is the number of observations. In the present study, the
SCC of a gene-gene interaction was defined as the weight value of
the interaction.
Module identification
Similar to the method described by Liu et al
(28), the module-identification
algorithm was performed in three steps based on clique-merging.
Firstly, all of the maximal cliques from the weighted PPI networks
of the normal sample and four histotypes were selected out,
respectively. The maximal cliques were enumerated utilizing a fast
depth-first method with a pruning-based algorithm, described by
Tomita et al (29).
Subsequently, a score was assigned to each clique, and the clique
score (C) was referred to as its weighted density:
score(C)=∑u∈C,v∈Cw(u,v)|C|⋅(|C|–1)
where w (u,v) represents the interaction weight
between u and v, based on the fast depth-first method.
In the third step, the cliques were arrayed in
descending order based on their weighted density and the highly
overlapped cliques were removed in order to reduce the size of the
result. The highly overlapped cliques were merged to construct
larger, dense sub-graphs. The term ‘inter-connectivity’ was
utilized to confirm whether the two overlapped cliques be merged
together or not. The inter-connectivity score
(C1,C2) between the non-overlapping proteins
of C1 and C2 was computed according to the
following formula:
inter–score(C1,C2)=∑u∈(C1–C2)∑v∈C2w(u,v)|C1–C2|⋅|C2|⋅∑u∈(C2–C1)∑v∈C1w(u,v)|C2–C1|⋅|C1|
The obtained clique scores were ranked in descending
order and denoted as {C1,C2,…,Ck}.
For every maximal clique Ci, if there existed another
maximal clique Cj, and Cj possessed a lower
score than Ci and
|Ci∩Cj|/|Cj|≥to (a
predefined overlap-threshold), the weighted inter-connecting score
was calculated for the distinct nodes between the two cliques.
Provided that Cj existed, the interconnectivity score
(Ci Cj) was used as a standard to determine
whether to remove Cj or merge Cj with
Ci. If the inter-score (Ci, Cj)
was higher than or equal to the predefined merge-threshold
tm, Cj and Ci were merged to
obtain a module; if not, Cj was removed. In the present
study, the overlap-threshold was 0.5 and the merge-threshold was
0.25.
Differential module
identification
Random statistical analysis was performed for the
obtained modules in the four subtypes of ovarian cancer. A p-value
cutoff of 0.01 can reveal numerous false positive results and
requires another factor. False discovery rate (FDR), one of the
most widely used multiple testing criterions for controlling errors
of false discoveries, was utilized to adjust the P-value obtained
via random statistical analysis. The FDR was first defined by
Benjamini et al (30) as
the expected proportion of the number of falsely rejected
hypotheses among the total number of rejected hypotheses. In the
present study, modules with an adjusted P<0.01 based on the FDR
measure were considered to be disrupted modules.
Pathway enrichment analysis of genes
in disrupted modules
The Database for Annotation, Visualization and
Integrated Discovery (DAVID; david.ncifcrf.gov) is a comprehensive functional
annotation software program, and is used for integrative and
systematic analysis of large gene groups (31). In the present study, KEGG
(www.genome.jp/kegg) pathway enrichment
analysis was performed using DAVID with the threshold of
FDR-adjusted P<0.001 for genes from the altered modules of
endometrioid, serous, mucinous and clear cell carcinomas samples,
respectively. For the enriched pathways, the appearance frequency
of every gene was counted. The higher a frequency of a gene, the
higher its level of involvement in pathways and the higher its
importance.
Results
Disruptions in the PPI networks of
four types of ovarian cancer
A total of 12,493 genes were obtained from normal
ovarian sample and four ovarian cancer (endometrioid, serous,
mucinous and clear cell carcinomas) samples using a data
preprocessing procedure. The normal ovarian and four ovarian cancer
PPI networks reflected equal numbers of nodes (7,264) and
interactions (45,286). Subsequently, re-weighted PPI networks of
the normal ovarian sample and the four stages of disease were
examined using the SCC algorithm. In the normal ovarian and four
ovarian cancer networks, the numbers of interactions and average
scores (weights) were approximately equal; the 45,286 interactions
had average scores of 0.083 (normal), 0.090 (endometrioid
carcinoma), 0.085 (serous carcinoma), 0.087 (mucinous carcinoma)
and 0.070 (clear cell carcinoma). The correlationwise frequency
distributions were different across the normal ovarian and four
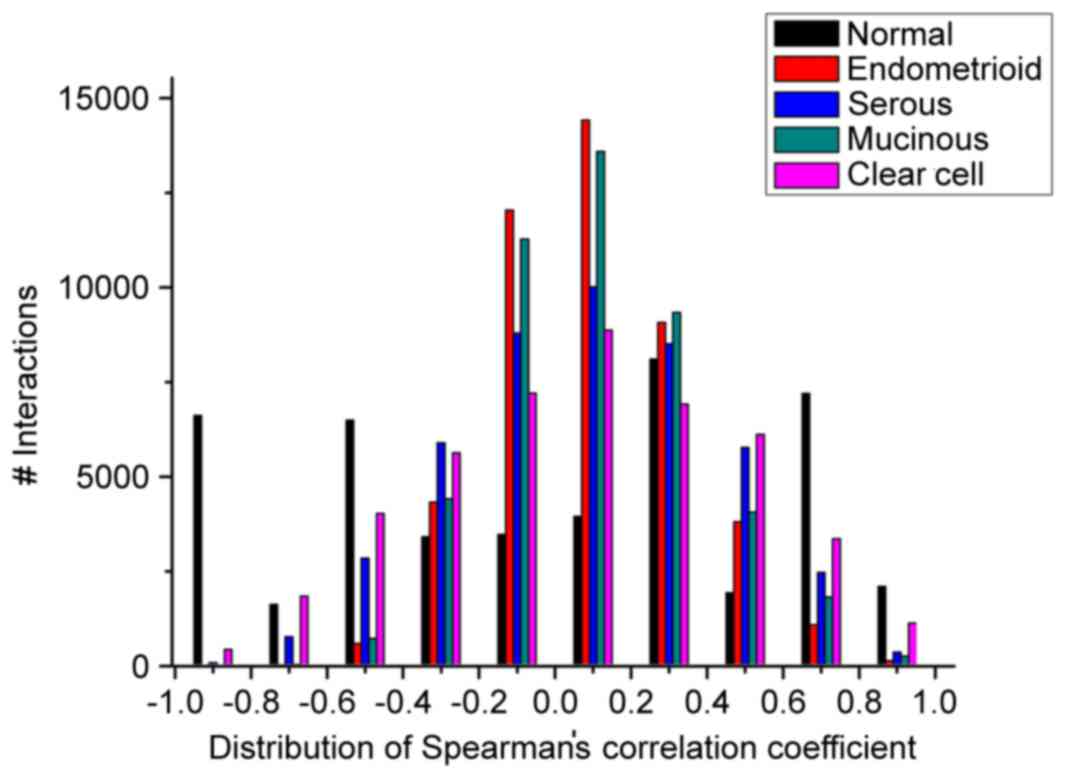
ovarian cancer networks (Fig. 1).
When the expression correlations varied between −1.0 and −0.8, −0.6
and −0.4, and 0.6 and 1.0, the number of interactions in the normal
ovarian network was higher, compared with those in the four types
of ovarian cancer. When the expression correlations varied between
−0.4 and 0.6, the number of interactions in the normal network was
almost lower, compared with those in the four types of ovarian
cancer. In addition, the scores of the total 26,651 interactions in
the four ovarian cancer networks were lower, compared with that in
the normal network, whereas the total numbers (18,635) of
interactions were higher in the disease conditions, compared with
that in the normal condition.
Disruptions in the four ovarian cancer
modules
The disrupted or altered modules from the normal and
four ovarian cancer PPI sub-networks were identified based on the
clique-merging algorithm. With the node threshold >5, a total of
951 modules were obtained under the five conditions. Comparative
analysis for normal and disease modules was then performed to
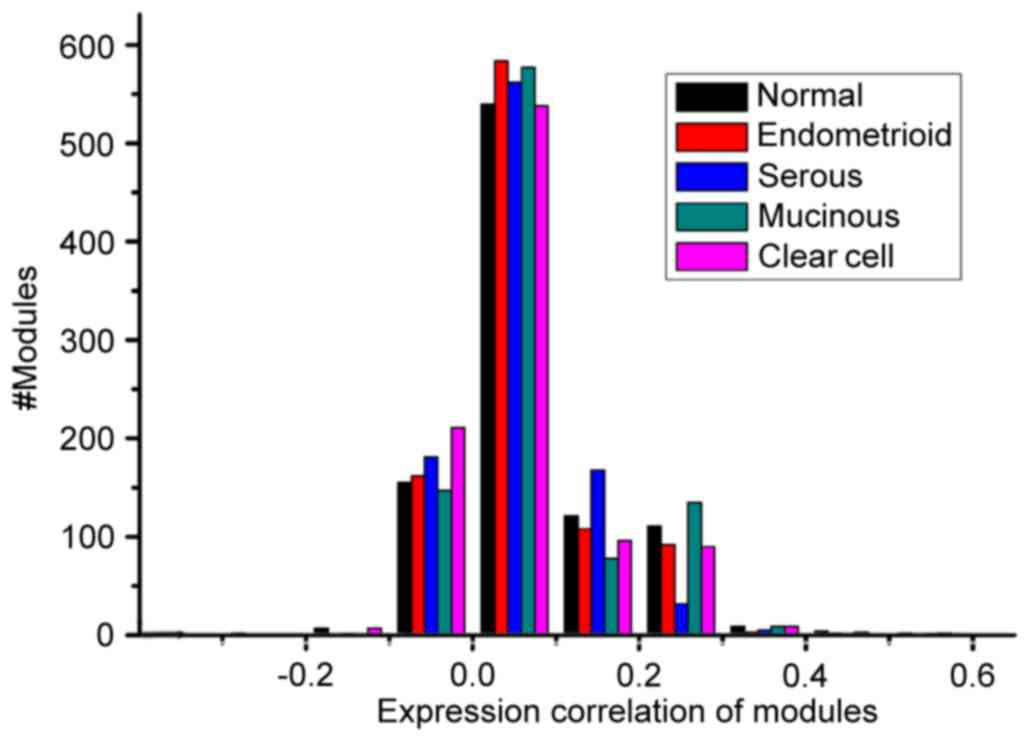
further elucidate the disruptions from a module perspective.
Notably, as shown in Table I, the
total number of modules (951) and average module size (31.83) were
the same across the five conditions, which results from the same
interactions. Furthermore, the average weighted density of mucinous
carcinoma was marginally higher, compared with that of the other
three cancer subtypes. The associations between the numbers of
modules and weighted correlation density of the modules are shown
in Fig. 2. No significant
difference was found between the distribution of modules in the
normal and disease conditions at the level of the overall
correlation distribution based on the Kolmogorov-Smirnov test
(P>0.05).
 | Table I.Properties of the normal ovarian, and
endometrioid, serous, mucinous and clear cell carcinoma
modules. |
Table I.
Properties of the normal ovarian, and
endometrioid, serous, mucinous and clear cell carcinoma
modules.
|
| Correlation |
|---|
|
|
|
|---|
| Module set | Number of
modules | Mean module
size | Maximum | Average | Minimum |
|---|
| Normal | 951 | 31.83 | 0.543 | 0.067 | −0.021 |
| Endometrioid | 951 | 31.83 | 0.442 | 0.058 | −0.055 |
| Serous | 951 | 31.83 | 0.693 | 0.058 | −0.158 |
| Nucinous | 951 | 31.83 | 0.551 | 0.072 | −0.088 |
| Clear cell | 951 | 31.83 | 0.396 | 0.049 | −0.167 |
Identification of differential
modules
In the present study, a total of 28, 133, 139 and 33
differential modules (FDR-adjusted P<0.01) were identified in
the endometrioid, serous, mucinous and clear cell carcinoma,
respectively. Extracting genes from the differential modules in the
four types of ovarian cancer resulted in 533, 491, 591 and 408
genes, respectively.
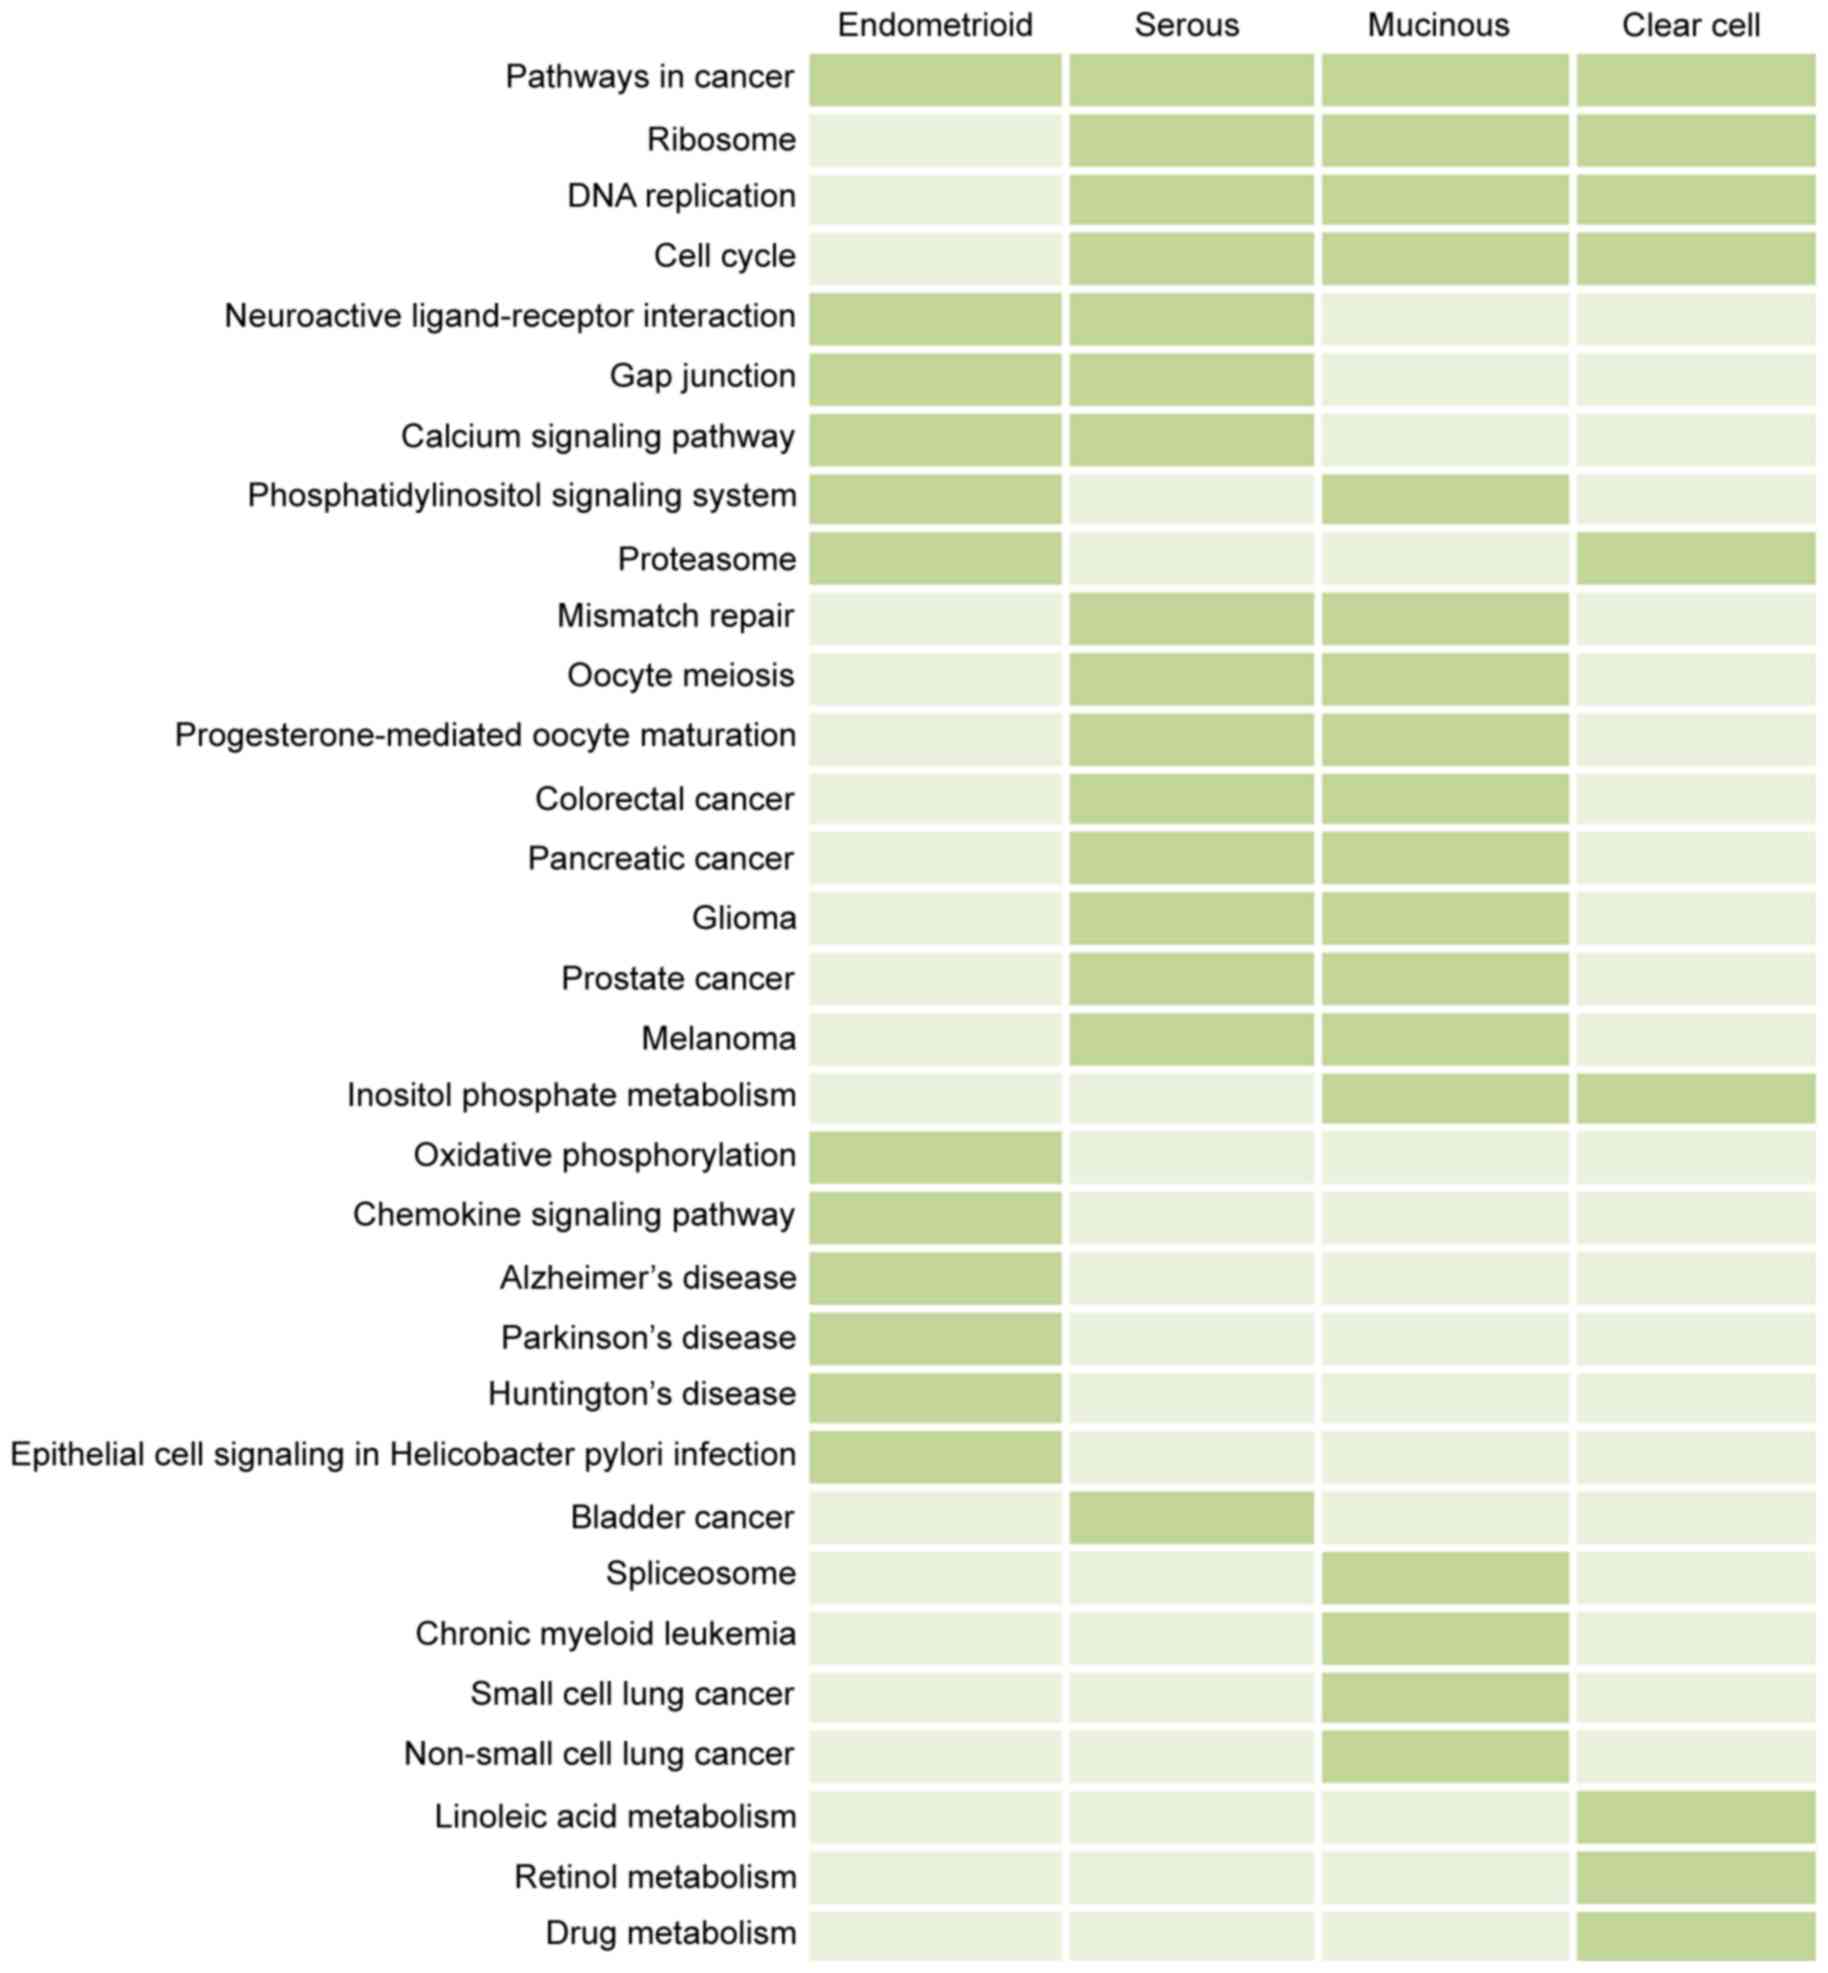
Pathway enrichment analysis of genes
in differential modules
DAVID-based KEGG functional pathway analysis was
performed for the genes involved in the differential modules. Based
on the FDR-adjusted P<0.001, a total of 12, 16, 18 and nine
significantly enriched pathways were identified in endometrioid,
serous, mucinous, and clear cell carcinoma, respectively. As shown
in Fig. 3, pathways in cancer was
a common pathway across the four subtypes of ovarian cancer, which
may be vital in the development of ovarian cancer. The cell cycle,
DNA replication and ribosome pathways were also associated with the
subtypes of ovarian cancer, with the exception of endometrioid
cancer. In addition, unlike the endometrioid, serous and mucinous
carcinoma, clear cell ovarian cancer was associated with several
metabolic pathways, including drug metabolism and retinol
metabolism. Overall, the cancer-associated pathways were important
in the development of ovarian cancer.
By identifying the intersection of the common genes
across the four ovarian cancer subtypes and the most frequent genes
in the disrupted pathways, five key genes were obtained:
Mitogen-activated protein kinase 1 (MAPK1), phosphoinositide
3-kinase-encoding catalytic α (PIK3CA), AKT serine/threonine
kinase 1 (AKT1), cyclin D1 (CCND1) and tumor protein
P53 (TP53), which may perform an essential function in the
pathogenesis of the four subtypes of ovarian cancer (Table II).
| Table II.Total 15 genes appearing most
frequently in the disrupted pathways of the four types of ovarian
carcinoma. |
Table II.
Total 15 genes appearing most
frequently in the disrupted pathways of the four types of ovarian
carcinoma.
| Endometrioid | Serous | Mucinous | Clear cell |
|---|
|
|
|
|
|---|
| Gene | Frequency | Gene | Frequency | Gene | Frequency | Gene | Frequency |
|---|
| MAPK1 | 20 | MAPK1 | 24 | MAPK1 | 24 | MAPK1 | 20 |
| PIK3CA | 16 | EGFR | 16 | PIK3CD | 20 | PIK3CA | 18 |
| EGFR | 15 | TP53 | 15 | PIK3CA | 20 | AKT1 | 17 |
| PIK3R3 | 15 | CCND1 | 14 | PIK3R2 | 19 | CCND1 | 13 |
| PIK3R2 | 15 | AKT1 | 13 | AKT1 | 18 | TP53 | 12 |
| AKT1 | 14 | PRKCG | 12 | GRB2 | 16 | PRKCG | 11 |
| TP53 | 12 | CDK4 | 11 | CCND1 | 16 | PLCG1 | 11 |
| CCND1 | 12 | EGF | 11 | SOS1 | 16 | PLCG2 | 10 |
| PRKCG | 10 | E2F1 | 10 | EGFR | 15 | RELA | 9 |
| PLCB3 | 10 | E2F3 | 10 | TP53 | 15 | PLCB3 | 9 |
| PLCB1 | 10 | RB1 | 10 | MYC | 12 | NFKB1 | 9 |
| PLCB2 | 10 | MYC | 10 | CDK4 | 11 | CDK4 | 9 |
| PTEN | 9 | PLCB3 | 9 | PLCG1 | 11 | PLCB1 | 9 |
| ERBB2 | 8 | PTEN | 9 | E2F1 | 10 | ADCY9 | 9 |
| MET | 8 | IGF1R | 9 | E2F2 | 10 | PLCB2 | 9 |
Discussion
The aim of the present study was to identify
dysregulated genes and pathways in four histotypes of ovarian
cancer via systematically tracking the dysregulated modules of
reweighted PPI networks. The reweighted PPI networks of the normal
and four ovarian cancer histotypes were obtained based on the SCC,
and the modules in the PPI networks were identified. By comparing
the modules of the normal and four ovarian cancer histotypes, 28,
133, 139 and 33 disrupted modules were obtained for endometrioid,
serous, mucinous and clear cell carcinoma, respectively. A total of
five common genes (MAPK1, PIK3CA, AKT1,
CCND1 and TP53) and one common pathway (pathways in
cancer) across the four histotypes were examined based on gene
composition and pathway enrichment analyses.
The pathways in cancer pathway covers several types
of pathway involved in cancer. Chen et al (32) documented that
PI3K/AKT/hypoxia-inducible factor-1α/CCND1 pathway is vital in
follicle-stimulating hormone-driven ovarian cancer cell
proliferation. Genistein suppresses the epithelial-mesenchymal
transition and migration efficacies of ovarian cancer cells via the
estrogen receptor pathway and downregulation of the transforming
growth factor-β signaling pathway (33). The extracellular-signal-regulated
kinase (ERK) and c-Jun N-terminal kinase (JNK) signaling pathways
can be regulated by interleukin-33, and promote ovarian cancer
growth and metastasis (34). In
addition, activation of the mammalian target of rapamycin (mTOR)
signaling pathway has been demonstrated to promote epithelial
ovarian cancer metastasis (35).
MAPKs, a family of serine/threonine protein kinases,
including p38 MAPK, ERK1/2, and stress-activated protein kinases
(JNK). MAPKs are mediators of comprehensive cellular programs,
including cell proliferation, cell differentiation and cell
apoptosis, in response to distinct stimuli (36). Studies have found that MAPKs are
transiently triggered during mitosis and MAPK activation is
involved in the spindle assembly checkpoint (37). Consistently, the protein levels of
MAPK1 are increased following demecolcine treatment (38). The proto-oncoprotein, Mos, a
serine/threonine kinase, has been recognized as a potent activator
of MAPK1 during oocyte maturation (39,40).
The overexpression of microRNA-378a-3p or silencing of MAPK1 can
reduce the expression level of MAPK1 and enhance adipogenesis
(41).
The PIK3CA protein modulates various signals to
restrain apoptosis and facilitate cell survival and proliferation
in several types of cell (42,43).
It has been demonstrated that oncogenic mutations and amplification
of PIK3CA can activate the PI3 K/Akt signaling pathway to initiate
human papillomavirus-induced tumorigenesis and other types of
cancer (44–46). Akt is a serine/threonine protein
kinase comprising Akt1, Akt2 and Akt3. Akt1 encodes the principal
Akt isoform associated with apoptosis regulation (47). In oropharyngeal cancer, the high
protein level of Akt can be an unfavorable prognostic biomarker for
relapse-free survival rates in patients (48). The importance of the PI3K/AKT
signaling pathway in ovarian cancer has been well documented. In
general, this pathway has significant roles in gene transcription,
protein synthesis and membrane trafficking, however, the abnormal
triggering of this pathway leads to cancer initiation, progression
and invasion (49,50). PIK3CA and AKT1 amplification are
regarded as prognostic factors for ovarian cancer, and the
PI3K/AKT/mTOR axis may become a target for drugs.
Another oncogene, CCND1 is a dominating driver of
several types of human tumor, including squamous cell and breast
cancer, myeloma and Bcell lymphoma (51,52).
A previous study indicated that CCND1 was overexpressed in >50%
of human breast cancer cases (51). In mice, mammary-targeted gene
overexpression resulted in mammary tumorigenesis (53). It has been demonstrated that
jumonji and AT-rich interaction domain containing 2 can
significantly inhibit leukemia cell proliferation by downregulating
the expression of CCND1. In addition, the overexpression of CCND1
is closely associated with low-grade ovarian cancer, which is in
line with the suggestion that CCND1 is a downstream target for the
active MAPK constitutively expressed in ovarian tumors (54,55).
TP53 is a critical transcriptional regulator, which
is involved in cell cycle and cell apoptosis upon activation by
oncogenes and DNA damage (56).
The activated TP53 protein is combined with the regulatory region
of target genes to initiate the cell cycle (57). TP53 mutations are frequently
screened genetic alterations in ovarian cancer (58). Reles et al (59) reported that the TP53 alteration
closely correlates with poor response to chemotherapy, early
recurrence and shortened survival rates in patients with ovarian
cancer. The high prevalence of TP53 mutations in tubal epithelial
carcinoma shows that the TP53 mutations occur in early
carcinogenesis. Thus, TP53 mutations are considered to be poor
prognostic factors (60). However,
TP53 has been confirmed as an effective blood-based biomarker for
the detection of ovarian cancer (61).
In conclusion, the present study successfully
identified disrupted modules, including the pathways in cancer
module, and hub genes (MAPK1, PIK3CA, AKT1, CCND1 and
TP53) in four types of ovarian cancer based on the
integrated PPI network. It was inferred that these pathways and
genes may be potential biological processes and markers for
understanding the mechanism underlying ovarian cancer.
Acknowledgements
The authors would like to thank the Beijing Springer
Medical Research Institute for editing the manuscript.
References
|
1
|
Coleman RL, Monk BJ, Sood AK and Herzog
TJ: Latest research and treatment of advanced-stage epithelial
ovarian cancer. Nat Rev Clin Oncol. 10:211–224. 2013. View Article : Google Scholar : PubMed/NCBI
|
|
2
|
Fredrickson TN: Ovarian tumors of the hen.
Environ Health Perspect. 73:35–51. 1987. View Article : Google Scholar : PubMed/NCBI
|
|
3
|
Barua A, Bitterman P, Abramowicz JS, Dirks
AL, Bahr JM, Hales DB, Bradaric MJ, Edassery SL, Rotmensch J and
Luborsky JL: Histopathology of ovarian tumors in laying hens: A
preclinical model of human ovarian cancer. Int J Gynecol Cancer.
19:531–539. 2009. View Article : Google Scholar : PubMed/NCBI
|
|
4
|
Feeley KM and Wells M: Precursor lesions
of ovarian epithelial malignancy. Histopathology. 38:87–95. 2001.
View Article : Google Scholar : PubMed/NCBI
|
|
5
|
Bell DA: Origins and molecular pathology
of ovarian cancer. Mod Pathol. 18 Suppl 2:S19–S32. 2005. View Article : Google Scholar : PubMed/NCBI
|
|
6
|
Moorman PG, Palmieri RT, Akushevich L,
Berchuck A and Schildkraut JM: Ovarian cancer risk factors in
African-American and white women. Am J Epidemiol. 170:598–606.
2009. View Article : Google Scholar : PubMed/NCBI
|
|
7
|
Sharifian A, Pourhoseingholi MA,
Norouzinia M and Vahedi M: Ovarian cancer in Iranian women, a trend
analysis of mortality and incidence. Asian Pac J Cancer Prev.
15:10787–10790. 2014. View Article : Google Scholar : PubMed/NCBI
|
|
8
|
Vaughan S, Coward JI, Bast RC Jr, Berchuck
A, Berek JS, Brenton JD, Coukos G, Crum CC, Drapkin R,
Etemadmoghadam D, et al: Rethinking ovarian cancer: Recommendations
for improving outcomes. Nat Rev Cancer. 11:719–725. 2011.
View Article : Google Scholar : PubMed/NCBI
|
|
9
|
Lengauer C, Kinzler KW and Vogelstein B:
Genetic instabilities in human cancers. Nature. 396:643–649. 1998.
View Article : Google Scholar : PubMed/NCBI
|
|
10
|
Konstantinopoulos PA, Spentzos D and
Cannistra SA: Gene-expression profiling in epithelial ovarian
cancer. Nat Clin Pract Oncol. 5:577–587. 2008. View Article : Google Scholar : PubMed/NCBI
|
|
11
|
Meinhold-Heerlein I, Bauerschlag D, Zhou
Y, Sapinoso LM, Ching K, Frierson H Jr, Bräutigam K, Sehouli J,
Stickeler E, Könsgen D, et al: An integrated clinical-genomics
approach identifies a candidate multi-analyte blood test for serous
ovarian carcinoma. Clin Cancer Res. 13:458–466. 2007. View Article : Google Scholar : PubMed/NCBI
|
|
12
|
Ansenberger K, Zhuge Y, Lagman JA,
Richards C, Barua A, Bahr JM and Hales DB: E-cadherin expression in
ovarian cancer in the laying hen, Gallus domesticus, compared to
human ovarian cancer. Gynecol Oncol. 113:362–369. 2009. View Article : Google Scholar : PubMed/NCBI
|
|
13
|
Jackson E, Anderson K, Ashwell C, Petitte
J and Mozdziak PE: CA125 expression in spontaneous ovarian
adenocarcinomas from laying hens. Gynecol Oncol. 104:192–198. 2007.
View Article : Google Scholar : PubMed/NCBI
|
|
14
|
Zhuge Y, Lagman JA, Ansenberger K, Mahon
CJ, Daikoku T, Dey SK, Bahr JM and Hales DB: CYP1B1 expression in
ovarian cancer in the laying hen Gallusdomesticus. Gynecol Oncol.
112:171–178. 2009. View Article : Google Scholar : PubMed/NCBI
|
|
15
|
Zidar N, Odar K, Glavac D, Jerse M, Zupanc
T and Stajer D: Cyclooxygenase in normal human tissues-is COX-1
really a constitutive isoform and COX-2 an inducible isoform? J
Cell Mol Med. 13:3753–3763. 2009. View Article : Google Scholar : PubMed/NCBI
|
|
16
|
Spandidos DA, Dokianakis DN, Kallergi G
and Aggelakis E: Molecular basis of gynecological cancer. Ann NY
Acad Sci. 900:56–64. 2000. View Article : Google Scholar : PubMed/NCBI
|
|
17
|
Cancer Genome Atlas Research Network, .
Integrated genomic analyses of ovarian carcinoma. Nature.
474:609–615. 2011. View Article : Google Scholar : PubMed/NCBI
|
|
18
|
Lafky JM, Wilken JA, Baron AT and Maihle
NJ: Clinical implications of the ErbB/epidermal growth factor (EGF)
receptor family and its ligands in ovarian cancer. Biochim Biophys
Acta. 1785:232–265. 2008.PubMed/NCBI
|
|
19
|
Li Q, Zeng X, Cheng X, Zhang J, Ji J, Wang
J, Xiong K, Qi Q and Huang W: Diagnostic value of dual detection of
hepatocyte nuclear factor 1 beta (HNF-1beta) and napsin A for
diagnosing ovarian clear cell carcinoma. Int J Clin Exp Pathol.
8:8305–8310. 2015.PubMed/NCBI
|
|
20
|
Gavin AC, Aloy P, Grandi P, Krause R,
Boesche M, Marzioch M, Rau C, Jensen LJ, Bastuck S, Dümpelfeld B,
et al: Proteome survey reveals modularity of the yeast cell
machinery. Nature. 440:631–636. 2006. View Article : Google Scholar : PubMed/NCBI
|
|
21
|
Jordán F, Nguyen TP and Liu WC: Studying
protein-protein interaction networks: A systems view on diseases.
Brief Funct Genomics. 11:497–504. 2012. View Article : Google Scholar : PubMed/NCBI
|
|
22
|
Wu C, Zhu J and Zhang X: Integrating gene
expression and protein-protein interaction network to prioritize
cancer-associated genes. BMC Bioinformatics. 13:1822012. View Article : Google Scholar : PubMed/NCBI
|
|
23
|
Srihari S and Ragan MA: Systematic
tracking of dysregulated modules identifies novel genes in cancer.
Bioinformatics. 29:1553–1561. 2013. View Article : Google Scholar : PubMed/NCBI
|
|
24
|
Hendrix ND, Wu R, Kuick R, Schwartz DR,
Fearon ER and Cho KR: Fibroblast growth factor 9 has oncogenic
activity and is a downstream target of Wnt signaling in ovarian
endometrioid adenocarcinomas. Cancer Res. 66:1354–1362. 2006.
View Article : Google Scholar : PubMed/NCBI
|
|
25
|
Irizarry RA, Hobbs B, Collin F,
Beazer-Barclay YD, Antonellis KJ, Scherf U and Speed TP:
Exploration, normalization, and summaries of high density
oligonucleotide array probe level data. Biostatistics. 4:249–264.
2003. View Article : Google Scholar : PubMed/NCBI
|
|
26
|
Nguyen PV, Srihari S and Leong HW:
Identifying conserved protein complexes between species by
constructing interolog networks. BMC Bioinformatics. 14 Suppl
16:S82013. View Article : Google Scholar : PubMed/NCBI
|
|
27
|
Shannon P, Markiel A, Ozier O, Baliga NS,
Wang JT, Ramage D, Amin N, Schwikowski B and Ideker T: Cytoscape: A
software environment for integrated models of biomolecular
interaction networks. Genome Res. 13:2498–2504. 2003. View Article : Google Scholar : PubMed/NCBI
|
|
28
|
Liu G, Wong L and Chua HN: Complex
discovery from weighted PPI networks. Bioinformatics. 25:1891–1897.
2009. View Article : Google Scholar : PubMed/NCBI
|
|
29
|
Tomita E, Tanaka A and Takahashi H: The
worst-case time complexity for generating all maximal cliques and
computational experiments. Theoret Comput Sci. 363:28–42. 2006.
View Article : Google Scholar
|
|
30
|
Benjamini Y, Drai D, Elmer G, Kafkafi N
and Golani I: Controlling the false discovery rate in behavior
genetics research. Behav Brain Res. 125:279–284. 2001. View Article : Google Scholar : PubMed/NCBI
|
|
31
|
da W Huang, Sherman BT and Lempicki RA:
Systematic and integrative analysis of large gene lists using DAVID
bioinformatics resources. Nat Protoc. 4:44–57. 2009.PubMed/NCBI
|
|
32
|
Chen J, Bai M, Ning C, Xie B, Zhang J,
Liao H, Xiong J, Tao X, Yan D, Xi X, et al: Gankyrin facilitates
follicle-stimulating hormone-driven ovarian cancer cell
proliferation through the PI3K/AKT/HIF-1alpha/cyclin D1 pathway.
Oncogene. 35:2506–2517. 2016. View Article : Google Scholar : PubMed/NCBI
|
|
33
|
Kim YS, Choi KC and Hwang KA: Genistein
suppressed epithelial-mesenchymal transition and migration
efficacies of BG-1 ovarian cancer cells activated by estrogenic
chemicals via estrogen receptor pathway and downregulation of TGF-β
signaling pathway. Phytomedicine. 22:993–999. 2015. View Article : Google Scholar : PubMed/NCBI
|
|
34
|
Tong X, Barbour M, Hou K, Gao C, Cao S,
Zheng J, Zhao Y, Mu R and Jiang HR: Interleukin-33 predicts poor
prognosis and promotes ovarian cancer cell growth and metastasis
through regulating ERK and JNK signaling pathways. Mol Oncol.
10:113–125. 2016. View Article : Google Scholar : PubMed/NCBI
|
|
35
|
Wang Q, Tang Y, Yu H, Yin Q, Li M, Shi L,
Zhang W, Li D and Li L: CCL18 from tumor-cells promotes epithelial
ovarian cancer metastasis via mTOR signaling pathway. Mol Carcinog.
55:1688–1699. 2016. View Article : Google Scholar : PubMed/NCBI
|
|
36
|
Su YQ, Wigglesworth K, Pendola FL, O'Brien
MJ and Eppig JJ: Mitogen-activated protein kinase activity in
cumulus cells is essential for gonadotropin-induced oocyte meiotic
resumption and cumulus expansion in the mouse. Endocrinology.
143:2221–2232. 2002. View Article : Google Scholar : PubMed/NCBI
|
|
37
|
Guadagno TM and Ferrell JE Jr: Requirement
for MAPK activation for normal mitotic progression in Xenopus egg
extracts. Science. 282:1312–1315. 1998. View Article : Google Scholar : PubMed/NCBI
|
|
38
|
Gao Y, Ren J, Zhang L, Zhang Y, Wu X,
Jiang H, Xu F, Yuan B, Yu X and Zhang J: The effects of
demecolcine, alone or in combination with sucrose on bovine oocyte
protrusion rate, MAPK1 protein level and c-mos gene expression
level. Cell Physiol Biochem. 34:1974–1982. 2014. View Article : Google Scholar : PubMed/NCBI
|
|
39
|
Posada J, Yew N, Ahn NG, Woude GF Vande
and Cooper JA: Mos stimulates MAP kinase in Xenopus oocytes and
activates a MAP kinase kinase in vitro. Mol Cell Biol.
13:2546–2553. 1993. View Article : Google Scholar : PubMed/NCBI
|
|
40
|
Shibuya EK and Ruderman JV: Mos induces
the in vitro activation of mitogen-activated protein kinases in
lysates of frog oocytes and mammalian somatic cells. Mol Biol Cell.
4:781–790. 1993. View Article : Google Scholar : PubMed/NCBI
|
|
41
|
Huang N, Wang J, Xie W, Lyu Q, Wu J, He J,
Qiu W, Xu N and Zhang Y: MiR-378a-3p enhances adipogenesis by
targeting mitogen-activated protein kinase 1. Biochem Biophys Res
Commun. 457:37–42. 2015. View Article : Google Scholar : PubMed/NCBI
|
|
42
|
Yao R and Cooper GM: Requirement for
phosphatidylinositol-3 kinase in the prevention of apoptosis by
nerve growth factor. Science. 267:2003–2006. 1995. View Article : Google Scholar : PubMed/NCBI
|
|
43
|
Liang J and Slingerland JM: Multiple roles
of the PI3K/PKB (Akt) pathway in cell cycle progression. Cell
Cycle. 2:339–345. 2003. View Article : Google Scholar : PubMed/NCBI
|
|
44
|
Lee CM, Fuhrman CB, Planelles V, Peltier
MR, Gaffney DK, Soisson AP, Dodson MK, Tolley HD, Green CL and
Zempolich KA: Phosphatidylinositol 3-kinase inhibition by LY294002
radiosensitizes human cervical cancer cell lines. Clin Cancer Res.
12:250–256. 2006. View Article : Google Scholar : PubMed/NCBI
|
|
45
|
Keysar SB, Astling DP, Anderson RT, Vogler
BW, Bowles DW, Morton JJ, Paylor JJ, Glogowska MJ, Le PN,
Eagles-Soukup JR, et al: A patient tumor transplant model of
squamous cell cancer identifies PI3K inhibitors as candidate
therapeutics in defined molecular bins. Mol Oncol. 7:776–790. 2013.
View Article : Google Scholar : PubMed/NCBI
|
|
46
|
Bertelsen BI, Steine SJ, Sandvei R, Molven
A and Laerum OD: Molecular analysis of the PI3K-AKT pathway in
uterine cervical neoplasia: Frequent PIK3CA amplification and AKT
phosphorylation. Int J Cancer. 118:1877–1883. 2006. View Article : Google Scholar : PubMed/NCBI
|
|
47
|
Datta SR, Brunet A and Greenberg ME:
Cellular survival: A play in three Akts. Genes Dev. 13:2905–2927.
1999. View Article : Google Scholar : PubMed/NCBI
|
|
48
|
Won HS, Jung CK, Chun SH, Kang JH, Kim YS,
Sun DI and Kim MS: Difference in expression of EGFR, pAkt, and PTEN
between oropharyngeal and oral cavity squamous cell carcinoma. Oral
Oncol. 48:985–990. 2012. View Article : Google Scholar : PubMed/NCBI
|
|
49
|
Chalhoub N and Baker SJ: PTEN and the
PI3-kinase pathway in cancer. Annu Rev Pathol. 4:127–150. 2009.
View Article : Google Scholar : PubMed/NCBI
|
|
50
|
Zhang S and Yu D: PI(3)king apart PTEN's
role in cancer. Clin Cancer Res. 16:4325–4330. 2010. View Article : Google Scholar : PubMed/NCBI
|
|
51
|
Arnold A and Papanikolaou A: Cyclin D1 in
breast cancer pathogenesis. J Clin Oncol. 23:4215–4224. 2005.
View Article : Google Scholar : PubMed/NCBI
|
|
52
|
Motokura T, Bloom T, Kim HG, Jüppner H,
Ruderman JV, Kronenberg HM and Arnold A: A novel cyclin encoded by
a bcl1-linked candidate oncogene. Nature. 350:512–515. 1991.
View Article : Google Scholar : PubMed/NCBI
|
|
53
|
Wang TC, Cardiff RD, Zukerberg L, Lees E,
Arnold A and Schmidt EV: Mammary hyperplasia and carcinoma in
MMTV-cyclin D1 transgenic mice. Nature. 369:669–671. 1994.
View Article : Google Scholar : PubMed/NCBI
|
|
54
|
Worsley SD, Ponder BA and Davies BR:
Overexpression of cyclin D1 in epithelial ovarian cancers. Gynecol
Oncol. 64:189–195. 1997. View Article : Google Scholar : PubMed/NCBI
|
|
55
|
Sui L, Tokuda M, Ohno M, Hatase O and
Hando T: The concurrent expression of p27(kip1) and cyclin D1 in
epithelial ovarian tumors. Gynecol Oncol. 73:202–209. 1999.
View Article : Google Scholar : PubMed/NCBI
|
|
56
|
Vousden KH and Prives C: Blinded by the
light: The growing complexity of p53. Cell. 137:413–431. 2009.
View Article : Google Scholar : PubMed/NCBI
|
|
57
|
Vogelstein B, Lane D and Levine AJ:
Surfing the p53 network. Nature. 408:307–310. 2000. View Article : Google Scholar : PubMed/NCBI
|
|
58
|
Lynch HT, Casey MJ, Snyder CL, Bewtra C,
Lynch JF, Butts M and Godwin AK: Hereditary ovarian carcinoma:
Heterogeneity, molecular genetics, pathology, and management. Mol
Oncol. 3:97–137. 2009. View Article : Google Scholar : PubMed/NCBI
|
|
59
|
Reles A, Wen WH, Schmider A, Gee C,
Runnebaum IB, Kilian U, Jones LA, El-Naggar A, Minguillon C,
Schönborn I, et al: Correlation of p53 mutations with resistance to
platinum-based chemotherapy and shortened survival in ovarian
cancer. Clin Cancer Res. 7:2984–2997. 2001.PubMed/NCBI
|
|
60
|
Piek JM, van Diest PJ, Zweemer RP, Jansen
JW, Poort-Keesom RJ, Menko FH, Gille JJ, Jongsma AP, Pals G,
Kenemans P and Verheijen RH: Dysplastic changes in prophylactically
removed Fallopian tubes of women predisposed to developing ovarian
cancer. J Pathol. 195:451–456. 2001. View Article : Google Scholar : PubMed/NCBI
|
|
61
|
Lu D, Kuhn E, Bristow RE, Giuntoli RL II,
Kjaer SK, Shih IeM and Roden RB: Comparison of candidate serologic
markers for type I and type II ovarian cancer. Gynecol Oncol.
122:560–566. 2011. View Article : Google Scholar : PubMed/NCBI
|