Introduction
There were an estimated 10.4 million new cases of
tuberculosis (TB) occurring in 2015, with TB still one of the top
10 causes of death worldwide (1).
Disease progression is one of the most predominant causes of TB
mortality and the mortality rate of patients with severe pulmonary
TB is 69–80% (2). Pulmonary TB is
characterized by granuloma formation, caseation and ultimately
pulmonary cavitation, reflecting a complex interplay that exists
between distinctive components of the innate and acquired immune
responses, as well as with the pathogen itself (3).
The human body releases TB-associated proteins into
the bloodstream through several signaling pathways when infected by
Mycobacterium tuberculosis, and varying concentrations of
proteins can be released under different severity states of the
disease (4). A previous study
reported that expression levels of certain proteins, such as
peroxiredoxin 1 and myosin heavy chain 9, in serum samples obtained
from patients with active or latent TB infections were different
from those in healthy people (5).
The efficiency for identification of novel biomarkers from clinical
samples has been greatly improved due to the development of
quantitative proteomic approaches (6). Li et al (7) demonstrated that the detection of
upregulated sex hormone-binding globulin (SHBG) expression may be
used to diagnose pulmonary TB with 78.74% accuracy, 75.6%
sensitivity and 91.5% specificity, indicating that SHBG may be a
novel potential serum biomarker for pulmonary TB. Therefore,
different disease severity states may be detected by different
protein biomarkers. However, the pathogenesis of TB progression
remains unclear and only a limited number of biomarkers for severe
TB have been reported.
In order to better characterize specific biomarkers
for different severity states of TB, the present study used
proteomic technology to screen distinct proteins in different
stages of TB. Functional and pathway enrichment analyses were
performed for distinct proteins, which may better the understanding
of the pathogenesis of TB progression. Furthermore, differentially
expressed proteins in serum were validated by western blot analysis
and enzyme-linked immunosorbent assays (ELISAs). In addition, the
accuracy, sensitivity and specificity for selected protein
biomarkers in diagnosing severe TB was evaluated.
Patients and methods
Patients
Subjects were prospectively enrolled and recruited
by the staff at the Beijing Chest Hospital affiliated to Capital
Medical University (Beijing, China) between March and October 2015.
The present study was conducted according to the principles of the
Declaration of Helsinki and approved by the Ethical Committee of
the Beijing Chest Hospital affiliated to Capital Medical University
(Beijing, China). All participants were ≥18 years old and provided
written informed consent. Individuals receiving immunomodulatory
therapy, with extrapulmonary TB, autoimmune disease, chronic
disease, malignancies or HIV infection were excluded.
The patients were diagnosed with TB according to
combined clinical criteria from the World Health Organization
(8). Included patients with
pulmonary TB had a positive sputum smear or culture result. The
present study included 211 specimens and 161 samples, which were
obtained from 161 patients with TB. Patients with pulmonary TB were
further stratified according to disease severity, into a severe
pulmonary TB (STB) group and a mild pulmonary TB (MTB) group.
Patients were considered to be STB if three or more lung lobe
alterations were observed in a chest computed tomography (CT) scan,
with respiratory failure or hypoxemia (9). Patients were classified as MTB if
they had less than three lung lobe alterations observed in a chest
CT and normal blood oxygen. In the present study, the 161 patients
were divided into 81 STB and 80 MTB cases.
Healthy subjects were recruited from a population
who had no exposure to Mycobacterium tuberculosis, a
negative tuberculin skin test and T-SPOT TB test result, a normal
chest CT and no clinical evidence of any other diseases. A total of
50 age-matched non-Mycobacterium tuberculosis infected
healthy control samples (NC) were selected. There was no
significant difference in age, sex ratio, body mass index or
smoking habits among patients in the STB, MTB and NC groups (all
P>0.05; Table I).
 | Table I.Characteristics of patients with TB
and NC group. |
Table I.
Characteristics of patients with TB
and NC group.
| Patient
characteristics | Severe TB | Mild TB | NC | P-value (STB vs.
MTB) | P-value (STB vs.
NC) |
|---|
| Diagnosis (n) | 81 | 80 | 50 |
|
|
| Age, years | 55.31±18.24 | 50.43±17.27 | 49.83±18.09 | 0.08 | 0.10 |
| Male (n) | 54 | 52 | 32 |
|
|
| Female (n) | 27 | 28 | 18 | 0.82 | 0.75 |
| BMI | 21.07±3.12 | 23.17±3.03 | 22.49±2.98 | 0.05 | 0.06 |
| Smoking history, n
(%) | 31 (38.27) | 28 (35.00) | 19 (38.00) | 0.67 | 0.97 |
Plasma sampling and protein
extraction
All blood samples from each group were collected
from venous catheters into tubes containing EDTA. Blood samples
were centrifuged at 1,400 × g for 5 min at 4°C and plasma was
stored at −80°C.
Albumin and immunoglobulin G (IgG) were removed
using an immunodepletion column according to the manufacturer's
instructions (Agilent Technologies, Inc., Santa Clara, CA, USA).
Briefly, plasma samples (600 µl) were transferred into a 1.5 ml
screw cap tube and centrifuged at 10,000 × g for 30 min at 4°C.
Following this, 100 µl lysis buffer (7 M urea and 2 M thiourea; pH
7.4) was added into each sample. Proteins were subsequently diluted
in 50 mM NH4HCO3 solution to a final
concentration of 0.5 mg/ml. Finally, trypsin (Promega Corporation,
Madison, WI, USA) was added at an enzyme-to-substrate ratio of 1:50
at 37°C for 12 h. Digested supernatant fractions were stored at
−80°C without further treatment until liquid chromatography-tandem
mass spectrometry (LC-MS/MS) analysis.
Label-free LC-MS/MS analysis
Digested peptide mixtures were pressure-loaded onto
a fused silica capillary column packed with 3 µm dionex C18
reversed phase material (Phenomenex, Inc., Tianjin, China). The
reverse phase sections (pore size, 100Å) were 15 cm in length and
the column was washed with buffer A (water, 0.1% formic acid) and
buffer B (acetonitrile, 0.1% formic acid). Following desalting, a
C18 capture tip (5 mm; 300 µm) was placed in line with an Agilent
1,100 quaternary high performance liquid chromatography system
(Agilent Technologies, Inc.) and analyzed using a 12-step
separation. Tryptic peptides (100 µg) were eluted with a linear
gradient from 2–100% buffer B over 70 min at a flow rate of 0.5
µl/min. As peptides were eluted from the micro-capillary column,
they were electrosprayed directly into a mass spectrometer with
(micrOTOF-Q II; Bruker Scientific Technology Co., Ltd., Beijing,
China) with the application of a distal 180°C source temperature of
N2 and a nebulizer pressure of 50 psi. The mass
spectrometer was operated in the MS/MS (auto) mode, and the
ionization mode used was positive.
Quantitative shotgun proteomics data
analysis
Data-independent ion selection was monitored to
select the most abundant two ions from an MS scan for analysis.
Dynamic exclusion was continued for 5 min, and performed for 70 min
in total. Mass spectra were processed with DataAnalysis version 4.1
(Bruker Scientific Technology Co., Ltd.) and the Mascot generic
format files were searched against the NCBI human database for
tryptic peptides with up to one miscleavage using Mascot software
version 2.1 (Matrix Science, Ltd., London, UK).
Bioinformatics analysis
Tandem mass spectra were searched for in the
National Centre for Biotechnology Information (NCBI) database
(https://www.ncbi.nlm.nih.gov) using
Mascot software 2.1 (Matrix Science, Ltd.). The default parameters
for the quantification software, ProfileAnalysis software version
2.0, were used throughout the analysis (Bruker Scientific
Technology Co., Ltd.). The differentially expressed proteins were
identified with the cut-off criteria of false discovery rate
<0.01 and |log2 fold change (FC)|>1. Gene ontology
(GO) annotation was carried out to categorize proteins based on
biological process (BP), cellular component (CC) and molecular
function (MF) using the Protein Analysis Through Evolutionary
Relationships database (www.pantherdb.org) (10). Signaling pathway analysis was
performed using the Search & Color Pathway tool on the Kyoto
Encyclopedia of Genes and Genome (KEGG) database (www.genome.jp/kegg/pathway.html).
Pathway enrichment analysis was conducted with the Database for
Annotation, Visualization and Integrated Discovery (http://kobas.cbi.pku.edu.cn/anno_iden.php.) (11), with P<0.05 used as the cut-off
value. Protein-protein interactions were obtained from the Search
Tool for the STRING database (version 9.0; http://string-db.org/cgi/input.pl), containing known
and predicted physical and functional protein-protein interactions
(12).
Western blot analysis
Six different serum samples from each group were
used for western blot analysis. Proteins were extracted using
radioimmunoprecipitation assay lysis buffer (50 mM Tris-HCl pH 8.0,
150 mM NaCl, 1% NP-40, 1% deoxycholic acid sodium, 0.1% SDS, 0.1M
phenylmethane sulfonyl fluoride, Roche Complete protease inhibitor
cocktail tablets and phosphastase inhibitor cocktail tablets).
Following this, total protein was determined using a bicinchoninic
acid assay, and protein samples (20 µg/lane) were subsequently
separated via 8, 12 and 15% SDS-PAGE gels and transferred onto
polyvinylidene fluoride membranes. Following blocking with 3%
bovine serum albumin with Tris-buffered saline containing 0.1%
Tween-20 (pH 8.0; Sigma-Aldrich; Merck KGaA) at 25°C for 30 min,
the membranes were incubated overnight at 4°C with primary
antibodies against interleukin-36α (IL-36α; cat. no. ab117925;
1:1,000), α-1-acid glycoprotein (ORM)1 (cat. no. ab134042;
1:2,000), ORM2 (cat. no. ab88869; 1:2,000), S100 calcium binding
protein A9 (S100A9; cat. no. ab92057; 1:1,000), superoxide
dismutase (SOD)1 (cat. no. ab51254; 1:1,000), probetacellulin
precursor (BTC; cat. no. ab10417; 1:1,000), tyrosine-protein kinase
Lyn isoform B (LYN; cat. no. ab32398; 1:4,000) and collagen III
(cat. no. ab7778; 1:1,000; all Abcam, Cambridge, MA, USA).
Membranes were washed with Tris-buffered saline (10 mmol/l
Tris-HCl, 150 mmol/l NaCl and 0.1% Tween-20 containing 5% skimmed
milk) prior to incubation with horseradish peroxidase-conjugated
anti-rabbit IgG (cat. no. S006; 1:5,000) or anti-mouse IgG (cat.
no. S002; 1:5,000; both Santa Cruz Biotechnology, Santa Cruz, CA,
USA) for 1 h at room temperature. Transferrin (cat. no. YM3527;
1:10,000; Beyotime Institute of Biotechnology, Haimen, China) was
used as an internal reference. Proteins were visualized using an
electrochemiluminescence kit (Amersham Biosciences,
Buckinghamshire, UK) according to the manufacturer's instructions.
Proteins levels were normalized via staining with 2% Ponceau S
stain for 1 min at 25°C, and transferrin (cat. no. YM3527;
1:10,000; Beyotime Institute of Biotechnology) was used as the
loading control. Densitometric analysis was performed using Quant
software (version 11.5; TotalLab, Ltd., Newcastle upon Tyne, UK).
The experiments were performed in triplicate.
Validation of selected protein
expression levels
ELISAs were performed to determinate the protein
concentrations in plasma samples of STB, MTB and the NC groups. The
commercial ELISA kits for four selected proteins were purchased
including human IL-36α ELISA kit (cat. no. KA9520; 1:50), human
ORM2 ELISA kit (cat. no. KA0480; 1:100), human protein S100-A9
ELISA kit (cat. no. KA1050; 1:50 dilution) and human SOD1 ELISA kit
(cat. no. KA0680; 1:50; all Abnova, Taipei, Taiwan). The ELISA was
performed according to the manufacturer's protocol. Protein levels
of IL-36α, ORM2, S100-A9 and SOD1 in STB (n=72), MTB (n=71), and NC
samples (n=41) were measured.
Statistical analysis
Statistical analysis was performed using SPSS
version 18.0 (SPSS, Inc., Chicago, IL, USA). Qualitative variables
were analyzed by the Fisher's exact test and Pearson's chi-squared
test, while quantitative variables were analyzed by one-way ANOVA
followed by the Student-Newman-Keuls post hoc test. P<0.05 was
considered to indicate a statistically significant difference.
Receiver operating characteristic curves were used to assess the
diagnostic value of biomarkers.
Results
Identification of differentially
expressed proteins by label-free quantitative shotgun proteomics
analysis
The mass spectra data were searched using the
profile analysis search algorithm against Human RefSeq protein
database (https://www.ncbi.nlm.nih.gov), which is comprised of
69,002 protein sequences. A total of 3,385 proteins were quantified
across all three biological replicates in each group (n=9) using
the label-free proteomics analysis method.
Based on the LC-MS/MS data, 1,011 proteins were
identified across all three biological replicates in each group
(n=9) with a relatively good reproducibility. Compared with the MTB
samples, 299 proteins were significantly differentially expressed,
including 165 upregulated and 134 downregulated proteins in STB
samples. In addition, the expression levels of 512 proteins in STB
samples were significantly different (284 upregulated and 228
downregulated proteins) from the NC samples. A total of 153
proteins were found to be significantly differentially expressed in
STB samples, of which 82 proteins were upregulated and 71 proteins
were downregulated compared with the MTB and NC samples.
Enrichment analysis and
protein-protein interaction network construction
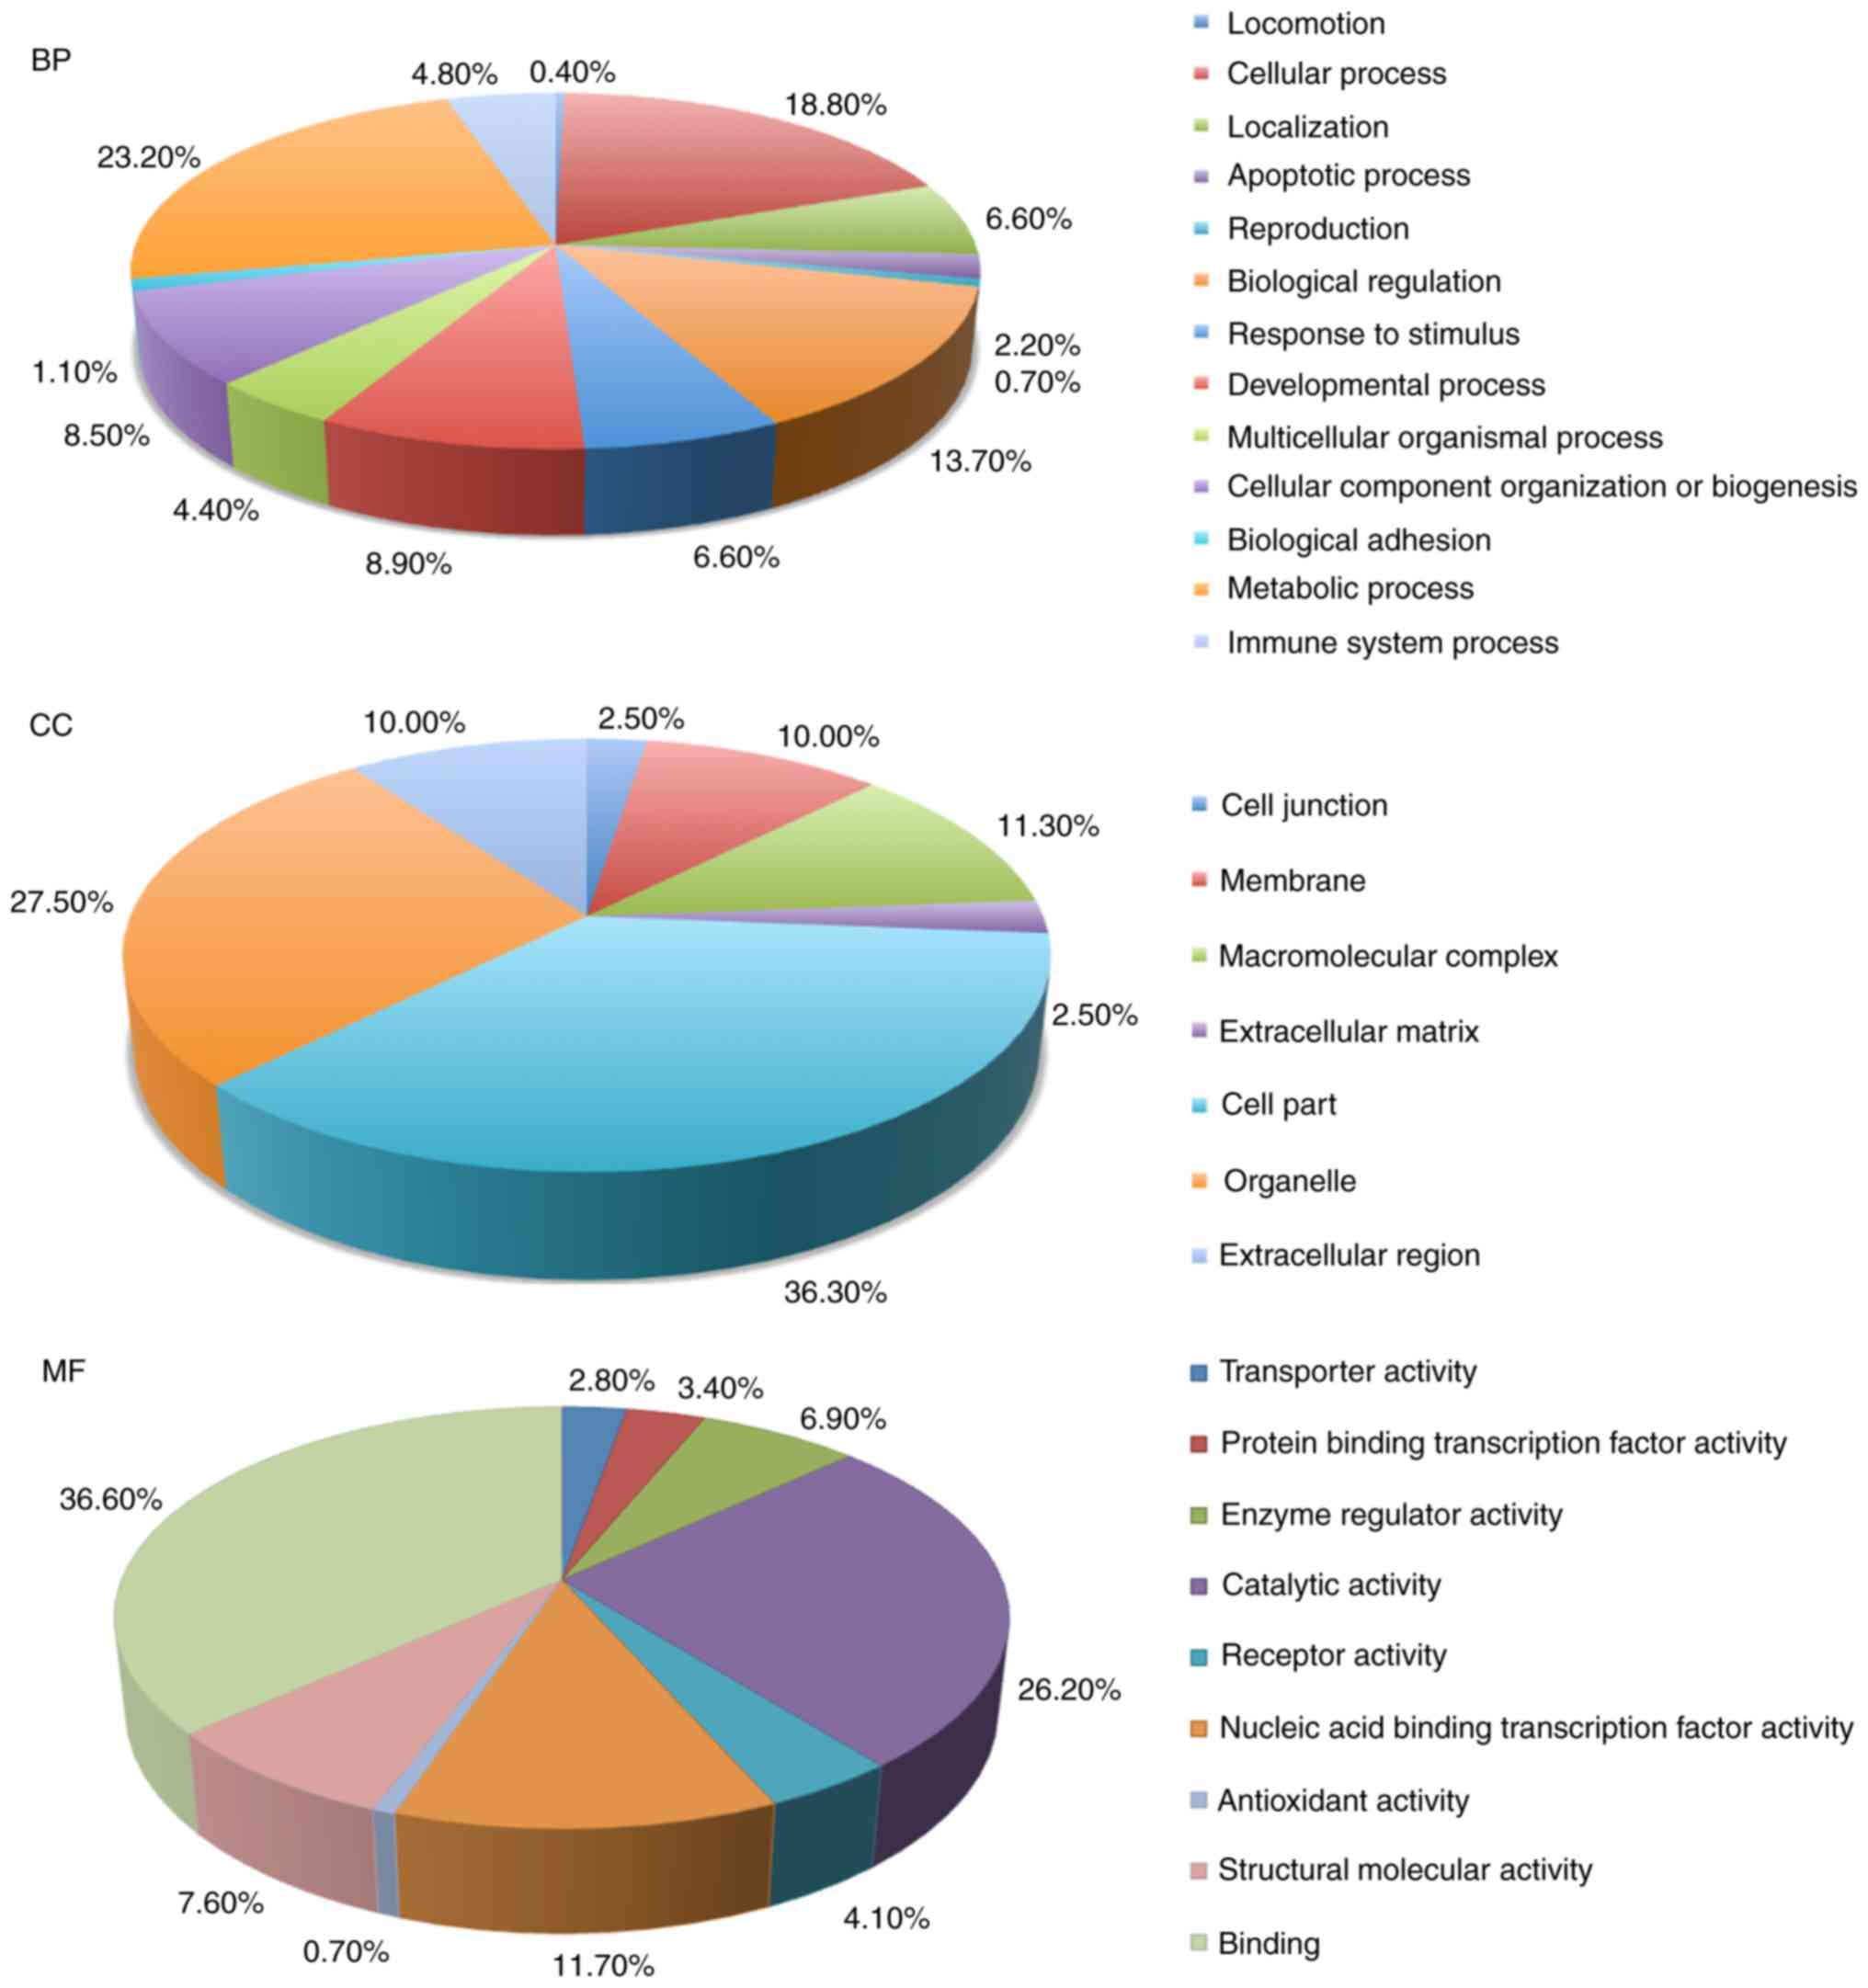
The 153 differentially expressed proteins in STB
samples were used for GO database annotation in terms of BP, CC and
MF (Fig. 1). In BP terms, proteins
were mainly involved in ‘cellular process’, ‘responses to
stimulus’, ‘apoptotic process’ and ‘immune system process’. In CC
terms, the majority of the potential biomarkers were associated
with the ‘organelle’, ‘cell junction’, ‘membrane’ and
‘macromolecular complex’. The enrichment analysis in MF terms
revealed that ‘catalytic activity’, ‘binding’ and ‘enzyme
regulatory activity’.
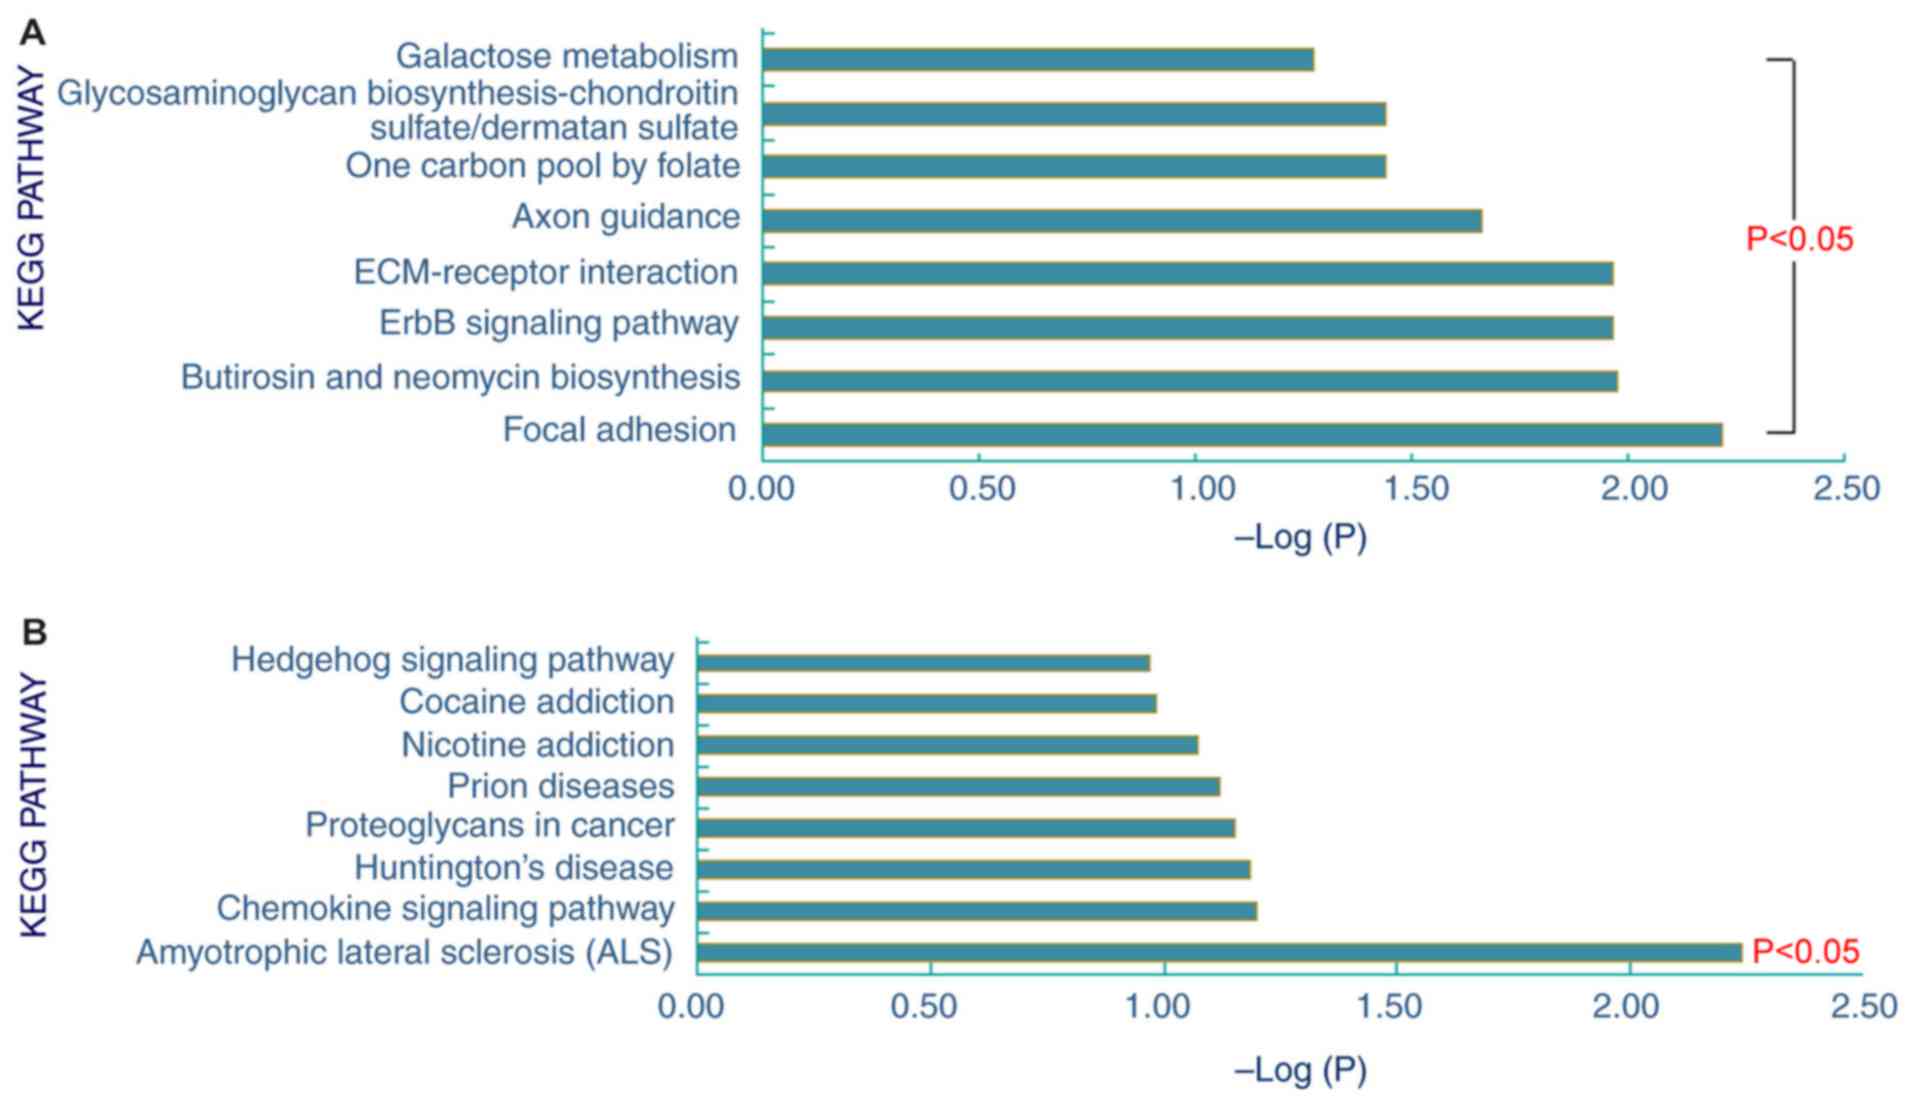
Pathway enrichment analysis of the 153
differentially expressed proteins in the STB samples obtained 8
upregulated and 1 downregulated signaling pathway (Fig. 2). The 8 upregulated signaling
pathways were ‘glycosaminoglycan biosynthesis-chondroitin
sulfate/dermatan sulfate’, ‘galactose metabolism’, ‘one carbon pool
by folate’, ‘axon guidance’, ‘ECM-receptor interaction’, ‘ErbB
signaling pathway’, ‘butirosin and neomycin biosynthesis’ and
‘focal adhesion’. In addition, these proteins were predominantly
involved in the downregulated signaling pathway ‘amyotrophic
lateral sclerosis’.
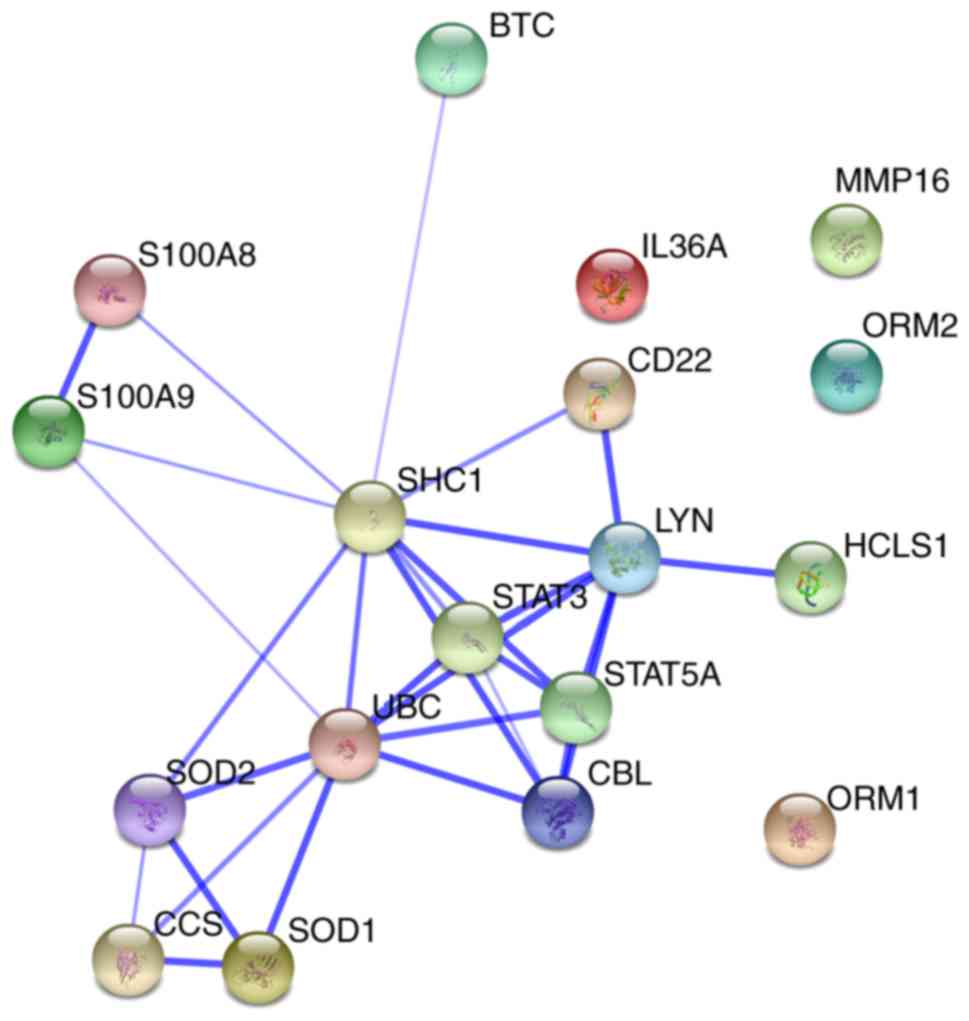
Furthermore, a network was constructed from selected
protein-protein interactions (Fig.
3). This protein-protein interaction network consisted of 18
proteins, including ORM1, ORM2, S100A9, matrix metallopeptidase 16,
copper chaperone for superoxide dismutase, peroxiredoxin (PRDX)1,
glutathione peroxidase (GPX)2, SOD1, SOD2, PRDX2, ubiquitin C,
catalase, GPX1, IL-36α, S100A8 and TIMP metallopeptidase inhibitor
2.
Confirmation of differential levels of
candidate protein expression by western blot
The expression levels of eight differentially
expressed proteins (ORM1, SOD1, IL-36α, ORM2, S100A9, BTC, LYN and
collagen III) with the highest values of |log2FC| were detected by
western blot analysis. Six proteins among these eight
differentially expressed proteins were demonstrated to be
differentially expressed. In the plasma samples of the STB group,
ORM1, IL-36α, ORM2, S100A9 and collagen III were upregulated, and
SOD1 was downregulated, compared with the MTB and NC groups
(Fig. 4A). This trend matched with
what had been previously observed in the label-free quantitative
proteomics analysis. Densitometry demonstrated that the protein
expression levels of each protein were significantly different
between the STB and NC groups (Fig.
4B; P<0.05) The plasma expression levels of ORM1, ORM2,
IL-36α, and collagen III were significantly higher in the STB group
compared with those in the MTB and NC groups (Fig. 4B).
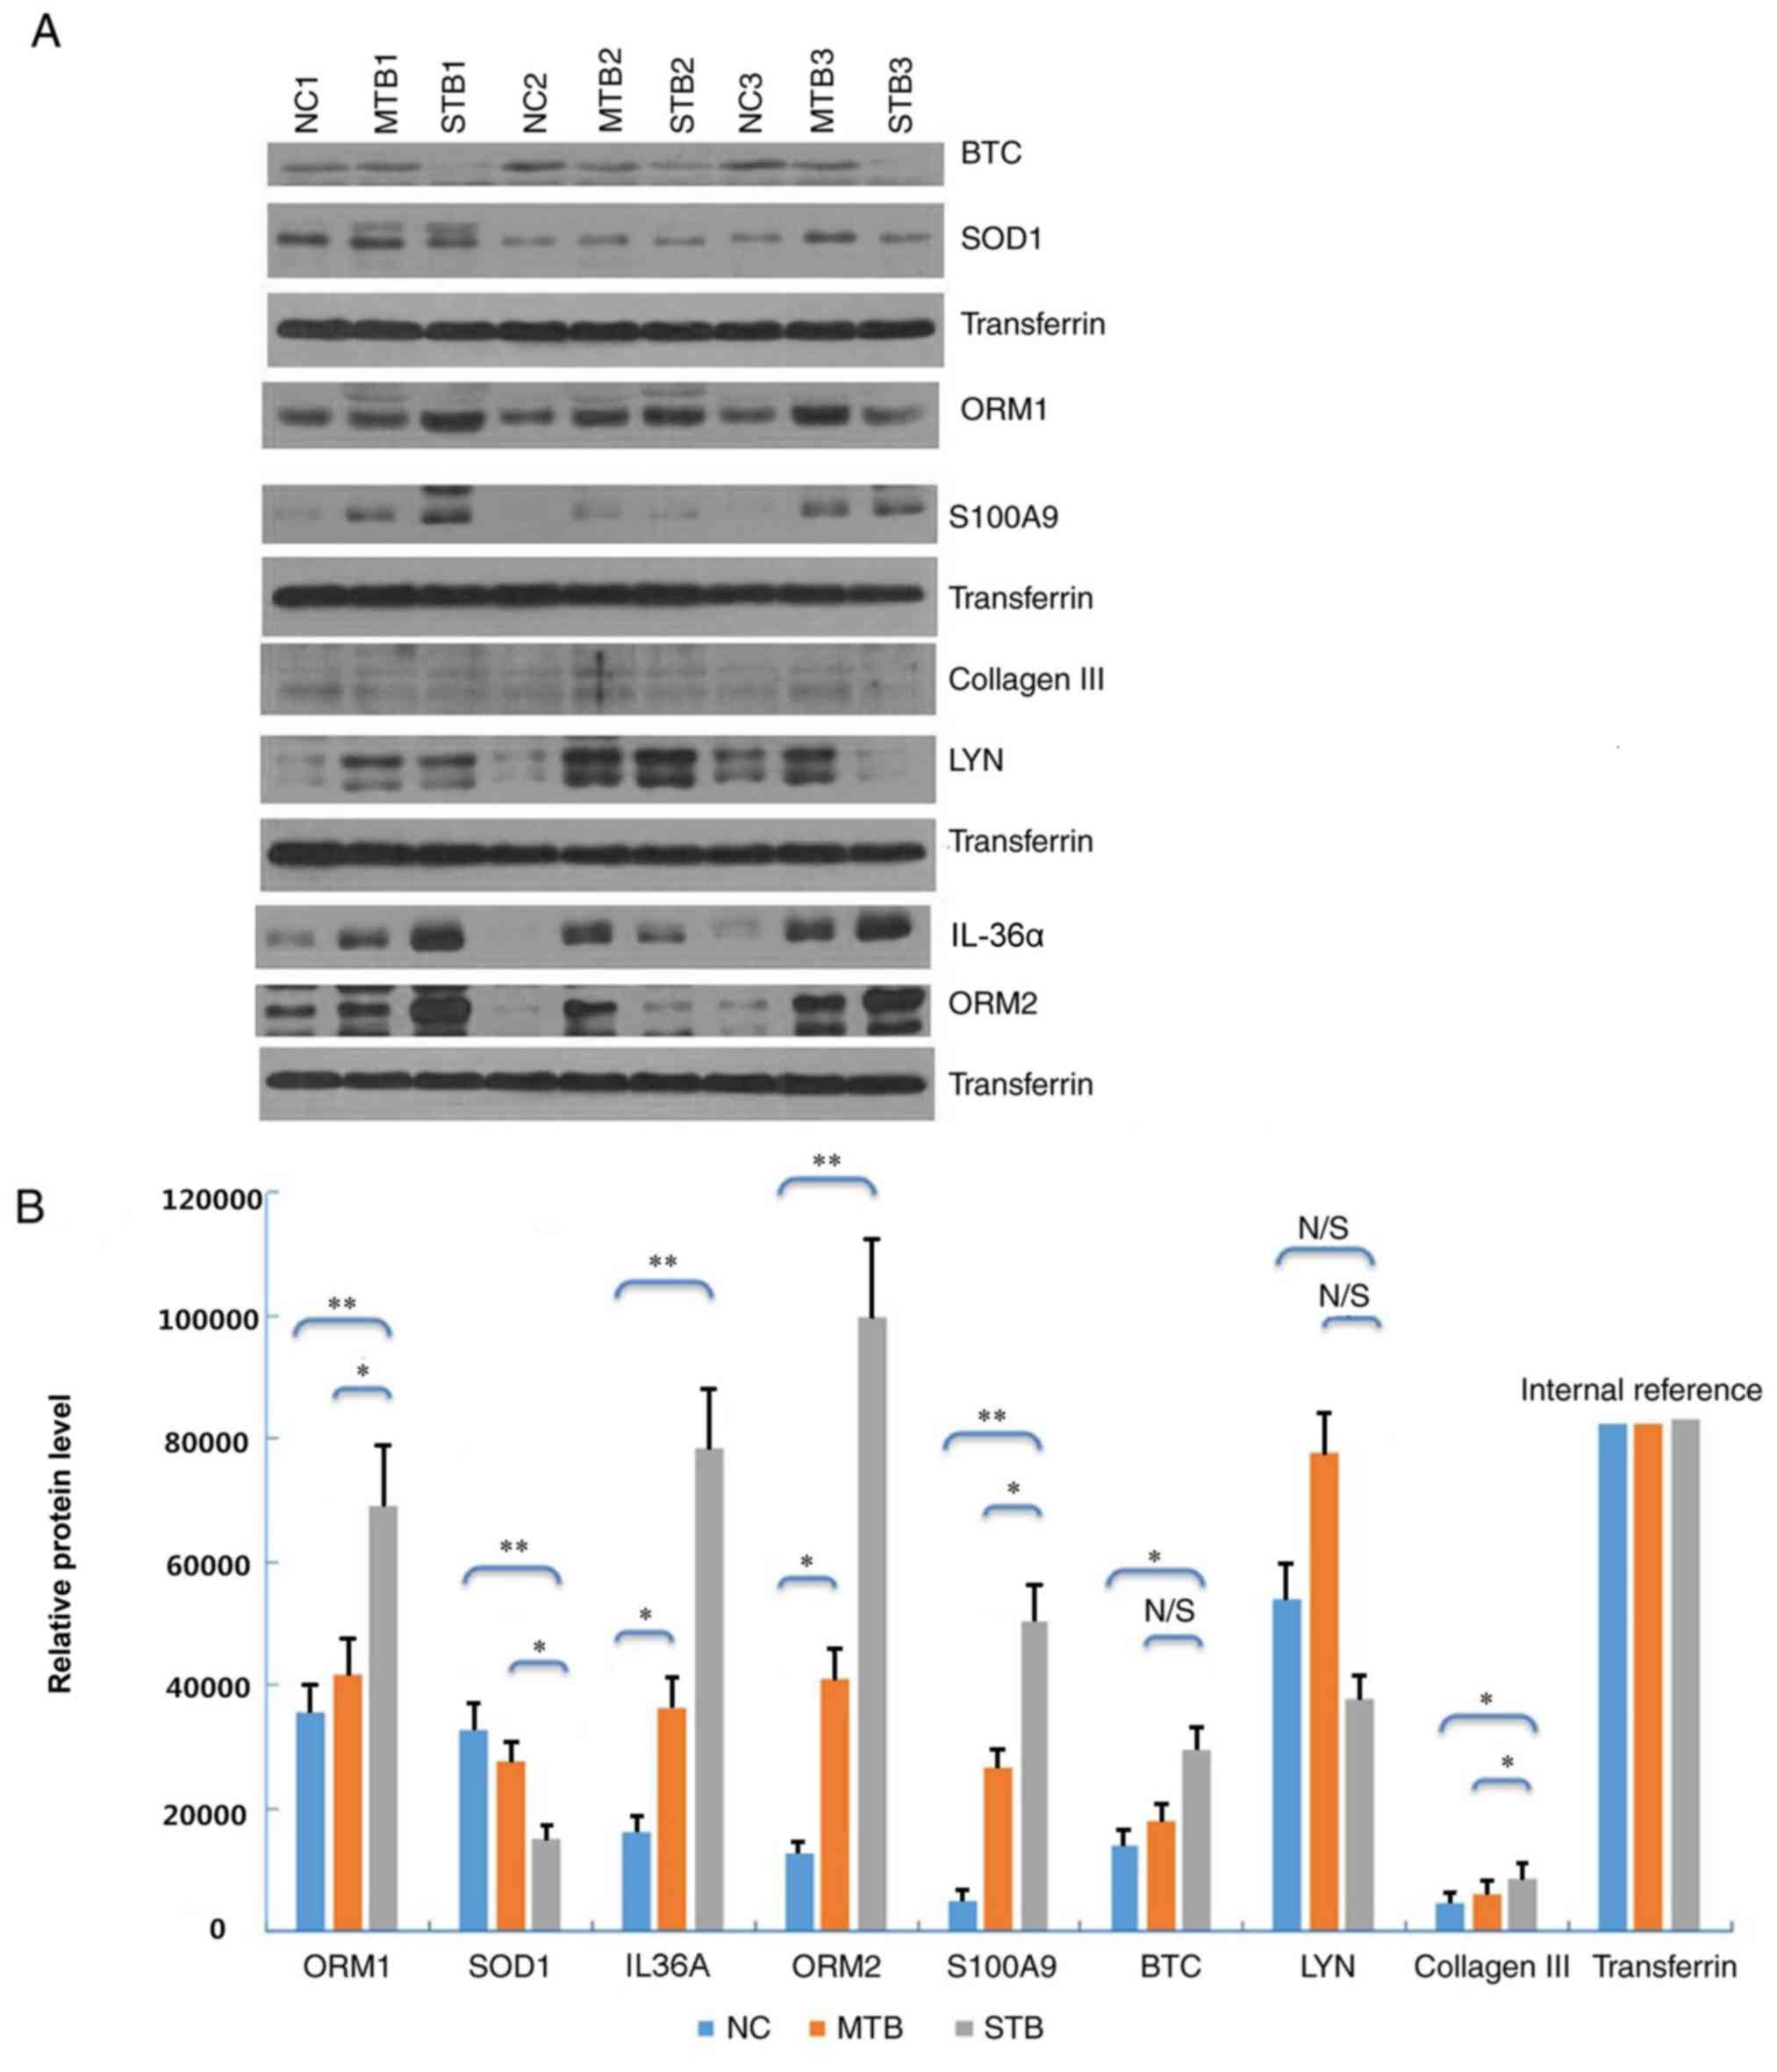 | Figure 4.Western blot analysis of eight
selected proteins in plasma samples of the STB, MTB and NC groups.
(A) Protein expression was determined by western blot analysis. (B)
Densitometric analysis of the eight plasma proteins in the STB
group compared with the MTB and NC groups. *P<0.05 and
**P<0.01. N/S, not significant; STB, severe pulmonary
tuberculosis; MTB, mild pulmonary tuberculosis; NC, healthy control
samples; BTC, betacellulin; SOD, superoxide dismutase; ORM,
α-1-acid glycoprotein; LYN, LYN proto-oncogene, Src family tyrosine
kinase; IL-36α, interleukin-36α. |
Expression levels of IL-36α, ORM2,
S100A9 and SOD1 by ELISA
The plasma expression of four candidate proteins
including ORM2, S100A9, IL-36α and SOD1 were measured by ELISA
(Fig. 5). IL-36α and collagen III
were not detected due to lack of commercially-available ELISA kits
and relatively lower values of |log2FC|. The expression levels of
ORM2, S100A9, IL-36α and SOD1 in the STB group were significantly
differently compared with the other two groups (P<0.05; Table II). The expression trend of these
proteins was consistent with the results obtained from proteomics
analysis.
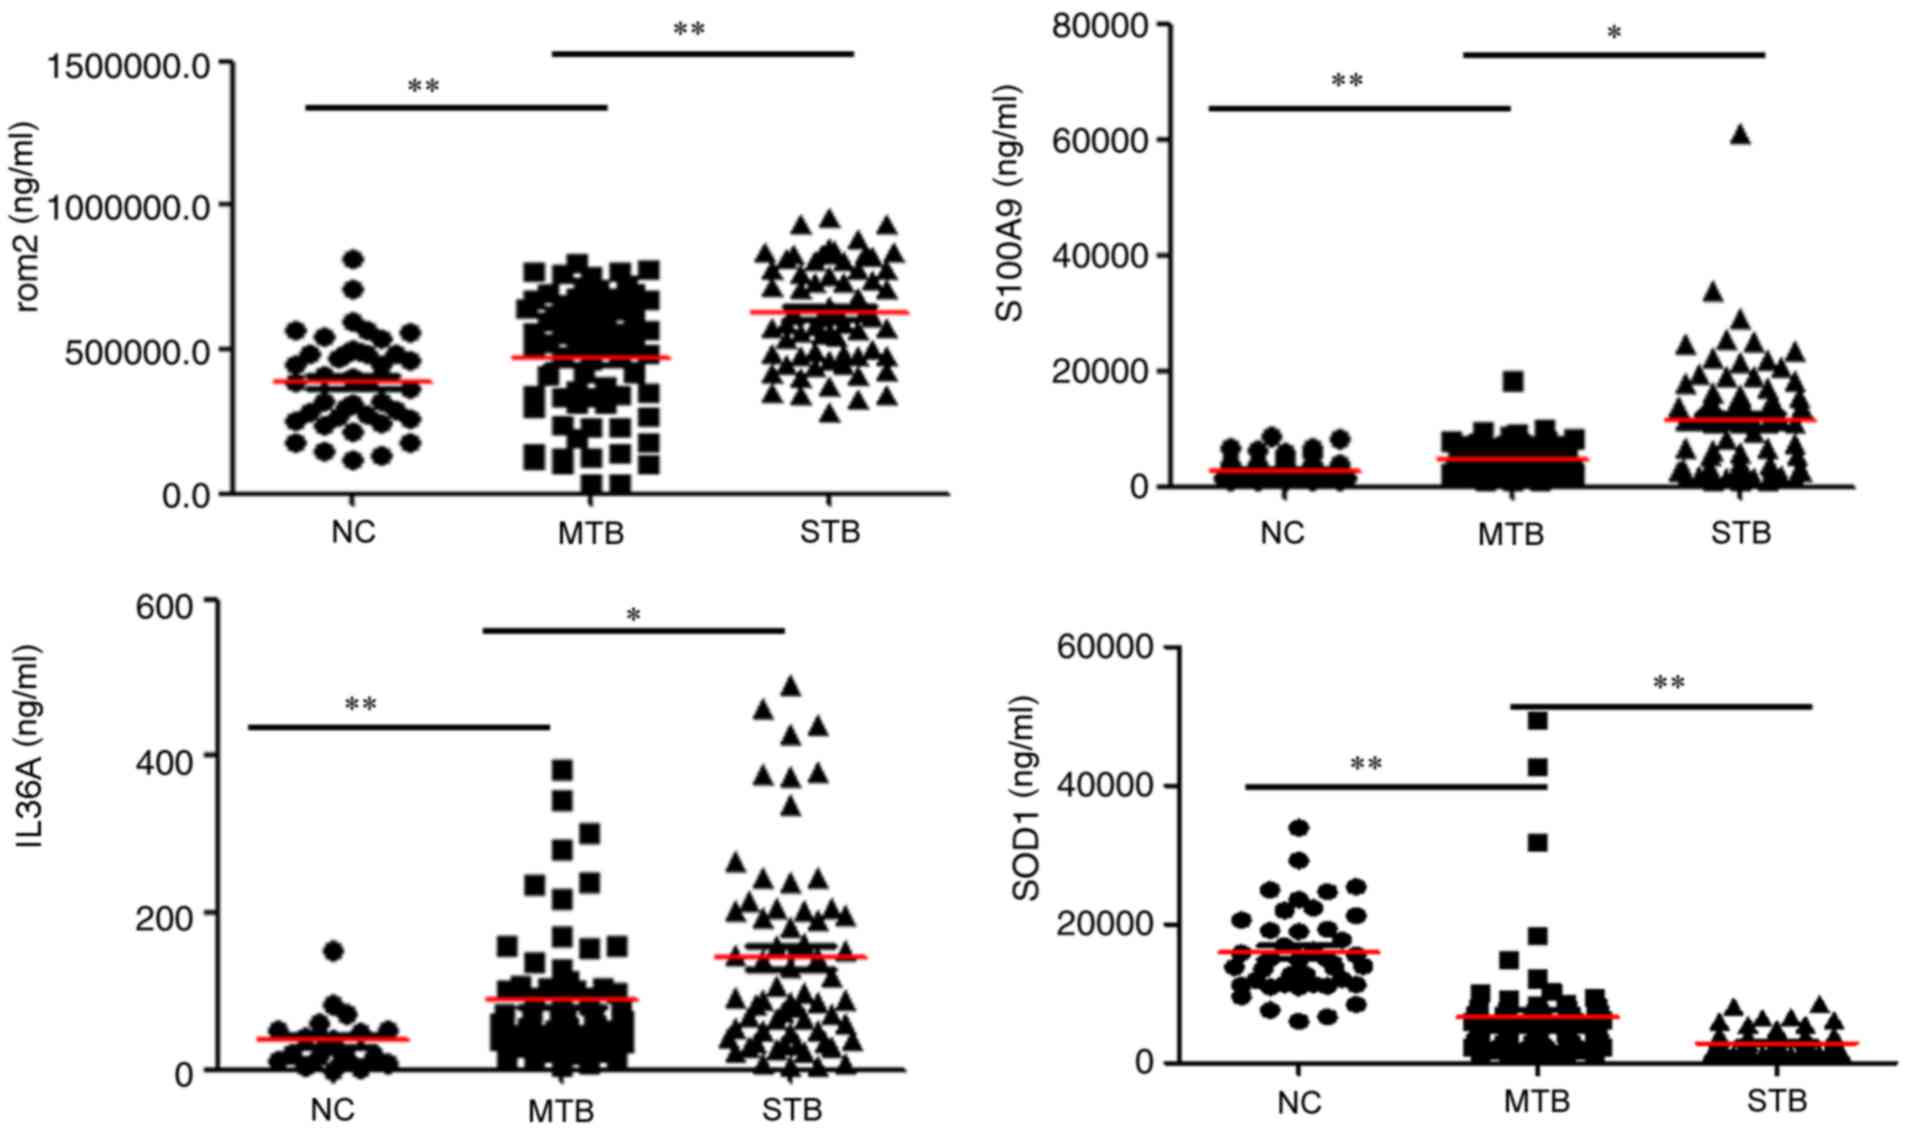 | Figure 5.Validation of ORM2, S100A9, IL-36α and
SOD1 expression in plasma. Levels of these candidate biomarkers
were measured by enzyme-linked immunosorbent assay in the NC
(n=41), MTB (n=71), STB (n=72) groups. n, number of subjects.
Median values are depicted by the red horizontal lines. *P<0.05
and **P<0.01. ORM2, α-1-acid glycoprotein 2; S100A9, S100
calcium binding protein A9; IL-36α, interleukin-36α; SOD,
superoxide dismutase; STB, severe pulmonary tuberculosis; MTB, mild
pulmonary tuberculosis; NC, healthy control samples. |
| Table II.The median, upper and lower quartiles
of plasma concentrations of ORM2, S100A9, IL-36α and SOD1in the
STB, MTB and NC groups. |
Table II.
The median, upper and lower quartiles
of plasma concentrations of ORM2, S100A9, IL-36α and SOD1in the
STB, MTB and NC groups.
| Characteristic | STB | MTB | NC | P-value (STB vs.
MTB) | P-value (STB vs.
NC) |
|---|
| ORM2 (mg/ml) | 614.49 | 514.57 | 386.75 | <0.001 | <0.001 |
| Lower
quartile (mg/ml) | 481.23 | 335.96 | 268.39 |
|
|
| Upper
quartile (mg/ml) | 805.93 | 639.64 | 488.43 |
|
|
| S100A9 (mg/ml) | 14.90 | 5.07 | 2.55 | 0.03 | 0.001 |
| Lower
quartile (mg/ml) | 11.37 | 2.70 | 1.69 |
|
|
| Upper
quartile (mg/ml) | 19.34 | 6.95 | 3.25 |
|
|
| IL-36α (ng/ml) | 92.15 | 59.55 | 21.90 | 0.02 | <0.001 |
| Lower
quartile (mg/ml) | 48.42 | 40.63 | 11.54 |
|
|
| Upper
quartile (mg/ml) | 203.25 | 105.38 | 51.03 |
|
|
| SOD1 (mg/ml) | 771.70 | 985.75 | 1,021.03 | <0.001 | <0.001 |
| Lower
quartile (mg/ml) | 648.26 | 652.7 | 638.53 |
|
|
| Upper
quartile (mg/ml) | 913.40 | 1,257.81 | 1,290.86 |
|
|
Diagnostic value of IL-36α, ORM2,
S100A9 and SOD1
The sensitivity, specificity and accuracy of ORM2
(79.3%, 48.0% and 0.587), S100A9 (86.2%, 90.0% and 0.891), IL-36α
(82.4%, 67.4% and 0.791), and SOD1 (79.3%, 31.9% and 0.525) in
discriminating between STB and MTB were presented in Fig. 6A. Furthermore, the combination of
these four proteins used for discriminating STB from MTB achieved
90.00% sensitivity, 92.16% specificity and 0.965 accuracy.
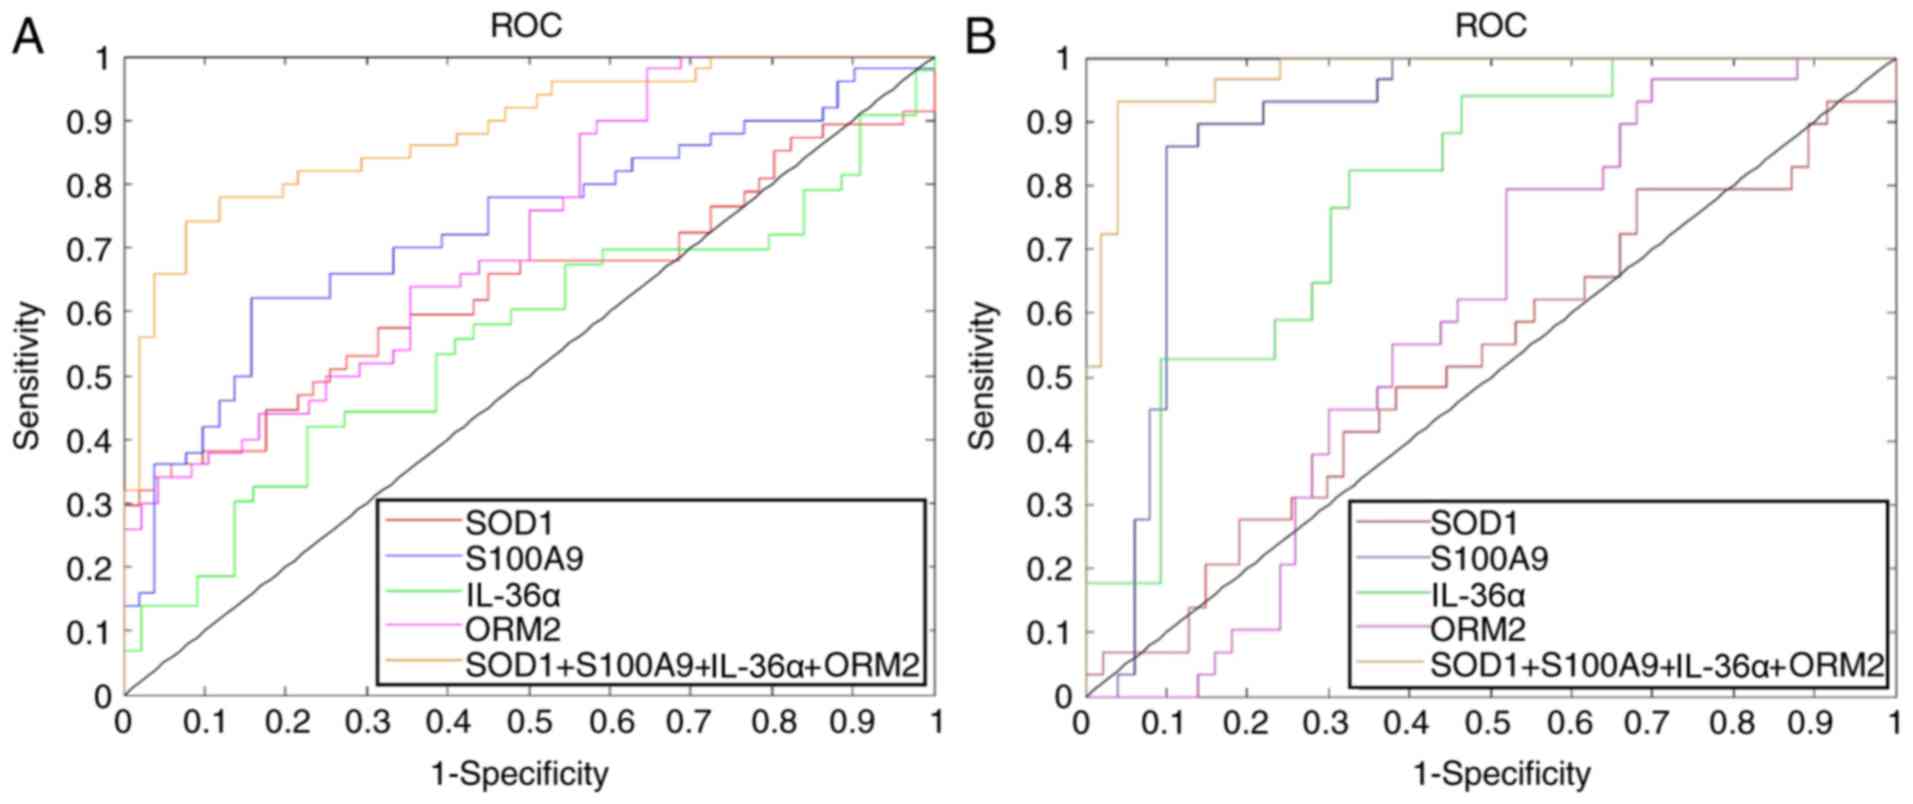 | Figure 6.Efficacy of SOD1, S100A9, IL-36α and
ORM2 in discriminating STB from MTB and the NC group. ROC curves of
SOD1, S100A9, IL-36α and ORM2 in discriminating (A) STB from MTB,
and (B) STB from the NC group. S100A9, S100 calcium binding protein
A9; IL-36α, interleukin-36α; SOD, superoxide dismutase; ORM2,
α-1-acid glycoprotein; STB, severe pulmonary tuberculosis; MTB,
mild pulmonary tuberculosis; NC, healthy control samples; ROC,
receiver operating characteristic. |
For discriminating between STB and NC, the
sensitivity, specificity, and accuracy of ORM2 was 98.0%, 35.4% and
0.720; S100A9, 62.0%, 84.3% and 0.729; IL-36α, 51.9%, 77.3% and
0.555; and SOD1 36.2%, 94.1% and 0.635, respectively (Fig. 6B). In addition, the combination of
these four proteins for STB discrimination from NC achieved a
sensitivity of 89.66%, specificity of 98.9% and accuracy of
0.981.
Discussion
Proteomics is a high throughput analytic method and
proteins identified by mass spectrometry may be useful in the
diagnosis and clinical staging of disease. For example, Zhang et
al (13) identified potential
protein biomarkers for different stages of chronic obstructive
pulmonary disease using proteomic technology. Drug resistance,
lesion location, complications and patient management may aggravate
TB (14), although the specific
mechanisms involved in TB progression are complicated and remain
unclear. In the present study, the proteomic spectra of plasma
samples from patients with STB, MTB and the NC group were analyzed
using a LC-MS/MS-based label-free quantitative method. The disease
severity of this study was defined by lung CT and blood oxygen
results. Based on the LC-MS/MS data, 1,011 proteins were identified
in these three groups from all three biological replicates per
group. Furthermore, 153 significantly differentially expressed
proteins in STB group were identified, compared with the MTB and NC
groups. The GO annotations indicated that progression of TB may be
associated with ‘responses to stimuli’, ‘apoptotic process’,
‘immune system process’ and ‘select metabolic process’.
The identified differentially expressed proteins
were validated by further experimentation. Western blot analysis
and ELISAs further demonstrated that the expression of ORM2,
S100A9, IL-36α and SOD1 in the plasma samples of the STB group were
significantly different from the other two groups. These four
proteins have previously been reported to be involved in several
pathophysiological processes of pulmonary TB. ORM2 is a precursor
of α-2-acid glycoprotein is a major acute-phase protein with an
important role in cell inflammation, cell-mediated immunity
suppression, as well as enhancing the growth of bacilli and
promoting disease progression (15). The synthesis of ORM2 is increased
during various acute-phase responses and is mainly produced by
alveolar macrophages and type II pneumocytes in the early stage of
pulmonary tuberculosis, and by foamy macrophages located in
tuberculous areas at the advanced stage (16). In the present study, expression
levels of ORM2 significantly increased in patients with STB,
compared with cases of MTB or the NC group. Therefore, it was
hypothesized that ORM2 may be a potential protein biomarker for TB
progression. IL-36α is a member of the interleukin-1 cytokine
family, that is upregulated in inflammatory disease states
(17). Intratracheal instillation
of IL-36α enhances IL-36α receptor mRNA expression in the lungs of
C57BL/6 and IL-1αβ (−/-) mice (18). The present study demonstrated that
IL-36α expression was markedly increased in patients with STB,
compared with patients with MTB and the NC group. The expression of
these proteins at high levels in the plasma of individuals with STB
indicated that the inflammatory response may serve an important
role in STB-induced injury. However, the precise effect of these
proteins on the development of TB requires further exploration.
S100A9 is a major calcium-binding protein in
neutrophils and monocytes that is also recognized as a
damage-associated molecular-pattern molecule. Gopal et al
(19) reported that S100A9
expression is upregulated in patients with TB, and may have a major
pathological role in TB by mediating neutrophil accumulation and
inflammation. Greater areas of lung tissue infected with
mycobacterium tuberculosis, inflammation and severe hypoxia
increase S100A9 expression, leading to aggravation of lung injury
inflammation (20). In the present
study, hypoxic conditions were more severe in STB group compared
with the MTB and NC groups, and S100A9 expression was revealed to
be upregulated in the STB group compared with the MTB and NC
groups. This suggests that there may be an association between
hypoxemia and S100A9 expression.
SOD1 is the predominant SOD isoform in the majority
of cells and tissues, accounting for 70–80% of total cellular SOD
activity (21). SOD1 inhibits
inflammation by preventing oxidative fragmentation of hyaluronan
and catalyzing the dismutation of the superoxide anion to oxygen
and hydrogen peroxide. TB is associated with oxidative stress and
the induction of host antioxidants to counteract this response.
Golubović et al (22)
reported that serum SOD expression was significantly lower in
patients with TB compared with healthy individuals, and imbalance
in this coordinated system lead to increased oxidative stress. In
addition, it has been indicated that the concentration of SOD
decreases in patients with pulmonary failure (23). Furthermore, SOD proteins
considerably reduced the production of NO and oxygen radicals and
ameliorated impairment in cell immunological function during early
infection (24). The present study
demonstrated that SOD1 levels were significantly lower in patients
with STB, compared with the MTB and NC groups. Therefore, SOD1 may
be a protective factor against pulmonary TB. This protein may serve
a key role in maintaining the balance between oxidation and
antioxidation, thereby inhibiting the inflammatory damage process
(25). The current study also
demonstrated that a combination of ORM2, S100A9, IL-36α and SOD1
distinguished between patients with STB and MTB (sensitivity,
90.00%; specificity, 92.16%), as well as between patients with STB
and the NC group (sensitivity, 89.66%; specificity, 98.9%). These
results revealed that these four differentially expressed proteins
may be useful in discriminating between the different severities of
TB.
In conclusion, 1,011 proteins were identified in
STB, MTB and NC groups based on LC-MS/MS-based label-free
quantitative analysis. A total of 153 differentially expressed
proteins were identified in the plasma samples obtained from
patients with STB. Proteins including ORM2, S100A9, IL-36α and SOD1
were determined to be associated with the development of TB, and
may be useful as biomarkers to ascertain pulmonary TB clinical
severity. Therefore, differential protein expression during disease
progression may improve the understanding of STB pathogenesis. The
present study provided meaningful data and novel ideas to determine
the severity of TB.
Acknowledgements
Not applicable.
Funding
This work was supported by grants from the Beijing
Natural Science Foundation (grant no. 7164245), the Beijing Nova
Program (grant no. Z161100004916080), the National Science and
Technology Major Project of China (grant no. 2015ZX10004801-003),
the Collaborative Innovation Center of Infectious Diseases (grant
no. PXM2016_014226_000052), the ‘Beijing Municipal Administration
of Hospitals’ Youth Program (grant no. QML20151501) and Tongzhou
District Science and Technology Committee (grant no.
KJ2017CX076).
Availability of data and materials
The datasets used and analyzed during the current
study are available from the corresponding author on reasonable
request.
Authors' contributions
QiuL, ZZ and QiL conceived and designed the study.
QiuL, LP, FH and BL performed western blotting analyses. HJ, AX and
QiL collected samples, and performed data analysis and
interpretation. All authors wrote and approved the final version of
the manuscript to be published.
Ethics approval and consent to
participate
The study was conducted according to the principles
of the Declaration of Helsinki and was approved by the Ethical
Committee of the Beijing Chest Hospital affiliated to Capital
Medical University (Beijing, China). All participants provided
written informed consent.
Consent for publication
Not applicable.
Competing interests
The authors declare that they have no competing
interests.
References
|
1
|
Global tuberculosis report 2016. World
Health Organization; Geneva: pp. 1–201. 2016
|
|
2
|
Waitt CJ and Squire SB: A systematic
review of risk factors for death in adults during and after
tuberculosis treatment. Int J Tuberc Lung Dis. 15:871–885. 2011.
View Article : Google Scholar : PubMed/NCBI
|
|
3
|
Barry CE III, Boshoff HI, Dartois V, Dick
T, Ehrt S, Flynn J, Schnappinger D, Wilkinson RJ and Young D: The
spectrum of latent tuberculosis: Rethinking the biology and
intervention strategies. Nat Rev Microbiol. 7:845–855. 2009.
View Article : Google Scholar : PubMed/NCBI
|
|
4
|
van Altena R, Duggirala S, Gröschel MI and
van der Werf TS: Immunology in tuberculosis: Challenges in
monitoring of disease activity and identifying correlates of
protection. Curr Pharm Des. 17:2853–2862. 2011. View Article : Google Scholar : PubMed/NCBI
|
|
5
|
Zhang X, Liu F, Li Q, Jia H, Pan L, Xing
A, Xu S and Zhang Z: A proteomics approach to the identification of
plasma biomarkers for latent tuberculosis infection. Diagn
Microbiol Infect Dis. 79:432–437. 2014. View Article : Google Scholar : PubMed/NCBI
|
|
6
|
Serada S and Naka T: Screening for novel
serum biomarker for monitoring disease activity in rheumatoid
arthritis using iTRAQ technology-based quantitative proteomic
approach. Methods Mol Biol. 1142:99–110. 2014. View Article : Google Scholar : PubMed/NCBI
|
|
7
|
Li C, He X, Li H, Zhou Y, Zang N, Hu S,
Zheng Y and He M: Discovery and verification of serum differential
expression proteins for pulmonary tuberculosis. Tuberculosis
(Edinb). 95:547–554. 2015. View Article : Google Scholar : PubMed/NCBI
|
|
8
|
World Health Organization, . International
Union Against Tuberculosis and Lung Disease; Royal Netherlands
Tuberculosis Association: Revised international definitions in
tuberculosis control. Int J Tuberc Lung Dis. 5:213–215.
2001.PubMed/NCBI
|
|
9
|
Lichtenstein DA and Mezière GA: Relevance
of lung ultrasound in the diagnosis of acute respiratory failure:
The BLUE protocol. Chest. 134:117–125. 2008. View Article : Google Scholar : PubMed/NCBI
|
|
10
|
Mi H, Huang X, Muruganujan A, Tang H,
Mills C, Kang D and Thomas PD: PANTHER version 11: Expanded
annotation data from Gene Ontology and Reactome pathways, and data
analysis tool enhancements. Nucleic Acids Res. 45(D1): D183–D189.
2017. View Article : Google Scholar : PubMed/NCBI
|
|
11
|
da Huang W, Sherman BT and Lempicki RA:
Systematic and integrative analysis of large gene lists using DAVID
bioinformatics resources. Nature Protoc. 4:44–57. 2009. View Article : Google Scholar
|
|
12
|
Satoh K, Maniwa T, Oda T and Matsumoto K:
Proteomic profiling for the identification of serum diagnostic
biomarkers for abdominal and thoracic aortic aneurysms. Proteome
Sci. 11:272013. View Article : Google Scholar : PubMed/NCBI
|
|
13
|
Zhang X, Zhang J, Li Q, Wu X, Wang T and
Wang Y: SELDI-TOF-MS in chronic obstructive pulmonary disease. Chin
Sci Bull. 58:pp634–640. 2013. View Article : Google Scholar
|
|
14
|
Hongmei Chen, Xiaoguang WU and Liping MA:
The clinical analysis of the hospitalized elderly patients died
from tuberculosis. Chin J Antituberculosis. 36:55–58. 2014.(In
Chinese).
|
|
15
|
Fournier T, Medjoubi-N N and Porquet D:
Alpha-1-acid glycoprotein. Biochim Biophys Acta. 1482:157–171.
2000. View Article : Google Scholar : PubMed/NCBI
|
|
16
|
Cordero Martìnez E, Gonzàlez MM, Aguilar
LD, Orozco EH and Pando Hernàndez R: Alpha-1-acid glycoprotein, its
local production and immunopathological participation in
experimental pulmonary tuberculosis. Tuberculosis (Edinb).
88:203–211. 2008. View Article : Google Scholar : PubMed/NCBI
|
|
17
|
Ichii O, Kimura J, Okamura T, Horino T,
Nakamura T, Sasaki H, Elewa YHA and Kon Y: IL-36α regulates
tubulointerstitial inflammation in the mouse kidney. Front Immunol.
8:13462017. View Article : Google Scholar : PubMed/NCBI
|
|
18
|
Ramadas RA, Ewart SL, Iwakura Y, Medoff BD
and LeVine AM: IL-36α exerts pro-inflammatory effects in the lungs
of mice. PLoS One. 7:e457842012. View Article : Google Scholar : PubMed/NCBI
|
|
19
|
Gopal R, Monin L, Torres D, Slight S,
Mehra S, McKenna KC, Junecko Fallert BA, Reinhart TA, Kolls J,
Báez-Saldaña R, et al: S100A8/A9 proteins mediate neutrophilic
inflammation and lung pathology during tuberculosis. Am J Respir
Crit Care Med. 188:1137–1146. 2013. View Article : Google Scholar : PubMed/NCBI
|
|
20
|
Kuipers MT, Vogl T, Aslami H, Jongsma G,
van den Berg E, Vlaar AP, Roelofs JJ, Juffermans NP, Schultz MJ,
van der Poll T, et al: High levels of S100A8/A9 proteins aggravate
ventilator-induced lung injury via TLR4 signaling. PLoS One.
8:e686942013. View Article : Google Scholar : PubMed/NCBI
|
|
21
|
Strålin P, Karlsson K, Johansson BO and
Marklund SL: The interstitium of the human arterial wall contains
very large amounts of extracellular superoxide dismutase.
Arterioscler Thromb Vasc Biol. 15:2032–2036. 1995. View Article : Google Scholar : PubMed/NCBI
|
|
22
|
Golubović S, Stanković I, Ristić L, Cosić
V, Dordević I and Radović M: Antioxidant enzymes and lipid
peroxidation products in patients with pulmonary tuberculosis. Med
Pregl. 63:450–453. 2010.(In Serbian). View Article : Google Scholar : PubMed/NCBI
|
|
23
|
Bouhafs RK and Jarstrand C:
Phagocyte-induced lipid peroxidation of lung surfactant. Pediatr
Pulmonol. 27:322–327. 1999. View Article : Google Scholar : PubMed/NCBI
|
|
24
|
Liao D, Fan Q and Bao L: The role of
superoxide dismutase in the survival of Mycobacterium tuberculosis
in macrophages. Jpn J Infect Dis. 66:480–488. 2013. View Article : Google Scholar : PubMed/NCBI
|
|
25
|
Gao F, Koenitzer JR, Tobolewski JM, Jiang
D, Liang J, Noble PW and Oury TD: Extracellular superoxide
dismutase inhibits inflammation by preventing oxidative
fragmentation of hyaluronan. J Biol Chem. 283:6058–6066. 2008.
View Article : Google Scholar : PubMed/NCBI
|