Introduction
Diabetes mellitus is defined as hyperglycemia
resulting from impaired insulin secretion and peripheral insulin
resistance (1). Numerous types of
diabetes mellitus exist, including type 1 diabetes (T1D), type 2
diabetes (T2D) and gestational diabetes mellitus (1). T1D is an organ-specific disease that
is characterized by the autoimmune destruction of pancreatic β
cells leading to insulin deficiency (2). In addition, islet infiltration by
macrophages, lymphocytes, dendritic cells and natural killer (NK)
cells is commonly observed in T1D, as is the overexpression of a
number of immune system genes (3,4).
T1D primarily affects children and young adults, and
symptoms are typically more severe in children compared with
adults. It has been reported that T1D accounts for 80–90% of
diabetes in children and adolescents (5,6). The
onset of T1D is frequently sudden in children and adolescents, and
a number of symptoms are exhibited, including enuresis, polyuria,
polydipsia, polyphagia, extreme tiredness, blurred vision, sudden
weight loss, lack of energy, slow-healing wounds and recurrent
infections (7), with severe
dehydration and diabetic ketoacidosis. Patients with T1D are
additionally at a higher risk of developing other autoimmune
disorders, including vitiligo, Addison's disease, Graves' disease,
celiac sprue, Hashimoto's thyroiditis, myasthenia gravis,
autoimmune hepatitis and pernicious anemia (8). Furthermore, patients with T1D require
long-term insulin treatment and have an increased risk of stroke,
blindness, kidney failure and heart disease, all of which
contribute to early patient mortality.
In order to reduce patient mortality, it is
important to identify potential pathological genes that serve a
role in the pathogenesis of T1D in children. The present study
identified T1D-associated alterations in gene expression by
integrating mRNA expression datasets from children with T1D from
the Gene Expression Omnibus (GEO) database. Differentially
expressed genes (DEGs) in children with T1D were identified.
Functional analysis was performed and a protein-protein interaction
(PPI) network was constructed, followed by the transcription factor
(TF)-target network construction. The expression of selected DEGs
was further assessed using reverse transcription-quantitative
polymerase chain reaction (RT-qPCR) analysis. Electronic validation
and diagnostic value analysis of the identified DEGs [cytokine
inducible SH2 containing protein (CISH), SR-related CTD associated
factor 11 (SCAF11), estrogen receptor 1 (ESR1), Rho GTPase
activating protein 25 (ARHGAP25), major histocompatibility complex,
class II, DR β4 (HLA-DRB4) and interleukin 23 subunit α (IL23A)]
was performed in the GEO dataset. The results of the present study
may improve diagnostic and treatment methods for children with
T1D.
Materials and methods
Datasets
In the present study, datasets from the GEO database
(http://www.ncbi.nlm.nih.gov/geo) were
searched using the key words ‘diabetes mellitus, type 1’ [MeSH
Terms] OR ‘type 1 diabetes’ [All Fields] AND ‘Homo sapiens’ [porgn]
AND ‘gse’ [Filter]. The study type may be described as ‘expression
profiling by array’. All selected datasets contained genome-wide
expression data of the case group and/or normal group blood
samples. In blood samples, monocytes were used for RNA sequencing
analysis. A total of two datasets, GSE9006 and GSE33440, were
included in the final analysis (Table
I).
 | Table I.GEO datasets. |
Table I.
GEO datasets.
| Author, year | GEO accession
no. | Platform | Samples (N:P) | (Refs.) |
|---|
| Kaizer et al,
2007 | GSE9006 | GPL96 [HG-U133A]
Affymetrix Human Genome U133A Array | 24:81 | (62) |
| Irvine et al,
2012 | GSE33440 | GPL6947 Illumina
HumanHT-12 V3.0 expression beadchip | 6:16 | (63) |
Analysis of DEGs
Raw expression data were downloaded and the limma
(3.3.3) (9) and metaMA packages
(3.3.0) (10) were used to
identify the DEGs. The inverse normal method was used to combine
P-values in metaMA. The threshold for DEGs was set at
P<0.05.
Functional annotation analysis of
DEGs
To elucidate the biological function and signaling
pathways of DEGs, GeneCoDis3 (3.3.0) (http://genecodis.cnb.csic.es/analysis) software was
used for Gene Ontology (GO; http://www.geneontology.org/) annotation and Kyoto
Encyclopedia of Genes Genomes (KEGG; http://www.genome.jp/kegg/pathway.html) pathway
enrichment. The thresholds of the GO function and KEGG pathways
were P<0.05.
PPI network construction
Studying the interactions between proteins may aid
elucidation of the underlying molecular mechanisms responsible for
the pathogenesis of T1D in children. In order to gain insights into
the interaction between proteins encoded by DEGs and other
proteins, the predicted interactions between the top 100 proteins
encoded by DEGs (50 upregulated and 50 downregulated) were
retrieved from the BioGRID database (http://thebiogrid.org). The PPI network was
subsequently visualized using Cytoscape Software (3.3.0)
(http://cytoscape.org). Nodes in the PPI network
denote proteins and edges denote interactions.
Analysis of potential TFs that target
DEGs
TFs serve a crucial role in the regulation of gene
expression. The human genome TFs and motifs of genomic binding
sites were downloaded from TRANSFAC (http://genexplain.com/transfac). The 2 kb sequences in
the upstream promoter regions of the DEGs were downloaded from the
University of California, Santa Cruz (Santa Cruz, CA, USA;
http://www.genome.ucsc.edu/cgi-bin/hgTables) to
determine potential TF target sites. Finally, the transcriptional
regulatory network was visualized using Cytoscape software.
RT-qPCR in vitro
A total of five children with T1D and five control
individuals were recruited for the present study. All children were
Han and the sex ratio was 6:4 (male:female). No additional
auto-immune diseases were diagnosed in any subjects. Clinical data
for T1D patients is presented in Table II. Ethical approval was obtained
from the Ethics Committee of Shandong Jining No. 1 People's
Hospital (Jining, China) and informed written consent was obtained
from all subjects.
| Table II.Clinical information on patients with
childhood type 1 diabetes. |
Table II.
Clinical information on patients with
childhood type 1 diabetes.
| A, Patients |
|---|
|
|---|
| Age, years | Sex | BMI | Ethnicity | Diabetes
history | Other chronic
illness history | FBG | 2 h postprandial
glucose | HBA1C | FCP | 2 h postprandial
C-peptide | ICA | IAA | GADA |
|---|
| 6 | Male | 19.1 | Han | Yes | No | 7.2 | 23.1 | 8.8 | 0.24 | 0.21 | Positive | Positive | Positive |
| 9 | Female | 21.9 | Han | Yes | No | 7.6 | 21.9 | 9.7 | 0.34 | 0.36 | Negative | Negative | Negative |
| 10 | Male | 19.8 | Han | Yes | No | 8.1 | 23.9 | 11.2 | 0.26 | 0.25 | Positive | Positive | Positive |
| 7 | Female | 20.3 | Han | No | No | 9.2 | 24.8 | 8.9 | 0.28 | 0.38 | Positive | Positive | Positive |
| 8 | Male | 19.9 | Han | Yes | No | 7.3 | 22 | 11.1 | 0.3 | 0.28 | Positive | Positive | Positive |
|
| B,
Controls |
|
| Age,
years | Sex | BMI |
Ethnicity | Diabetes
history | Other chronic
illness history | FBG | 2 h postprandial
glucose | HBA1C | FCP | 2 h postprandial
C-peptide | ICA | IAA | GADA |
|
| 6 | Male | 16.8 | Han | No | No | N/A | N/A | N/A | N/A | N/A | N/A | N/A | N/A |
| 9 | Female | 17.1 | Han | No | No | N/A | N/A | N/A | N/A | N/A | N/A | N/A | N/A |
| 10 | Male | 16.9 | Han | No | No | N/A | N/A | N/A | N/A | N/A | N/A | N/A | N/A |
| 7 | Female | 17.6 | Han | No | No | N/A | N/A | N/A | N/A | N/A | N/A | N/A | N/A |
| 8 | Male | 18.1 | Han | No | No | N/A | N/A | N/A | N/A | N/A | N/A | N/A | N/A |
Total RNA was extracted from 0.25 ml blood samples
using the RNAliquid Reagent (Tiangen Biotech Co., Ltd., Beijing,
China), according to the manufacturer's protocols. A total of 1 µg
RNA was used with FastQuant Reverse Transcriptase (Tiangen Biotech
Co., Ltd.) to synthesize cDNA for 5 min at 65°C followed by 60 min
at 42°C and 5 min at 72°C. qPCR was performed in an ABI 7300
Real-time PCR system with SYBR® Green PCR Master Mix
(Tiangen Biotech Co., Ltd.). The thermocycling conditions were as
follows: 15 min at 95°C followed by 40 cycles of 10 sec at 95°C, 30
sec at 55°C, 32 sec at 72°C, and 15 sec at 95°C, 60 sec at 60°C, 15
sec extension at 95°C. All reactions were performed in triplicate.
GAPDH was used as the internal reference and relative gene
expression was calculated as a fold-change. The sequences of
reverse and forward primers for all of the genes analyzed were as
follows: HNRNPD (forward: GAGGCGTGGGTTCTGCTTTAT, reverse:
AGATCCCCACTGTTGCTGTTG); PRKAA1 (forward: TTGAAACCTGAAAATGTCCTGCT,
reverse: GGTGAGCCACAACTTGTTCTT); ITGA4 (forward:
AGCCCTAATGGAGAACCTTGT, reverse: CCAGTGGGGAGCTTATTTTCAT); TAP2
(forward: CACCTACACCATGTCTCGAATC, reverse:
AGTTACTCATCAGGGTGGTATCC); GAPDH (forward: GGAGCGAGATCCCTCCAAAAT,
reverse: GGCTGTTGTCATACTTCTCATGG). The experiment was repeated
three times. The relative expression of genes was calculated using
the 2−ΔΔCq method (11). The statistical analyses were
performed using GraphPad Prism 2.0 (GraphPad Software, Inc., La
Jolla, CA, USA).
Electronic validation of DEGs and
receiver operating characteristic (ROC) analysis
In order to determine the expression of DEGs,
including CISH, SCAF11, ESR1, ARHGAP25, HLA-DRB4 and IL23A, the GEO
dataset was subjected to electronic validation. The results are
presented as box plots. The pROC package in R 2.0 (http://web.expasy.org/pROC/) (12) was used for ROC analysis to assess
the diagnostic value of these genes. The area under the curve (AUC)
was calculated and the ROC curve was constructed.
Results
DEG analysis
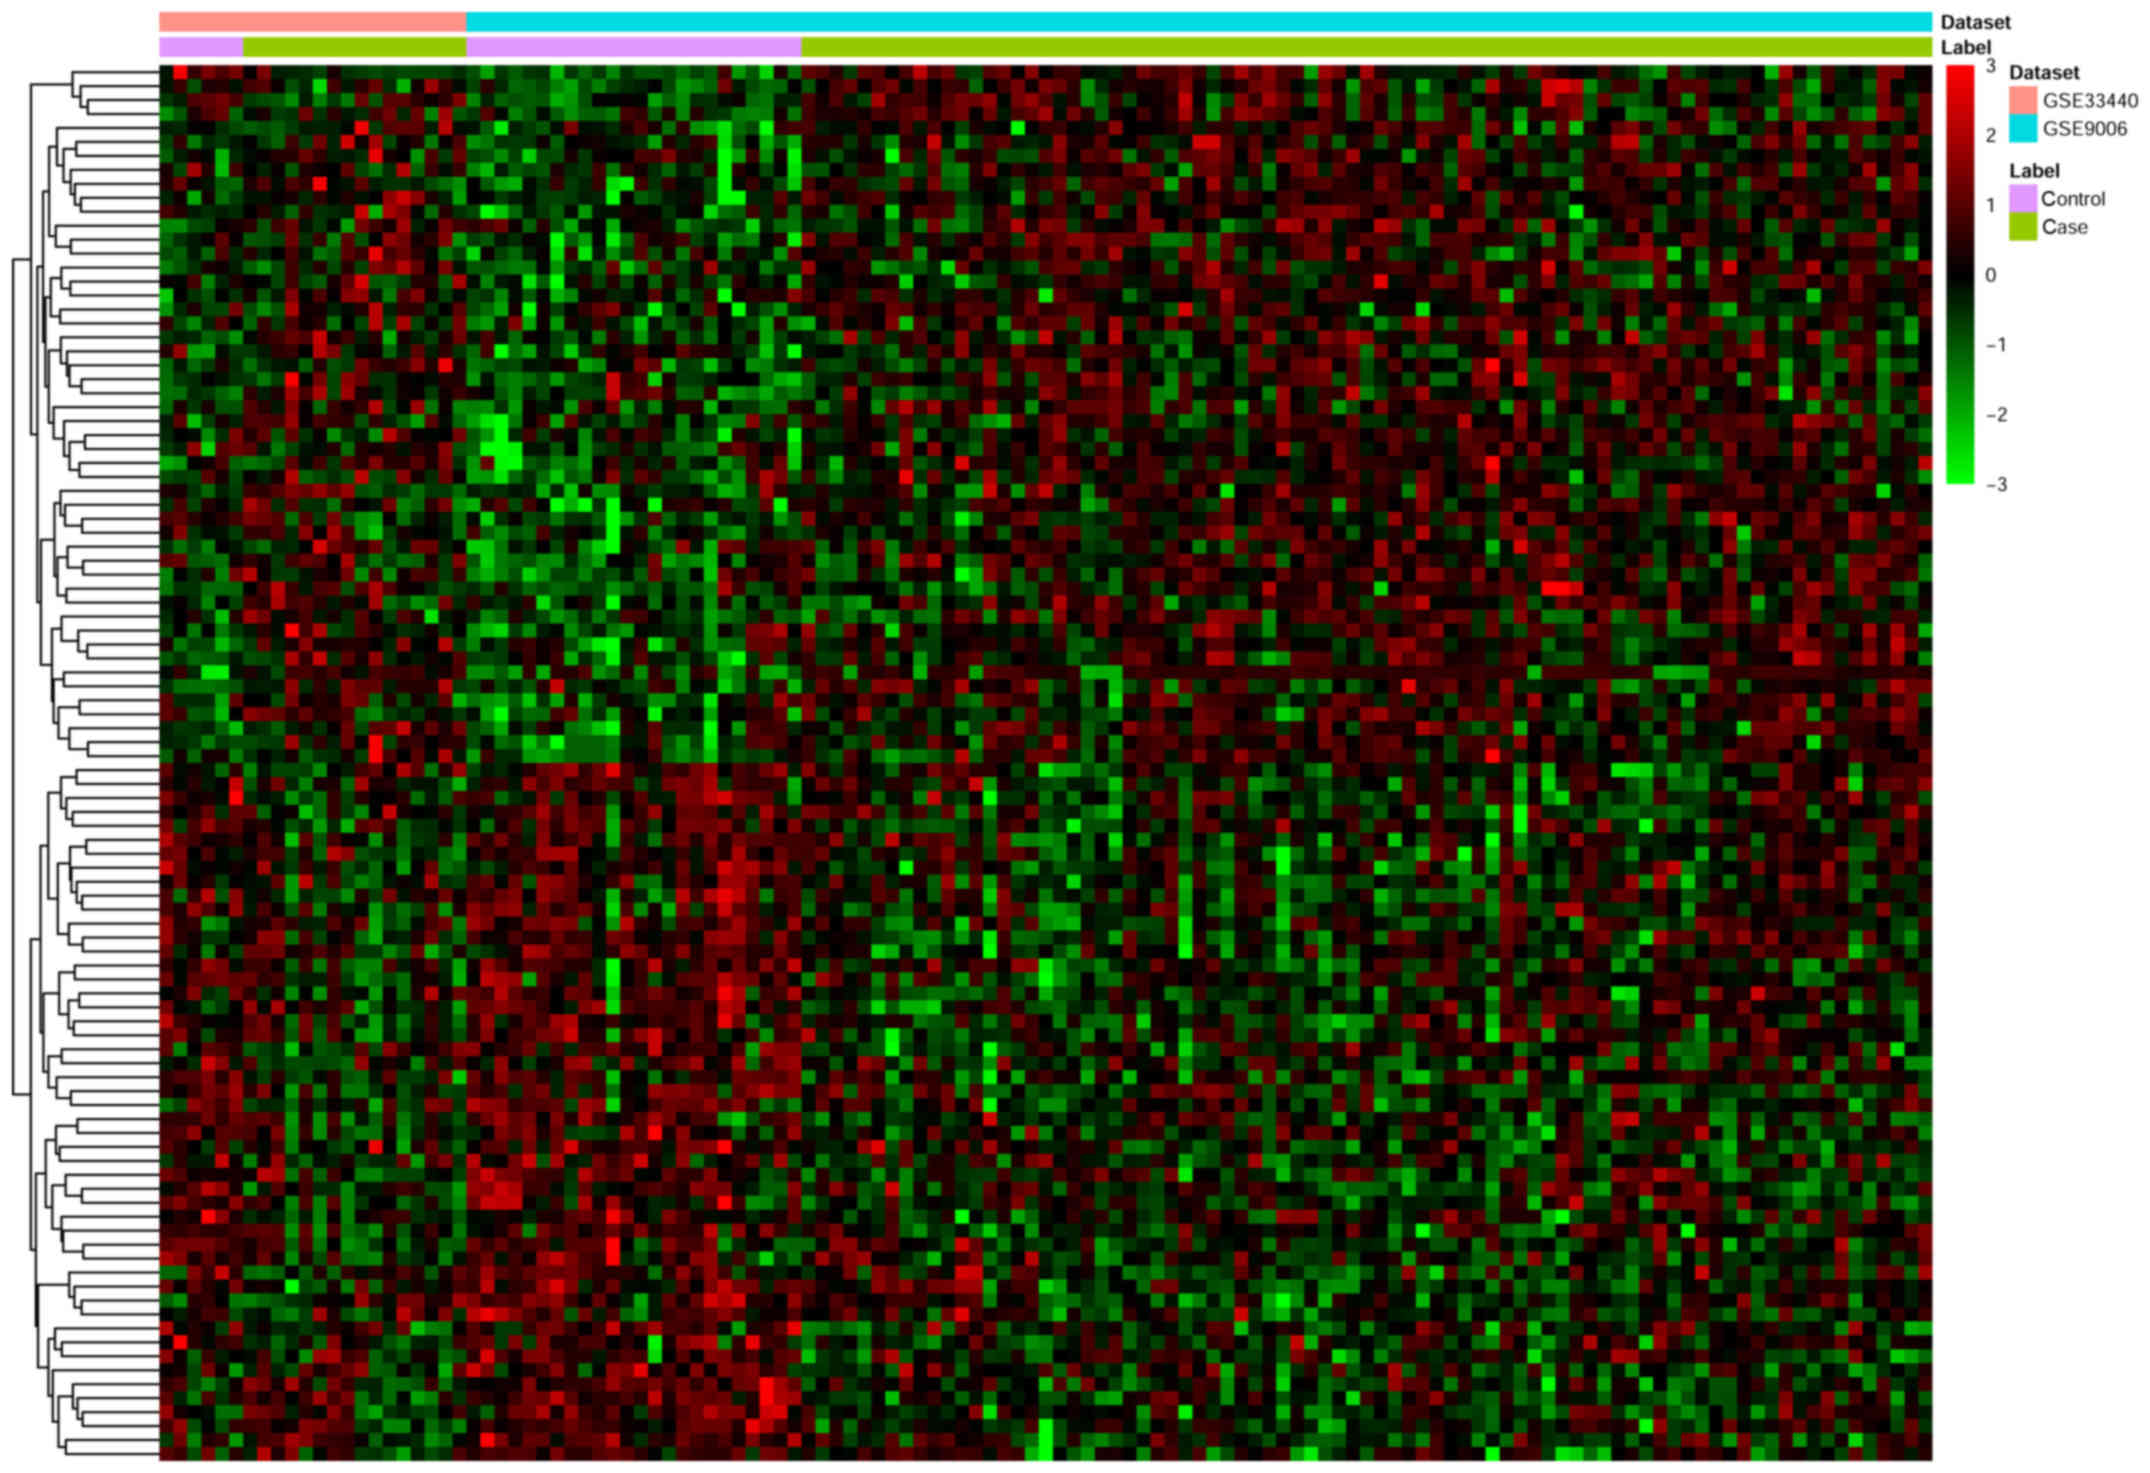
Raw expression profiles were downloaded from the
data portal of the GEO database. A total of 1,467 DEGs were
identified, comprising 804 upregulated genes and 663 downregulated
genes. The top 10 up- and downregulated DEGs are listed in Table III and a heat map of the top 100
DEGs is presented in Fig. 1.
| Table III.Top 20 differentially expressed genes
in children with type 1 diabetes. |
Table III.
Top 20 differentially expressed genes
in children with type 1 diabetes.
| A, Upregulated
genes |
|---|
|
|---|
| Gene ID | Gene symbol | P-value |
|---|
| 1154 | CISH | 1.54×10⁻⁷ |
| 3126 | HLA-DRB4 | 1.85×10⁻⁷ |
| 25888 | ZNF473 | 4.29×10⁻⁷ |
| 4860 | NP | 7.90×10⁻⁷ |
| 1380 | CR2 | 3.51×10⁻⁶ |
| 28984 | C13orf15 | 5.07×10⁻⁶ |
| 9938 | ARHGAP25 | 6.64×10⁻⁶ |
| 2181 | ACSL3 | 1.22×10⁻⁵ |
| 51561 | IL23A | 1.51×10⁻⁵ |
| 3097 | HIVEP2 | 1.91×10⁻⁵ |
|
| B, Downregulated
genes |
|
| Gene ID | Gene
symbol | P-value |
|
| 9169 | SFRS2IP | 4.40×10⁻⁸ |
| 79932 | KIAA0319L | 1.01×10⁻⁶ |
| 3184 | HNRNPD | 1.38×10⁻⁶ |
| 55768 | NGLY1 | 3.77×10⁻⁶ |
| 6891 | TAP2 | 1.66×10⁻⁵ |
| 313 | AOAH | 2.43×10⁻⁵ |
| 7347 | UCHL3 | 2.61×10⁻⁵ |
| 5529 | PPP2R5E | 3.46×10⁻⁵ |
| 2162 | F13A1 | 4.15×10⁻⁵ |
| 85021 | REPS1 | 5.19×10⁻⁵ |
Functional and pathway enrichment
analyses of DEGs
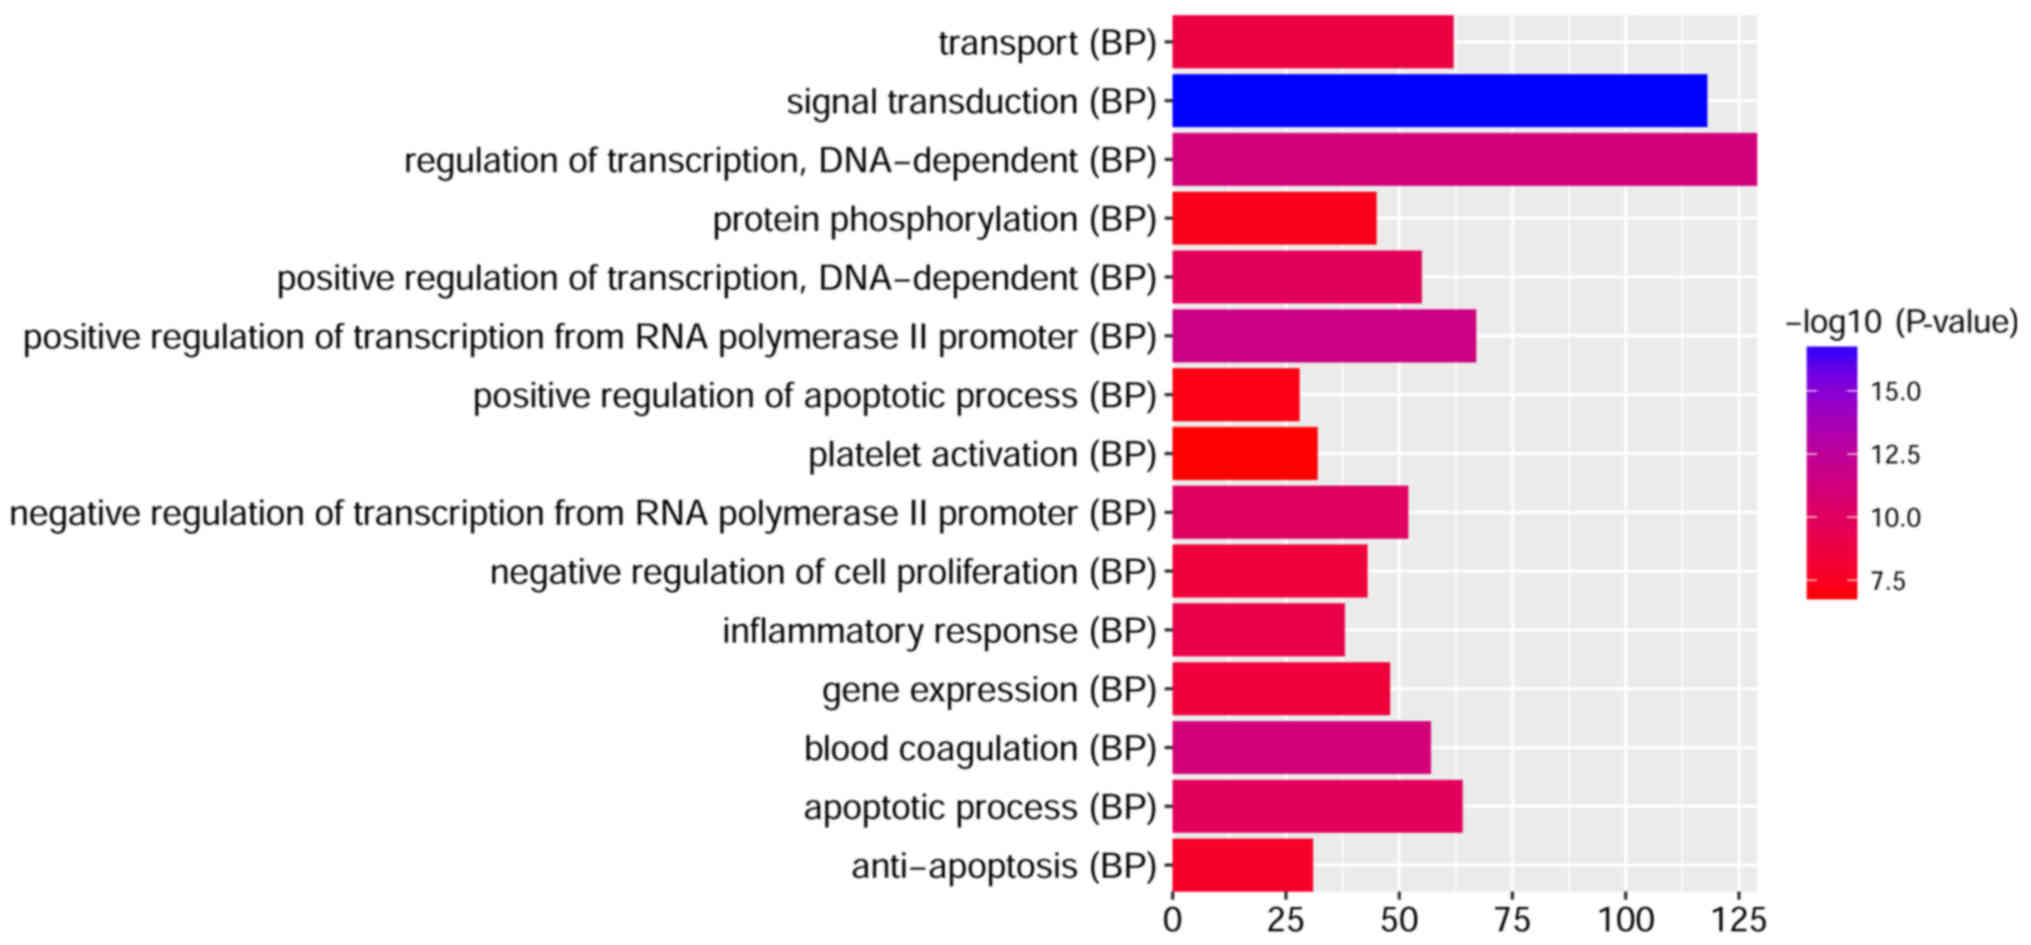
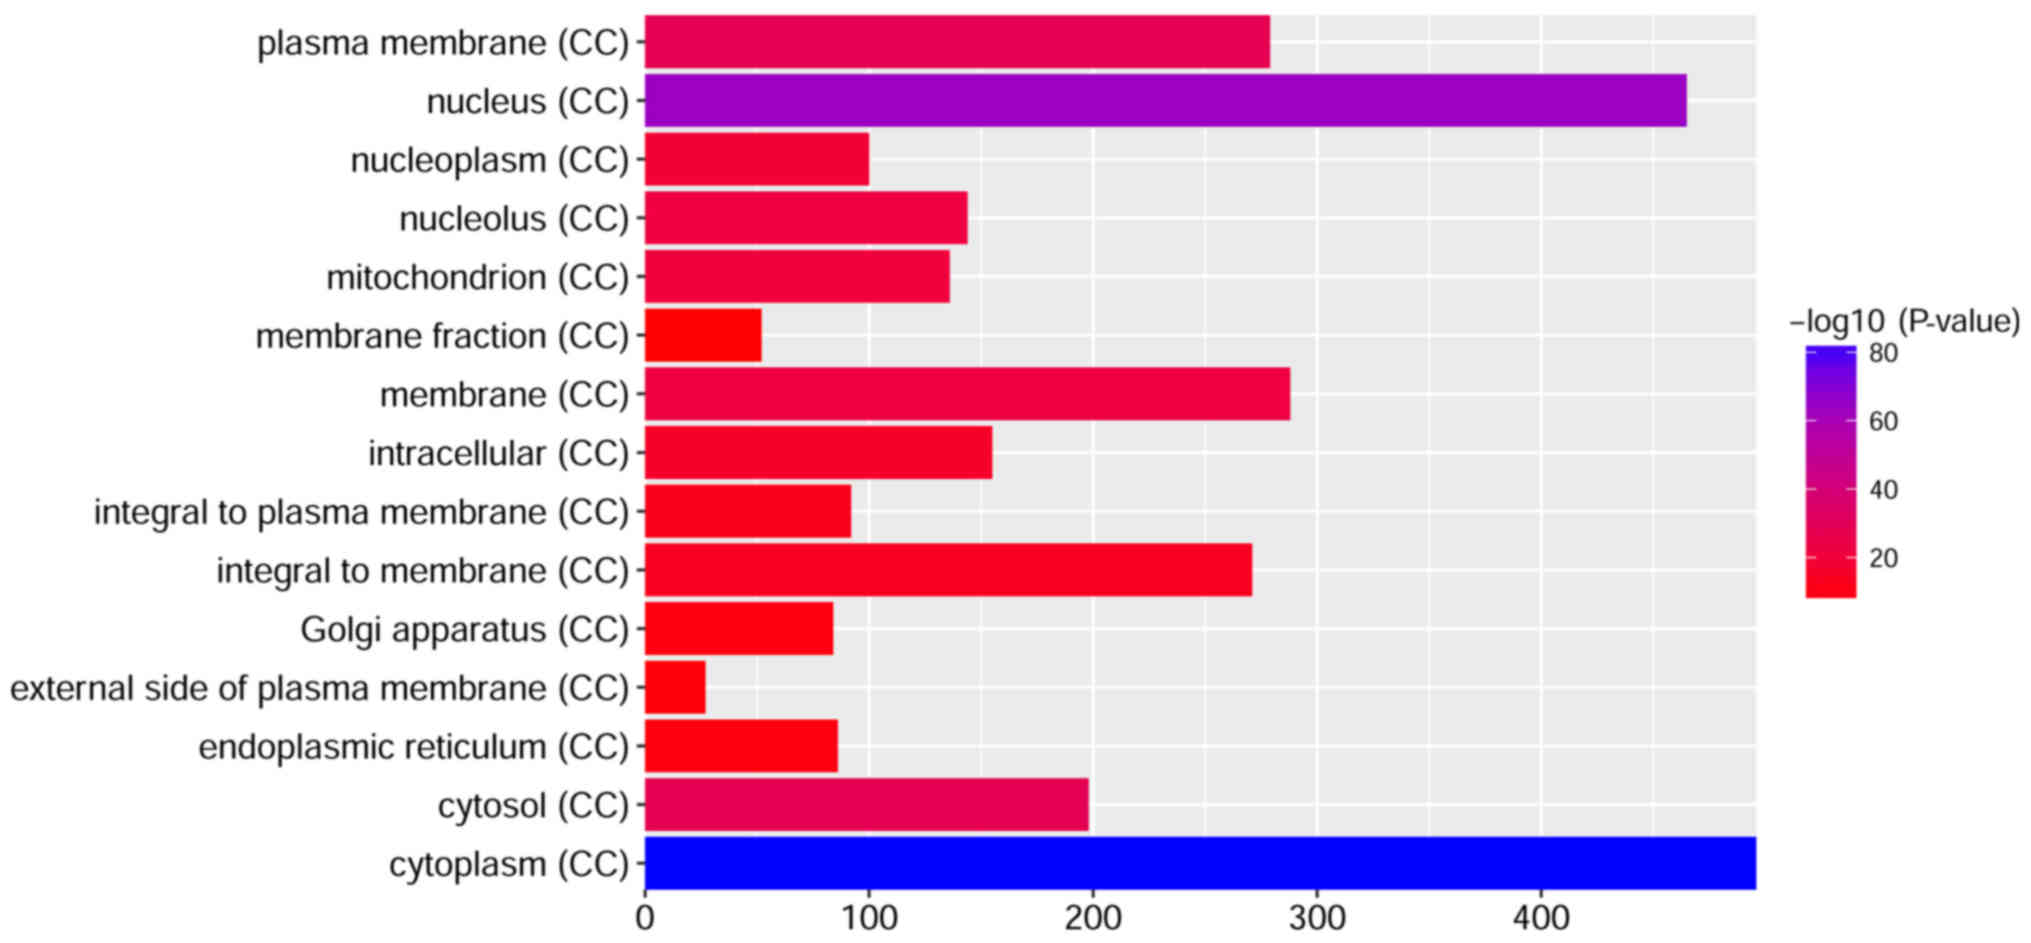
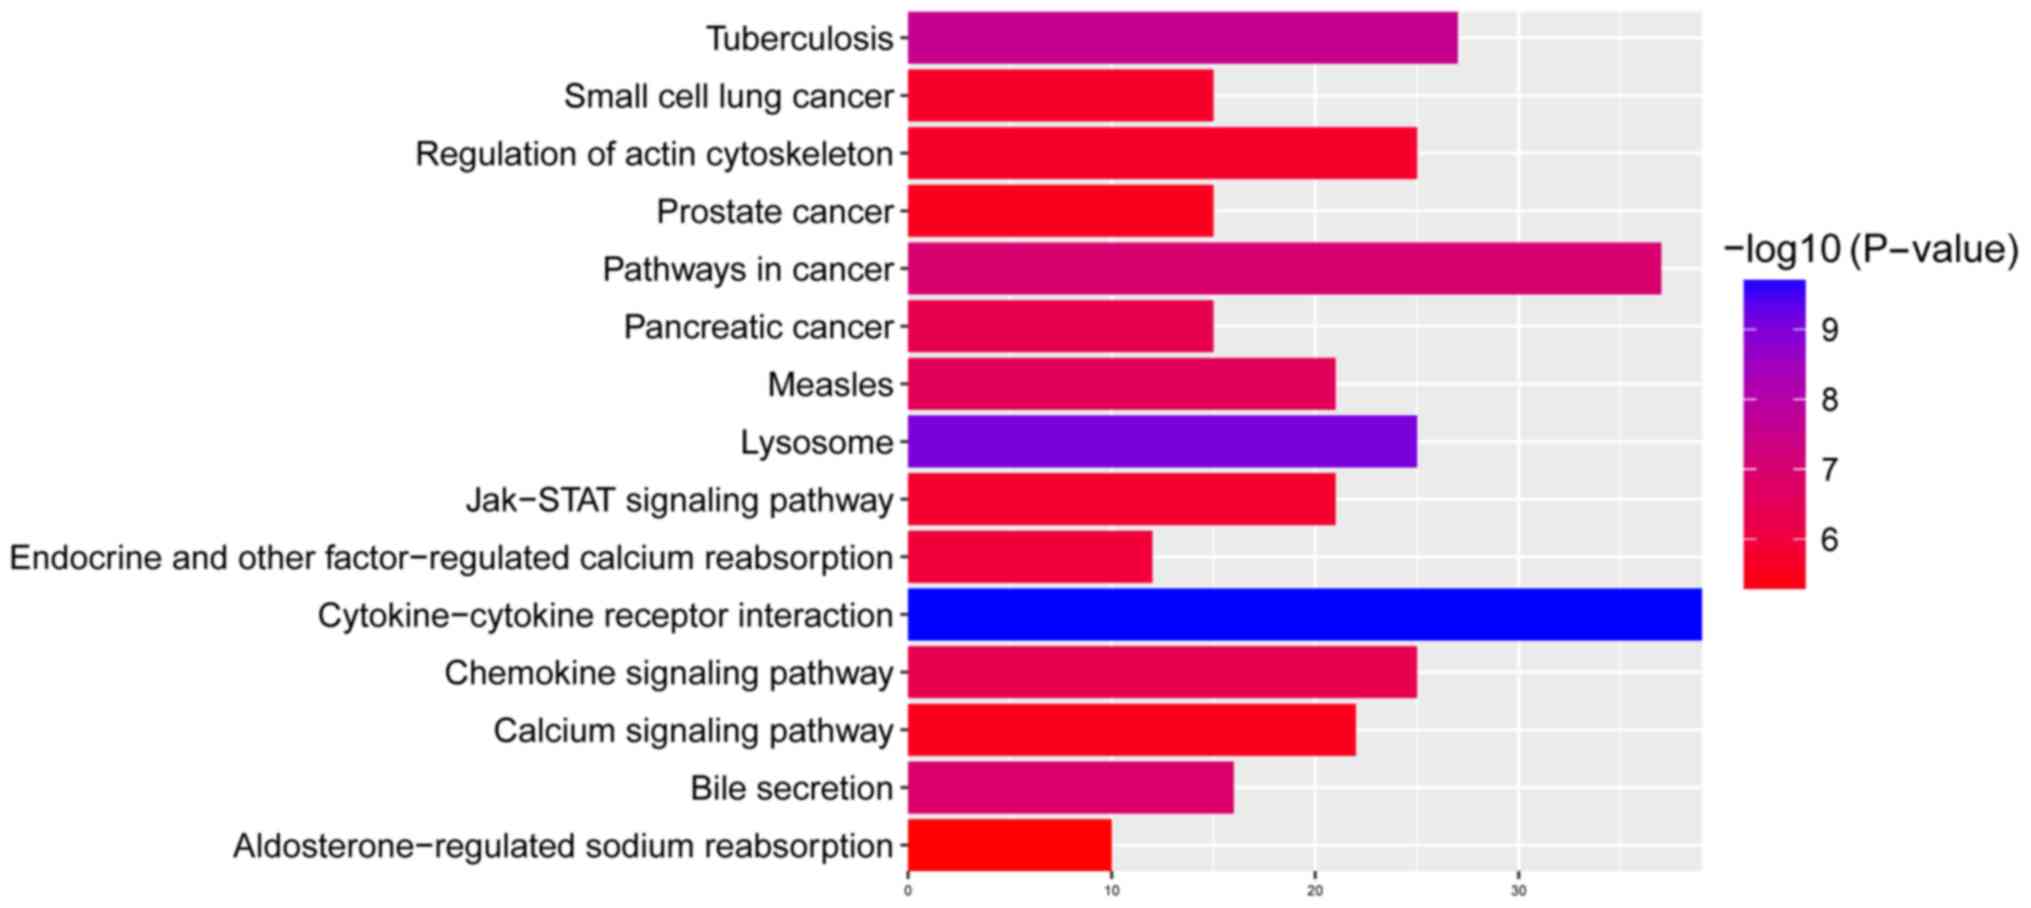
To investigate the biological functions of the
identified DEGs in children with T1D, GO term and KEGG pathway
enrichment analyses were performed. ‘Signal transduction’,
‘regulation of transcription, DNA-dependent’, ‘positive regulation
of transcription from RNA polymerase II promoter’, ‘blood
coagulation’ and ‘apoptotic process’ were the most significantly
enriched biological processes. ‘Protein binding’, ‘nucleotide
binding’ and ‘metal ion binding’ were the most markedly enriched
molecular functions, and ‘cytoplasm’, ‘nucleus’ and ‘cytosol’ were
the most significantly enriched cellular components.
‘Cytokine-cytokine receptor interaction’, ‘lysosome’ and
‘tuberculosis’ were the most significantly enriched KEGG signaling
pathways. The top 15 GO terms of the DEGs are presented in Figs. 2–4. The top 15 KEGG enriched signaling
pathways of the DEGs are presented in Fig. 5.
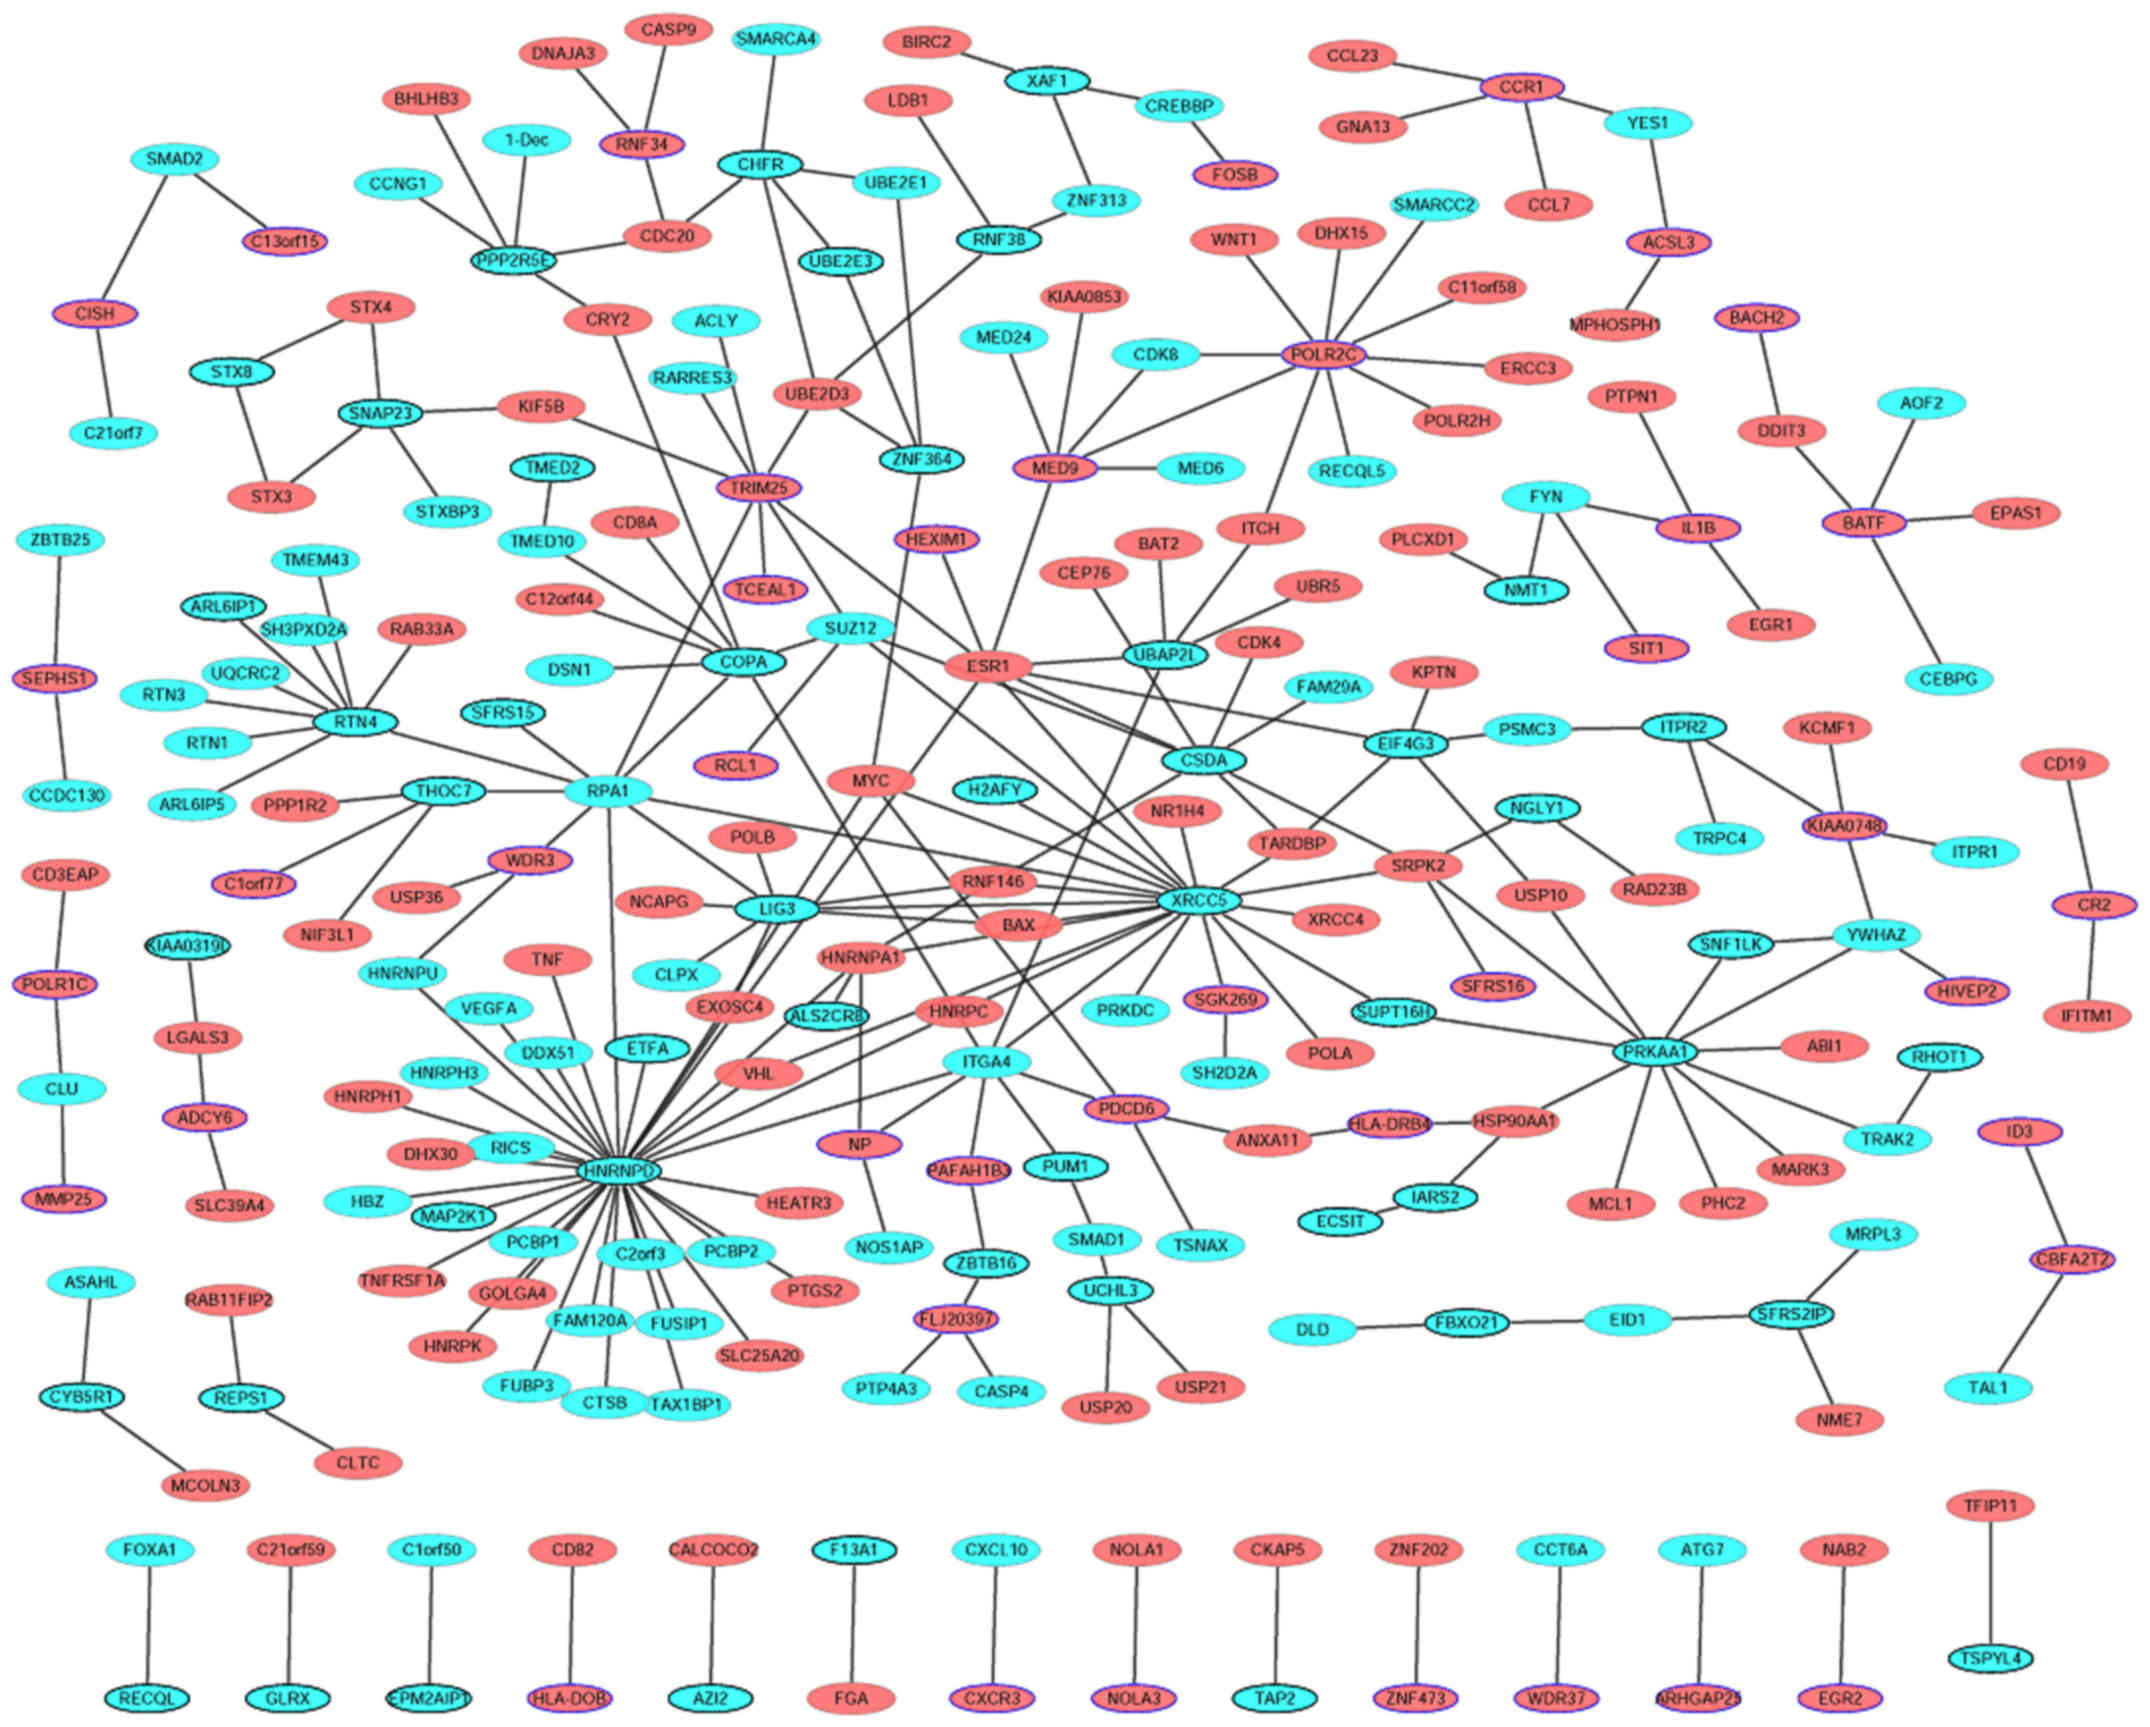
PPI network
To assess the interactions between proteins encoded
by the DEGs and other proteins, the PPI network was examined and
visualized using Cytoscape software. PPI networks of the top 50
upregulated and top 50 downregulated DEGs are presented in Fig. 6. The network consists of 252 nodes
and 260 edges. Red and cyan ellipses represent up- and
downregulated proteins, respectively. Ellipses with blue or black
borders represent proteins encoded by the top 100 upregulated and
the top 100 downregulated DEGs, respectively. The top 13 proteins
with a high degree of interaction with other proteins were
heterogeneous nuclear ribonucleoprotein D (HNRNPD; degree=33),
X-ray repair cross complementing 5 (degree=20), protein kinase
AMP-activated catalytic subunit a1 (PRKAA1; degree=11), RNA
polymerase II subunit C (degree=10), reticulon 4 (degree=9),
replication protein A1 (degree=9), Y-box binding protein 3
(degree=8), DNA ligase 3 (degree=8), coatomer protein complex
subunit α (degree=8), tripartite motif containing 25 (degree=8),
chromosome 2 containing integrin subunit α4 (ITGA4; degree=8), ESR1
(degree=8) and mediator complex subunit 9 (degree=6).
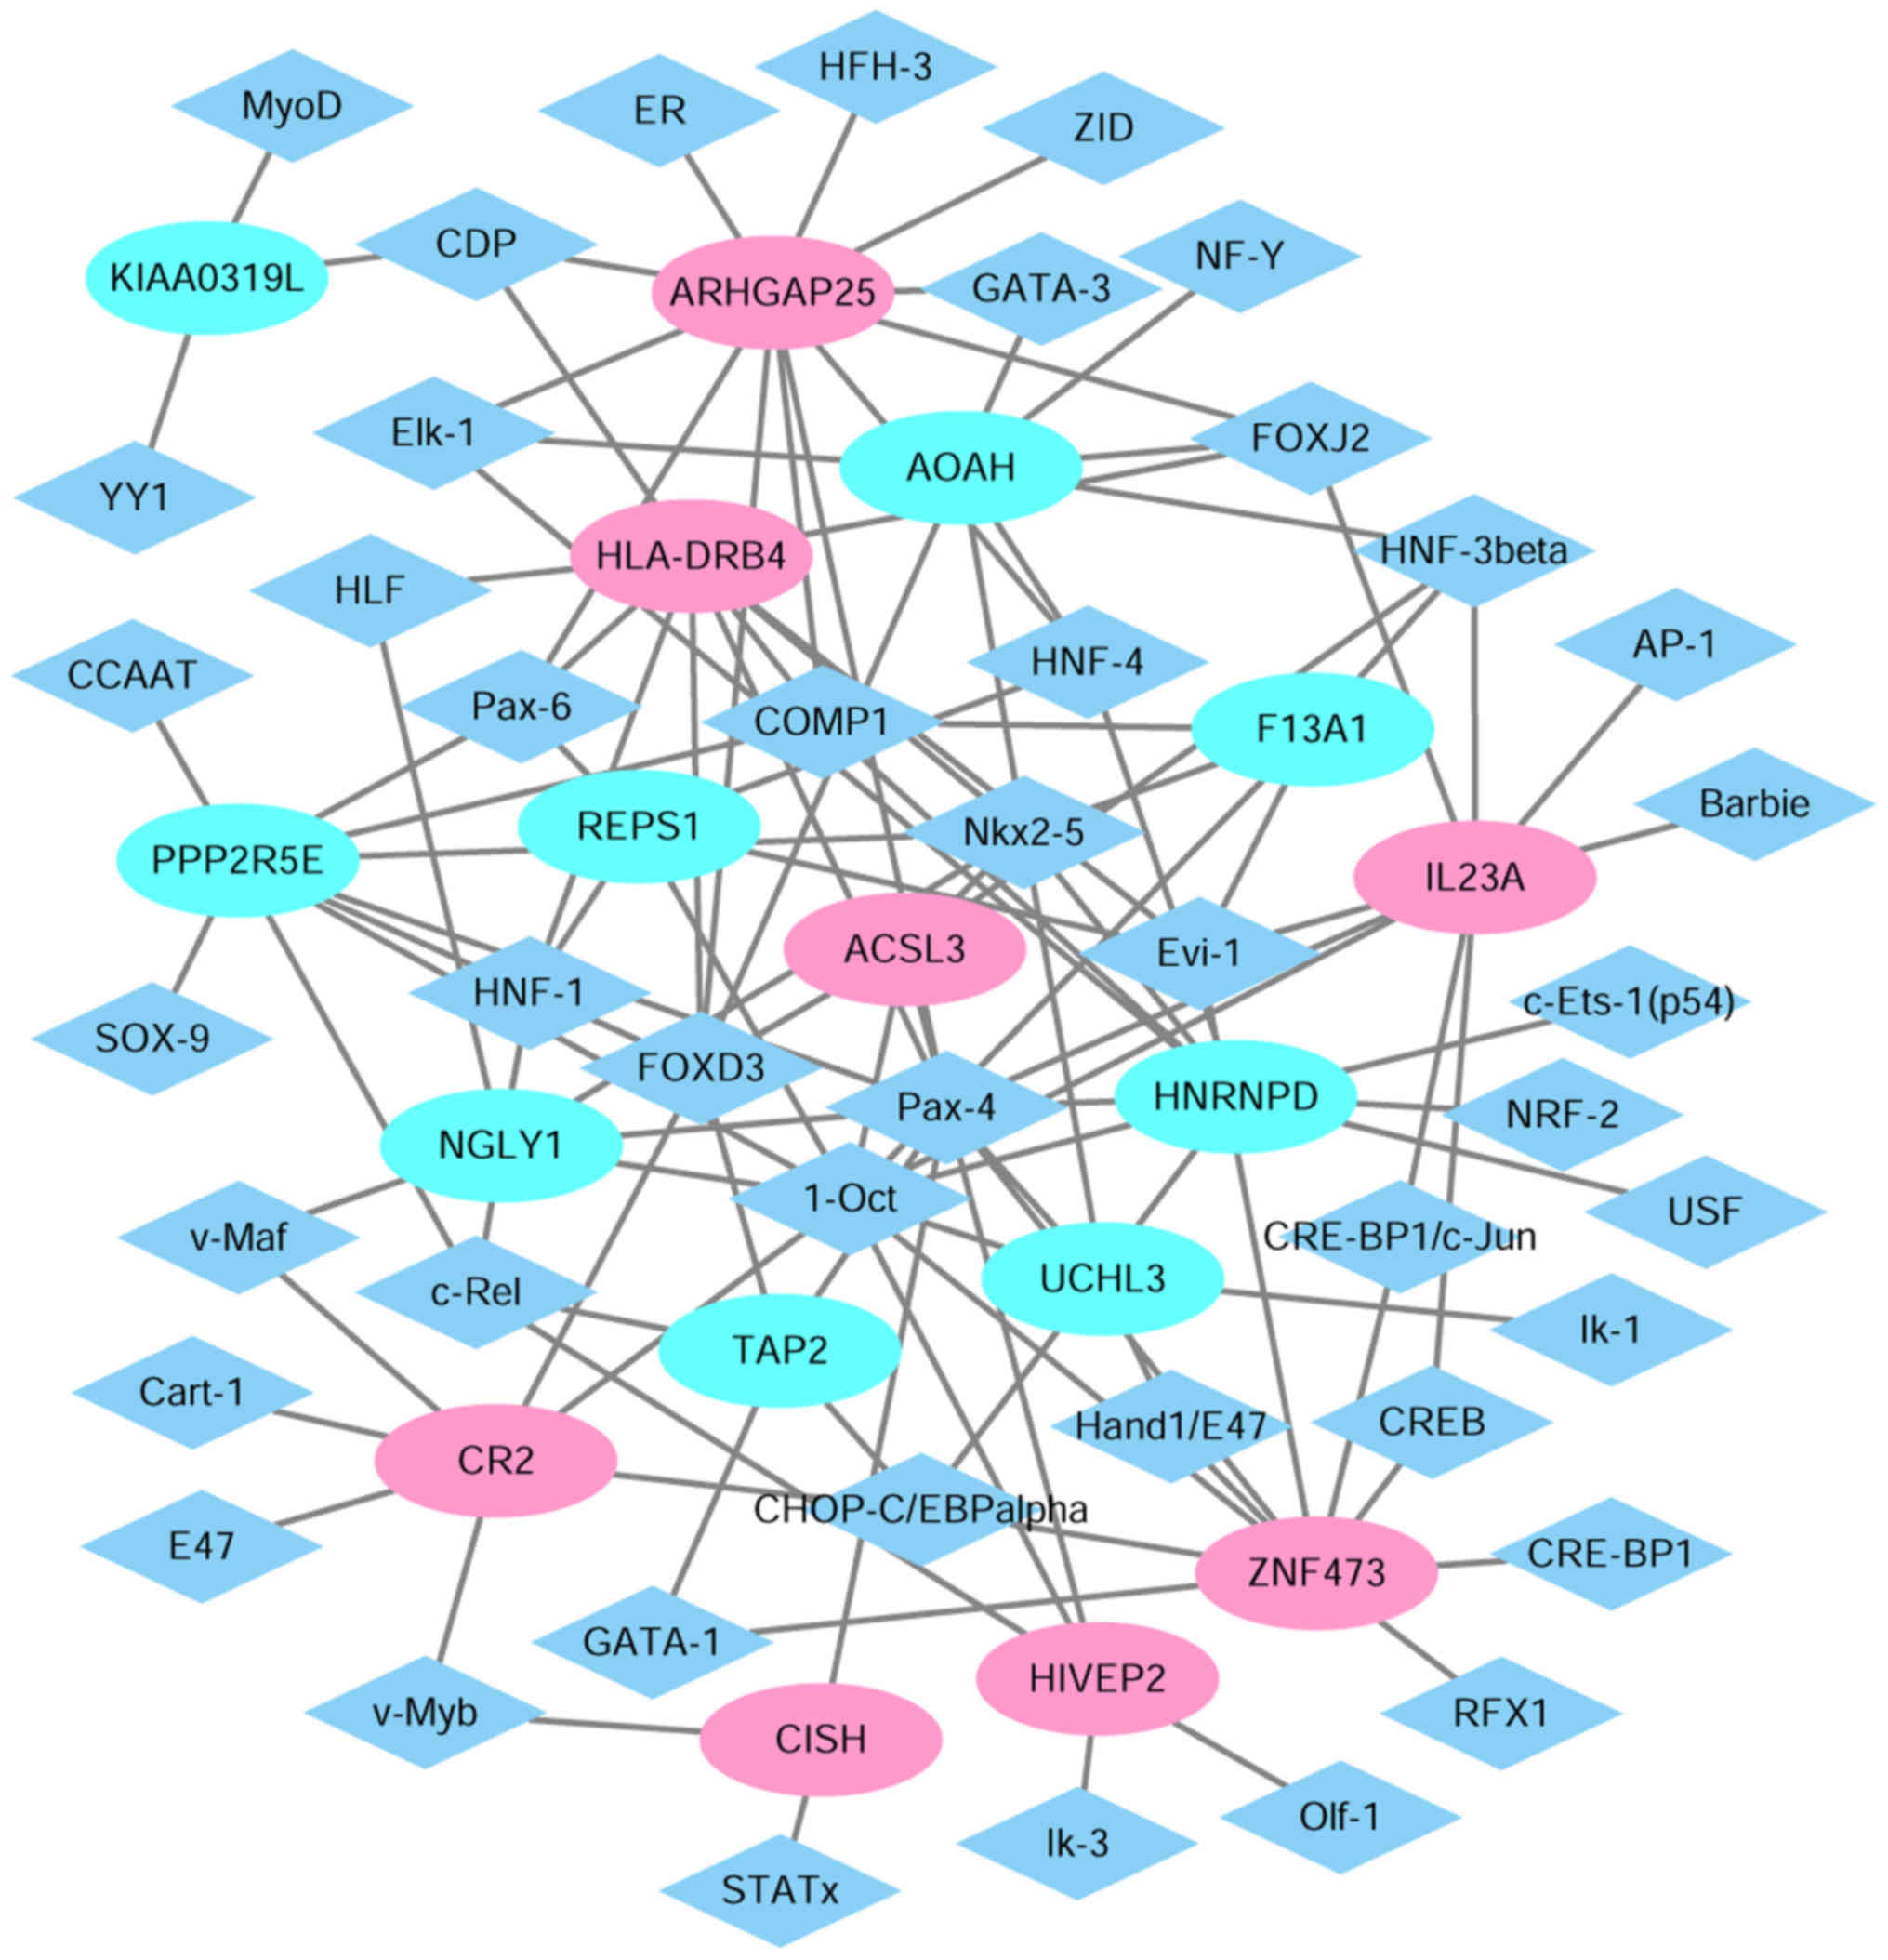
Establishment of TF-target genes
regulatory network
In order to investigate the regulatory network of
TF-target genes for children with T1D, TRANSFAC was utilized to
obtain TFs for the top 10 upregulated or downregulated DEGs. A
transcriptional regulatory networks consisting of 250 pairs of
TF-genes involving 36 TFs was obtained (Fig. 7). Diamonds and ellipses represent
TFs and genes, respectively. Red and cyan coloring represents up-
and downregulation, respectively. In this network, the top 9
downstream genes covered by the majority of TFs were ARHGAP25
(degree=12), HNRNPD (degree=10), zinc finger protein 473
(degree=10), HLA-DRB4 (degree=10), IL23A (degree=9), protein
phosphatase 2 regulatory subunit B'ε (degree=9), acyloxyacyl
hydrolase (degree=8), complement C3d receptor 2 (degree=7) and
N-glycanase 1 (degree=7).
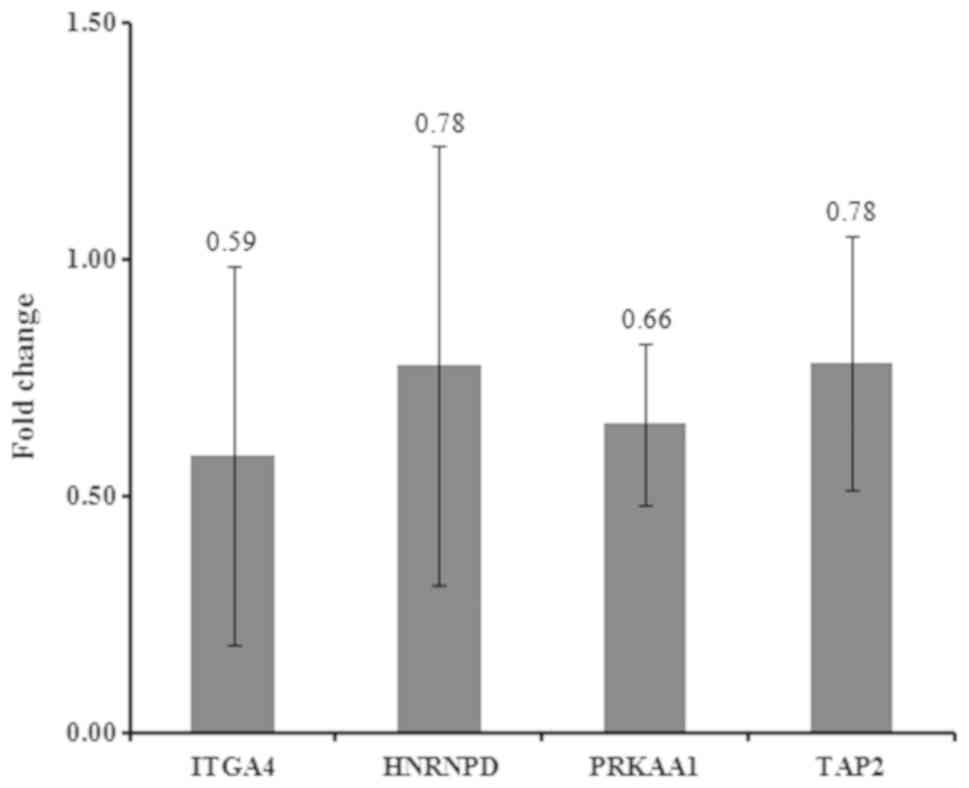
RT-qPCR
In the present study, four candidate genes were
selected for validation: HNRNPD, PRKAA1, ITGA4 and transporter 2,
ATP binding cassette subfamily B member (TAP2; Fig. 8). The results demonstrated that
HNRNPD (P=0.465), PRKAA1 (P=0.256), ITGA4 (P=0.236) and TAP2
(P=0.295) were downregulated, although these results were not
statistically significant.
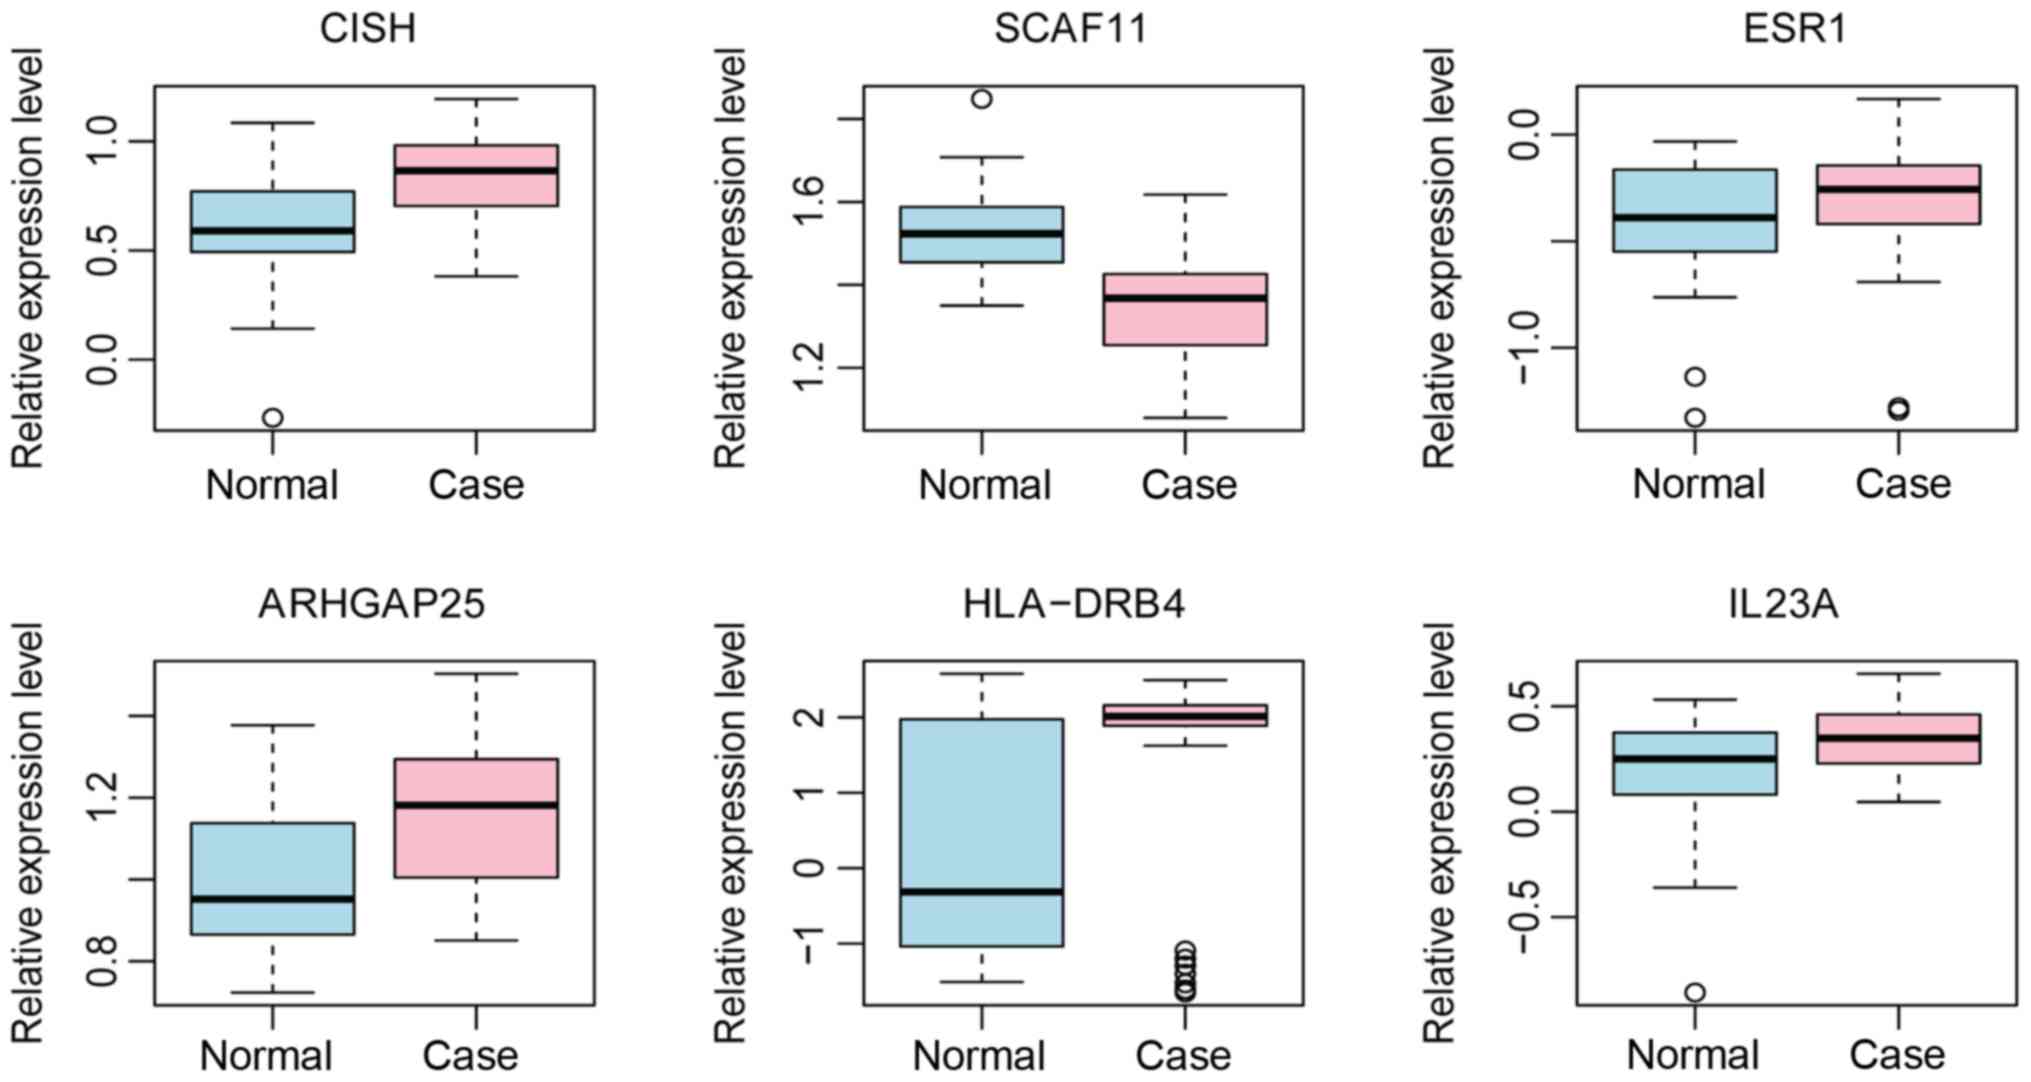
Electronic validation of DEGs and ROC
analysis
The results of electronic validation revealed that
CISH, ESR1, ARHGAP25, HLA-DRB4 and IL23A were upregulated and
SCAF11 was downregulated in T1D, which was consistent with the
bioinformatics analysis. Expression box plots of these DEGs are
presented in Fig. 9. Additionally,
ROC curve analysis was performed and the AUC calculated to assess
the discriminatory ability of these genes (Fig. 10). SCAF11 had the largest AUC. For
children with T1D, the specificity and sensitivity of CISH were
58.3 and 93%, respectively; the specificity and sensitivity of
SCAF11 were 87.5 and 79.1%, respectively; the specificity and
sensitivity of ESR1 were 62.5 and 69.8%, respectively; the
specificity and sensitivity of ARHGAP25 were 79.2 and 60.5%,
respectively; the specificity and sensitivity of HLA-DRB4 were 62.5
and 83.7%, respectively; and the specificity and sensitivity of
IL23A were 70.8 and 58.1%, respectively. In summary, CISH, SCAF11
and ARHGAP25 had a good diagnostic value for children with T1D as
the AUC was >0.7.
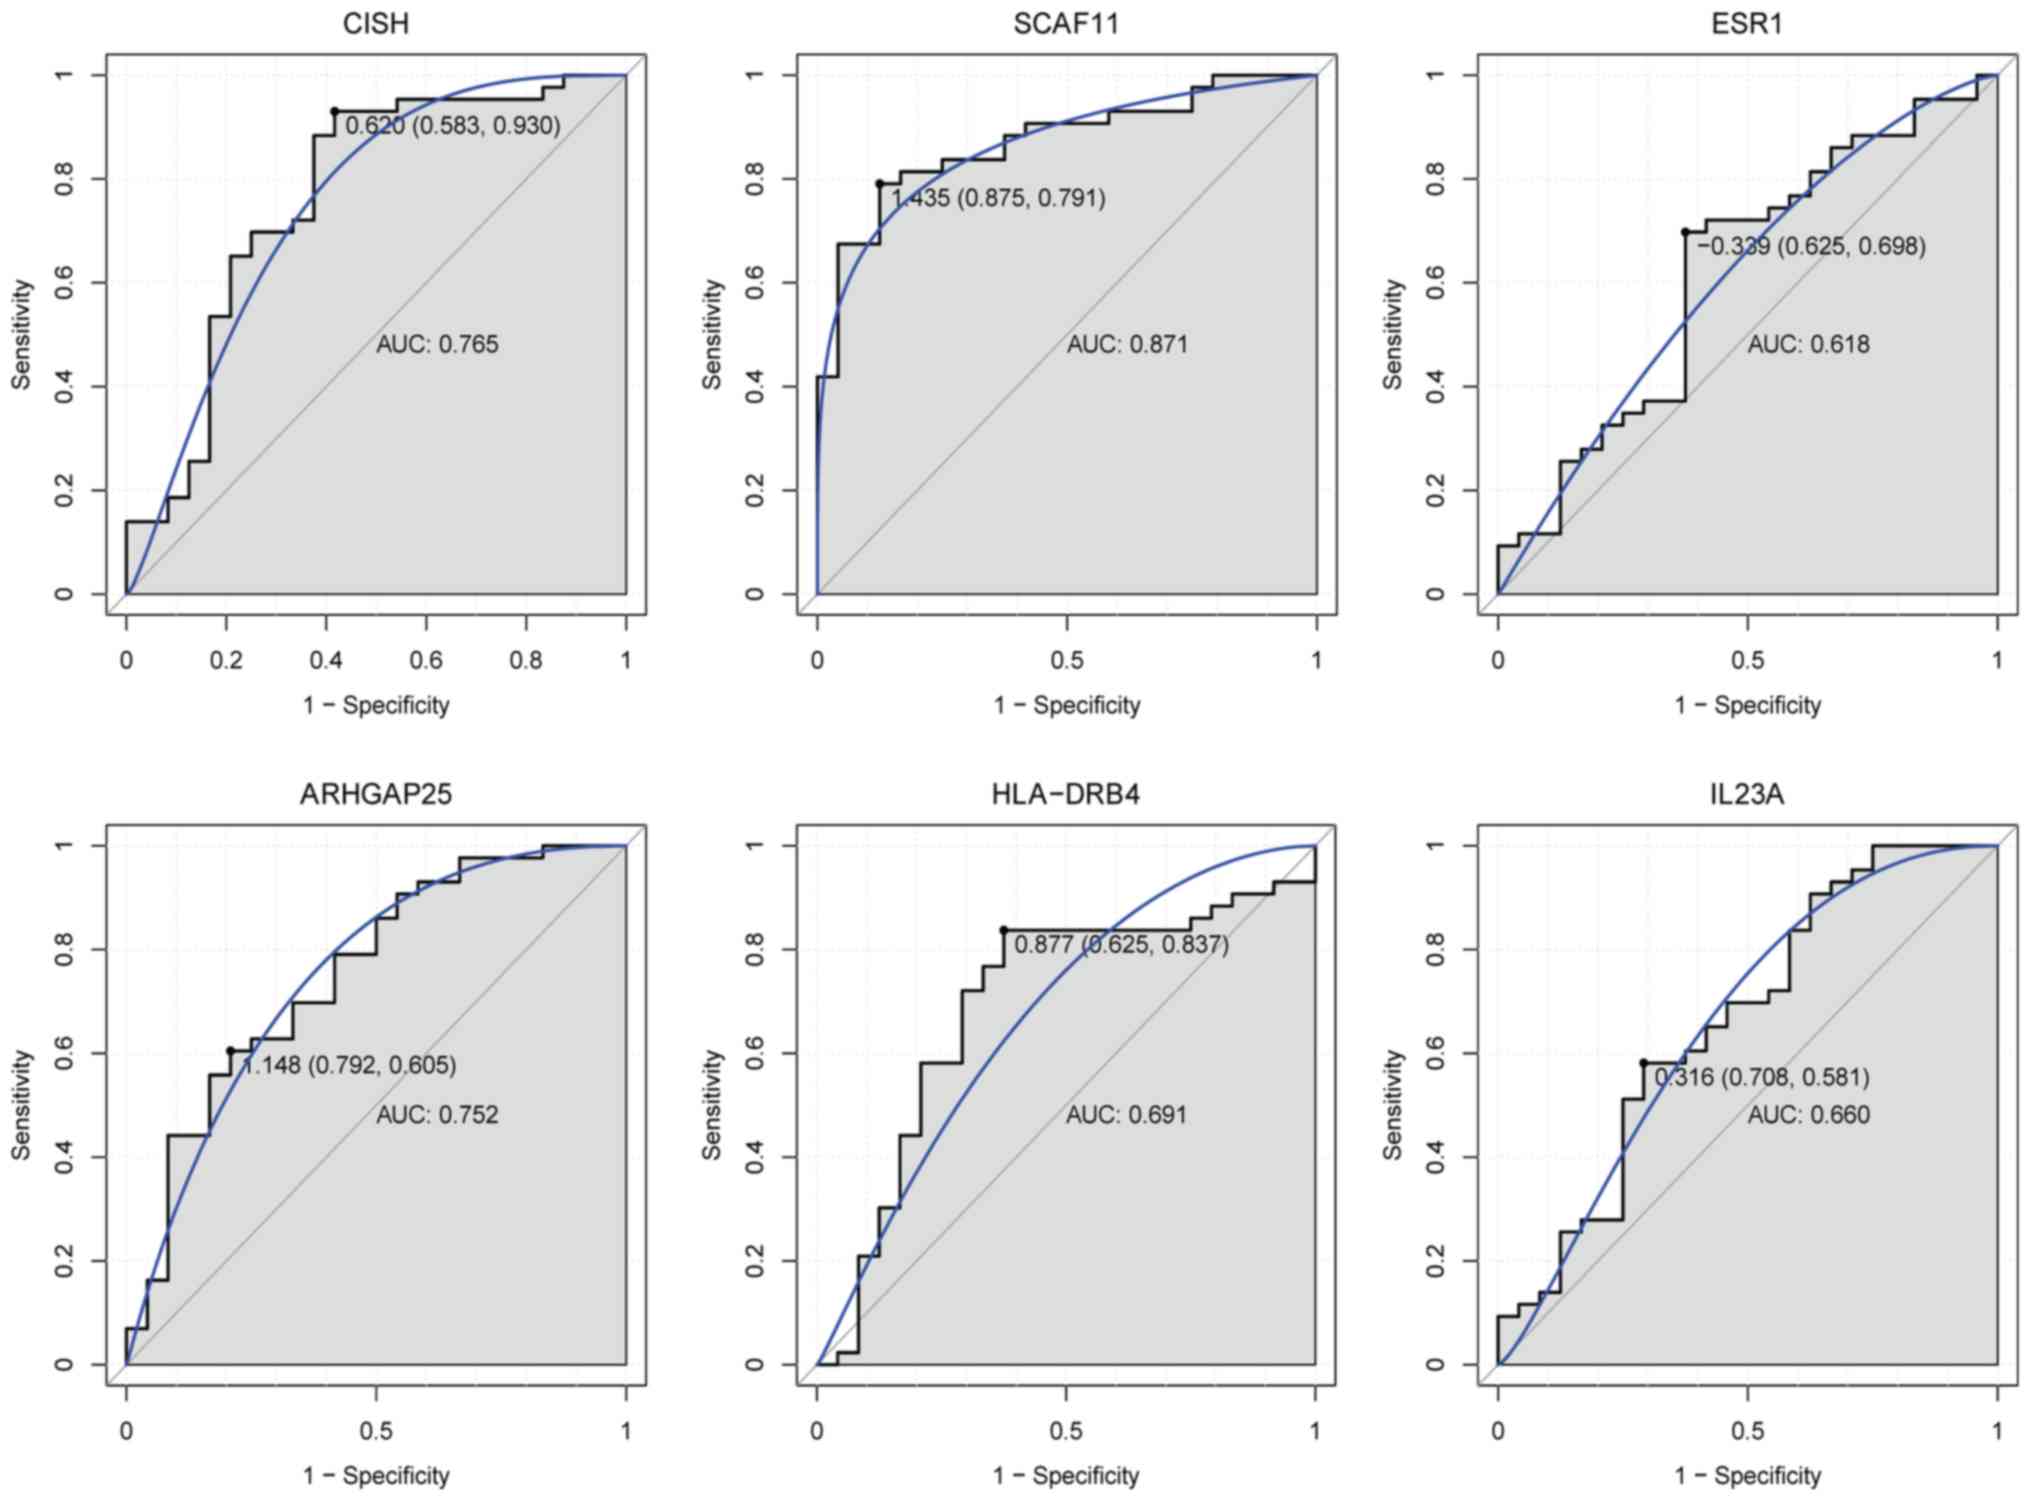 | Figure 10.ROC curves of selected DEGs in
children with type 1 diabetes compared with healthy controls. ROC
curves were used to illustrate the diagnostic ability, sensitivity
and specificity of the selected DEGs. The x-axes indicate
specificity and the y-axes indicate sensitivity. ROC, receiver
operating characteristic; DEGs, differentially expressed genes;
CISH, cytokine inducible SH2 containing protein; SCAF11, SR-related
CTD associated factor 11; ESR1, estrogen receptor 1; ARHGAP25, Rho
GTPase activating protein 25; HLA-DRB4, major histocompatibility
complex, class II, DR β4; IL23A, interleukin 23 subunit α. |
Discussion
The present study identified that CISH and SCAF11
were the most up- and downregulated genes in children with T1D. The
CIS/suppressors of cytokine signaling (SOCS) family serves an
important role in various immunological processes (13–16).
CISH, a member of the SOCS family, is expressed in every cell and
is rapidly induced by a number of stimuli, including cytokines
(erythropoietin, IL-2, IL-3 and IL-5), hormones, glucose, immune
complexes and Toll-like receptor ligands (17–19).
Another study suggested that CISH was a critical negative regulator
of IL-15 signaling in NK cells and that CISH deletion enhanced
anti-tumor immunity (20).
Decreased CISH expression in circulating peripheral blood
mononuclear cells is associated with the severity of autoimmune
diseases (21). Recently, CISH has
emerged as an important modulator of β-cell insulin desensitization
following prolonged glucose exposure. It has been reported that the
expression and DNA methylation of CISH alter in response to
hyperglycemia (22). Furthermore,
the expression of CISH proteins is upregulated in islet cells from
patients with T1D compared with healthy individuals (23). In mouse models, CISH is also
associated with the T2D phenotype (24). SCAF11, also termed SFRS2IP, is a
protein that is required for pre-mRNA splicing. Delunardo et
al (25) identified that
SCAF11 was involved in Behcet's disease, which has certain features
of autoimmunity. In the present study, the electronic validation of
CISH and SCAF11 was consistent with the bioinformatics analysis.
Importantly, CISH and SCAF11 had diagnostic value for children with
T1D. The results suggested that CISH and SCAF11 may serve crucial
roles in autoimmunity and may be associated with the pathology of
T1D in children.
In the PPI network, a number of genes with a high
degree of protein interactions, including HNRNPD, PRKAA1, ITGA4 and
ESR1 were identified. HNRNPD, additionally termed AUF1, is known to
serve roles in mRNA regulation and the stability of proteins in the
inflammatory response and developmental processes (26). It has been demonstrated that HNRNPD
knockdown decreases glucose deprivation-induced apoptosis, whereas
HNRNPD overexpression has the opposite effect (27). The present study first identified
that HNRNPD expression was downregulated in the blood of children
with T1D. Furthermore, the results of the RT-qPCR validation were
consistent with the bioinformatics analysis. The results further
suggested that HNRNPD is associated with the progression of T1D in
children.
In mammals, the PRKAA1 protein is one of the
subunits of 5′-adenosine monophosphate-activated protein kinase, an
important metabolic switch that governs glucose metabolism in
response to alterations in intracellular energy levels in
pancreatic β-cells (28). PRKAA1
activation results in glucose transporter upregulation. It has been
reported that PRKAA1 serves roles in gluconeogenesis and is
important for glucose-stimulated insulin secretion from pancreatic
β-cells (29,30). It has also been reported that
PRKAA1 expression is significantly decreased in islets in T2D
(31). To the best of the authors'
knowledge, the present study is the first to report that that
PRKAA1 is downregulated in the blood of children with T1D. The
results suggested that PRKAA1 may serve a vital role in the
pancreatic β-cells of children with T1D.
Nalls et al (32) reported that specific loci that
regulate immune cell frequency on ITGA4 are associated with
immune-mediated disorders. In addition, the rs1449263 polymorphism
of ITGA4 has been studied in a number of autoimmune diseases
(33). It has been identified that
the rs13010713 polymorphism of ITGA4 is present in T1D (34). The present study identified that
ITGA4 was downregulated in the blood of children with T1D. Notably,
the results of RT-qPCR validated the expression of ITGA4. The
present study provided additional evidence that ITGA4 serves
important roles in the pathogenesis of T1D in children.
ESR1 is expressed by thymocytes, T cells, B
lymphocytes, thymic epithelial cells and non-hematopoietic bone
marrow cells, which serve roles in the functioning of the immune
system (35–41). Ribas et al (42) identified that ESR1 serves a key
role in protecting against and reducing inflammation, in addition
to a key role in glucose tolerance (43). It is known that men with the ESR1
null mutation exhibit insulin resistance and impaired glucose
tolerance (44). It has also been
demonstrated that ESR1 polymorphisms, including variants in the
intron 1-intron 2 region, are positively associated with the T2D
phenotype (45). In addition, ESR1
is a DEG associated with islet function and the exocrine function
of the pancreas in patients with T1D (46). The present study identified that
ESR1 was upregulated in the blood of children with T1D, which
suggested that ESR1 is closely associated with the pathology of
children with T1D.
The TF-target genes regulatory network for children
with T1D was obtained and investigated. In this network, a number
of high-degree target genes of TFs were identified, including
ARHGAP25, HLA-DRB4 and IL23A. ARHGAP25, a GTPase-activating protein
for Rac, is upregulated in alveolar rhabdomyosarcoma and is
required for cell invasion (47).
It has been reported that ARHGAP25 is an immune gene (48) and the rs6714065 and rs7605681
polymorphisms of ARHGAP25 have been identified in T2D (49). In the present study, ARHGAP25 was
upregulated in the blood of children with T1D. Notably, it was
identified that ARHGAP25 had potential diagnostic value for
children with T1D. This suggested that ARHGAP25 may serve an
important role in the development of T1D in children.
HLA-DRB4, additionally termed DR4, is important to
the adaptive immune system. Genetic variation in the HLA region is
associated with diabetes risk (50) and the HLA class II allele confers
genetic susceptibility to T1D (51). HLA-DRB4 is an immunity-associated
gene that is differentially expressed in the intestine of
insulin-resistant subjects (52).
It has been demonstrated that HLA-DRB4 confers susceptibility to
T1D (53). HLA-DRB4 is
differentially expressed in the immune system and serves roles in
antigen presentation in the islets of T1D patients (46). It has been reported that HLA-DRB4
expression is significantly associated with childhood T1D (54). The present study also identified an
association between HLA-DRB4 and childhood T1D, which was in
agreement with a previous study (54).
IL23A is an autoimmune risk factor that belongs to
the IL-12 heterodimeric cytokine family (55). It has been reported that genetic
variation in IL23A has an influence on T2D (56) and that IL23A overexpression occurs
in patients with T1D (57). In the
present study, IL23A expression was identified to be upregulated in
the blood of patients with childhood T1D. The results suggested
that IL23A may be involved in the pathogenesis of childhood
T1D.
TAP2 is associated with a number of autoimmune
diseases (58). Vejbaesya et
al (59) reported that TAP2
served important roles in HLA-associated diseases and the immune
response, including systemic lupus erythematosus and rheumatoid
arthritis (60). It has been
reported that TAP2 is a risk factor for T1D (61). The present study identified that
TAP2 was downregulated in the blood of children with T1D. The
results of RT-qPCR confirmed this, further suggesting that TAP2
served an important role in the development of childhood T1D.
In summary, the results of the present study
revealed a number of genes that are differentially expressed in
T1D, including CISH, SCAF11, HNRNPD, PRKAA1, ITGA4, ESR1, ARHGAP25,
HLA-DRB4, IL23A and TAP2. These genes may serve a role in the
pathogenesis of childhood T1D. CISH, SCAF11 and ARHGAP25 possess
potential diagnostic value for children with T1D. However, there
are a number of limitations to the present study. First, the sample
size used for RT-qPCR was small; future studies may utilize a
larger study group. Second, the biological functions of the
identified genes were not investigated. In future, in vivo
and in vitro experiments may be performed to verify the
results of the present study.
Acknowledgements
The authors would like to thank Beijing Yangshen
Bioinformatic Technology (Beijing, China) for their assistance with
data analysis.
Funding
No funding was received.
Availability of data and materials
All data generated or analyzed during this study are
included in this published article.
Authors' contributions
LQ and HS analyzed the data, MD designed the study
and LQ wrote the manuscript. All authors read and approved the
final version of the manuscript.
Ethics approval and consent to
participate
Ethical approval was obtained from the Ethics
Committee of Shandong Jining No. 1 People's Hospital (Jining,
China). Written informed consent was obtained from all
subjects.
Patient consent for publication
Written informed consent was obtained from all
subjects.
Competing interests
The authors declare that they have no competing
interests.
Glossary
Abbreviations
Abbreviations:
|
SOCS
|
CIS/suppressors of cytokine
signaling
|
|
CISH
|
cytokine inducible SH2 containing
protein
|
|
DEGs
|
differentially expressed genes
|
|
ESR1
|
estrogen receptor 1
|
|
GEO
|
gene expression omnibus
|
|
HNRNPD
|
heterogeneous nuclear
ribonucleoprotein D
|
|
ITGA4
|
integrin subunit α4
|
|
IL23A
|
interleukin 23 subunit α
|
|
HLA
|
major histocompatibility complex
|
|
HLA-DRB4
|
major histocompatibility complex,
class II, DR β4
|
|
PRKAA1
|
protein kinase AMP-activated catalytic
subunit α1
|
|
PPI
|
protein-protein interaction
|
|
RT-qPCR
|
quantitative reverse
transcription-polymerase chain reaction
|
|
ARHGAP25
|
Rho GTPase activating protein 25
|
|
SCAF11
|
SR-related CTD associated factor
11
|
|
TFs
|
transcription factors
|
|
TAP2
|
transporter 2, ATP binding cassette
subfamily B member
|
|
T1D
|
type 1 diabetes
|
References
|
1
|
American Diabetes Association, . Diagnosis
and classification of diabetes mellitus. Diabetes Care. 32 (Suppl
1):S62–S69. 2009. View Article : Google Scholar : PubMed/NCBI
|
|
2
|
Chentoufi AA, Binder NR, Berka N, Abunadi
T and Polychronakos C: Advances in type I diabetes associated
tolerance mechanisms. Scand J Immunol. 68:1–11. 2008. View Article : Google Scholar : PubMed/NCBI
|
|
3
|
Dotta F, Censini S, van Halteren AG,
Marselli L, Masini M, Dionisi S, Mosca F, Boggi U, Muda AO, Del
Prato S, et al: Coxsackie B4 virus infection of beta cells and
natural killer cell insulitis in recent-onset type 1 diabetic
patients. Proc Natl Acad Sci USA. 104:5115–5120. 2007. View Article : Google Scholar : PubMed/NCBI
|
|
4
|
Richardson SJ, Willcox A, Bone AJ, Foulis
AK and Morgan NG: The prevalence of enteroviral capsid protein vp1
immunostaining in pancreatic islets in human type 1 diabetes.
Diabetologia. 52:1143–1151. 2009. View Article : Google Scholar : PubMed/NCBI
|
|
5
|
Craig ME, Hattersley A and Donaghue KC:
Definition, epidemiology and classification of diabetes in children
and adolescents. Pediatr Diabetes. 10 (Suppl 12):S3–S12. 2009.
View Article : Google Scholar
|
|
6
|
Dabelea D, Mayer-Davis EJ, Saydah S,
Imperatore G, Linder B, Divers J, Bell R, Badaru A, Talton JW,
Crume T, et al: Prevalence of type 1 and type 2 diabetes among
children and adolescents from 2001 to 2009. JAMA. 311:1778–1786.
2014. View Article : Google Scholar : PubMed/NCBI
|
|
7
|
Aguiree F, Brown A, Cho NH, Dahlquist G,
Dodd S, Dunning T, Hirst M, Hwang C, Magliano D, Patterson C, et
al: IDF Diabetes Atlas. (Sixth). Int Diabetes Fed. 2013.
|
|
8
|
American Diabetes Association: Diagnosis
and classification of diabetes mellitus. Diabetes Care. 33 (Suppl
1):S62–S69. 2010. View Article : Google Scholar : PubMed/NCBI
|
|
9
|
Ritchie ME, Phipson B, Wu D, Hu Y, Law CW,
Shi W and Smyth GK: limma powers differential expression analyses
for RNA-sequencing and microarray studies. Nucleic Acids Res.
43:e472015. View Article : Google Scholar : PubMed/NCBI
|
|
10
|
Marot G, Foulley JL, Mayer CD and
Jaffrézic F: Moderated effect size and P-value combinations for
microarray meta-analyses. Bioinformatics. 25:2692–2699. 2009.
View Article : Google Scholar : PubMed/NCBI
|
|
11
|
Livak KJ and Schmittgen TD: Analysis of
relative gene expression data using real-time quantitative PCR and
the 2(-Delta Delta C(T)) method. Methods. 25:402–408. 2001.
View Article : Google Scholar : PubMed/NCBI
|
|
12
|
Robin X, Turck N, Hainard A, Tiberti N,
Lisacek F, Sanchez JC and Müller M: pROC: An open-source package
for R and S+ to analyze and compare ROC curves. BMC Bioinformatics.
12:772011. View Article : Google Scholar : PubMed/NCBI
|
|
13
|
Chinen T, Komai K, Muto G, Morita R, Inoue
N, Yoshida H, Sekiya T, Yoshida R, Nakamura K, Takayanagi R and
Yoshimura A: Prostaglandin E2 and SOCS1 have a role in intestinal
immune tolerance. Nat Commun. 2:1902011. View Article : Google Scholar : PubMed/NCBI
|
|
14
|
Hiwatashi K, Tamiya T, Hasegawa E, Fukaya
T, Hashimoto M, Kakoi K, Kashiwagi I, Kimura A, Inoue N, Morita R,
et al: Suppression of SOCS3 in macrophages prevents cancer
metastasis by modifying macrophage phase and MCP2/CCL8 induction.
Cancer Lett. 308:172–180. 2011. View Article : Google Scholar : PubMed/NCBI
|
|
15
|
Takahashi R, Nishimoto S, Muto G, Sekiya
T, Tamiya T, Kimura A, Morita R, Asakawa M, Chinen T and Yoshimura
A: SOCS1 is essential for regulatory T cell functions by preventing
loss of Foxp3 expression as well as IFN-{gamma} and IL-17A
production. J Exp Med. 208:2055–2067. 2011. View Article : Google Scholar : PubMed/NCBI
|
|
16
|
Tamiya T, Kashiwagi I, Takahashi R,
Yasukawa H and Yoshimura A: Suppressors of cytokine signaling
(SOCS) proteins and JAK/STAT pathways: Regulation of T-cell
inflammation by SOCS1 and SOCS3. Arterioscler Thromb Vasc Biol.
31:980–985. 2011. View Article : Google Scholar : PubMed/NCBI
|
|
17
|
Matsumoto A, Masuhara M, Mitsui K,
Yokouchi M, Ohtsubo M, Misawa H, Miyajima A and Yoshimura A: CIS, a
cytokine inducible SH2 protein, is a target of the JAK-STAT5
pathway and modulates STAT5 activation. Blood. 89:3148–3154.
1997.PubMed/NCBI
|
|
18
|
Yoshimura A, Ohkubo T, Kiguchi T, Jenkins
NA, Gilbert DJ, Copeland NG, Hara T and Miyajima A: A novel
cytokine-inducible gene CIS encodes an SH2-containing protein that
binds to tyrosine-phosphorylated interleukin 3 and erythropoietin
receptors. EMBO J. 14:2816–2826. 1995. View Article : Google Scholar : PubMed/NCBI
|
|
19
|
Yoshimura A, Naka T and Kubo M: SOCS
proteins, cytokine signalling and immune regulation. Nat Rev
Immunol. 7:454–465. 2007. View
Article : Google Scholar : PubMed/NCBI
|
|
20
|
Delconte RB, Kolesnik TB, Dagley LF,
Rautela J, Shi W, Putz EM, Stannard K, Zhang JG, Teh C, Firth M, et
al: CIS is a potent checkpoint in NK cell-mediated tumor immunity.
Nat Immunol. 17:816–824. 2016. View
Article : Google Scholar : PubMed/NCBI
|
|
21
|
McCormick SM and Heller NM: Regulation of
macrophage, dendritic cell and microglial phenotype and function by
the SOCS proteins. Front Immunol. 6:5492015. View Article : Google Scholar : PubMed/NCBI
|
|
22
|
Tros F, Meirhaeghe A, Hadjadj S, Amouyel
P, Bougneres P and Fradin D: Hypomethylation of the promoter of the
catalytic subunit of protein phosphatase 2A in response to
hyperglycemia. Physiol Rep. 2(pii): e120762014. View Article : Google Scholar : PubMed/NCBI
|
|
23
|
Santangelo C, Scipioni A, Marselli L,
Marchetti P and Dotta F: Suppressor of cytokine signaling gene
expression in human pancreatic islets: Modulation by cytokines. Eur
J Endocrinol. 152:485–489. 2005. View Article : Google Scholar : PubMed/NCBI
|
|
24
|
Malle EK, Zammit NW, Walters SN, Koay YC,
Wu J, Tan BM, Villanueva JE, Brink R, Loudovaris T, Cantley J, et
al: Nuclear factor κB-inducing kinase activation as a mechanism of
pancreatic β cell failure in obesity. J Exp Med. 212:1239–1254.
2015. View Article : Google Scholar : PubMed/NCBI
|
|
25
|
Delunardo F, Conti F, Margutti P,
Alessandri C, Priori R, Siracusano A, Riganò R, Profumo E, Valesini
G, Sorice M and Ortona E: Identification and characterization of
the carboxy-terminal region of Sip-1, a novel autoantigen in
Behçet's disease. Arthritis Res Ther. 8:R712006. View Article : Google Scholar : PubMed/NCBI
|
|
26
|
Moore AE, Chenette DM, Larkin LC and
Schneider RJ: Physiological networks and disease functions of
RNA-binding protein AUF1. Wiley Interdiscip Rev RNA. 5:549–564.
2014. View Article : Google Scholar : PubMed/NCBI
|
|
27
|
Gao X, Dong H, Lin C, Sheng J, Zhang F, Su
J and Xu Z: Reduction of AUF1-mediated follistatin mRNA decay
during glucose starvation protects cells from apoptosis. Nucleic
Acids Res. 42:10720–10730. 2014. View Article : Google Scholar : PubMed/NCBI
|
|
28
|
Gleason CE, Lu D, Witters LA, Newgard CB
and Birnbaum MJ: The role of AMPK and mTOR in nutrient sensing in
pancreatic beta-cells. J Biol Chem. 282:10341–10351. 2007.
View Article : Google Scholar : PubMed/NCBI
|
|
29
|
Maruthur NM, Gribble MO, Bennett WL, Bolen
S, Wilson LM, Balakrishnan P, Sahu A, Bass E, Kao WH and Clark JM:
The pharmacogenetics of type 2 diabetes: A systematic review.
Diabetes Care. 37:876–886. 2014. View Article : Google Scholar : PubMed/NCBI
|
|
30
|
Sun G, Tarasov AI, McGinty J, McDonald A,
da Silva Xavier G, Gorman T, Marley A, French PM, Parker H, Gribble
F, et al: Ablation of AMP-activated protein kinase alpha1 and
alpha2 from mouse pancreatic beta cells and RIP2.Cre neurons
suppresses insulin release in vivo. Diabetologia. 53:924–936. 2010.
View Article : Google Scholar : PubMed/NCBI
|
|
31
|
da Silva Xavier G, Farhan H, Kim H,
Caxaria S, Johnson P, Hughes S, Bugliani M, Marselli L, Marchetti
P, Birzele F, et al: Per-arnt-sim (PAS) domain-containing protein
kinase is downregulated in human islets in type 2 diabetes and
regulates glucagon secretion. Diabetologia. 54:819–827. 2011.
View Article : Google Scholar : PubMed/NCBI
|
|
32
|
Nalls MA, Couper DJ, Tanaka T, van Rooij
FJ, Chen MH, Smith AV, Toniolo D, Zakai NA, Yang Q, Greinacher A,
et al: Multiple loci are associated with white blood cell
phenotypes. PLoS Genet. 7:e10021132011. View Article : Google Scholar : PubMed/NCBI
|
|
33
|
Chu M, Yang P, Hou S, Li F, Chen Y and
Kijlstra A: Behçet's disease exhibits an increased osteopontin
serum level in active stage but no association with osteopontin and
its receptor gene polymorphisms. Hum Immunol. 72:525–529. 2011.
View Article : Google Scholar : PubMed/NCBI
|
|
34
|
Gutierrez-Achury J, Romanos J, Bakker SF,
Kumar V, de Haas EC, Trynka G, Ricaño-Ponce I, Steck A; Type 1
Diabetes Genetics Consortium and Chen WM, ; et al: Contrasting the
genetic background of type 1 diabetes and celiac disease
autoimmunity. Diabetes Care. 38 (Suppl 2):S37–S44. 2015. View Article : Google Scholar : PubMed/NCBI
|
|
35
|
Korn-Lubetzki I, Kahana E, Cooper G and
Abramsky O: Activity of multiple sclerosis during pregnancy and
puerperium. Ann Neurol. 16:229–231. 1984. View Article : Google Scholar : PubMed/NCBI
|
|
36
|
Ito A, Bebo BF Jr, Matejuk A, Zamora A,
Silverman M, Fyfe-Johnson A and Offner H: Estrogen treatment
down-regulates TNF-alpha production and reduces the severity of
experimental autoimmune encephalomyelitis in cytokine knockout
mice. J Immunol. 167:542–552. 2001. View Article : Google Scholar : PubMed/NCBI
|
|
37
|
Bebo BF Jr, Fyfe-Johnson A, Adlard K, Beam
AG, Vandenbark AA and Offner H: Low-dose estrogen therapy
ameliorates experimental autoimmune encephalomyelitis in two
different inbred mouse strains. J Immunol. 166:2080–2089. 2001.
View Article : Google Scholar : PubMed/NCBI
|
|
38
|
Matejuk A, Adlard K, Zamora A, Silverman
M, Vandenbark AA and Offner H: 17 beta-estradiol inhibits cytokine,
chemokine, and chemokine receptor mRNA expression in the central
nervous system of female mice with experimental autoimmune
encephalomyelitis. J Neurosci Res. 65:529–542. 2001. View Article : Google Scholar : PubMed/NCBI
|
|
39
|
Matejuk A, Dwyer J, Zamora A, Vandenbark
AA and Offner H: Evaluation of the effects of 17beta-estradiol
(17beta-e2) on gene expression in experimental autoimmune
encephalomyelitis using DNA microarray. Endocrinology. 143:313–319.
2002. View Article : Google Scholar : PubMed/NCBI
|
|
40
|
Evron S, Brenner T and Abramsky O:
Suppressive effect of pregnancy on the development of experimental
allergic encephalomyelitis in rabbits. Am J Reprod Immunol.
5:109–113. 1984. View Article : Google Scholar : PubMed/NCBI
|
|
41
|
Jansson L, Olsson T and Holmdahl R:
Estrogen induces a potent suppression of experimental autoimmune
encephalomyelitis and collagen-induced arthritis in mice. J
Neuroimmunol. 53:203–207. 1994. View Article : Google Scholar : PubMed/NCBI
|
|
42
|
Ribas V, Nguyen MT, Henstridge DC, Nguyen
AK, Beaven SW, Watt MJ and Hevener AL: Impaired oxidative
metabolism and inflammation are associated with insulin resistance
in ERalpha-deficient mice. Am J Physiol Endocrinol Metab.
298:E304–E319. 2010. View Article : Google Scholar : PubMed/NCBI
|
|
43
|
Ricchiuti V, Lian CG, Oestreicher EM, Tran
L, Stone JR, Yao T, Seely EW, Williams GH and Adler GK: Estradiol
increases angiotensin II type 1 receptor in hearts of
ovariectomized rats. J Endocrinol. 200:75–84. 2009. View Article : Google Scholar : PubMed/NCBI
|
|
44
|
Smith EP, Boyd J, Frank GR, Takahashi H,
Cohen RM, Specker B, Williams TC, Lubahn DB and Korach KS: Estrogen
resistance caused by a mutation in the estrogen-receptor gene in a
man. N Engl J Med. 331:1056–1061. 1994. View Article : Google Scholar : PubMed/NCBI
|
|
45
|
Speer G, Cseh K, Winkler G, Vargha P,
Braun E, Takács I and Lakatos P: Vitamin D and estrogen receptor
gene polymorphisms in type 2 diabetes mellitus and in android type
obesity. Eur J Endocrinol. 144:385–389. 2001. View Article : Google Scholar : PubMed/NCBI
|
|
46
|
Planas R, Carrillo J, Sanchez A, de Villa
MC, Nuñez F, Verdaguer J, James RF, Pujol-Borrell R and Vives-Pi M:
Gene expression profiles for the human pancreas and purified islets
in type 1 diabetes: New findings at clinical onset and in
long-standing diabetes. Clin Exp Immunol. 159:23–44. 2010.
View Article : Google Scholar : PubMed/NCBI
|
|
47
|
Thuault S, Comunale F, Hasna J, Fortier M,
Planchon D, Elarouci N, De Reynies A, Bodin S, Blangy A and
Gauthier-Rouvière C: The RhoE/ROCK/ARHGAP25 signaling pathway
controls cell invasion by inhibition of Rac activity. Mol Biol
Cell. 27:2653–2661. 2016. View Article : Google Scholar : PubMed/NCBI
|
|
48
|
Chifman J, Pullikuth A, Chou JW,
Bedognetti D and Miller LD: Conservation of immune gene signatures
in solid tumors and prognostic implications. BMC Cancer.
16:9112016. View Article : Google Scholar : PubMed/NCBI
|
|
49
|
Hasstedt SJ, Highland HM, Elbein SC, Hanis
CL and Das SK; American Diabetes Association GENNID Study Group, :
Five linkage regions each harbor multiple type 2 diabetes genes in
the African American subset of the GENNID study. J Hum Genet.
58:378–383. 2013. View Article : Google Scholar : PubMed/NCBI
|
|
50
|
Regnell SE and Lernmark Å: Early
prediction of autoimmune (type 1) diabetes. Diabetologia.
60:1370–1381. 2017. View Article : Google Scholar : PubMed/NCBI
|
|
51
|
Lambert AP, Gillespie KM, Thomson G,
Cordell HJ, Todd JA, Gale EA and Bingley PJ: Absolute risk of
childhood-onset type 1 diabetes defined by human leukocyte antigen
class II genotype: A population-based study in the United Kingdom.
J Clin Endocrinol Metab. 89:4037–4043. 2004. View Article : Google Scholar : PubMed/NCBI
|
|
52
|
Veilleux A, Mayeur S, Bérubé JC, Beaulieu
JF, Tremblay E, Hould FS, Bossé Y, Richard D and Levy E: Altered
intestinal functions and increased local inflammation in
insulin-resistant obese subjects: A gene-expression profile
analysis. BMC Gastroenterol. 15:1192015. View Article : Google Scholar : PubMed/NCBI
|
|
53
|
Noble JA, Valdes AM, Cook M, Klitz W,
Thomson G and Erlich HA: The role of HLA class II genes in
insulin-dependent diabetes mellitus: Molecular analysis of 180
Caucasian, multiplex families. Am J Hum Genet. 59:1134–1148.
1996.PubMed/NCBI
|
|
54
|
Zhao LP, Alshiekh S, Zhao M, Carlsson A,
Larsson HE, Forsander G, Ivarsson SA, Ludvigsson J, Kockum I,
Marcus C, et al: Next-generation sequencing reveals that HLA-DRB3,
-DRB4, and -DRB5 may be associated with islet autoantibodies and
risk for childhood type 1 diabetes. Diabetes. 65:710–718. 2016.
View Article : Google Scholar : PubMed/NCBI
|
|
55
|
Vandenbroeck K: Cytokine gene
polymorphisms and human autoimmune disease in the era of
genome-wide association studies. J Interferon Cytokine Res.
32:139–151. 2012. View Article : Google Scholar : PubMed/NCBI
|
|
56
|
Eiris N, González-Lara L, Santos-Juanes J,
Queiro R, Coto E and Coto-Segura P: Genetic variation at IL12B,
IL23R and IL23A is associated with psoriasis severity, psoriatic
arthritis and type 2 diabetes mellitus. J Dermatol Sci. 75:167–172.
2014. View Article : Google Scholar : PubMed/NCBI
|
|
57
|
Evangelista AF, Collares CV, Xavier DJ,
Macedo C, Manoel-Caetano FS, Rassi DM, Foss-Freitas MC, Foss MC,
Sakamoto-Hojo ET, Nguyen C, et al: Integrative analysis of the
transcriptome profiles observed in type 1, type 2 and gestational
diabetes mellitus reveals the role of inflammation. BMC Med
Genomics. 7:282014. View Article : Google Scholar : PubMed/NCBI
|
|
58
|
Torres AR, Westover JB and Rosenspire AJ:
HLA immune function genes in autism. Autism Res Treat.
2012:9590732012.PubMed/NCBI
|
|
59
|
Vejbaesya S, Luangtrakool P, Luangtrakool
K, Sermduangprateep C and Parivisutt L: Analysis of TAP and HLA-DM
polymorphism in thai rheumatoid arthritis. Hum Immunol. 61:309–313.
2000. View Article : Google Scholar : PubMed/NCBI
|
|
60
|
Dai D, Chen Y, Ru P, Zhou X, Tao J, Ye H,
Hong Q, Tang L, Pan G, Lin D, et al: Significant association
between TAP2 polymorphisms and rheumatoid arthritis: A
meta-analysis. Diagn Pathol. 9:1292014. View Article : Google Scholar : PubMed/NCBI
|
|
61
|
Sirota M, Schaub MA, Batzoglou S, Robinson
WH and Butte AJ: Autoimmune disease classification by inverse
association with SNP alleles. PLoS Genet. 5:e10007922009.
View Article : Google Scholar : PubMed/NCBI
|
|
62
|
Kaizer EC, Glaser CL, Chaussabel D,
Banchereau J, Pascual V and White PC: Gene expression in peripheral
blood mononuclear cells from children with diabeters. J Clin
Endocrinol Metab. 92:3705–3711. 2007. View Article : Google Scholar : PubMed/NCBI
|
|
63
|
Irvine KM, Gallego P, An X, Best SE,
Thomas G, Wells C, Harris M, Cotterill A and Thomas R: Peripheral
blood monocyte gene expression profile clinically stratifies
patients with recent-onset type 1 diabetes. Diabetes. 61:1281–1290.
2012. View Article : Google Scholar : PubMed/NCBI
|