Introduction
Lung cancer is characterized by malignant neoplasms
in the lung, with high morbidity and mortality rates worldwide
(1). As a neuroendocrine tumor,
small-cell lung cancer (SCLC) has the characteristics of strong
invasiveness, and high recurrence and mortality rates, accounting
for ~13.6% of lung cancer (2). In
the last few decades, there has been no significant improvement in
the survival rate of patients with SCLC, and patients with SCLC
have no obvious benefit from the current molecular targeted drugs
(3). SCLC resistance to
conventional treatment and its high recurrence rate are primarily
due to its markedly high mutation rate and genomic instability
(4). A previous study revealed
that TP53 and RB transcriptional corepressor 1 (RB1) were the most
frequently mutated genes in SCLC, with mutation frequencies of ~85
and 57%, respectively (5). High
prevalence of mutations in tumor suppressor genes TP53 and RB1,
alterations in chromosome 3p, has been revealed to be significantly
correlated with a poor outcome (6). Mutations leading to dysregulated
expression levels of a number of genes, including PIK3CA, PTEN,
RPTOR independent companion or MTOR complex 2 and mTOR in the
PI3K/AKT/mTOR pathway promote the cell cycle, inhibit apoptosis and
facilitate early metastasis in SCLC (7). Gene amplifications of the MYC family,
SOX2 and fibroblast growth factor receptor 1 were identified in
patients with SCLC (8). Enhancer
of zeste 2 polycomb repressive complex 2 subunit (EZH2)
overexpression was associated with a higher degree of methylation
of the EZH2 promoter, which had a considerable impact on SCLC cell
viability (9).
MicroRNAs (miRNAs/miRs) are endogenous, highly
conserved small RNAs, 20–24 nucleotides in length, which
specifically bind to target mRNA to inhibit post-transcriptional
gene expression. Mature miRNAs, in the miRNP riboprotein complex,
are complementary to the 3′untranslated region of the target gene
to cleave or transfect the target gene mRNA (10,11),
and a single miRNA typically regulates dozens of genes. According
to a previous study, ~50% of the identified miRNAs are located on
the genome at a tumor-associated fragile site, and are associated
with tumor cell proliferation, differentiation and apoptosis
(12). Therefore, miRNAs that are
secreted by tumors can be used as biomarkers for different stages
and different tumor types. The expression level of miR-25 in SCLC
was revealed to be significantly upregulated and act as an
oncogenic regulator by regulating cyclin E2 (13). miR-126 downregulation promoted
overexpression of vascular endothelial growth factor A in lung
cancer cell, thereby regulating angiogenesis (14). miR-17-92 and miR-1519-c directly
interact with hypoxia-inducible factor 1-α, affecting tumor
angiogenesis (15). In the present
study, bioinformatics tools were used to analyze the SCLC
expression profile chips in a public gene chip database, which
provided a theoretical basis for the biological functions of
related genes and their molecular mechanisms that were involved in
the occurrence and development of SCLC.
Materials and methods
Microarray data
Gene chip data were screened using the Gene
Expression Omnibus (GEO; http://www.ncbi.nlm.nih.gov/geo) database, a public
genomic database containing the entire gene expression data, chips
and microarrays. Human SCLC sample gene expression profile public
datasets GSE19945 (https://www.ncbi.nlm.nih.gov/geo/query/acc.cgi) and
GSE6044 (16) were downloaded from
GEO. The GSE19945 dataset, which is a miRNA dataset, contains 43
samples by surgical resection, including 35 SCLC samples and eight
normal lung tissue samples. The expression of miRNA was detected
using the Agilent Human 0.6K miRNA Microarray G4471A platform. The
mRNA GSE6044 dataset, which was analyzed using the GPL201
[HG-Focus] Affymetrix Human HG-Focus Target Array platform,
contained 14 samples by surgical resection, including nine SCLC
samples and five normal lung tissue samples.
Differentially expressed genes (DEGs)
and differentially expressed miRNAs (DEMs)
The raw data of GSE6044 in the CEL file was
effectively processed using the Affy package pair in R, using
correction, normalization and log2 conversion (17). The DEGs in SCLC tissue compared
with normal lung tissue were determined using limma package
(18). DEGs were screened with a
false discovery rate (FDR) corrected P<0.05 and |log fold-change
(FC)|>1. The DEMs in SCLC tissue compared with normal lung
tissue were confirmed using the GEO2R application from GEO. The
false FDR corrected P<0.05 and | log FC|>1 were used as the
screening thresholds.
Functional enrichment analysis of
DEGs
DAVID (https://david.ncifcrf.gov/), a widely used web-based
genomic functional annotation tool, was used for data annotation
analysis (19). In the present
study, DEGs were subjected to molecular function and pathway
studies by Gene Ontology (GO) analysis and Kyoto Encyclopedia of
Genes and Genomes (KEGG) pathway analysis.
Construction of protein-protein
interaction (PPI) networks and module research
The PPI network of the DEGs was constructed using
Cytoscape software (version 3.6.0; www.cytoscape.org) to identify the molecular
mechanisms of key signaling pathways and cellular activities in
SCLC. An interaction score >0.4 was considered to identify the
significant PPIs. Using the Network Analyzer plug-in of Cytoscape
software, the association between the genes was analyzed, according
to network topology characteristics such as the Clustering
coefficient of the network, distribution of node degree and
shortest path (20). Subsequently,
molecular complex detection (MCODE) was used to confirm the hub
genes. The screening thresholds were ‘degree cutoff=2’, ‘node score
cutoff=0.2’, ‘k-core=2’ and ‘max·depth=100’.
miRNA target prediction
miRNAWalk is a bioinformatics platform for
predicting DEM target genes and miRNA-gene pairs. In the present
study, the targets of the DEMs were predicted using eight
databases: miRWalk (21), miRanda
(22), RNA22 (https://cm.jefferson.edu), miRDB (23), TargetScan (http://www.targetscan.org), miRMap (https://mirmap.ezlab.org), miRNAMap (http://mirnamap.mbc.nctu.edu.tw) and PITA
(https://genie.weizmann.ac.il). The
screening criterion was that the miRNA target exists in the eight
databases concurrently. The Venny 2.1 Online Tool (http://bioinfogp.cnb.csic.es) was used to find
overlapping genes between DEGs and predictive genes of DEMs. The
miRNA-gene negative regulatory network was depicted and visualized
using Cytoscape software.
Results
DEGs and DEMs
The data was successfully normalized to ensure the
accuracy of the data. In the GSE6044 dataset, 451 DEGs were
identified in the SCLC samples compared with the normal lung tissue
samples, of which 205 were downregulated and 246 were upregulated.
In total, 20 DEGs with the lowest P-value are presented in Table I. Compared with normal lung tissue
specimens, 134 DEMs were detected in SCLC specimens, of which 86
were downregulated and 49 were upregulated. The 20 DEMs with the
lowest P-value are presented in Table
II.
 | Table I.Top 20 DEGs between SCLC tissues
compared with normal lung tissues. |
Table I.
Top 20 DEGs between SCLC tissues
compared with normal lung tissues.
| Gene name | Adjusted
P-value | Log FC |
|---|
| FABP6 |
1.77×10⁻⁴ | −1.78 |
| IL17RB |
1.77×10⁻⁴ | 1.49 |
| ACAA2 |
1.77×10⁻⁴ | 2.12 |
| CDKN2A |
1.77×10⁻⁴ | 2.33 |
| MARCKSL1 |
2.36×10⁻⁴ | 2.10 |
| TMSB15 |
2.36×10⁻⁴ | 4.6 |
| GSTA1 |
3.14×10⁻⁴ | −4.26 |
| CYP4B1 |
3.14×10⁻⁴ | −3.34 |
| TSPAN8 |
3.14×10⁻⁴ | −2.94 |
| CES1 |
3.14×10⁻⁴ | −2.51 |
| PDLIM4 |
3.14×10⁻⁴ | −1.41 |
| CYP2J2 |
3.14×10⁻⁴ | −1.13 |
| HDAC2 |
3.14×10⁻⁴ | 1.39 |
| ID4 |
3.14×10⁻⁴ | 1.99 |
| SOX4 |
3.14×10⁻⁴ | 2.24 |
| MCM6 |
3.14×10⁻⁴ | 2.32 |
| TOP2A |
3.14×10⁻⁴ | 2.75 |
| TYMS |
3.14×10⁻⁴ | 2.88 |
| MEST |
3.14×10⁻⁴ | 3.78 |
| UCHL1 |
3.37×10⁻⁴ | 3.08 |
| Table II.Top 20 DEMs between SCLC tissues
compared with normal lung tissues. |
Table II.
Top 20 DEMs between SCLC tissues
compared with normal lung tissues.
| miRNAs | Adjusted
P-value | Log FC |
|---|
| hsa-miR-96 |
1.31×10⁻¹² | 3.82 |
| hsa-miR-126 |
1.67×10⁻¹² | −3.77 |
| hsa-miR-183 |
7.50×10⁻¹² | 4.58 |
| hsa-miR-182 |
2.27×10⁻¹¹ | 3.72 |
| hsa-miR-638 |
3.72×10⁻¹¹ | −2.93 |
| hsa-miR-1 |
9.33×10⁻¹¹ | −4.64 |
| hsa-miR-130b |
1.85×10⁻¹⁰ | 4.21 |
| hsa-miR-451 |
3.25×10⁻⁹ | −4.22 |
| hsa-miR-144 |
5.12×10⁻⁹ | −4.61 |
| hsa-miR-145 |
6.85×10⁻⁹ | −3.88 |
| hsa-miR-26a |
7.48×10⁻⁹ | −1.82 |
| hsa-miR-486-5p |
2.16×10⁻⁸ | −4.04 |
| hsa-miR-301b |
2.16×10⁻⁸ | 3.91 |
| hsa-miR-26b |
2.18×10⁻⁸ | −1.92 |
| hsa-miR-338-3p |
2.66×10⁻⁸ | −3.79 |
| hsa-miR-140-3p |
3.19×10⁻⁸ | −2.40 |
| hsa-miR-140-5p |
3.25×10⁻⁸ | −1.99 |
| hsa-miR-18a |
3.25×10⁻⁸ | 3.35 |
| hsa-miR-498 |
4.75×10⁻⁸ | −2.22 |
| hsa-miR-7 |
4.75×10⁻⁸ | 5.08 |
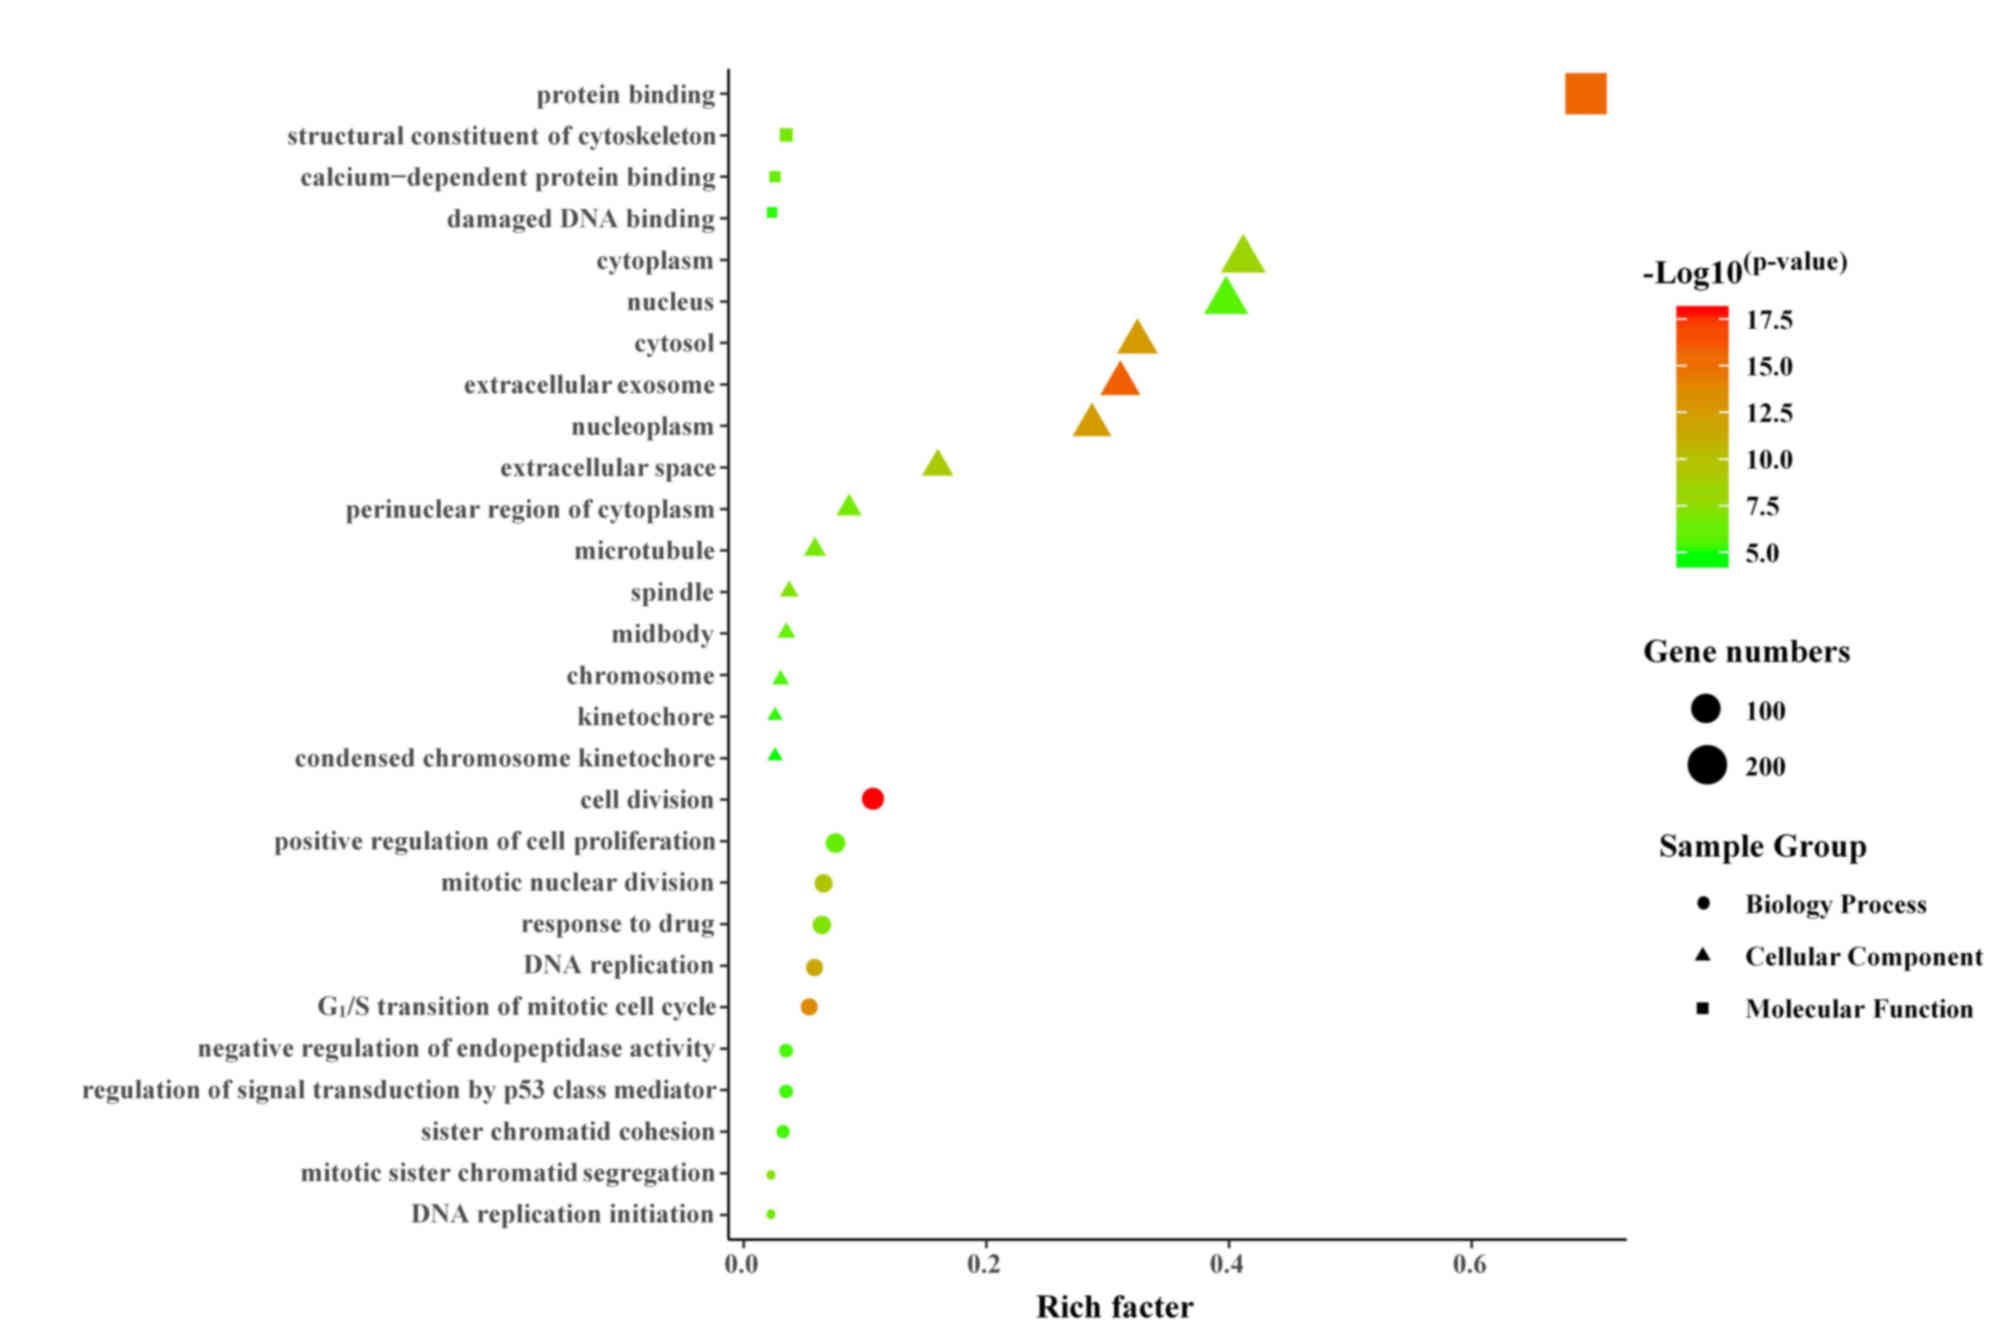
GO analysis of DEGs
The biological classification of the DEGs was
analyzed utilizing the functional enrichment analysis of the DAVID
website. The GO functional enrichment resulted in a total of 421
DEGs mapped to 403 GO terms. With the FDR corrected P<0.05 as
the significant enrichment criterion, 28 significant enriched
functional clusters were screened (Fig. 1). In total, 46.43% (13) GO terms were significantly enriched
in cellular components, mainly involving nuclear components,
including ‘nucleus’, ‘nucleoplasm’, ‘spindle’, ‘chromosome’ and
‘kinetochore’. Enrichment of 11 GO terms, such as ‘G1/S
transition of mitotic cell cycle’, ‘cell division’, ‘mitotic
nuclear division’, ‘DNA replication’, ‘mitotic sister chromatid
segregation’, ‘sister chromatid cohesion’, ‘positive regulation of
cell proliferation’ and ‘DNA replication initiation’, belonged to
biological processes. A total of four molecular functions were
enriched, mainly involving binding-related terms, such as ‘protein
binding’, ‘calcium-dependent protein binding’ and ‘damaged DNA
binding’.
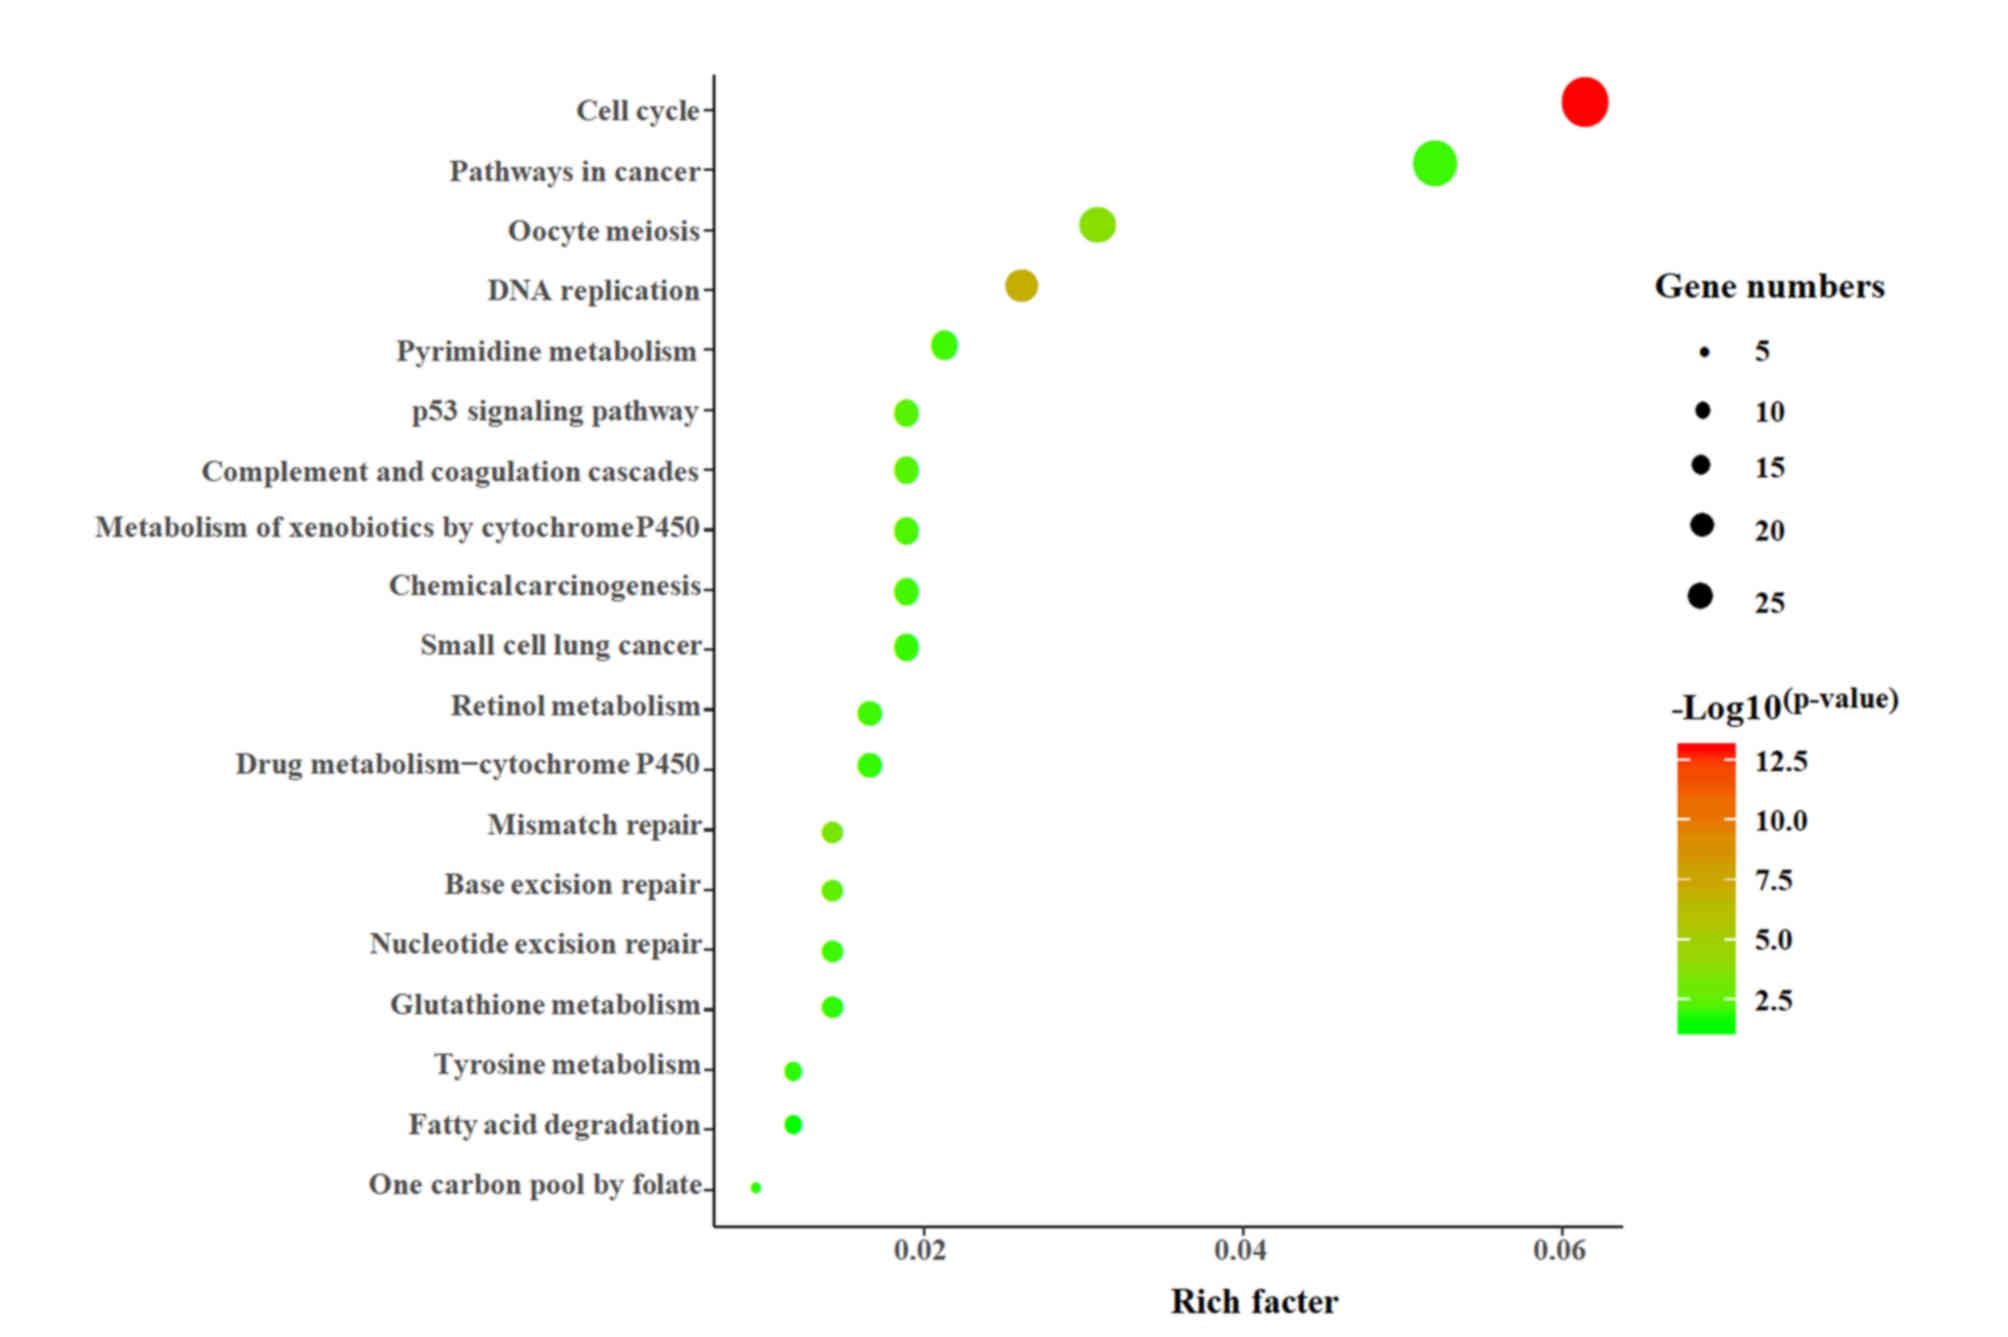
Pathway analysis of DEGs
The present study used the DAVID online tool to
perform KEGG enrichment analysis on 451 DEGs. A total of 227 DEGs
were mapped into the KEGG database, and P<0.05 was used as an
enrichment screening standard. In total, 19 enriched functional
clusters of the DEGs were obtained (Fig. 2), including ‘cell cycle’ (26
genes), ‘pathways in cancer’ (22 genes), ‘oocyte meiosis’ (13
genes), ‘DNA replication’ (11 genes), ‘p53 signaling pathway’,
‘chemical carcinogenesis’, ‘drug metabolism-cytochrome p450’ and
‘mismatch repair’.
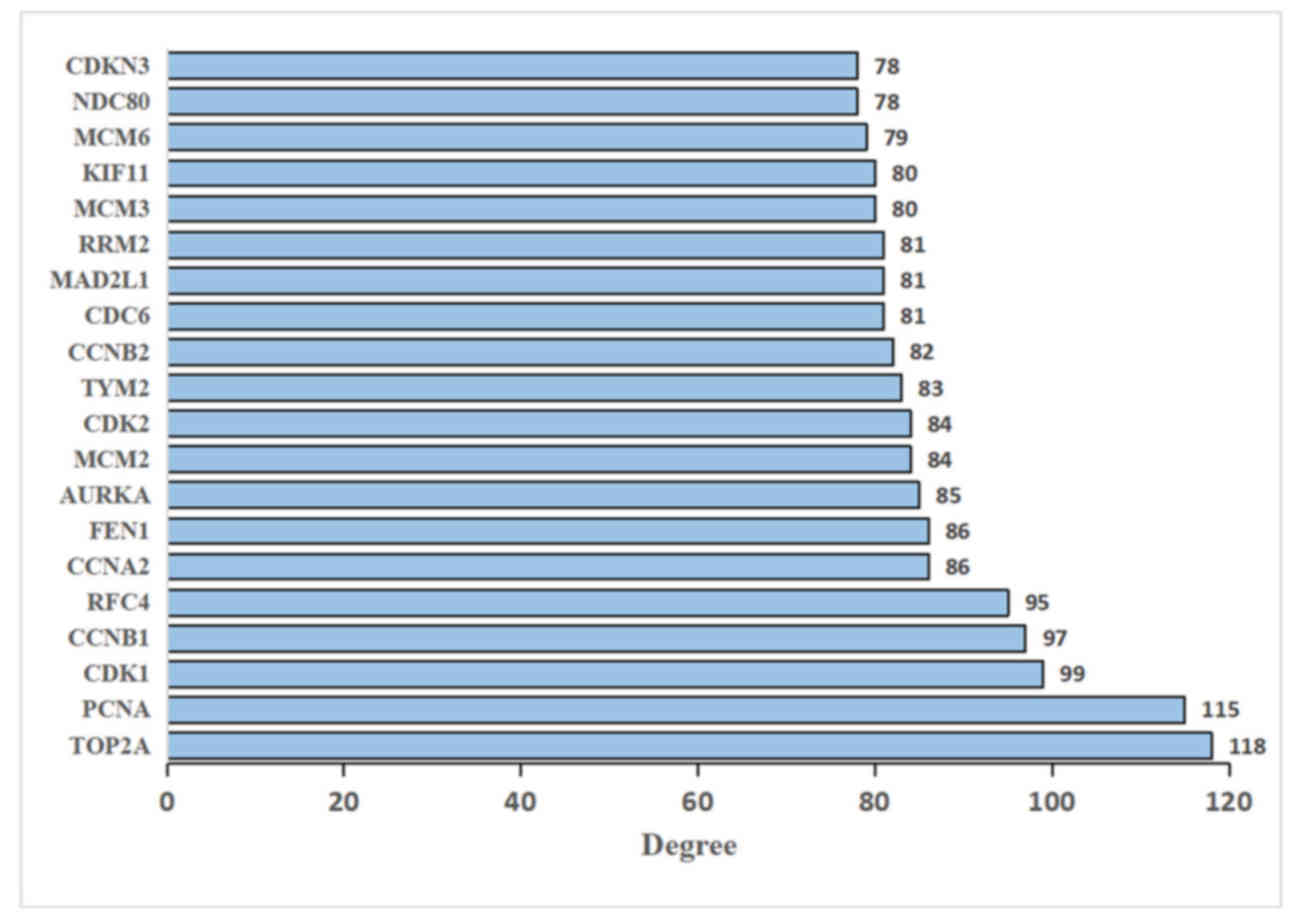
Construction of PPI networks
The visual PPI network of 451 DEGs was constructed
using Cytoscape software. The isolated nodes and partially loosely
connected gene nodes were removed, and the remaining DEGs together
constituted a complex multi-center interaction network map to
examine the association between DEGs, which contained 425 nodes and
3,770 edges. Among the 425 nodes, 10 DEGs with the highest degree
of nodes were screened based on the Cytoscape software analysis
results (Fig. 3). The results were
as follows: DNA topoisomerase II α (TOP2A), proliferating cell
nuclear antigen (PCNA), CDK1, cyclin B1 (CCNB1), replication factor
C subunit 4 (RFC4), cyclin A2 (CCNA2), flap structure-specific
endonuclease 1 (FEN1), aurora kinase A (AURKA), minichromosome
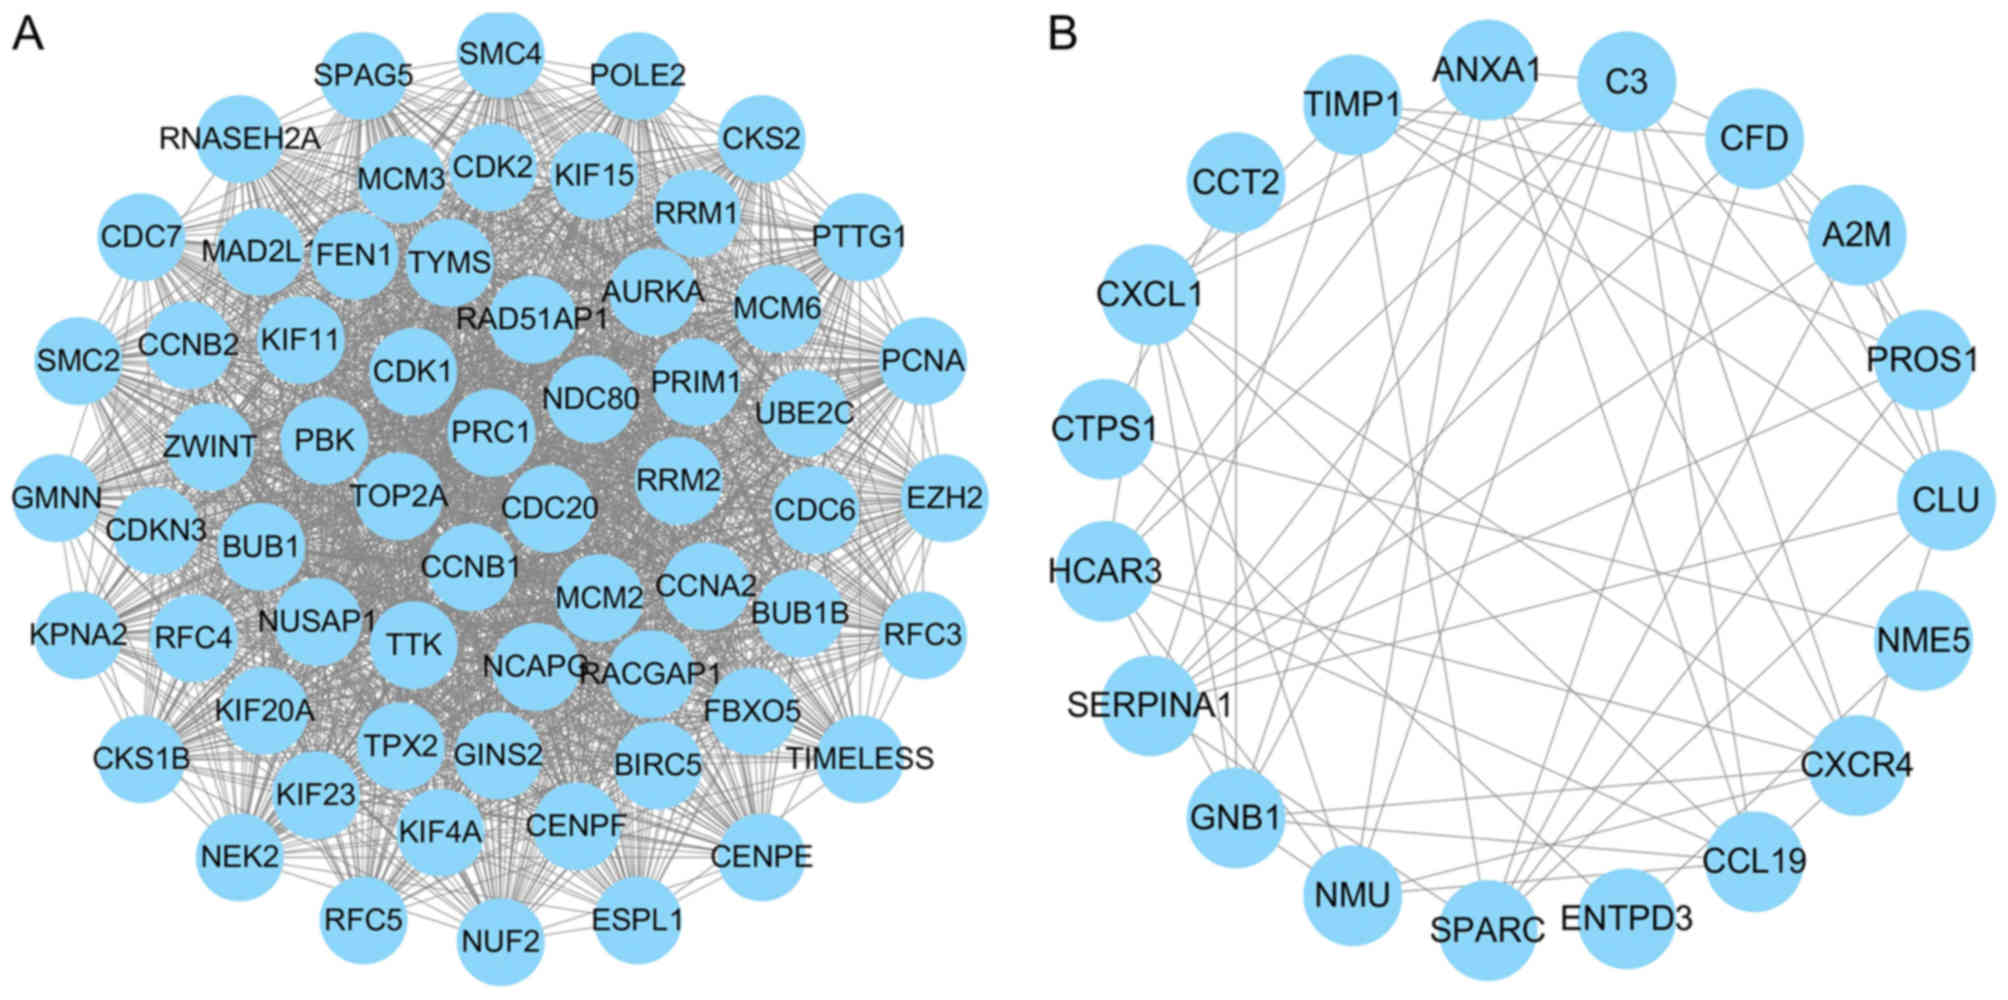
maintenance complex component 2 (MCM2) and CDK2. The key modules
were obtained using MCODE, with 95 hub genes with a genomic degree
≥5. The two key modules with the highest degree were screened, and
the functional and pathway enrichment of genes in these two modules
was analyzed using DAVID online tools (Fig. 4A and B). Module 1 contained 62
nodes and 1,753 edges, mainly involved in ‘cell cycle’, ‘DNA
replication’ and ‘οocyte meiosis’. Module 2 was comprised of 19
nodes and 59 edges, which were associated with ‘complement and
coagulation cascades’, ‘chemokine signaling pathway’ and
‘pyrimidine metabolism’ (Table
III).
| Table III.KEGG analysis of module 1 and module
2. |
Table III.
KEGG analysis of module 1 and module
2.
| Category | Term | P-value | Count | Genes |
|---|
| Module 1 | hsa04110: Cell
cycle |
2.48×10⁻²¹ | 18 | CDC7, CDC6, CDK1,
TTK, CDC20, ESPL1, PTTG1, MCM2, MCM3, CDK2, MCM6, CCNB1, MAD2L1,
CCNB2, BUB1, PCNA, BUB1B, CCNA2 |
|
| hsa03030: DNA
replication |
6.53×10⁻¹⁶ | 11 | RFC5, PRIM1, RFC3,
RFC4, POLE2, PCNA, MCM2, MCM3, RNASEH2A, FEN1, MCM6 |
|
| hsa04114: Oocyte
meiosis |
1.04×10⁻¹⁰ | 11 | CCNB1, CDK1,
MAD2L1, CCNB2, BUB1, FBXO5, AURKA, CDC20, ESPL1, PTTG1, CDK2 |
|
| hsa04914:
Progesterone-mediated oocyte maturation |
4.16×10⁻⁶ | 7 | CCNB1, CDK1,
MAD2L1, CCNB2, BUB1, CCNA2, CDK2 |
|
| hsa03420:
Nucleotide excision repair |
8.58×10⁻⁵ | 5 | RFC5, RFC3, RFC4,
POLE2, PCNA |
|
| hsa03430: Mismatch
repair |
1.99×10⁻⁴ | 4 | RFC5, RFC3, RFC4,
PCNA |
|
| hsa04115: p53
signaling pathway |
3.43×10⁻⁴ | 5 | CCNB1, CDK1, CCNB2,
RRM2, CDK2 |
|
| hsa00240:
Pyrimidine metabolism |
1.62×10⁻³ | 5 | PRIM1, TYMS, POLE2,
RRM2, RRM1 |
|
| hsa03410: Base
excision repair |
1.20×10⁻² | 3 | POLE2, PCNA,
FEN1 |
| Module 2 | hsa04610:
Complement and coagulation cascades |
6.19×10⁻⁴ | 5 | A2M, C3, SERPINA1,
CFD, PROS1 |
|
| hsa04062: Chemokine
signaling pathway |
4.55×10⁻³ | 4 | CXCL1, CXCR4, GNB1,
CCL19 |
|
| hsa00240:
Pyrimidine metabolism |
1.50×10⁻² | 3 | NME5, CTPS1,
ENTPD3 |
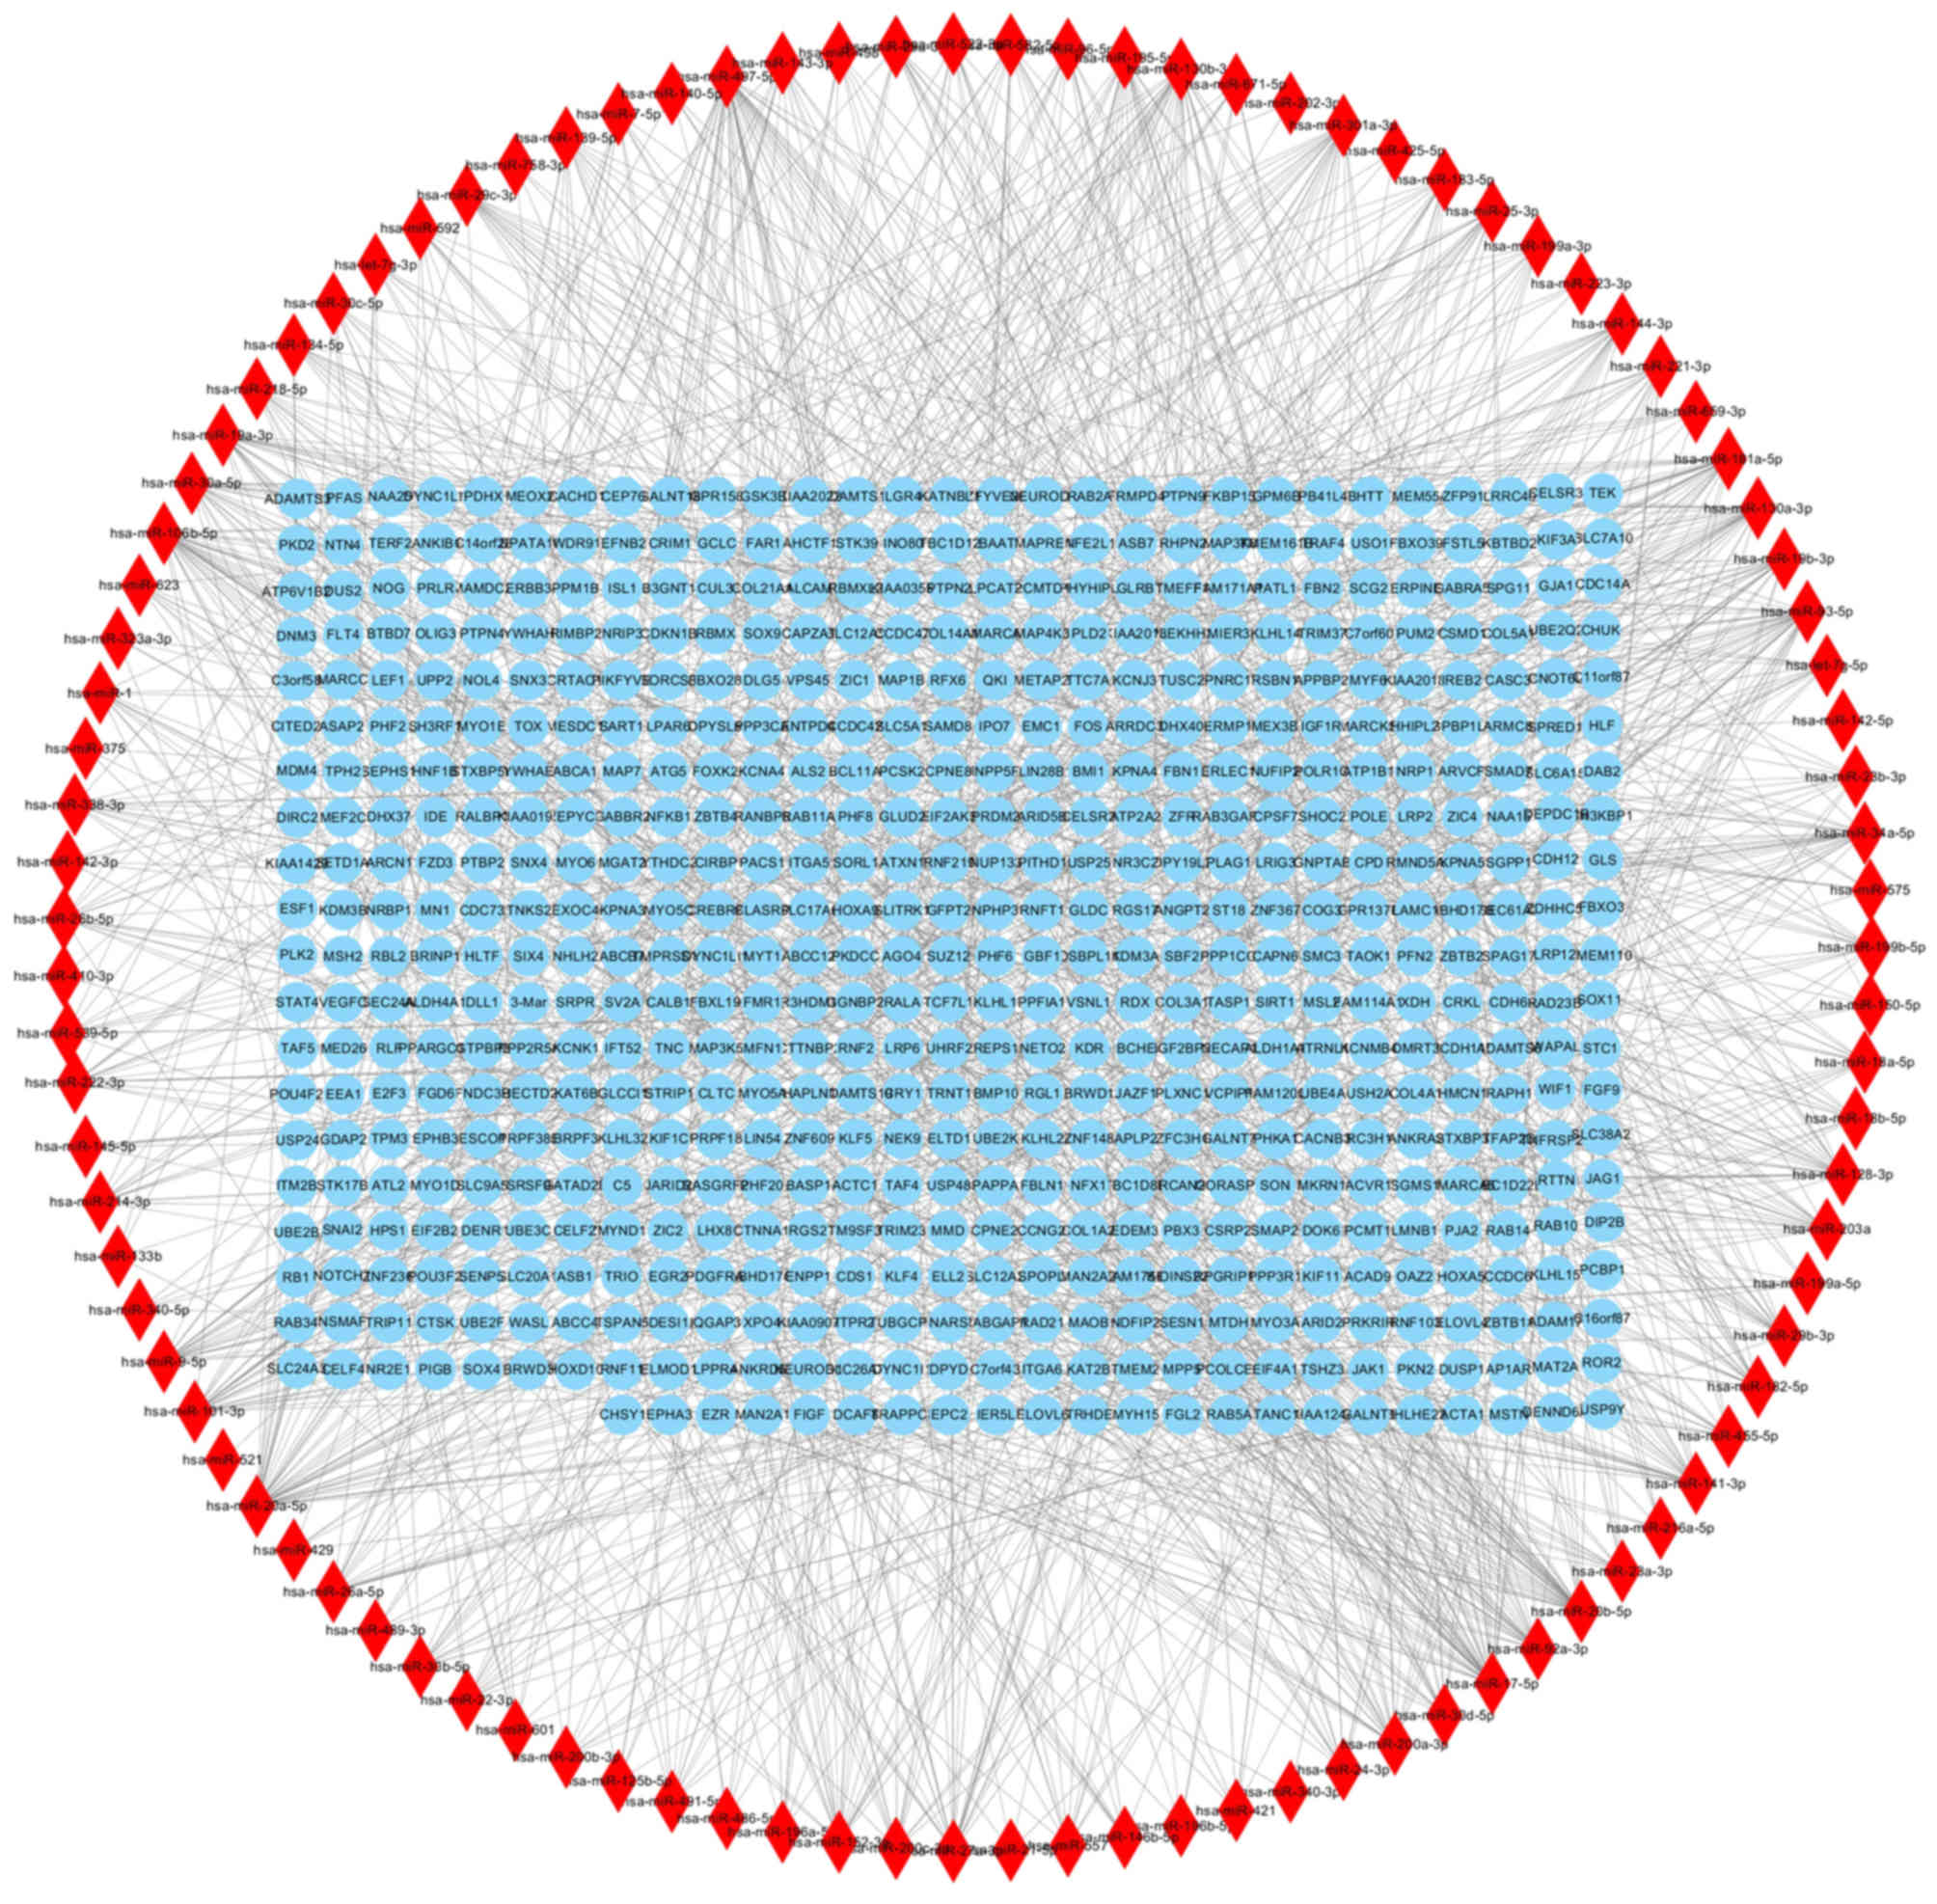
miRNA-gene regulatory network
The miRNAWalk platform identified 1,402 miRNA-gene
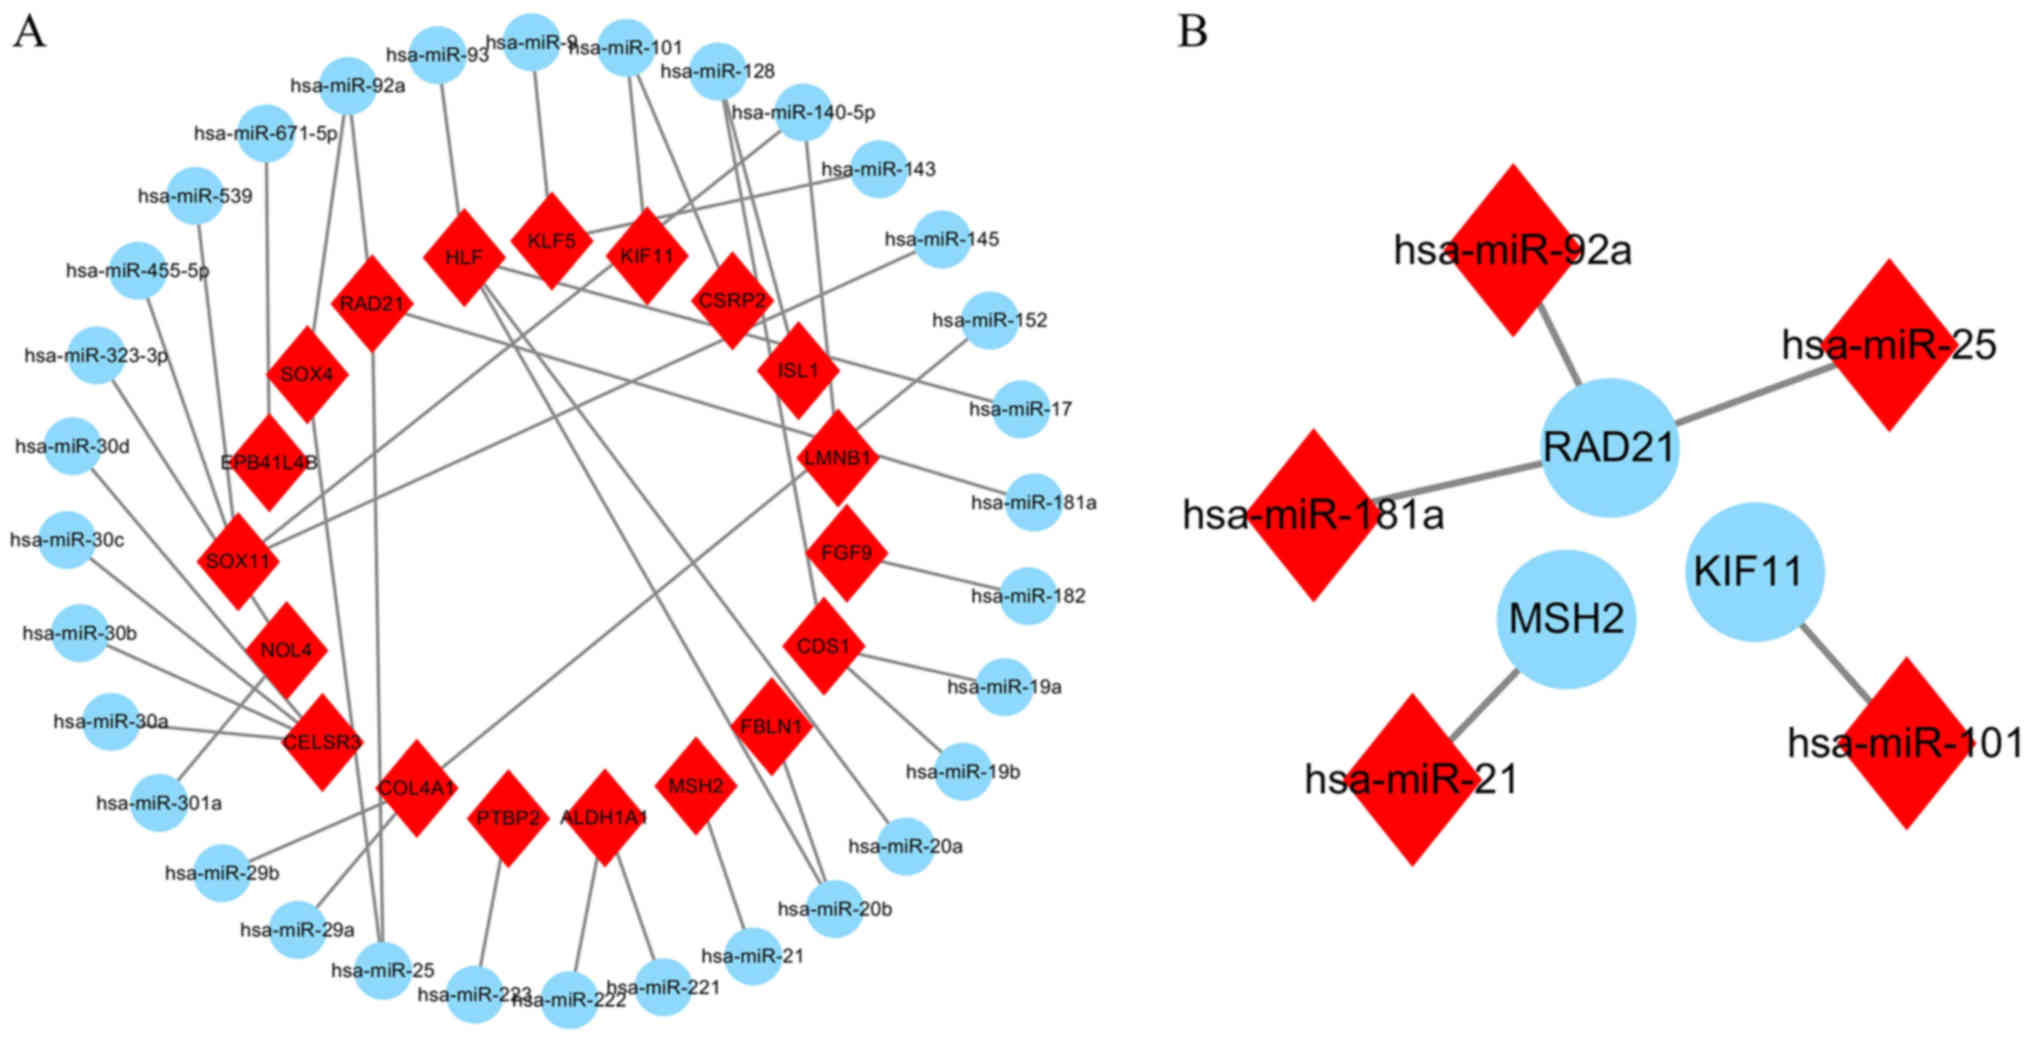
regulatory pairs containing 602 target genes of the DEMs (Fig. 5). There were 19 overlapping genes
between target genes of the DEMs and DEGs. As presented in Fig. 6A, a total of 19 overlapping genes
[lamin B1 (LMNB1), SOX11, fibroblast growth factor 9 (FGF9),
Kruppel like factor 5 (KLF5), polypyrimidine tract binding protein
2 (PTBP2), collagen type IV α 1 chain (COL4A1), nucleolar protein 4
(NOL4), cadherin EGF LAG seven-pass G-type receptor 3 (CELSR3), HLF
transcription factor (HLF), PAR bZIP family member, kinesin family
member 11 (KIF11), cysteine and glycine rich protein 2 (CSRP2),
CDP-diacylglycerol synthase 1 (CDS1), aldehyde dehydrogenase 1
family member A1 (ALDH1A1), ISL LIM homebox 1 (ISL1), RAD21 cohesin
complex component (RAD21), SOX4, erythrocyte membrane protein band
4.1 like 4B (EPB41L4B), fibulin 1 (FBLN1) and mutS homolog 2
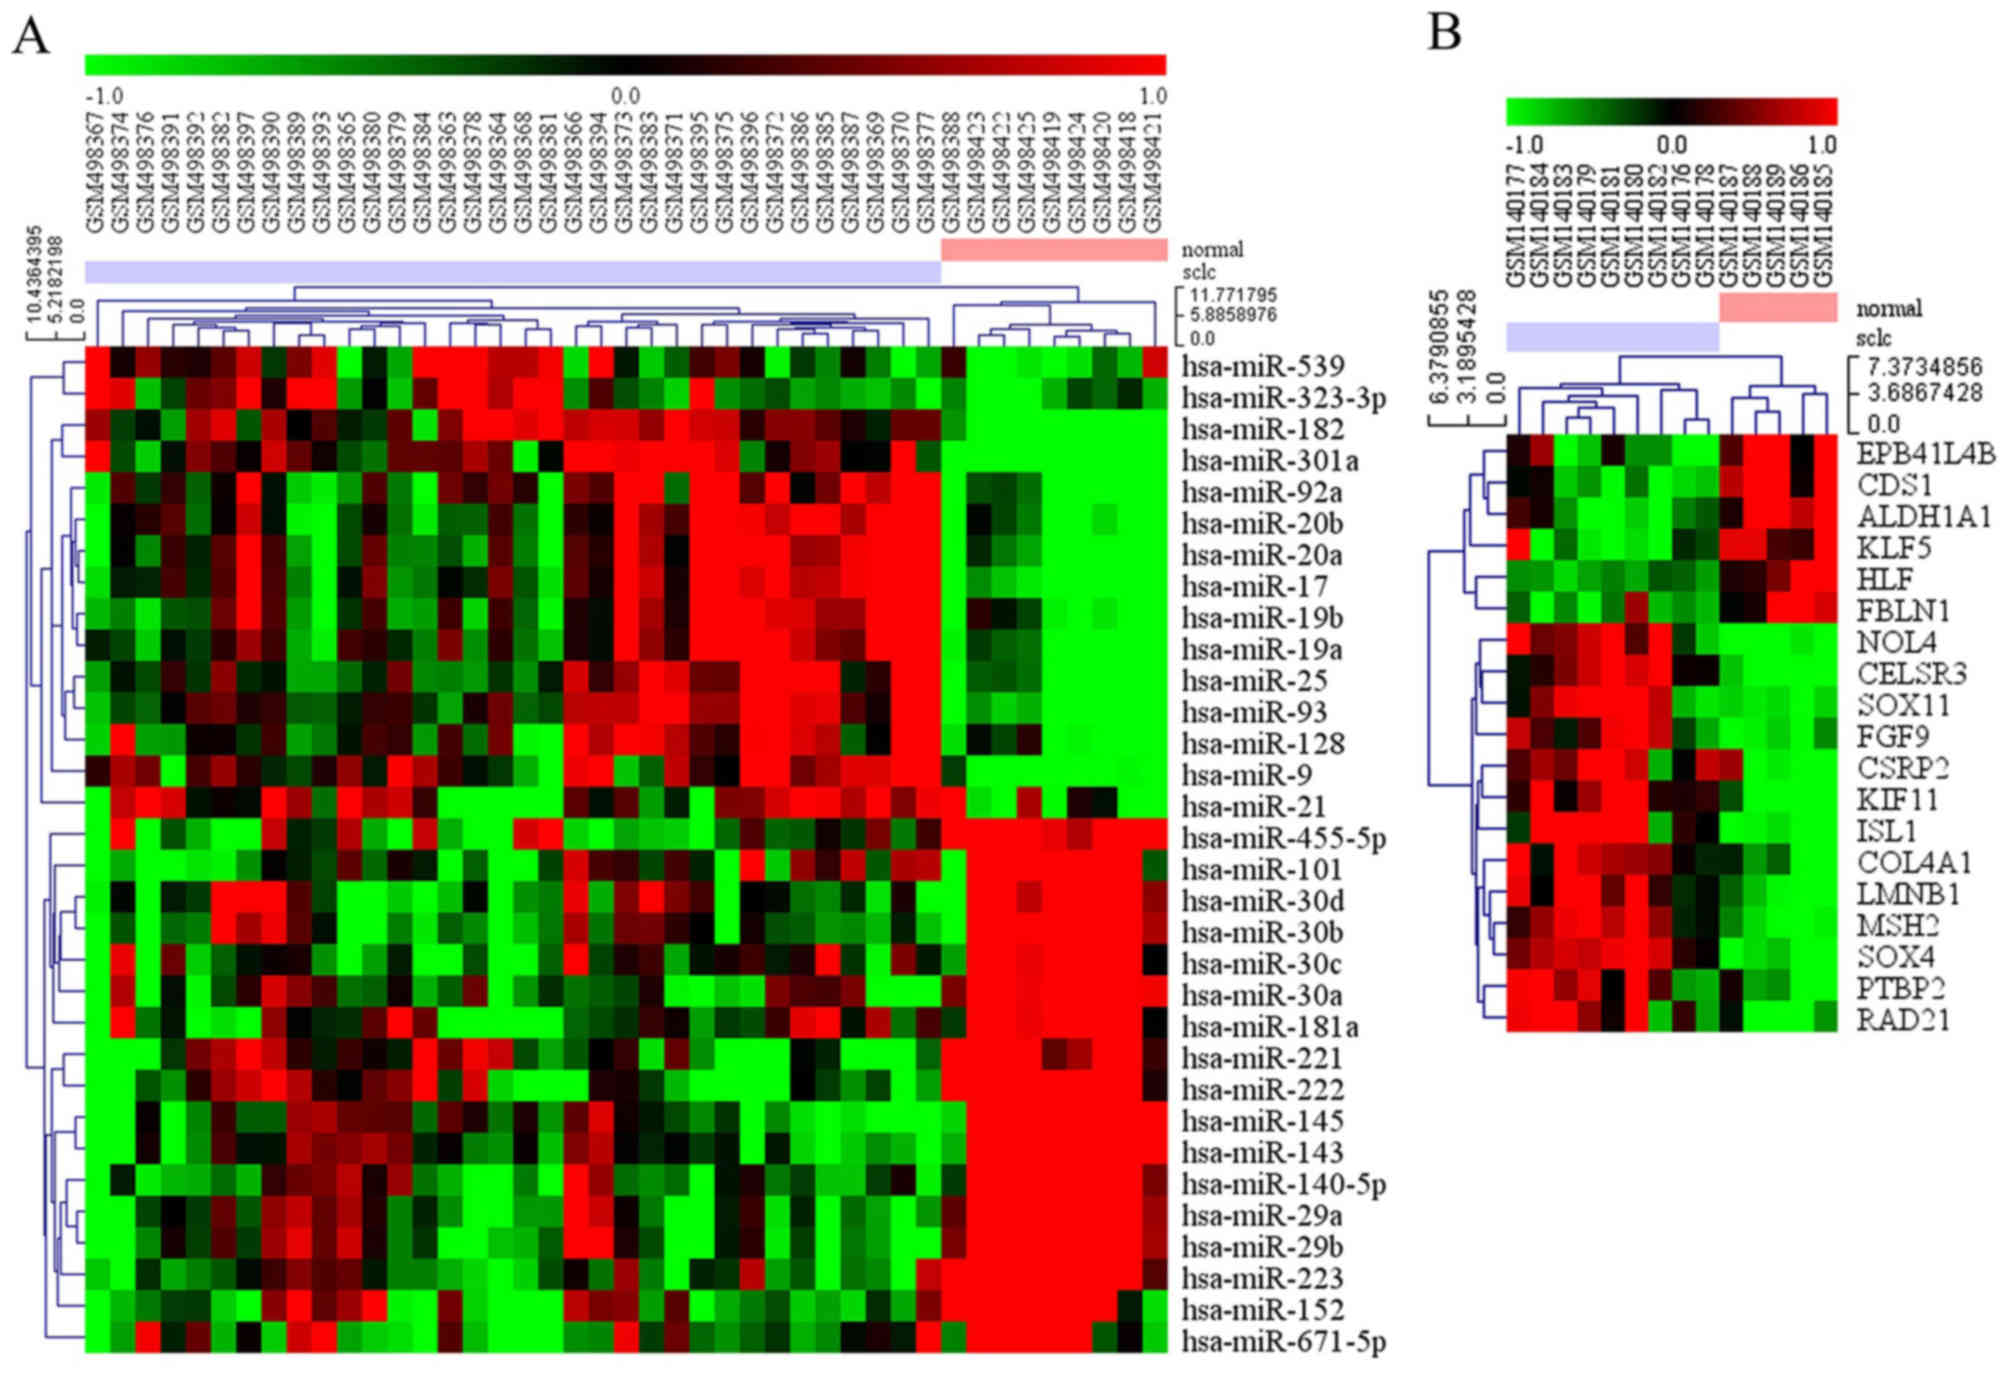
(MSH2)] were regulated by 32 different miRNAs. The 19 significantly
upregulated or downregulated genes and 32 DEMs are presented in a
heat-map (Fig. 7A and B). In
addition, three target genes (KIF11, MSH2 and RAD21) of the 19
overlapping genes belonged to the hub genes of GSE6044 and were
regulated by five different miRNAs (miR-101, miR-21, miR-92a,
miR-181a and miR-25; Figs. 6B and
8).
Discussion
SCLC is characterized by high malignancy and early
extensive metastasis. The survival time of patients with extensive
disease is only 8–13 months and the 2-year survival rate is ~5%
(24). Most patients are diagnosed
with distant metastasis, which is often accompanied by poor
prognosis (25), and the
pathogenesis of SCLC at the molecular level is not clear.
Therefore, there is an urgent need to identify more effective
biomarkers for diagnosis and treatment. Microarray technology is
useful in studying the changes in transcription and epigenetics of
SCLC genes, which is an effective approach for identifying disease
biomarkers. In addition, miRNAs affect the occurrence, metastasis
and recurrence of SCLC by upregulating or downregulating gene
expression levels. In the present study, bioinformatics technology
was used to study the DEGs and DEMs of SCLC, and the miRNA-gene
regulatory network was constructed using a software platform to
examine the molecular pathological mechanisms of SCLC.
In the present study, 451 DEGs were identified from
the GSE6044 dataset and subsequent bioinformatics analysis was
conducted. The results of the KEGG and GO enrichment analysis of
the DEGs revealed that the genes enriched in a number of signaling
pathways, such as ‘p53 signaling pathway’, ‘cell cycle’, ‘DNA
replication’, and ‘oocyte meiosis’ were mostly overexpressed, but
the expression levels of genes aggregated in ‘nucleotide excision
repair’, ‘mismatch repair’ and ‘base excision repair’ were mostly
downregulated. p53 is a tumor suppressor gene that is activated
during cell stress (including hypoxia, carcinogenesis and oxidative
stress), inhibiting cell cycle progression and activating DNA
repair mechanisms to promote cell survival and maintain genomic
integrity (26). The aberrant
expression of p53 in SCLC leads to the activation of related
signaling pathways, accompanied by the activation of downstream
genes, such as p21, MDM2, CKD1 and PCNA, which promotes
proliferation and inhibits apoptosis of cancer cells (5). A significant marker of malignant
tumors is the loss of control of the normal cell cycle. Tumor cells
with a number of alterations lead to genomic instability and
unscheduled proliferation (27).
Notably, the loss or overexpression of kinases during cell mitosis
leads to uncontrolled cell proliferation and carcinogenesis
(28). Abnormal expression or
methylation of key genes, including 8-oxoguanine DNA glycosylase,
ERCC excision repair 3, TFIIH core complex helicase subunit, AGT
and ATM, in classical DNA repair pathways, such as nucleotide
excision repair and mismatch repair, will result in loss of the
ability to repair DNA damage caused by exogenous or endogenous gene
toxicants, leading to tumorigenesis or drug resistance (29,30).
Furthermore, other enriched functional clusters contained
complement and coagulation cascades, drug metabolism-cytochrome
P450, glutathione metabolism and chemical carcinogenesis. The
significance of complement cascade in malignant tumors has not been
fully elucidated, however some researchers hypothesize that the
complement cascade and its activation products can secrete growth
factors required for survival of cancer cells (8,31),
and are also recruiters and inducers of immunosuppressive cells,
which can produce reactive oxygen species, reactive nitrogen and
other immunosuppressive molecules to help cancer cells escape the
attack of the epidemic system (32). In addition, inhibiting the
complement cascade and blocking programmed cell death 1 can delay
the progression of lung cancer models (33). In the present study, 10 core
network nodes were screened from the PPI network, which are
considered the key genes for the occurrence and development of
SCLC. For example, TOP2A is one of genes with the most nodes, and
it is a subfamily of DNA topoisomerase II, which controls and
changes the topological state of DNA during transcription. A
previous study has shown that TOP2A is overexpressed in SCLC
(34). The lower the
differentiation degree of tumors, the higher the expression level
of TOP2A (35).
In the present study, microarray analysis revealed
that the occurrence mechanism of SCLC may be related to the
expression of miRNA. Through the analysis of GSE19945 data, 86 were
downregulated and 49 were upregulated, in which miR-1290 was the
highest and miR-1 was the most significantly regulated. miR-1290
and miR-1 are abnormally expressed in a variety of malignancies;
mir-1290 promoted the progression of non-small cell lung cancer by
inhibiting MT1G (36), but there
have only been a few studies on their role in SCLC. Subsequently,
the integration analysis of the miRNA-gene regulatory pairs and
DEGs revealed that there are 19 overlapping genes regulated by 32
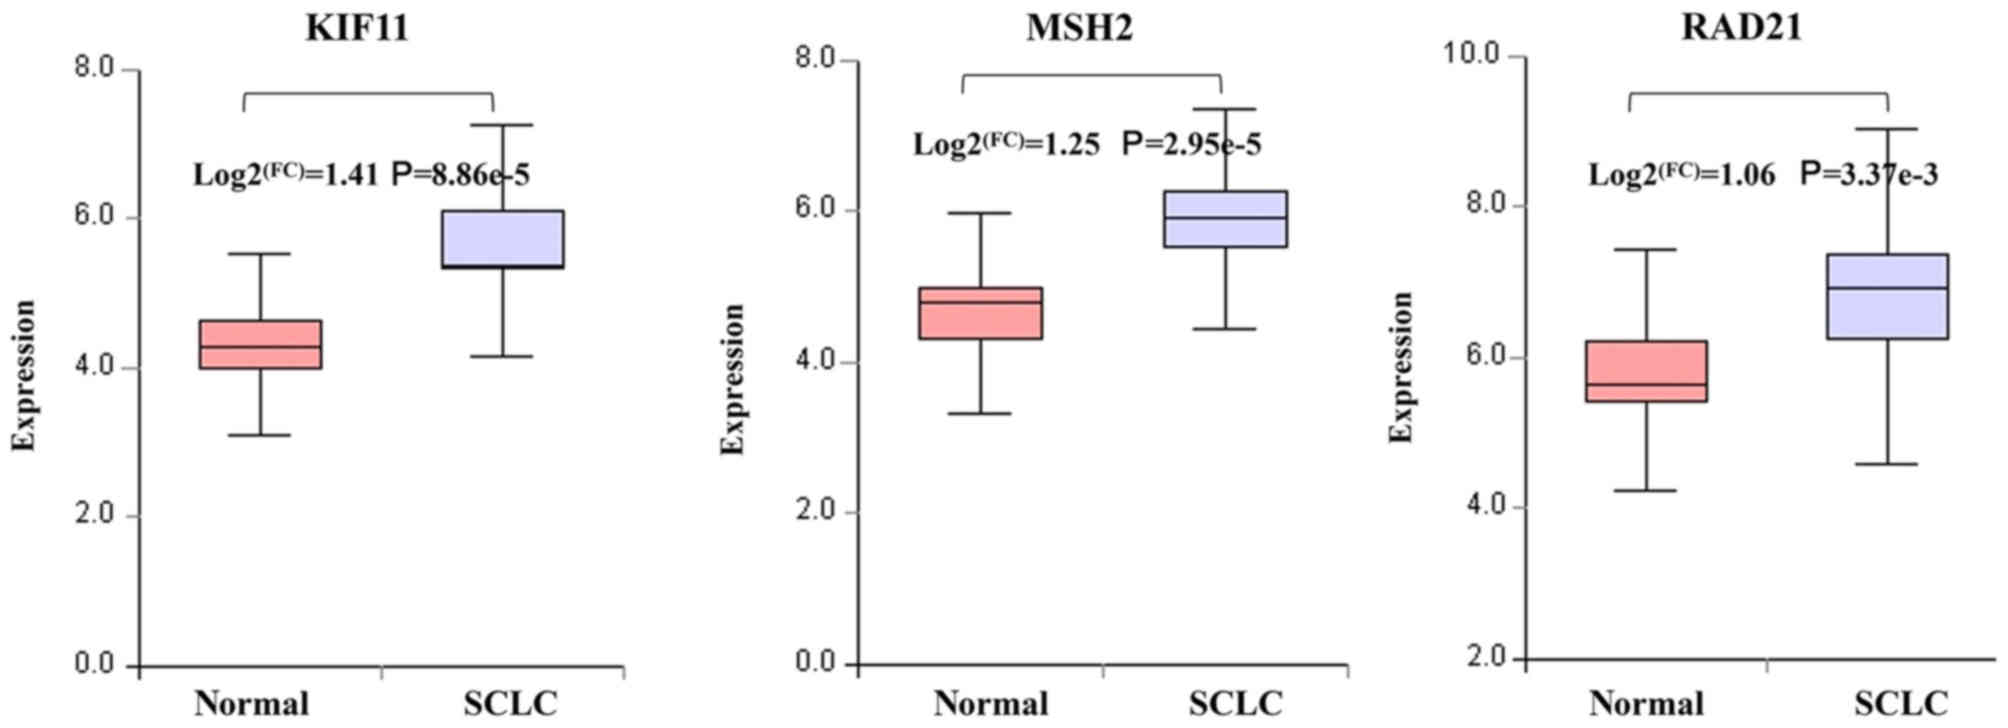
different miRNAs. Further analysis revealed that three target genes
(KIF11, MSH2 and RAD21) belong to the hub genes of GSE6044 and are
regulated by five different miRNAs (miR-101, miR-21, miR-92a,
miR-181a and miR-25). Among them, KIF11 (degree=75), MSH2
(degree=61) and RAD21 (degree=42) exhibited the highest degree,
indicating that these three genes may play a core role in SCLC. The
present study demonstrated that the decreased expression of miR-101
may lead to the upregulation of KIF11. As a tumor suppressor in
malignant tumors, miR-101 has been revealed to be downregulated in
various malignant tumors, such as lung, colon and breast cancer
(37). A basic study revealed that
miR-101 could directly inhibit the overexpression of EZH2 in lung
cancer cells, and cooperate with paclitaxel to induce apoptosis,
and inhibit invasion and cell proliferation (38). In addition, a meta-analysis of
2,088 tumor patients revealed that the low expression of miR-101
predicted poor overall survival and could be used as a predictive
indicator for clinicopathological features (39). KIF11, also known as Eg5, is a
homotetramer of BimC in kinesin family 5, whose overexpression
leads to spindle defects and genetic instability, affecting cell
division and proliferation, and is associated with tumor invasion,
metastasis, recurrence and prognosis (40,41).
In the present study, MSH2 was predicted to be a
target of miR-21, which was upregulated in SCLC, according to the
GSE6044 and GSE19945 datasets. The higher the malignant degree of
tumors, the higher the expression level of miR-21, which is
considered a potential marker for SCLC (42,43).
miR-21 interacts with TLR (Toll-like receptor) family members to
stimulate TLR-mediated pro-inflammatory responses leading to tumor
growth and metastasis (44).
Anti-miRNA-21-5p (AM21), consists of one tertiary amine, one
quaternary amine and two tertiary lipids, and has been used to
intervene in mouse lung cancer models. AM21 can prolong survival
and slows tumor growth in mice with lung cancer (45). As an upstream factor, miR-21 can
regulate the expression of MSH2. It was observed that MSH2 was
highly expressed in SCLC, which was similar to a study by Fujii
et al (46). Levallet et
al (47) studied the
expression of MSH2 in 681 cases of early lung cancer. The results
revealed that high expression of MSH2 had poor prognosis and short
survival time. The expression level of RAD21 is regulated by
miR-92a, miR-181a and miR-25. RAD21 not only maintains sister
chromatid binding and ensures correct replication, but also
participates in DNA double strand break repair and meiotic
recombination (48,49). RAD21 is aberrantly expressed in
various neoplasms such as breast, lung and rectal cancer, and
serves a role in tumor development, prognosis and treatment
(50–52). Similar to previous studies, the
present results also indicated that miR-92a is overexpressed in
SCLC. Highly expressed miR-92a enhances drug resistance and reduces
survival of SCLC, and is thus considered a predictive biomarker for
drug resistance and survival prognosis (53). miR-181a induces macrophage
transformation into an M2 phenotype, which promotes
macrophage-associated tumor cell metastasis by targeting KLF6 and
C/EBPα (54). miR-25 has been
revealed to be associated with cell proliferation and invasiveness
in SCLC cell lines (13).
In conclusion, the present study analyzed gene and
miRNA expression between lung cancer tissues and normal lung
tissues using SCLC transcription sequencing data and non-coding RNA
data from the GEO database, and identified aberrant expression of
mRNAs and miRNAs in SCLC. Using bioinformatics analysis, the
signaling pathways of aberrantly expressed gene enrichment were
identified, and it was demonstrated that hub genes, such as KIF11,
MSH2 and RAD21, are regulated by miRNAs. These genes are predicted
to be biomarkers for the diagnosis, prognosis and therapeutic
response prediction of SCLC. However, further research is required
to verify the results.
Acknowledgements
Not applicable.
Funding
The present study was supported by the Natural
Science Foundation of China (grant no. 81573915).
Availability of data and materials
All data generated or analyzed during this study are
included in this published article.
Authors' contributions
YM, PX and SZ conceived and designed the present
study, and wrote the manuscript. YM and PX contributed equally to
this work. LL and PPX performed the data analysis. YC, XC and PJ
collected the data. SZ reviewed the paper for intellectual content.
All authors read and approved the final manuscript and agree to be
accountable for all aspects of the work in ensuring that questions
related to the accuracy or integrity of any part of the work are
appropriately investigated and resolved.
Ethics approval and consent to
participate
Not applicable.
Patient consent for publication
Not applicable.
Competing interests
The authors declare that they have no competing
interests.
References
|
1
|
Bray F, Ferlay J, Soerjomataram I, Siegel
RL, Torre LA and Jemal A: Global cancer statistics 2018: GLOBOCAN
estimates of incidence and mortality worldwide for 36 cancers in
185 countries. CA Cancer J Clin. 68:394–424. 2018. View Article : Google Scholar : PubMed/NCBI
|
|
2
|
Xie D, Marks R, Zhang M, Jiang G, Jatoi A,
Garces YI, Mansfield A, Molina J and Yang P: Nomograms predict
overall survival for patients with small-cell lung cancer
incorporating pretreatment peripheral blood markers. J Thorac
Oncol. 10:1213–1220. 2015. View Article : Google Scholar : PubMed/NCBI
|
|
3
|
Waqar SN and Morgensztern D: Treatment
advances in small cell lung cancer (SCLC). Pharmacol Ther.
180:16–23. 2017. View Article : Google Scholar : PubMed/NCBI
|
|
4
|
Karachaliou N, Pilotto S, Lazzari C, Bria
E, de Marinis F and Rosell R: Cellular and molecular biology of
small cell lung cancer: An overview. Transl Lung Cancer Res.
5:2–15. 2016.PubMed/NCBI
|
|
5
|
Sundaresan V, Lin VT, Liang F, Kaye FJ,
Kawabata-Iwakawa R, Shiraishi K, Kohno T, Yokota J and Zhou L:
Significantly mutated genes and regulatory pathways in SCLC-a
meta-analysis. Cancer Genet. 216-217:20–28. 2017. View Article : Google Scholar : PubMed/NCBI
|
|
6
|
Udagawa H, Umemura S, Murakami I, Mimaki
S, Makinoshima H, Ishii G, Miyoshi T, Kirita K, Matsumoto S, Yoh K,
et al: Genetic profiling-based prognostic prediction of patients
with advanced small-cell lung cancer in large scale analysis. Lung
Cancer. 126:182–188. 2018. View Article : Google Scholar : PubMed/NCBI
|
|
7
|
Sakre N, Wildey G, Behtaj M, Kresak A,
Yang M, Fu P and Dowlati A: RICTOR amplification identifies a
subgroup in small cell lung cancer and predicts response to drugs
targeting mTOR. Oncotarget. 8:5992–6002. 2017. View Article : Google Scholar : PubMed/NCBI
|
|
8
|
Sharma SK, Chintala NK, Vadrevu SK, Patel
J, Karbowniczek M and Markiewski MM: Pulmonary alveolar macrophages
contribute to the premetastatic niche by suppressing antitumor T
cell responses in the lungs. J Immunol. 194:5529–5538. 2015.
View Article : Google Scholar : PubMed/NCBI
|
|
9
|
Poirier JT, Gardner EE, Connis N, Moreira
AL, De Stanchina E, Hann CL and Rudin CM: DNA methylation in small
cell lung cancer defines distinct disease subtypes and correlates
with high expression of EZH2. Oncogene. 34:5869–5878. 2015.
View Article : Google Scholar : PubMed/NCBI
|
|
10
|
Valencia-Sanchez MA, Liu J, Hannon GJ and
Parker R: Control of translation and mRNA degradation by miRNAs and
siRNAs. Genes Development. 20:515–524. 2006. View Article : Google Scholar : PubMed/NCBI
|
|
11
|
Catto JW, Antonio A, Bjartell AS, De Vere
White R, Evans CP, Fussel S, Hamdy FC, Kallioniemi O, Mengual L,
Schlomm T and Visakorpi T: MicroRNA in prostate, bladder, and
kidney cancer: A systematic review. Eur Urol. 59:671–681. 2011.
View Article : Google Scholar : PubMed/NCBI
|
|
12
|
Iqbal MA, Arora S, Prakasam G, Calin GA
and Syed MA: MicroRNA in lung cancer: Role, mechanisms, pathways
and therapeutic relevance. Mol Aspects Med. 2018.(Epub ahead of
print). View Article : Google Scholar : PubMed/NCBI
|
|
13
|
Zhao Z, Liu J, Wang C, Wang Y, Jiang Y and
Guo M: MicroRNA-25 regulates small cell lung cancer cell
development and cell cycle through cyclin E2. Int J Clin Exp
Pathol. 7:7726–7734. 2014.PubMed/NCBI
|
|
14
|
Grimolizzi F, Monaco F, Leoni F, Bracci M,
Staffolani S, Bersaglieri C, Gaetani S, Valentino M, Amati M,
Rubini C, et al: Exosomal miR-126 as a circulating biomarker in
non-small-cell lung cancer regulating cancer progression. Sci Rep.
7:152772017. View Article : Google Scholar : PubMed/NCBI
|
|
15
|
Grosso S, Doyen J, Parks SK, Bertero T,
Paye A, Cardinaud B, Gounon P, Lacas-Gervais S, Noel A, Pouyssegur
J, et al: MiR-210 promotes a hypoxic phenotype and increases
radioresistance in human lung cancer cell lines. Cell Death Dis.
4:e5442013. View Article : Google Scholar : PubMed/NCBI
|
|
16
|
Rohrbeck A, Neukirchen J, Rosskopf M,
Pardillos GG, Geddert H, Schwalen A, Gabbert HE, von Haeseler A,
Pitschke G, Schott M, et al: Gene expression profiling for
molecular distinction and characterization of laser captured
primary lung cancers. J Transl Med. 6:692008. View Article : Google Scholar : PubMed/NCBI
|
|
17
|
Gautier L, Cope L, Bolstad BM and Irizarry
RA: Affy-analysis of Affymetrix GeneChip data at the probe level.
Bioinformatics. 20:307–315. 2004. View Article : Google Scholar : PubMed/NCBI
|
|
18
|
Diboun I, Wernisch L, Orengo CA and
Koltzenburg M: Microarray analysis after RNA amplification can
detect pronounced differences in gene expression using limma. BMC
Genomics. 7:2522006. View Article : Google Scholar : PubMed/NCBI
|
|
19
|
Dennis G Jr, Sherman BT, Hosack DA, Yang
J, Gao W, Lane HC and Lempicki RA: DAVID: Database for annotation,
visualization, and integrated discovery. Genome Biol. 4:P32003.
View Article : Google Scholar : PubMed/NCBI
|
|
20
|
Assenov Y, Ramirez F, Schelhorn SE,
Lengauer T and Albrecht M: Computing topological parameters of
biological networks. Bioinformatics. 24:282–284. 2008. View Article : Google Scholar : PubMed/NCBI
|
|
21
|
Dweep H, Sticht C, Pandey P and Gretz N:
miRWalk-Database: Prediction of possible miRNA binding sites by
‘walking’ the genes of three genomes. J Biomed Inform. 44:839–847.
2011. View Article : Google Scholar : PubMed/NCBI
|
|
22
|
Ma N and Gao X: β-Actin is predicted as
one of the potential targets of miR-145: Choose internal control
gene in verification of microRNA target. Carcinogenesis.
34:2362013. View Article : Google Scholar : PubMed/NCBI
|
|
23
|
Wang X: miRDB: A microRNA target
prediction and functional annotation database with a wiki
interface. RNA. 14:1012–1017. 2008. View Article : Google Scholar : PubMed/NCBI
|
|
24
|
Koinis F, Kotsakis A and Georgoulias V:
Small cell lung cancer (SCLC): No treatment advances in recent
years. Transl Lung Cancer Res. 5:39–50. 2016.PubMed/NCBI
|
|
25
|
Travis WD: Update on small cell carcinoma
and its differentiation from squamous cell carcinoma and other
non-small cell carcinomas. Mod Pathol. 25 (Suppl 1):S18–S30. 2012.
View Article : Google Scholar : PubMed/NCBI
|
|
26
|
Issaeva N: p53 signaling in cancers.
Cancers (Basel). 11:E3322019. View Article : Google Scholar : PubMed/NCBI
|
|
27
|
Dominguez-Brauer C, Thu KL, Mason JM,
Blaser H, Bray MR and Mak TW: Targeting mitosis in cancer: Emerging
strategies. Mol Cell. 60:524–536. 2015. View Article : Google Scholar : PubMed/NCBI
|
|
28
|
Penna LS, Henriques JAP and Bonatto D:
Anti-mitotic agents: Are they emerging molecules for cancer
treatment? Pharmacol Ther. 173:67–82. 2017. View Article : Google Scholar : PubMed/NCBI
|
|
29
|
Warkentin MT, Morris D, Bebb G and Brenner
DR: The role of DNA repair capacity on lung cancer risk in
never-smokers: A systematic review of epidemiologic studies. Cancer
Treat Res Commun. 13:13–24. 2017. View Article : Google Scholar
|
|
30
|
Jeggo PA, Pearl LH and Carr AM: DNA
repair, genome stability and cancer: A historical perspective. Nat
Rev Cancer. 16:35–42. 2016. View Article : Google Scholar : PubMed/NCBI
|
|
31
|
Reis ES, Mastellos DC, Ricklin D,
Mantovani A and Lambris JD: Complement in cancer: Untangling an
intricate relationship. Nat Rev Immunol. 18:5–18. 2018. View Article : Google Scholar : PubMed/NCBI
|
|
32
|
Afshar-Kharghan V: The role of the
complement system in cancer. J Clin Invest. 127:780–789. 2017.
View Article : Google Scholar : PubMed/NCBI
|
|
33
|
Ajona D, Ortiz-Espinosa S, Moreno H,
Lozano T, Pajares MJ, Agorreta J, Bertolo C, Lasarte JJ, Vicent S,
Hoehlig K, et al: A combined PD-1/C5a blockade synergistically
protects against lung cancer growth and metastasis. Cancer Discov.
7:694–703. 2017. View Article : Google Scholar : PubMed/NCBI
|
|
34
|
Wen P, Chidanguro T, Shi Z, Gu H, Wang N,
Wang T, Li Y and Gao J: Identification of candidate biomarkers and
pathways associated with SCLC by bioinformatics analysis. Mol Med
Rep. 18:1538–1550. 2018.PubMed/NCBI
|
|
35
|
Neubauer E, Wirtz RM, Kaemmerer D,
Athelogou M, Schmidt L, Sanger J and Lupp A: Comparative evaluation
of three proliferation markers, Ki-67, TOP2A, and RacGAP1, in
bronchopulmonary neuroendocrine neoplasms: Issues and prospects.
Oncotarget. 7:41959–41973. 2016. View Article : Google Scholar : PubMed/NCBI
|
|
36
|
Zhang WC, Chin TM, Yang H, Nga ME, Lunny
DP, Lim EK, Sun LL, Pang YH, Leow YN, Malusay SR, et al:
Tumour-initiating cell-specific miR-1246 and miR-1290 expression
converge to promote non-small cell lung cancer progression. Nat
Commun. 7:117022016. View Article : Google Scholar : PubMed/NCBI
|
|
37
|
Kottakis F, Polytarchou C, Foltopoulou P,
Sanidas I, Kampranis SC and Tsichlis PN: FGF-2 regulates cell
proliferation, migration, and angiogenesis through an
NDY1/KDM2B-miR-101-EZH2 pathway. Mol Cell. 43:285–298. 2011.
View Article : Google Scholar : PubMed/NCBI
|
|
38
|
Zhang JG, Guo JF, Liu DL, Liu Q and Wang
JJ: MicroRNA-101 exerts tumor-suppressive functions in non-small
cell lung cancer through directly targeting enhancer of zeste
homolog 2. J Thorac Oncol. 6:671–678. 2011. View Article : Google Scholar : PubMed/NCBI
|
|
39
|
Hu J, Wu C, Zhao X and Liu C: The
prognostic value of decreased miR-101 in various cancers: A
meta-analysis of 12 studies. Onco Targets Ther. 10:3709–3718. 2017.
View Article : Google Scholar : PubMed/NCBI
|
|
40
|
Castillo A, Morse HC III, Godfrey VL,
Naeem R and Justice MJ: Overexpression of Eg5 causes genomic
instability and tumor formation in mice. Cancer Res.
67:10138–10147. 2007. View Article : Google Scholar : PubMed/NCBI
|
|
41
|
Karunagaran S, Subhashchandrabose S, Lee
KW and Meganathan C: Investigation on the isoform selectivity of
novel kinesin-like protein 1 (KIF11) inhibitor using chemical
feature based pharmacophore, molecular docking, and quantum
mechanical studies. Comput Biol Chem. 61:47–61. 2016. View Article : Google Scholar : PubMed/NCBI
|
|
42
|
Demes M, Aszyk C, Bartsch H, Schirren J
and Fisseler-Eckhoff A: Differential miRNA-expression as an
adjunctive diagnostic tool in neuroendocrine tumors of the lung.
Cancers (Basel). 8:E382016. View Article : Google Scholar : PubMed/NCBI
|
|
43
|
Gao W, Xu J, Liu L, Shen H, Zeng H and Shu
Y: A systematic-analysis of predicted miR-21 targets identifies a
signature for lung cancer. Biomed Pharmacother. 66:21–28. 2012.
View Article : Google Scholar : PubMed/NCBI
|
|
44
|
Fabbri M, Paone A, Calore F, Galli R,
Gaudio E, Santhanam R, Lovat F, Fadda P, Mao C, Nuovo GJ, et al:
MicroRNAs bind to Toll-like receptors to induce prometastatic
inflammatory response. Proc Natl Acad Sci USA. 109:E2110–E2116.
2012. View Article : Google Scholar : PubMed/NCBI
|
|
45
|
Florczuk M, Szpechcinski A and
Chorostowska-Wynimko J: miRNAs as biomarkers and therapeutic
targets in non-small cell lung cancer: Current perspectives.
Targeted Oncol. 12:179–200. 2017. View Article : Google Scholar
|
|
46
|
Fujii K, Miyata Y, Takahashi I, Koizumi H,
Saji H, Hoshikawa M, Takagi M, Nishimura T and Nakamura H:
Differential proteomic analysis between small cell lung carcinoma
(SCLC) and pulmonary carcinoid tumors reveals molecular signatures
for malignancy in lung cancer. Proteomics Clin Appl.
12:e18000152018. View Article : Google Scholar : PubMed/NCBI
|
|
47
|
Levallet G, Dubois F, Fouret P, Antoine M,
Brosseau S, Bergot E, Beau-Faller M, Gounant V, Brambilla E,
Debieuvre D, et al: MSH2/BRCA1 expression as a DNA-repair signature
predicting survival in early-stage lung cancer patients from the
IFCT-0002 Phase 3 trial. Oncotarget. 8:4313–4329. 2017. View Article : Google Scholar : PubMed/NCBI
|
|
48
|
Bauerschmidt C, Arrichiello C,
Burdak-Rothkamm S, Woodcock M, Hill MA, Stevens DL and Rothkamm K:
Cohesin promotes the repair of ionizing radiation-induced DNA
double-strand breaks in replicated chromatin. Nucleic Acids Res.
38:477–487. 2010. View Article : Google Scholar : PubMed/NCBI
|
|
49
|
Urban E, Nagarkar-Jaiswal S, Lehner CF and
Heidmann SK: The cohesin subunit Rad21 is required for synaptonemal
complex maintenance, but not sister chromatid cohesion, during
Drosophila female meiosis. PLoS Genet. 10:e10045402014. View Article : Google Scholar : PubMed/NCBI
|
|
50
|
Xu H, Yan Y, Deb S, Rangasamy D, Germann
M, Malaterre J, Eder NC, Ward RL, Hawkins NJ, Tothill RW, et al:
Cohesin Rad21 mediates loss of heterozygosity and is upregulated
via wnt promoting transcriptional dysregulation in gastrointestinal
tumors. Cell Rep. 9:1781–1797. 2014. View Article : Google Scholar : PubMed/NCBI
|
|
51
|
Yan M, Xu H, Waddell N, Shield-Artin K,
Haviv I, kConFab authors, McKay MJ and Fox SB: Enhanced RAD21
cohesin expression confers poor prognosis in BRCA2 and BRCAX, but
not BRCA1 familial breast cancers. Breast Cancer Res. 14:R692012.
View Article : Google Scholar : PubMed/NCBI
|
|
52
|
Rhodes DR, Yu J, Shanker K, Deshpande N,
Varambally R, Ghosh D, Barrette T, Pandey A and Chinnaiyan AM:
Large-scale meta-analysis of cancer microarray data identifies
common transcriptional profiles of neoplastic transformation and
progression. Proc Natl Acad Sci USA. 101:9309–9314. 2004.
View Article : Google Scholar : PubMed/NCBI
|
|
53
|
Ranade AR, Cherba D, Sridhar S, Richardson
P, Webb C, Paripati A, Bowles B and Weiss GJ: MicroRNA 92a-2*: A
biomarker predictive for chemoresistance and prognostic for
survival in patients with small cell lung cancer. J Thorac Oncol.
5:1273–1278. 2010. View Article : Google Scholar : PubMed/NCBI
|
|
54
|
Bi J, Zeng X, Zhao L, Wei Q, Yu L, Wang X,
Yu Z, Cao Y, Shan F and Wei M: miR-181a induces macrophage
polarized to M2 phenotype and promotes M2 macrophage-mediated tumor
cell metastasis by targeting KLF6 and C/EBPalpha. Mol Ther Nucleic
Acids. 5:e3682016. View Article : Google Scholar : PubMed/NCBI
|