Introduction
Laryngeal carcinoma, the second most common head and
neck type of cancer, accounts for 2% of all malignant tumors
worldwide (1). Although a variety
of surgical procedures, radiotherapy, chemotherapy or combination
therapies are used in its treatment (2), the statistics reported by the American
Cancer Society in 2014 indicated that the 5-year survival rate of
patients with laryngeal carcinoma has decreased between 1975 and
2009 (3). Therefore, novel
treatment strategies are needed to improve the survival rate of
patients with laryngeal carcinoma and preserve the function of
their larynx. Radiation therapy plays an important role in patients
with early and late stage, and recurrent laryngeal carcinoma,
however, radioresistance is common, leading to the treatment
failure of radiation therapy (4–6).
Therefore, developing a novel therapeutic strategy is necessary to
improve the radiosensitivity of laryngeal carcinoma.
Resistance to head and neck cancer radiotherapy
occurs for three main reasons: intrinsic radiation resistance,
tumor cell proliferation and hypoxia. It has been previously
reported that hypoxia plays an important role in the resistance of
tumors to radiotherapy (7). GLUT-1
is an important hypoxic marker in various malignant tumors,
including laryngeal carcinoma (8–13).
Previous findings have shown that antisense oligonucleotides
(AS-ODNs) against GLUT-1 inhibited glucose uptake and the
proliferation in Hep-2 cells by inhibiting the expression of GLUT-1
(14). Additional studies found
that the radioresistance of laryngeal cancer was associated with a
high expression of GLUT-1 and that the radiosensitivity of
laryngeal carcinoma could be increased by suppressing the
expression of GLUT-1 using GLUT-1 AS-ODNs (15). The abnormal expression of GLUT-1
activates a variety of signal transduction pathways and the
PI3K/Akt signaling pathway plays an important role in regulating
the expression of GLUT-1 (16–19).
Activation of the PI3K/Akt signaling pathway is also associated
with the radioresistance and chemoradioresistance of tumors
(20–26). To the best of our knowledge, no
studies have assessed the effects of PI3K/Akt signaling on GLUT-1
expression and their relationship with the radioresistance of
laryngeal carcinoma in vivo.
Apigenin is a natural phytoestrogen flavonoid
present in a wide range of fruits, vegetables (particularly
celery), beans and tea. Moreover, in vitro and in
vivo studies have demonstrated that apigenin exerts potential
biological effects, including anti-oxidative, anti-inflammatory and
anticancer activities, with the antitumor effects being the most
prominent (27). Apigenin inhibits
PI3K/Akt signaling in human types of cancer (16,28–33)
and previous findings have shown that the effects of apigenin on
lowering GLUT-1 expression were involved in downregulation of the
PI3K/Akt pathway (16,32). We demonstrated previously that the
overexpression of GLUT-1 and p-Akt was associated with the
resistance laryngeal carcinoma Hep-2 cells to cisplatin.
Additionally, apigenin was able to suppress GLUT-1 and p-AKT
expression to enhance the chemosensitivity of laryngeal carcinoma
to cisplatin (32). However, to the
best of our knowledge, no studies have assessed the effects of
apigenin on the PI3K/Akt pathway, GLUT-1 expression and the
radiosensitivity of tumors.
The aim of the present study was to examine the
expression of GLUT-1 and PI3K/Akt pathway-related factors in tumors
in nude mice. Specifically, we investigated whether GLUT-1
expression was decreased by inhibiting the PI3K/Akt pathway and
whether apigenin enhanced the radiosensitivity of laryngeal
carcinoma. In addition, we assessed whether apigenin plays a role
in the effects of GLUT-1 AS-ODNs on enhancing the radiosensitivity
of laryngeal carcinoma.
Materials and methods
Reagents
Apigenin was purchased from Selleckchem (Houston,
TX, USA). AS-ODNs GLUT-1 was prepared as reported previously
(14,15). TRIzol was obtained from Invitrogen
(Carlsbad, CA, USA; cat. no. 15596-026). The cDNA First-Strand
Synthesis kit and Taq DNA polymerase were obtained from Thermo
Fisher Scientific (Waltham, MA, USA; cat. nos k1622 and ep0405,
respectively). Real-Time PCR Master Mix (SYBR®-Green)
was purchased from Toyobo (Tokyo, Japan). Agarose was obtained from
Biowest (Madrid, Spain; cat. no 111860). The 50X TAE
electrophoresis buffer, chloroform and isopropanol were purchased
from the Nanjing Chemical Reagent Co. Ltd. (Nanjing, China). The
terminal deoxynucleotidyl transferase-mediated dUTP digoxigenin
nick end-labeling (TUNEL) staining of tumor sections was performed
using an in situ apoptosis detection kit purchased from
Roche (Shanghai, China). The following reagents were obtained from
Hangzhou Biotech Co., Ltd. (Hangzhou, China): 70% ethanol [treated
with diethylpyrocarbonate, (DEPC)], water containing 0.1% DEPC, a
total protein extraction kit, a Bradford protein detection kit, 5X
sodium dodecyl sulfate-polyacrylamide gel electrophoresis
(SDS-PAGE) protein loading buffer, pre-stained protein molecular
weight markers, 10X Tris-glycine protein electrophoresis buffer, a
Coomassie Blue staining kit, 10X transfer buffer, Ponceau S
staining solution, 10X western blot analysis (WB) washing buffer,
WB blocking solution, primary antibody dilution buffer, secondary
antibody dilution buffer, WB stripping buffer and an ECL WB
detection kit.
Cell culture
The laryngeal Hep-2 carcinoma cell line was
purchased from the Cell Research Institute of the Chinese Academy
of Sciences (Shanghai, China). The cells were cultured at the
Roswell Park Memorial Institute-1640 (RPMI-1640; Gibco-BRL,
Gaithersburg, MD, USA) supplemented with 10% heat-inactivated fetal
bovine serum (FBS; Hyclone, Logan, UT, USA), 100 U/ml penicillin
and 100 g/ml streptomycin at 37°C in an atmosphere containing 5%
CO2. Cells in the logarithmic growth phase were used in
the experiments.
Nude mouse model of laryngeal
carcinoma
This experiment was conducted in accordance with the
institutional guidelines of the First Affiliated Hospital, College
of Medicine, Zhejiang University and with appropriate institutional
certification. Four-week-old male athymic nude mouse with a BALB/c
background weighing 18±2 g (n=30) were raised under specific
pathogen-free (SPF) conditions at the Surgical Laboratory Animal
Center of the First Affiliated Hospital, College of Medicine,
Zhejiang University. Under sterile conditions, a
2×10⁶/ml Hep-2 cell suspension was injected
subcutaneously into the right forelimb of each nude mouse at a
volume of 0.2 ml. The inoculation site of each nude mouse was
observed daily after inoculation. After 1 week, a grain-sized
induration may develop at the visible inoculation site, which
confirmed that the xenograft model was established
successfully.
Grouping and intervention
Two separate experiments were performed: one using
15 and a second using 18 tumor-bearing mice.
Experiment 1 (n=15)
When the tumors reached a volume of ~100
mm3, 15 tumor-bearing mice were divided randomly into
five groups of three mice. The tumors were then treated as follows:
50 µg apigenin combined with 10 Gy X-ray irradiation, 100
µg apigenin combined with 10 Gy X-ray irradiation, 50
µg apigenin alone, 100 µg apigenin alone and 10 Gy
X-ray irradiation alone. The apigenin was dissolved in dimethyl
sulfoxide (DMSO) and then diluted in serum-free RPMI-1640 medium to
achieve a final DMSO concentration of 0.1%. In the animals treated
with 50 or 100 µg apigenin and 10 Gy X-ray irradiation, the
mice were injected intraperitoneally with 50 or 100 µg
apigenin once daily for 10 days (the interval time was 1 day). The
local tumor was then irradiated with 10 Gy X-ray irradiation on day
20 and the tumors were observed for 1 week. In the animals treated
with 50 or 100 µg apigenin, the mice were injected
intraperitoneally with 50 or 100 µg apigenin once daily for
10 days (the interval time was 1 day) and the tumors were observed
for 1 week. In animals that received 10 Gy X-ray irradiation alone,
the local tumor was irradiated with 10 Gy X-ray irradiation on day
20 and the tumors were observed for 1 week. All the mice were
sacrificed on day 27 and the tumors were resected and stored at
−80°C until analysis.
Experiment 2 (n=18)
When the tumors reached a volume of ~100
mm3, 18 tumor-bearing mice were divided randomly into
six groups of three mice: A negative control, apigenin alone,
GLUT-1 AS-ODNs alone, 10 Gy X-ray irradiation alone, apigenin and
GLUT-1 AS-ODNs and the combination of apigenin, GLUT-1 AS-ODNs and
10 Gy X-ray irradiation. In the apigenin-only group, the mice were
injected intraperitoneally with 100 µg apigenin daily for 10
consecutive days. In the GLUT-1 AS-ODNs-only group, the mice were
injected peritumorally with 100 µg GLUT-1 AS-ODNs three
times at 2-day intervals. The mice treated with apigenin and GLUT-1
AS-ODNs were injected intraperitoneally with 100 µg apigenin
daily for 10 consecutive days and also injected peritumorally with
100 µg GLUT-1 AS-ODNs three times at 2-day intervals. Mice
in the apigenin, GLUT-1 AS-ODNs and 10 Gy X-ray irradiation
combination group were treated as described for the apigenin and
GLUT-1 AS-ODNs group and 10 Gy X-ray irradiation was administered
locally at the tumor site on day 10. Mice in the 10 Gy X-ray
irradiation-only group received 10 Gy irradiation at the tumor site
on day 10. The mice were sacrificed on day 24 and the tumors were
resected and stored at −80°C until analysis.
Observation
The mental state, food intake and activity of all
the mice were monitored daily. The tumor growth conditions (tumor
formation rate, size, weight and inhibition ratio) were assessed
after vaccination, drug and radiological intervention. The tumor
volume (V) was calculated by measuring the i) long and ii) short
tumor diameter after tumor formation using the equation
V=1/2(ab2). The tumor formation rate was
calculated as the number of mice whose tumor volume was >5 mm
diameter/the number of the mice in the experimental group × 100%.
Animal surgery was performed under general anesthesia, using 50
mg/kg ip injection of pentobarbital sodium. The inhibition ratio
(IR) was defined as 1-(tumor weight of test group/control
group).
Measuring GLUT-1, p-Akt and PI3K mRNA
using reverse transcription-quantitative polymerase chain reaction
(RT-qPCR)
Total RNA was extracted from cells using TRIzol
according to the manufacturer's instructions. The concentration of
total RNA was measured using ultraviolet spectrophotometry, with an
optical density (OD) 260/280 ratio of 1.8–2.1 being considered
acceptable. First-strand cDNA was synthesized in a 20-µl
reaction in 0.2-ml sterile and nuclease-free PCR tubes comprising:
nµl (?) of RNA (total 2 µg), 2 µl reaction
volume consisting of 50 µM of oligo d(18) primer, and DEPC·H2O at a
total volume of 12.5 µl. Reactions were incubated at 65°C
for 5 min, placed on ice for 5 min and the following components
were then added: 0.5 µl of RNase inhibitor (40 U/µl),
4.0 µl 5X reaction buffer, 2.0 µl dNTPs (10 mM) and
1.0 µl M-MuLV. After gentle mixing, the tubes were
centrifuged at 2,000 rpm for 20 sec and then incubated at 42°C for
1 h, 70°C for 10 min and placed on ice for 5 min. The resulting
product was then used immediately in the next step PCR reaction or
stored at −20°C. According to a certain order, a sample of the gene
was repeated for three wells. The following components were added
to the 0.2-ml PCR tubes: 10 µl 2X real-time PCR master mix
(SYBR®-Green), 1 µl cDNA template (diluted
10-fold), 2 µl primer mix (10 µM of each forward and
reverse primer) and 7 µl 0.1% DEPC H2O, in a
total volume of 20 µl. The primer sequences and the length
of the resulting PCR products were as follows: GAPDH (202 bp)
forward, 5′-TGTTGCCATCAATGACCCCTT-3′ and reverse,
5′-CTCCACGACGTACTCAGCG-3′; GLUT1 (111 bp) forward,
5′-GTCAACACGGCCTTCACTG-3′ and reverse, 5′-GGTCATGAGTATGGCACAACC-3′;
Akt (67 bp) forward, 5′-GCAGCACGGTACGAGAAGA-3′ and reverse,
5′-GGTGTCAGTCTCCGACGTG-3′; and PI3K (144 bp) forward,
5′-GGGGATGATTTACGGCAAGATA-3′ and reverse,
5′-CACCACCTCAATAAGTCCCACA-3′. To distinguish between specific and
non-specific products and primer dimers, a dissociation curve
analysis was conducted immediately after amplification by
continuous monitoring of the SYBR®-Green I fluorescence
signal at temperatures between 60 and 95°C. For calculation of the
differential gene expression, the 2−ΔΔCt formula was
used.
Western blot analysis
GLUT-1, p-Akt and PI3K protein levels were analyzed
using a BAC protein quantification kit. Briefly, 80 µg of
protein was separated using 10% SDS-PAGE and transferred to
nitrocellulose membranes. The membranes were blocked in PBST
solution (phosphate-buffered saline with Tween-20) containing 5%
skim milk at room temperature for 1 h and incubated with primary
antibodies (anti-actin, 1:4,000 dilution; GLUT-1, 1:800; p-Akt,
1:1,000; PI3K, 1:800) at 4°C overnight. The membranes were then
incubated with secondary antibodies (donkey anti-rabbit, 1:5,000;
donkey anti-mouse, 1:2,000) at room temperature for 1 h. The
proteins were visualized using enhanced chemiluminescence and
exposed to X-ray film. Protein expression was analyzed
semiquantitatively using a Gel Logic analysis system (Kodak,
Rochester, NY, USA).
TUNEL assays
Paraffin-embedded sections of xenograft tumor
tissues were dewaxed and hydrated. TUNEL staining of tumor sections
was then performed according to the manufacturer's instructions
(Roche). Staining was visualized under an optical microscope, and
cells with brown or brown-yellow nuclei were interpreted as
positive and observations were confirmed using the morphological
features of apoptotic cells. Specifically, unstained cells became
smaller, the membrane appeared to be foaming, apoptotic bodies
formed in the later stages and adherent cells became shrunken,
round and shed. In addition, stained cells exhibited chromatin
condensation, marginalization, nuclear membrane cracking and the
chromatin was divided into block/apoptotic bodies. The sections
were observed at a magnification of ×400 and the percentage of
apoptotic cells in 100 cells/field was counted and used to
calculate the mean apoptosis index (AI).
Results
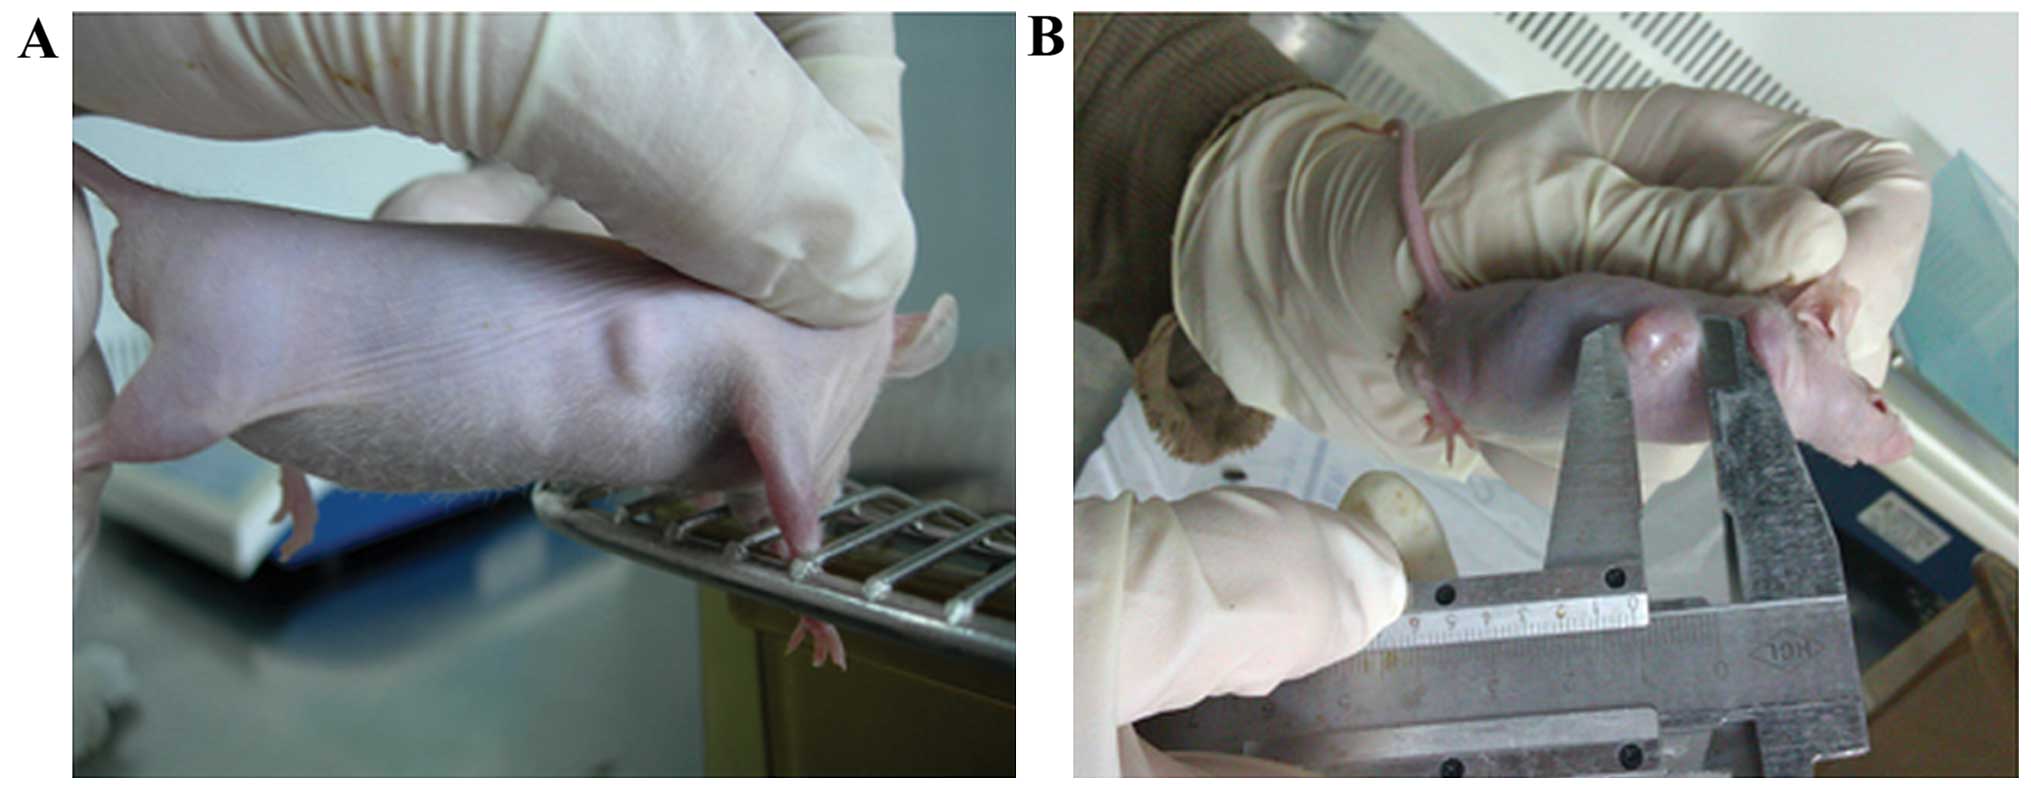
General observations
Subcutaneous xenograft tumors were visible ~1 week
after inoculation with Hep-2 cells (Fig. 1A) and appeared as round or oval
nodules. Mice in each group exhibited no obvious abnormalities in
mental behavior, eating habits, defecation or mortality during the
experimental period. Of the 33 mice inoculated in the present
study, the tumor formation rate was 100% and the tumor volume
reached ~100 mm3 after 2 weeks (Fig. 1B).
Xenografts
Xenograft volume
In the first experiment, tumor size in the 100
µg apigenin group decreased significantly compared to the 10
Gy group after 12 days of treatment (P<0.05; Fig. 2A). However, no significant
differences in tumor volume were observed among the remaining
groups (P>0.05). By contrast, tumor size decreased in the 50,
100, 50 µg apigenin plus 10 Gy and 100 µg apigenin
plus 10 Gy groups compared to the 10 GY group after 19 days of
treatment (P<0.05; Fig. 2A).
After X-ray radiation, tumors were significantly smaller in the 100
µg apigenin plus 10 Gy group compared to the 10 Gy group 27
days after treatment (P<0.05; Fig.
2A). However, no significant differences were detected between
tumors in the 50 µg apigenin plus 10 Gy and 10 Gy alone
groups, 50 and 100 µg apigenin groups, 50 µg apigenin
plus 10 Gy and 50 µg apigenin alone groups and the 50
µg apigenin plus 10 Gy and 100 µg apigenin plus 10 Gy
groups (all P>0.05).
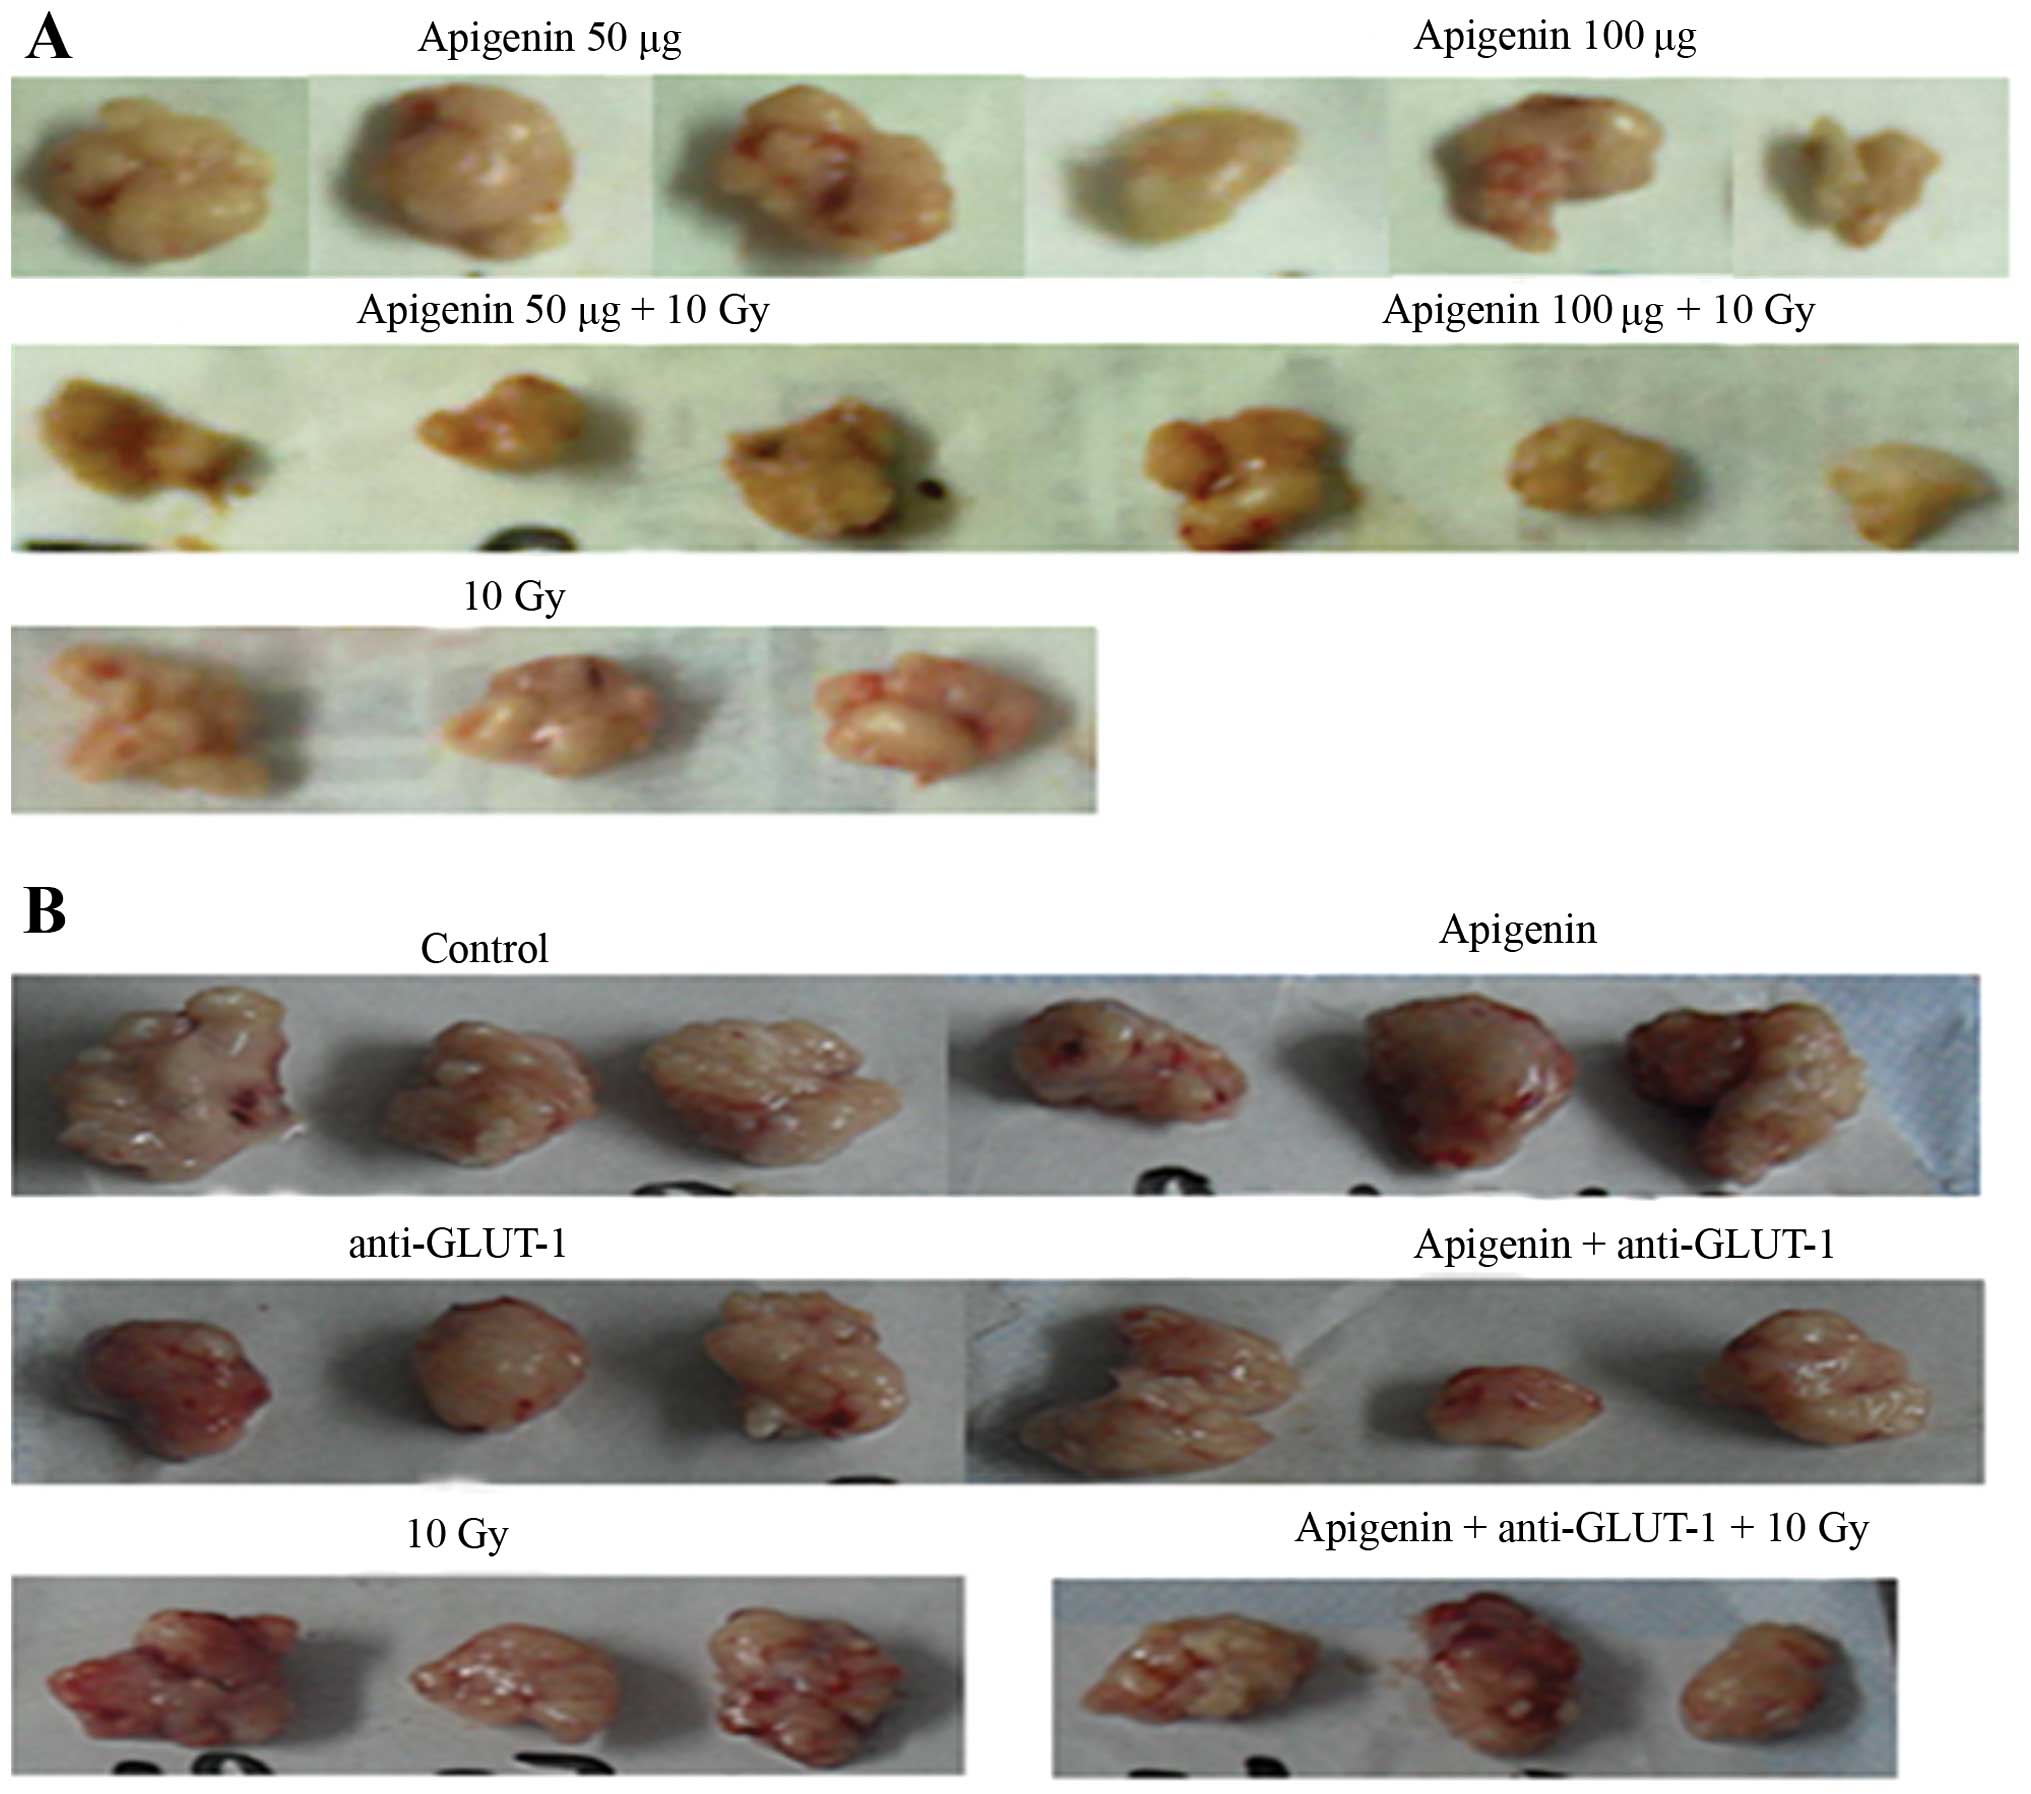
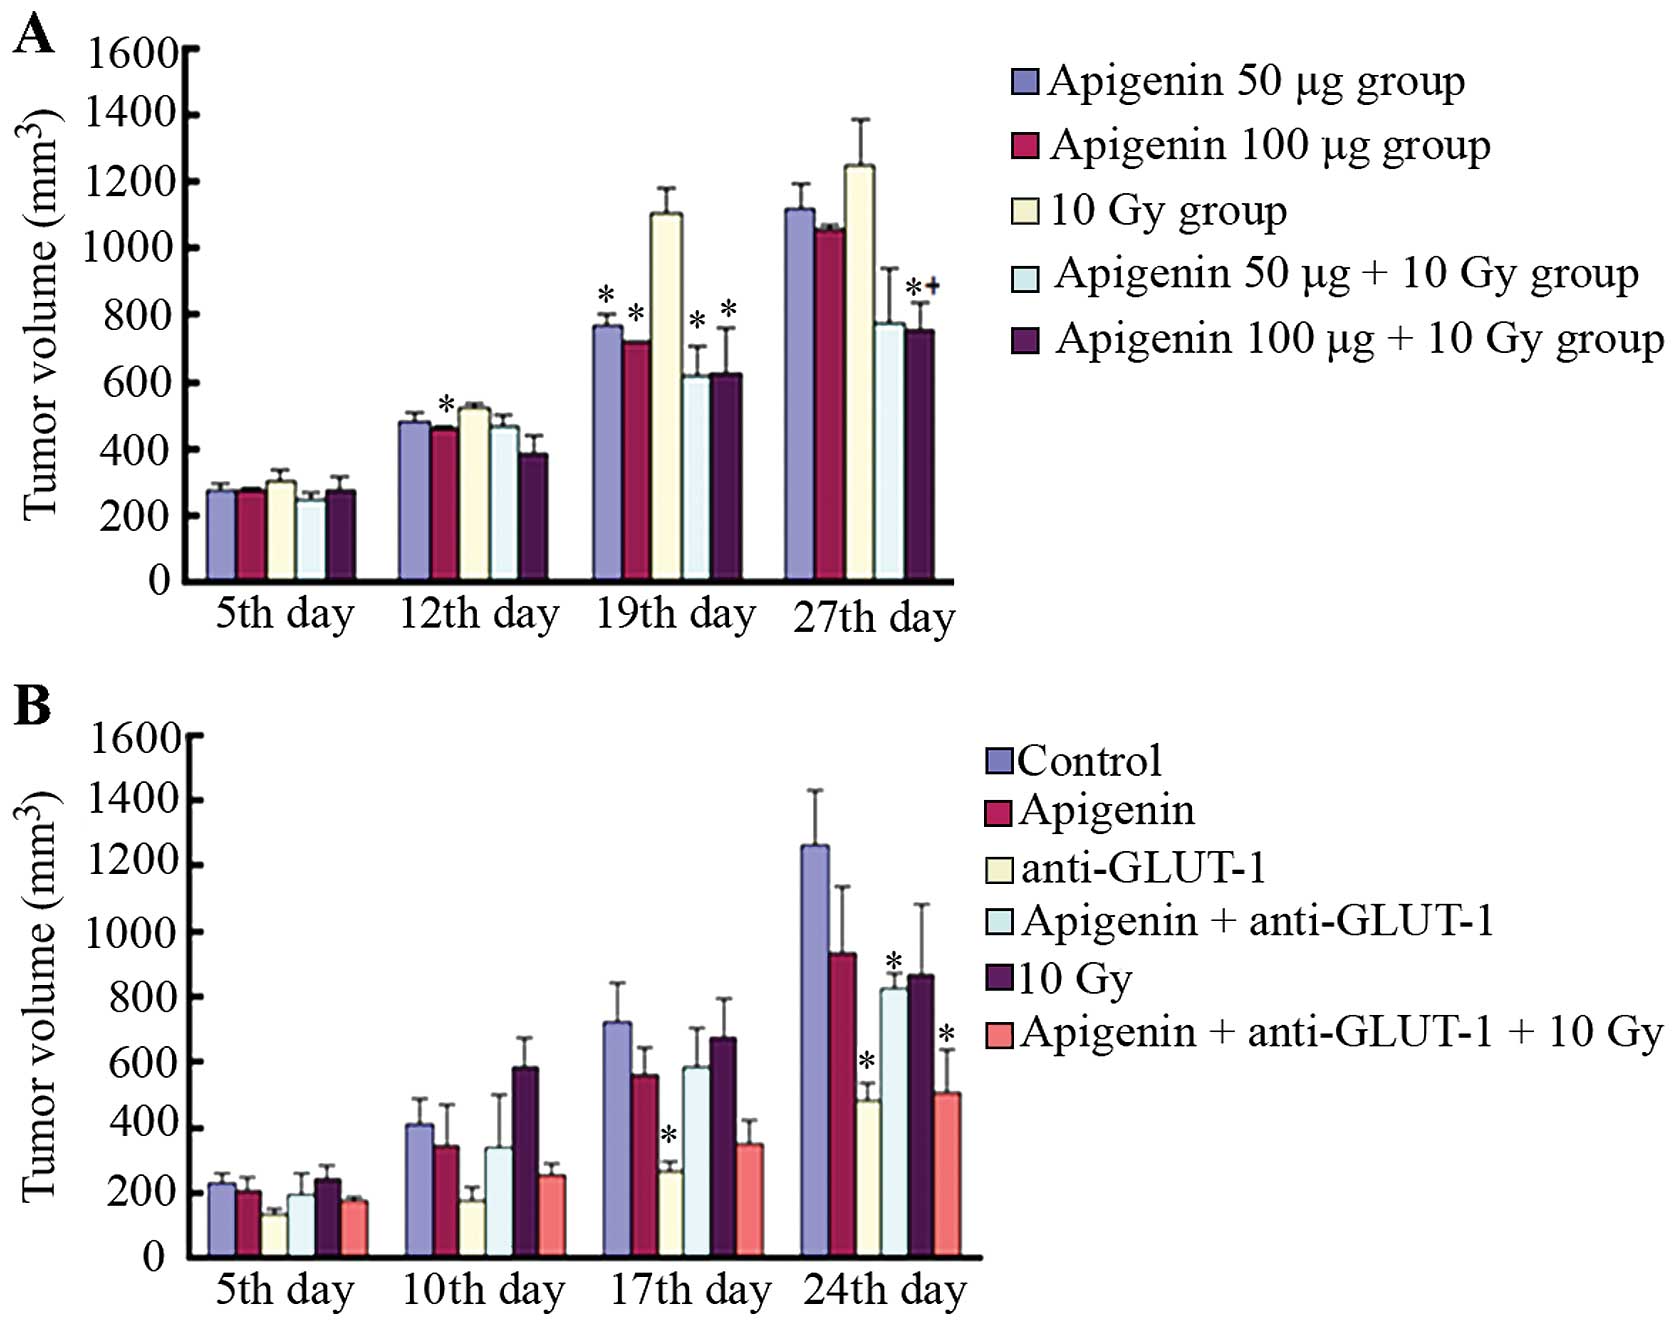 | Figure 2The effects of apigenin, GLUT-1
AS-ODNs or the combined treatment plus radiation on xenograft tumor
growth in vivo. (A) In the first experiment, the tumor
volume of each treatment group on the 5th, 12th, 19th and 27th day.
*P<0.05, indicated that there were significant
differences in the tumor volume compared to the 10 Gy group.
+P<0.05, indicated that there were significant
differences in tumor volume between the apigenin 100 µg+10
Gy group and apigenin 100 µg group. (B) In the second
experiment, the tumor volume of each treatment group on the 5th,
10th, 17th and 24th day. *P<0.05, indicated that
there were significant differences in the tumor volume compared to
the control group. |
In the second experiment, tumors were significantly
smaller in the GLUT-1 AS-ODNs group compared to the control group
17 days after treatment (P<0.05; Fig. 2B). No significant differences in
tumor volume were observed among the remaining groups (P>0.05).
By contrast, tumors were significantly smaller in the GLUT-1
AS-ODNs, apigenin plus GLUT-1 AS-ODNs, apigenin plus GLUT-1 AS-ODNs
plus 10 Gy groups compared to the control 24 days after treatment
(P<0.05; Fig. 2B).
Xenograft weight
In the first experiment, the weight of the tumors
harvested from the mice in each group is shown in Fig. 3A. Tumors weighed significantly less
in the 100 µg apigenin group compared to the 50 µg
apigenin and 10 Gy group (P<0.05; Table I). No significant differences were
identified in the weight of tumors in the 50 µg apigenin
plus 10 Gy and 50 µg apigenin groups, the 50 µg
apigenin plus 10 Gy and 10 Gy groups, 100 µg apigenin plus
10 Gy and 100 µg apigenin groups, 100 µg apigenin
plus 10 Gy and 10 Gy groups, 50 µg apigenin plus 10 Gy and
10 Gy groups, apigenin 50 µg plus 10 Gy and apigenin 100
µg plus 10 Gy groups (P>0.05).
 | Table ITumor weight of each group in the
first experiment. |
Table I
Tumor weight of each group in the
first experiment.
| Group | Tumor weight
(g) |
|---|
| Apigenin 50
µg | 0.6070±0.0195 |
| Apigenin 100
µg |
0.5260±0.0285a,b |
| 10 Gy | 0.6770±0.0609 |
| Apigenin 50
µg+10 Gy | 0.4937±0.2430 |
| Apigenin 100
µg+10 Gy | 0.4820±0.1421 |
The weight of the tumors harvested from the mice in
each group from the second experiment is shown in Fig. 3B. GLUT-1 AS-ODNs reduced tumor
weight significantly compared to the control (P<0.05; Table II), but no significant differences
were observed among the remaining groups (P>0.05).
| Table IITumor weight, inhibitory rate and
apoptotic index of each group in the second experiment. |
Table II
Tumor weight, inhibitory rate and
apoptotic index of each group in the second experiment.
| Group | Tumor weight
(g) | Inhibitory rate
(%) | AI (%) |
|---|
| Control | 0.9733±0.1358 | | 1.50±1.77 |
| Apigenin | 0.9933±0.2108 | −2.05 | 23.65±6.41b |
| Anti-GLUT-1 |
0.6100±0.0346a | 37.33 | 6.63±3.13b |
|
Apigenin+anti-GLUT-1 | 0.9267±0.6888 | 4.79 | 34.71±7.48b,c |
| 10 Gy | 0.9050±0.1598 | 7.02 | 15.26±3.43b |
|
Apigenin+anti-GLUT-1+10 Gy | 0.7090±0.2383 | 27.16 | 53.28±5.81b,d |
Xenograft growth inhibition
In the second experiment, the rates of tumor growth
inhibition in the apigenin, GLUT-1 AS-ODNs, 10 Gy, apigenin plus
GLUT-1 AS-ODNs and apigenin plus GLUT-1 AS-ODNs plus 10 Gy groups
were −2.05, 37.33, 7.02, 4.79 and 27.16%, respectively.
Effects of apigenin and GLUT-1 AS-ODNs
on xenograft apoptosis
The apoptotic indices were significantly higher in
the apigenin, GLUT-1 AS-ODNs, 10 Gy, apigenin plus GLUT-1 AS-ODNs
and apigenin plus GLUT-1 AS-ODNs plus 10 Gy groups compared to the
control (P<0.05; Fig. 4,
Table II). The combination of
apigenin and GLUT-1 AS-ODNs significantly enhanced the effects of
apigenin or GLUT-1 AS-ODNs alone on tumor cell apoptosis
(P<0.05; Fig. 4, Table II). In addition, the combination of
apigenin and GLUT-1 AS-ODNs significantly enhanced the effects of
X-ray irradiation on tumor cell apoptosis (P<0.05; Fig. 4, Table
II).
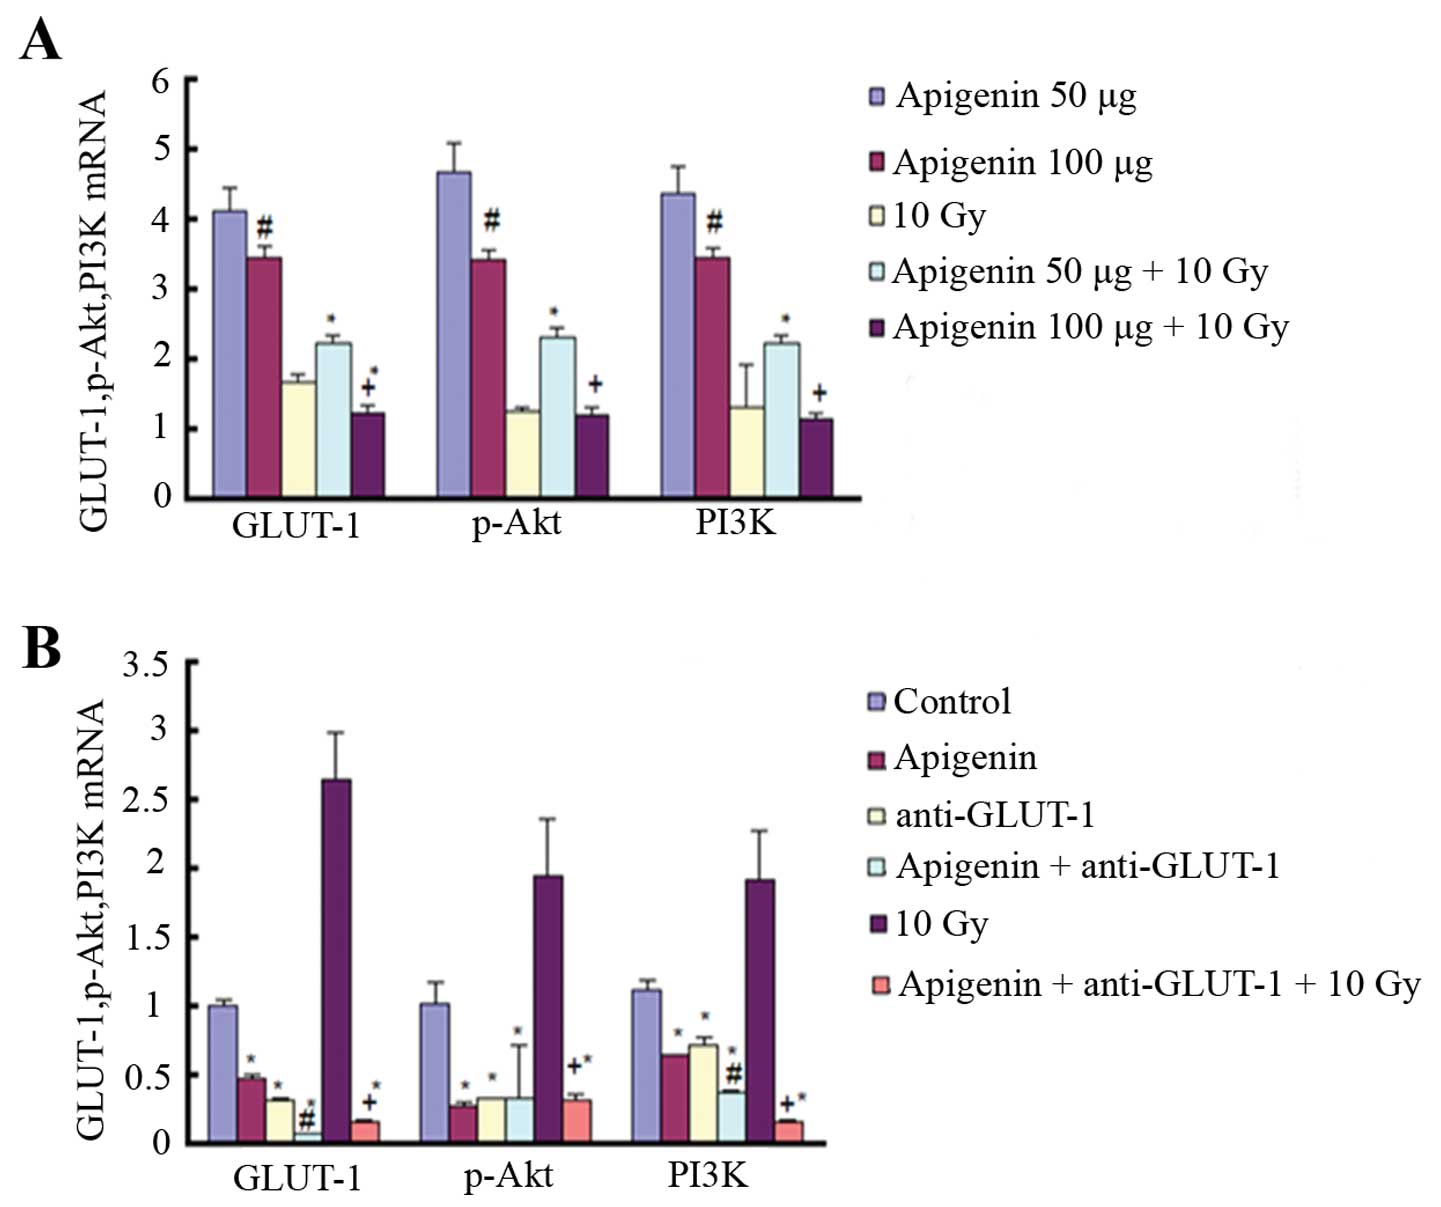
Effects of apigenin and GLUT-1 AS-ODNs
on GLUT-1, Akt, and PI3K mRNA
In the first experiment, GLUT-1, Akt
and PI3K mRNA expression was significantly decreased in the
100 µg compared to the 50 µg apigenin group
(P<0.05; Fig. 5A). In addition,
GLUT-1, Akt, and PI3K mRNA expression was
significantly lower in the 100 compared to the 50 µg
apigenin plus 10 Gy group (P<0.05; Fig. 5A). The expression of GLUT-1 mRNA was
significantly reduced in the 100 µg apigenin plus 10 Gy
group compared to the 10 Gy group (P<0.05; Fig. 5A). Finally, the expression of
GLUT-1, Akt and PI3K mRNA was significantly
higher in the 50 µg apigenin plus 10 Gy group compared to
the 10 Gy X-ray group (P<0.05; Fig.
5A).
In the second experiment, GLUT-1, Akt
and PI3K mRNA expression was significantly decreased in the
apigenin group, GLUT-1 AS-ODNs group, apigenin plus GLUT-1 AS-ODNs
group and apigenin plus GLUT-1 AS-ODNs plus 10 Gy group compared to
the control group (P<0.05; Fig.
5B). In addition, GLUT-1 expression was significantly
higher in the 10 Gy X-ray radiation group than in the control group
(P<0.05; Fig. 5B). The
expression of Akt and PI3K was also higher in the 10
Gy X-ray radiation group compared to the control group, although it
was not significant (P>0.05). Apigenin plus GLUT-1 AS-ODNs
significantly enhanced the effect of inhibition on the expression
of GLUT-1 mRNA and PI3K mRNA of apigenin or GLUT-1 AS-ODNs,
respectively (P<0.05; Fig. 5B).
The expression of GLUT-1, Akt and PI3K was
significantly reduced in the apigenin plus GLUT-1 AS-ODNs plus 10
Gy group compared to the 10 Gy group (P<0.05; Fig. 5B).
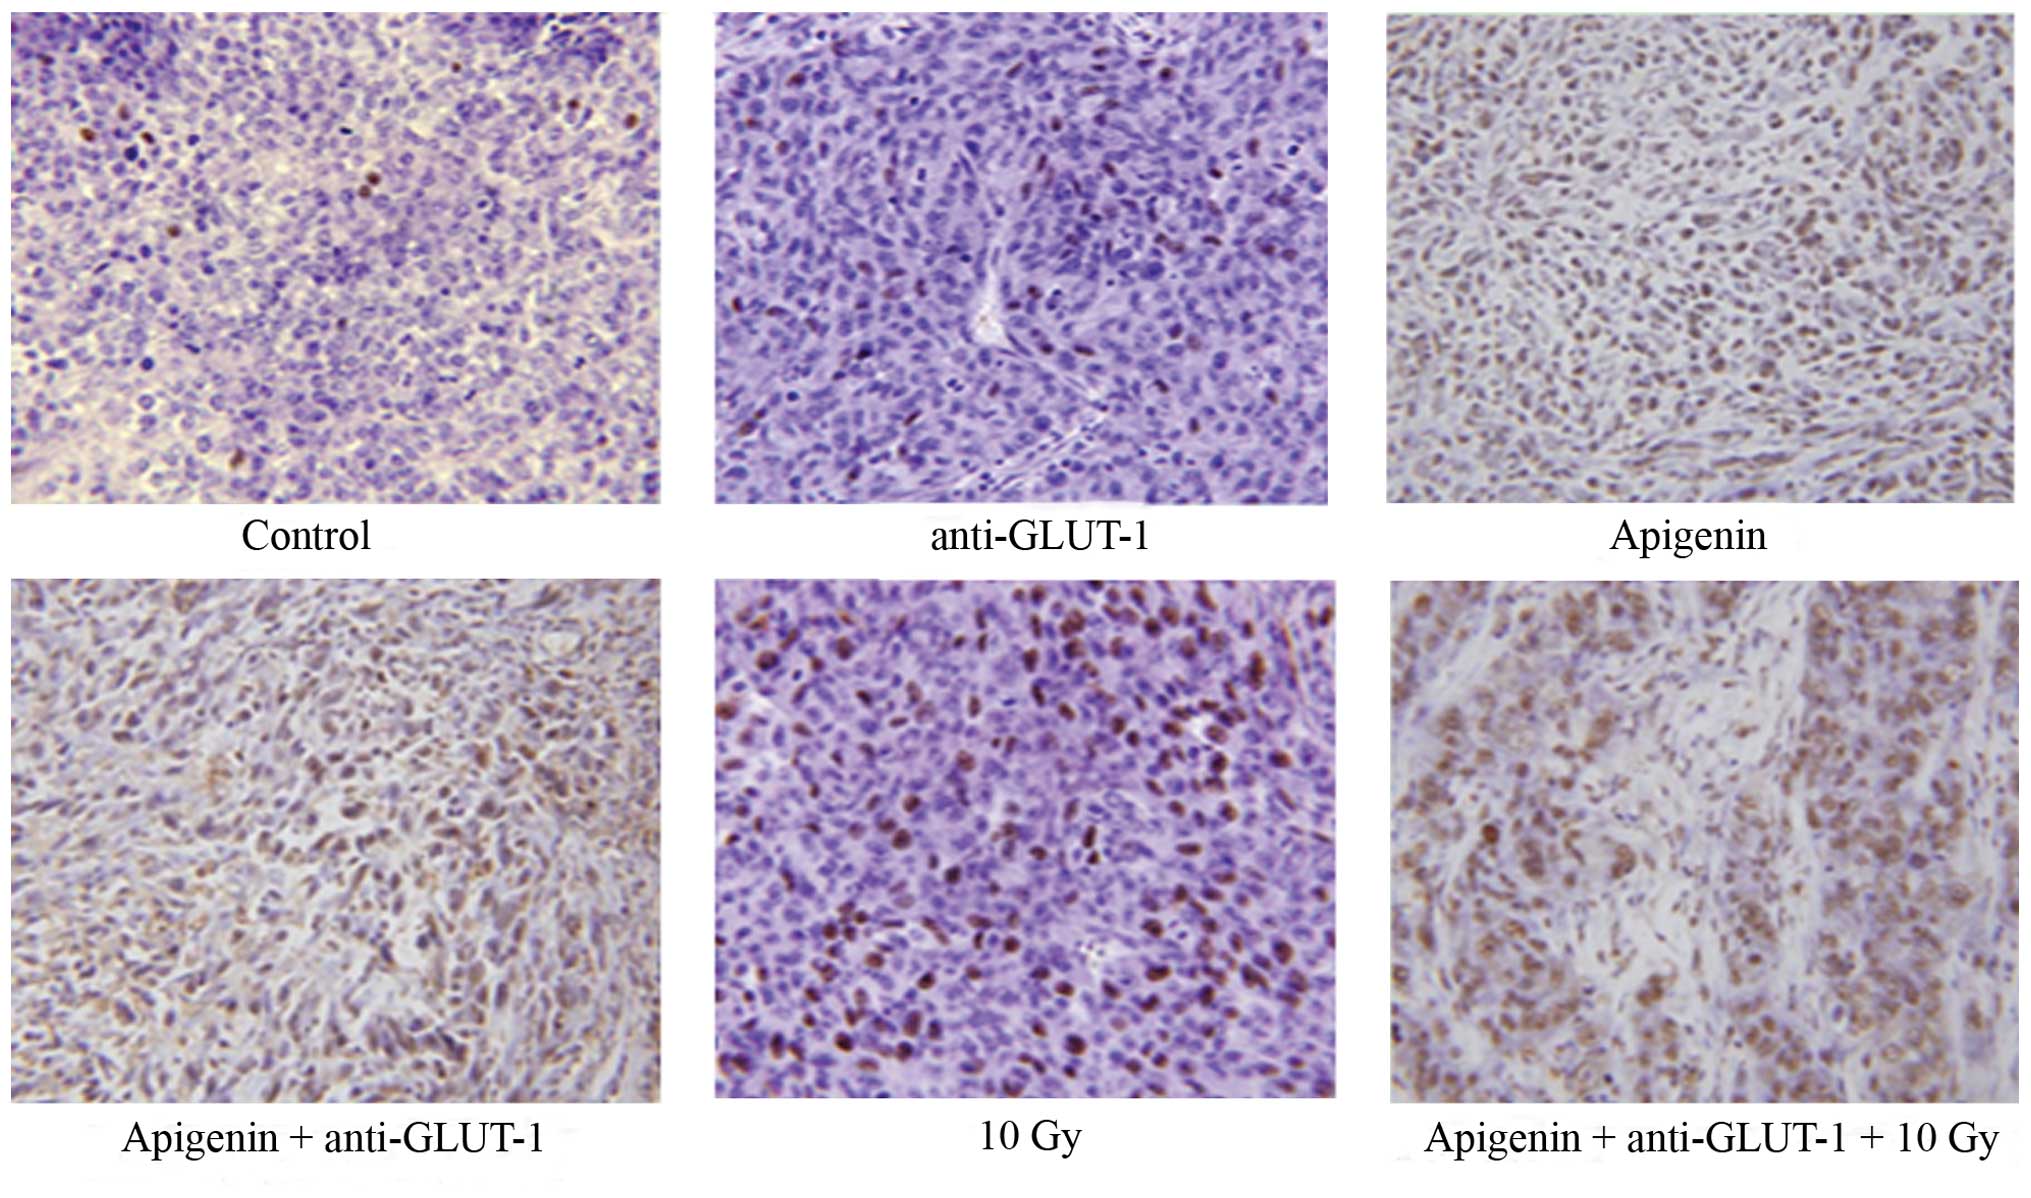
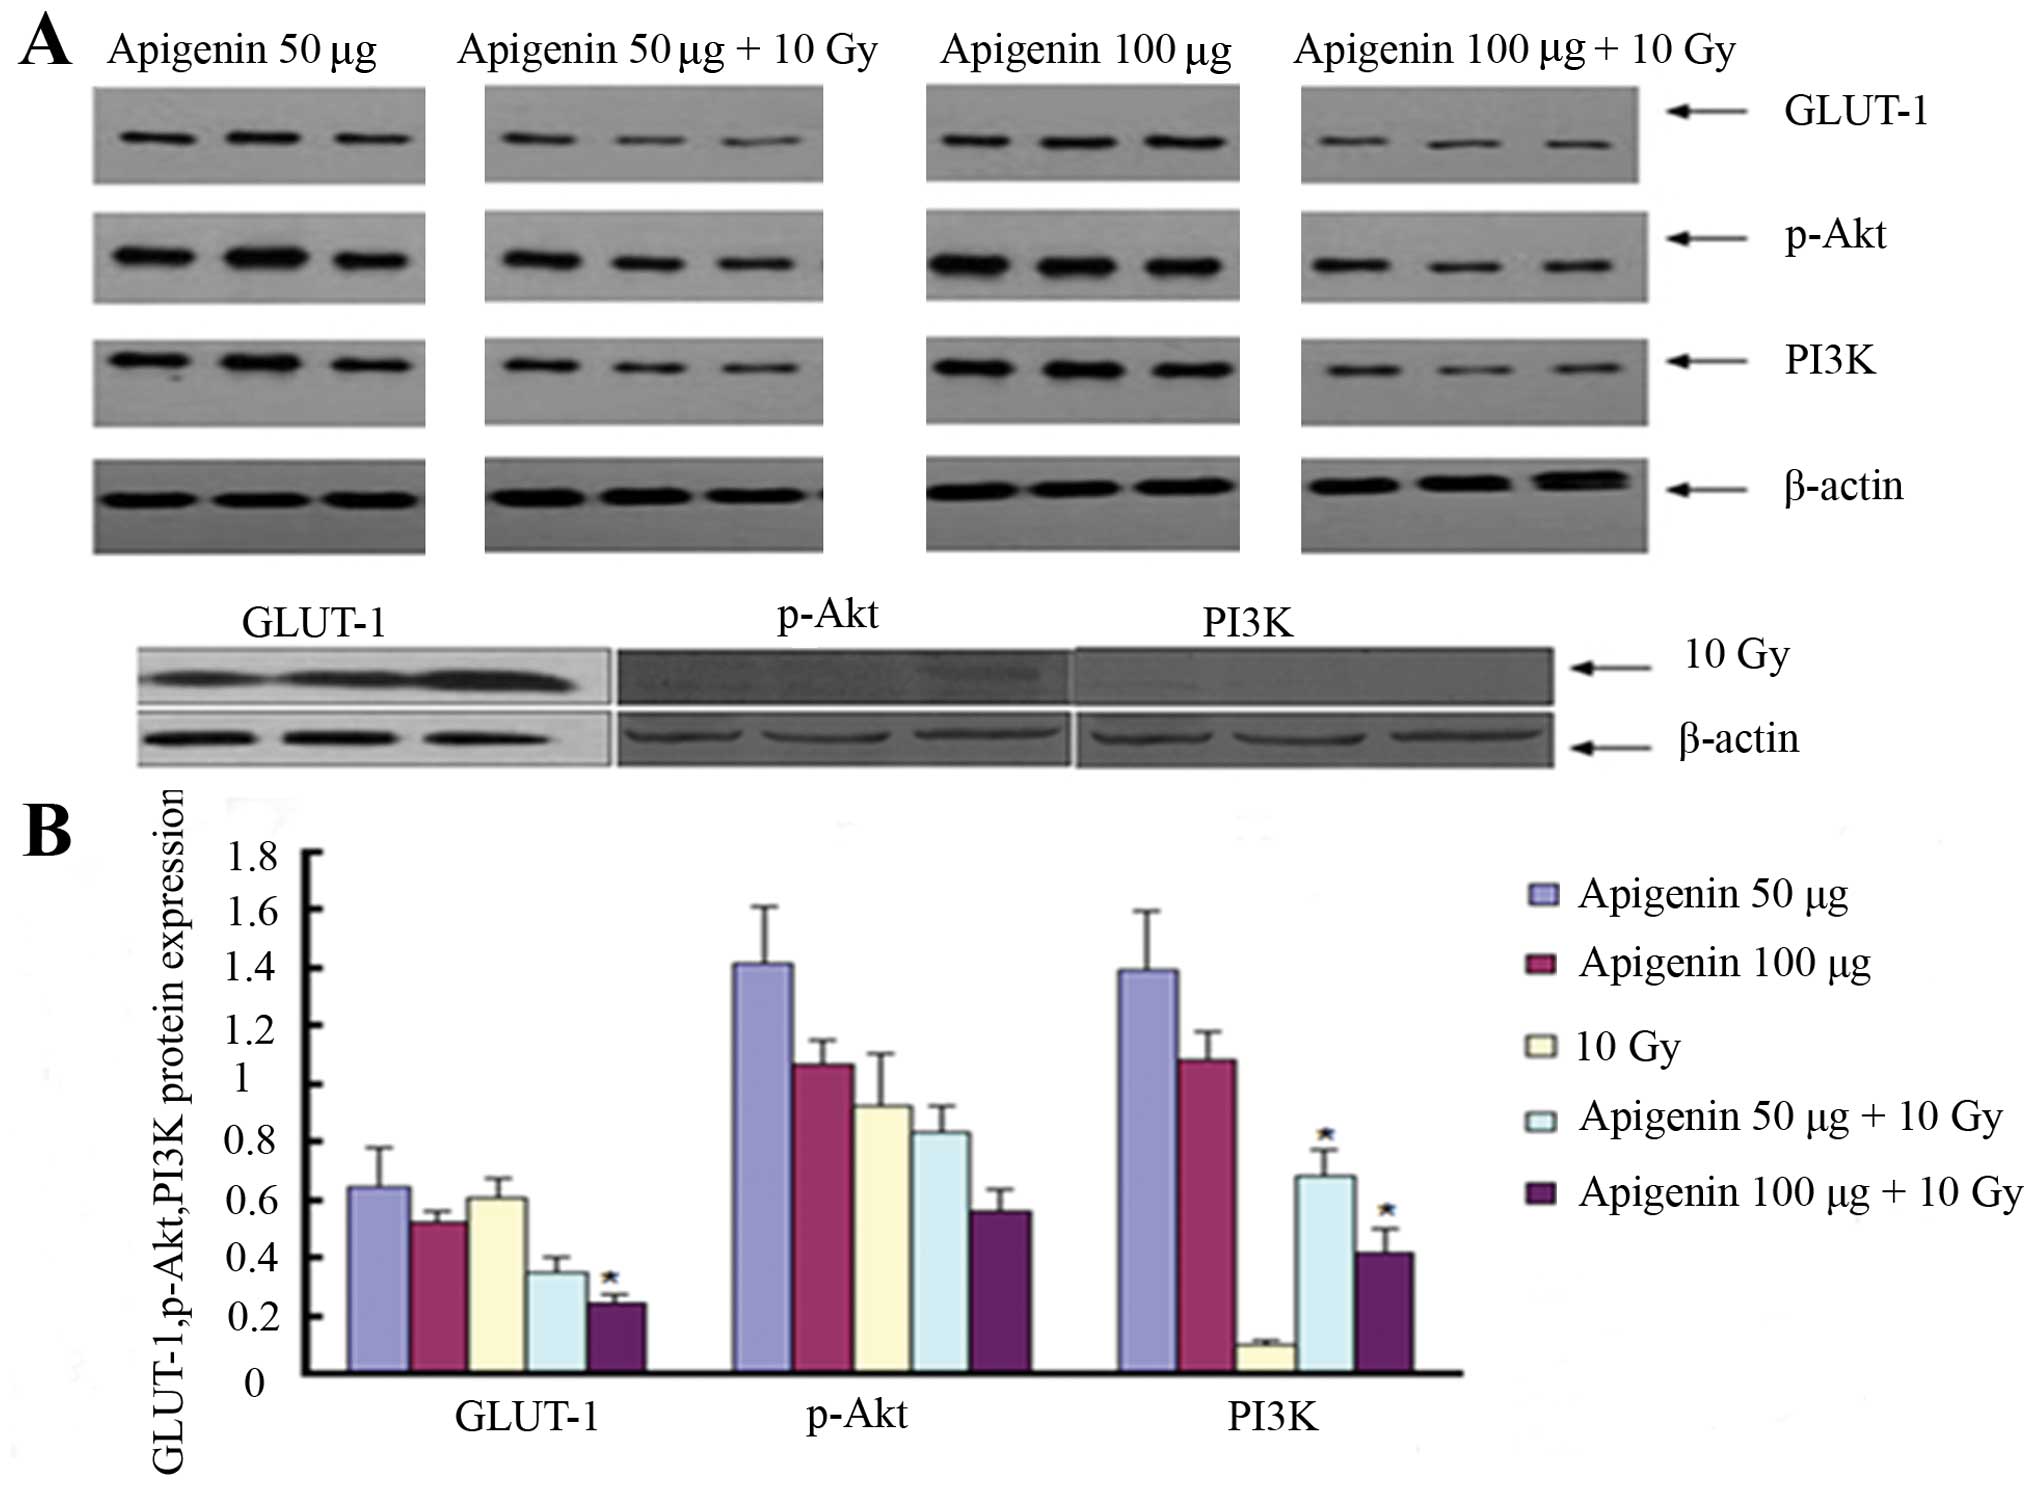
Effects of apigenin and GLUT-1 AS-ODNs
on GLUT-1, p-Akt and PI3K expression
In the first experiment, GLUT-1 expression was
significantly reduced in the 100 µg apigenin plus 10 Gy
group than in the 10 Gy group (P<0.05; Fig. 6). The expression of PI3K was
significantly higher in the 50 and 100 µg apigenin plus 10
Gy groups compared to the 10 Gy X-ray group (P<0.05; Fig. 6). Conversely, the expression of
p-Akt was lower in the 50 and 100 µg apigenin plus 10 Gy
groups, but not significantly (P>0.05). The expression of
GLUT-1, p-Akt and PI3K was lower in the 100 µg apigenin plus
10 Gy group than in the 50 µg apigenin group as well as in
the 100 µg compared to the 50 µg apigenin group,
although not significantly (P>0.05).
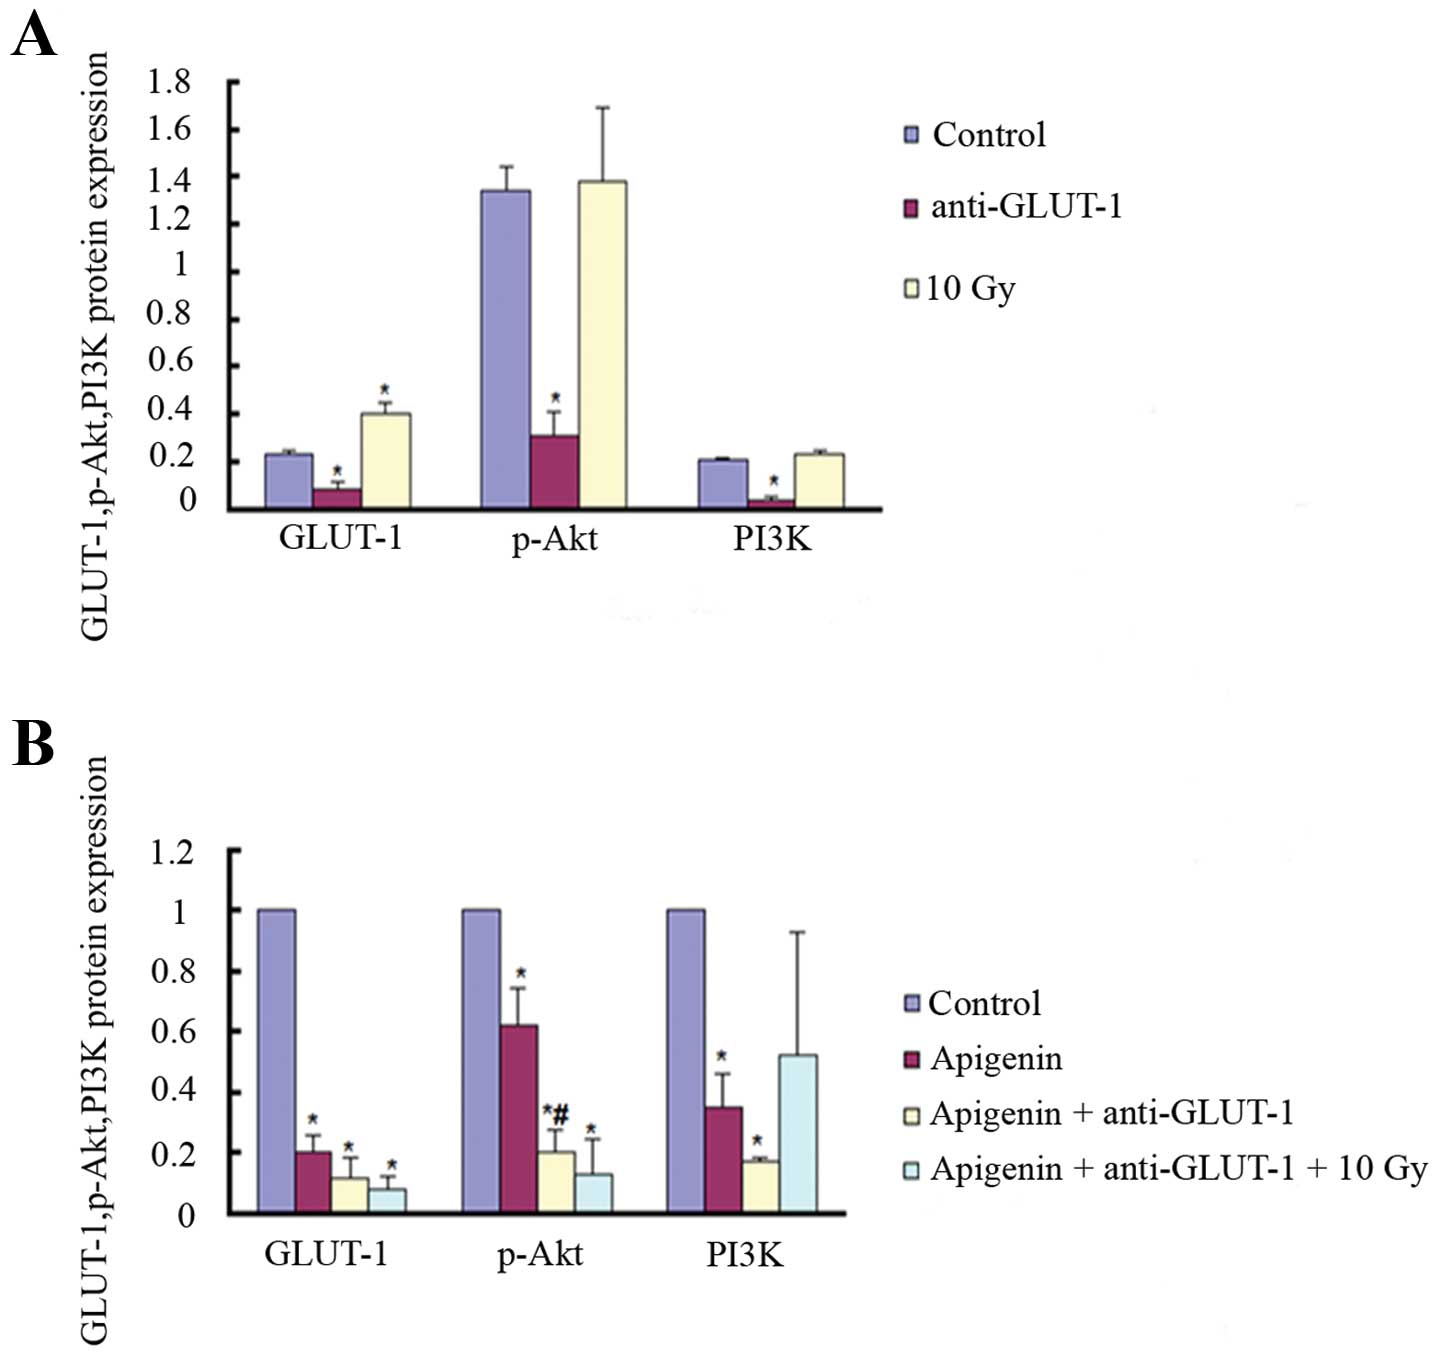
In the second experiment, the expression of GLUT-1,
p-Akt, and PI3K was significantly decreased in the apigenin group,
GLUT-1 AS-ODNs group and apigenin plus GLUT-1 AS-ODNs group
compared to the control group (P<0.05; Fig. 7). The expression of GLUT-1 and p-Akt
was significantly lower in the apigenin plus GLUT-1 AS-ODNs plus 10
Gy group compared to the control group (P<0.05; Fig. 7). The expression of PI3K was also
lower, but not significant (P>0.05). The expression of GLUT-1
was significantly higher in the 10 Gy X-ray group compared to the
control group (P<0.05; Fig. 7).
The expression of p-Akt and PI3K was higher, but not significant
(P>0.05). The expression of p-Akt was significantly lower in the
apigenin plus GLUT-1 AS-ODNs group compared to the apigenin group
(P<0.05; Fig. 7). The expression
of GLUT-1 and PI3K was also lower, although not significant
(P>0.05).
Discussion
Radioresistance is one of the major obstacles in the
treatment of laryngeal carcinoma, however, the mechanism behind the
radioresistance of laryngeal carcinoma remains unclear. We
demonstrated previously that GLUT-1 AS-ODNs inhibit glucose uptake
and proliferation in Hep-2 cells by inhibiting the expression of
GLUT-1 (14). Additional studies
revealed that the overexpression of GLUT-1 mRNA and protein may
play a role in the radioresistance of Hep-2 cells and that GLUT-1
AS-ODNs enhanced the radioresistance of laryngeal carcinoma Hep-2
cells by suppressing the expression of GLUT-1 protein and inducing
tumor cell apoptosis (15). In
vivo, the peritumoral injection of GLUT-1 AS-ODNs may enhance
the radiosensitivity of xenografts by inhibiting GLUT-1 mRNA and
protein expression (15). Previous
findings have shown that the overexpression of GLUT-1 was
associated with tumor radioresistance (34–36).
Therefore, we hypothesized that inhibiting the expression of GLUT-1
may sensitize laryngeal carcinoma to radiotherapy and that GLUT-1
is a therapeutic target in laryngeal carcinoma.
In the second experiment in the present study, the
results revealed that tumor size and weight did not decrease
significantly in the 10 Gy group compared to the control group.
However, GLUT-1 mRNA and protein were significantly higher in the
10 Gy group compared to the control group, which was consistent
with previous studies.
As determined above, the mechanism behind the
radioresistance of laryngeal carcinoma is unclear and likely caused
by an interplay of multiple factors. With the development of
molecular biology-based techniques, the factors that regulate
GLUT-1 have been gradually clarified. Specifically, several
signaling pathways regulate GLUT-1, including the PI3K/Akt pathway.
Melstrom et al (16), Jacobs
et al (37) and Wieman et
al (38) demonstrated that
PI3K/Akt signaling may play a role in the translocation of GLUT-1
from the cytosol to serous membrane, and that activation of the
PI3K/Akt pathway is associated with to GLUT-1 overexpression.
Extensive study has been performed to assess the role of the
PI3K/Akt signaling pathway in radioresistance, which has revealed
that it is associated with three mechanisms of radioresistance:
intrinsic radiation resistance, tumor cell proliferation and
hypoxia (39). Ni et al
found that prostate cancer radioresistance was associated with
activation of the PI3K/Akt/mTOR signaling pathway (22). Consistent with this finding, Chang
et al reported that inhibition of the PI3K/Akt pathway could
increase the radiosensitivity of prostate cancer and induce
apoptosis (24). In addition,
Zhuang et al stated that inhibiting the PI3K/Akt/mTOR
pathway increased the radiosensitivity of malignant gliomas
(23), whereas Kao et al
found that inhibiting PI3K/Akt improved the radiosensitivity of
malignant glioma and decreased the efficiency by which cells repair
DNA damage (26). However, previous
reports have assessed the effect of the PI3K/Akt signaling pathway
on GLUT-1 expression and the mechanism of radioresistance of
laryngeal carcinoma in vivo.
The second experiment in the present study revealed
that GLUT-1 protein expression was higher in the 10 Gy group
compared to the control group (P<0.05; Fig. 7), and p-Akt and PI3K were also
higher in the 10 Gy group, although the increase was not
significant (P>0.05). This suggests that activation of the
PI3K/Akt signaling pathway may play a role in GLUT-1-induced
radioresistance in laryngeal carcinoma.
Apigenin is a natural phytoestrogen flavonoid that
exerts biological effects including anti-oxidative,
anti-inflammatory, antiviral, immune-adjusting, anti-mutation and
anticancer activities (27). Shukla
et al found that apigenin may inhibit the development of
prostate cancer by downregulating the PI3K/Akt/FoxO signaling
pathway (28). In addition, Lee
et al found that apigenin may inhibit the PI3K/Akt pathway
and the function of the integrin-β4 protein to inhibit hepatocyte
growth factor (HGF)-induced invasion and metastasis (29). Zhu et al reported that
apigenin may induce bladder cancer T24 cell apoptosis and
G2/M cell cycle arrest by upregulating Bax and Bad,
activating caspase-3 and PARP, inhibiting the PI3K/Akt pathway and
downregulating the anti-apoptotic proteins Bcl-2 and Bcl-x
(30). Gao et al reported
that apigenin improved the chemosensitivity of BEL-7402/ADM liver
cancer cells to Adriamycin by suppressing the PI3K/Akt/Nrf2 pathway
(31). Melstrom et al
(16) demonstrated that GLUT-1 mRNA
and protein expression decreased in a time- and dose-dependent
manner in apigenin-treated CD-18 and S2-013 human pancreatic cancer
cells, suggesting that apigenin inhibited GLUT-1 expression at the
transcriptional and translational levels. Apigenin also
downregulated the expression of p-Akt. The authors also reported
that GLUT-1 mRNA and protein levels decreased in CD-18 and S2-013
cells treated with the PI3K inhibitors Wortmannin and LY294002.
Therefore, apigenin may decrease GLUT-1 expression by suppressing
the PI3K/Akt pathway, thereby inhibiting glucose uptake and
inducing apoptosis in pancreatic cancer cells (16). We demonstrated previously that the
chemoresistance of Hep-2 laryngeal carcinoma cells to cisplatin is
associated with the expression of GLUT-1 and PI3K/Akt signaling and
that apigenin may increase the sensitivity of laryngeal carcinoma
to cisplatin by inhibiting GLUT-1 and p-Akt expression (32). Therefore, we hypothesized that
apigenin may improve the radiosensitivity of laryngeal carcinoma
xenografts by inhibiting GLUT-1 expression and suppressing PI3K/Akt
signaling and that apigenin could improve the effects of GLUT-1
AS-ODNs in xenografts.
In the first experiment of the present study before
X-ray radiation (the 10 Gy group was equivalent to the control
group), 100 µg apigenin reduced tumor size significantly
compared to the 10 Gy group 12 days after treatment (P<0.05). In
addition, 50 µg and 100 µg apigenin reduced tumor
size significantly compared to the 10 Gy group 19 days after
treatment (P<0.05), suggesting that apigenin inhibited xenograft
tumor growth. After X-ray radiation, 100 µg apigenin plus 10
Gy reduced tumor size significantly compared to the 10 Gy group 27
days after treatment (P<0.05), suggesting that apigenin
sensitized the xenografts to radiotherapy.
However, in the second experiment, apigenin reduced
tumor size compared to the control group, although not
significantly (P>0.05), which may have been due to the different
apigenin dosing intervals used in the two experiments. GLUT-1
AS-ODNs reduced tumor size significantly compared to the control
group 17 days after treatment (P<0.05). In addition, GLUT-1
AS-ODNs, apigenin plus GLUT-1 AS-ODNs and apigenin plus GLUT-1
AS-ODNs plus 10 Gy reduced tumor size significantly compared to the
control 24 days after treatment (P<0.05), suggesting that these
treatments inhibited xenograft tumor growth. In addition, apigenin,
GLUT-1 AS-ODNs, 10 Gy X-ray radiation, apigenin plus GLUT-1 AS-ODNs
and apigenin plus GLUT-1 AS-ODNs plus 10 Gy X-ray radiation all
increased tumor cell apoptosis, as detected using TUNEL staining.
Apigenin plus GLUT-1 AS-ODNs also enhanced the effect of apigenin
or GLUT-1 AS-ODNs alone on tumor cell apoptosis significantly.
Apigenin plus GLUT-1 AS-ODNs significantly enhanced the effects of
X-ray radiation on tumor cell apoptosis. Collectively, these
results suggest that apigenin and GLUT-1 AS-ODNs inhibited
laryngeal carcinoma growth. The combination of apigenin and GLUT-1
AS-ODNs enhanced the effects of apigenin or GLUT-1 AS-ODNs alone.
In addition, apigenin and apigenin plus GLUT-1 AS-ODNs improved the
radiosensitivity of laryngeal carcinoma.
We investigated the molecular mechanisms by which
apigenin and GLUT-1 AS-ODNs enhanced the radiosensitivity and
suppressed xenograft tumor growth. The expression of GLUT-1,
Akt and PI3K mRNA was significantly lower in the 100
µg apigenin and GLUT-1 AS-ODNs groups compared to the
control group. In addition, the combination of apigenin plus GLUT-1
AS-ODNs significantly enhanced the effects of apigenin or GLUT-1
AS-ODNs alone on inhibiting the expression of GLUT-1 or
PI3K mRNA. The expression of GLUT-1, Akt and
PI3K mRNA was significantly lower in the apigenin plus
GLUT-1 AS-ODNs plus 10 Gy group compared to the 10 Gy group. In
addition, although the GLUT-1 expression was lower in the
100 µg apigenin plus 10 Gy group compared to the 10 Gy
group, the levels of GLUT-1, Akt and PI3K mRNA
were higher in the 50 µg apigenin plus 10 Gy group compared
to the 10 Gy group. It is possible that apigenin is not a specific
inhibitor of the PI3K/Akt signaling pathway or that these effects
were caused by the injection dose or dosing methods used. We found
similar results at the protein level.
In conclusion, the overexpression of GLUT-1 and
increased activation of the PI3K/Akt signaling pathway may be
involved in the radioresistance of laryngeal carcinoma in
vivo. The effects of apigenin on inhibiting xenograft growth
and enhancing xenograft radiosensitivity may be associated with
suppressing the expression of GLUT-1 via the PI3K/Akt pathway. In
addition, apigenin may enhance the effects of GLUT-1 AS-ODNs via
the same mechanism.
Abbreviations:
|
AS-ODNs
|
antisense oligonucleotides
|
|
GLUT-1
|
glucose transporter-1
|
Acknowledgments
The present study was supported by the Traditional
Chinese Medicine Scientific Research Project of Zhejiang Province,
China (grant no. 2013ZA075), Health Department of Zhejiang
Province, China (grant no. 2015116850), and the National Natural
Science Foundation of China (grant nos. 81172562 and 81372903).
References
|
1
|
Karlsson TR, Al-Azzawe M, Aziz L, Hurman D
and Finizia C: Survival outcome depending on different treatment
strategies in advanced stages III and IV laryngeal cancers: An
audit of data from two European centres. Eur Arch Otorhinolaryngol.
271:547–554. 2014. View Article : Google Scholar
|
|
2
|
Haapaniemi A, Koivunen P, Saarilahti K,
Kinnunen I, Laranne J, Aaltonen LM, Närkiö M, Lindholm P, Grénman
R, Mäkitie A, et al The Finnish Head and Neck Oncology Working
Group: Laryngeal cancer in Finland: A 5-year follow-up study of 366
patients. Head Neck. 00:00. 2014.
|
|
3
|
Siegel R, Ma J, Zou Z and Jemal A: Cancer
statistics, 2014. CA Cancer J Clin. 64:9–29. 2014. View Article : Google Scholar : PubMed/NCBI
|
|
4
|
Nichols AC, Whelan F, Basmaji J, Dhaliwal
S, Dowthwaite S, Chapeskie C, Read N, Palma DA, Fung K, Venkatesan
V, et al: Ki-67 expression predicts radiotherapy failure in early
glottic cancer. J Otolaryngol Head Neck Surg. 41:124–130.
2012.PubMed/NCBI
|
|
5
|
Nix P, Cawkwell L, Patmore H, Greenman J
and Stafford N: Bcl-2 expression predicts radiotherapy failure in
laryngeal cancer. Br J Cancer. 92:2185–2189. 2005. View Article : Google Scholar : PubMed/NCBI
|
|
6
|
Yoshida K, Sasaki R, Nishimura H, Okamoto
Y, Suzuki Y, Kawabe T, Saito M, Otsuki N, Hayashi Y, Soejima T, et
al: Nuclear factor-kappaB expression as a novel marker of
radioresistance in early-stage laryngeal cancer. Head Neck.
32:646–655. 2010.
|
|
7
|
Bussink J, van der Kogel AJ and Kaanders
JH: Activation of the PI3-K/AKT pathway and implications for
radioresistance mechanisms in head and neck cancer. Lancet Oncol.
9:288–296. 2008. View Article : Google Scholar : PubMed/NCBI
|
|
8
|
Jonathan RA, Wijffels KI, Peeters W, de
Wilde PC, Marres HA, Merkx MA, Oosterwijk E, van der Kogel AJ and
Kaanders JH: The prognostic value of endogenous hypoxia-related
markers for head and neck squamous cell carcinomas treated with
ARCON. Radiother Oncol. 79:288–297. 2006. View Article : Google Scholar : PubMed/NCBI
|
|
9
|
Hoogsteen IJ, Marres HA, Bussink J, van
der Kogel AJ and Kaanders JH: Tumor microenvironment in head and
neck squamous cell carcinomas: Predictive value and clinical
relevance of hypoxic markers. A review. Head Neck. 29:591–604.
2007. View Article : Google Scholar : PubMed/NCBI
|
|
10
|
Bussink J, Kaanders JH and van der Kogel
AJ: Tumor hypoxia at the micro-regional level: Clinical relevance
and predictive value of exogenous and endogenous hypoxic cell
markers. Radiother Oncol. 67:3–15. 2003. View Article : Google Scholar : PubMed/NCBI
|
|
11
|
Airley R, Loncaster J, Davidson S, Bromley
M, Roberts S, Patterson A, Hunter R, Stratford I and West C:
Glucose transporter glut-1 expression correlates with tumor hypoxia
and predicts metastasis-free survival in advanced carcinoma of the
cervix. Clin Cancer Res. 7:928–934. 2001.PubMed/NCBI
|
|
12
|
Luo XM, Zhou SH and Fan J: Glucose
transporter-1 as a new therapeutic target in laryngeal carcinoma. J
Int Med Res. 38:1885–1892. 2010. View Article : Google Scholar
|
|
13
|
Rademakers SE, Lok J, van der Kogel AJ,
Bussink J and Kaanders JH: Metabolic markers in relation to
hypoxia; staining patterns and colocalization of pimonidazole,
HIF-1α, CAIX, LDH-5, GLUT-1, MCT1 and MCT4. BMC Cancer. 11:167–176.
2011. View Article : Google Scholar
|
|
14
|
Zhou SH, Fan J, Chen XM, Cheng KJ and Wang
SQ: Inhibition of cell proliferation and glucose uptake in human
laryngeal carcinoma cells by antisense oligonucleotides against
glucose transporter-1. Head Neck. 31:1624–1633. 2009. View Article : Google Scholar : PubMed/NCBI
|
|
15
|
Yan SX, Luo XM, Zhou SH, Bao YY, Fan J, Lu
ZJ, Liao XB, Huang YP, Wu TT and Wang QY: Effect of antisense
oligodeoxynucleotides glucose transporter-1 on enhancement of
radiosensitivity of laryngeal carcinoma. Int J Med Sci.
10:1375–1386. 2013. View Article : Google Scholar : PubMed/NCBI
|
|
16
|
Melstrom LG, Salabat MR, Ding XZ, Milam
BM, Strouch M, Pelling JC and Bentrem DJ: Apigenin inhibits the
GLUT-1 glucose transporter and the phosphoinositide 3-kinase/Akt
pathway in human pancreatic cancer cells. Pancreas. 37:426–431.
2008. View Article : Google Scholar : PubMed/NCBI
|
|
17
|
Suh HN and Han HJ: Fibronectin-induced
VEGF receptor and calcium channel transactivation stimulate GLUT-1
synthesis and trafficking through PPARγ and TC10 in mouse embryonic
stem cells. Stem Cell Res (Amst). 10:371–386. 2013. View Article : Google Scholar
|
|
18
|
Zhao K, Yang SY, Zhou SH, Dong MJ, Bao YY
and Yao HT: Fluorodeoxyglucose uptake in laryngeal carcinoma is
associated with the expression of glucose transporter-1 and
hypoxia-inducible-factor-1α and the phosphoinositide
3-kinase/protein kinase B pathway. Oncol Lett. 7:984–990.
2014.PubMed/NCBI
|
|
19
|
Gonnella R, Santarelli R, Farina A,
Granato M, D'Orazi G, Faggioni A and Cirone M: Kaposi sarcoma
associated herpesvirus (KSHV) induces AKT hyperphosphorylation,
bortezomib-resistance and GLUT-1 plasma membrane exposure in THP-1
monocytic cell line. J Exp Clin Cancer Res. 32:792013. View Article : Google Scholar :
|
|
20
|
Heavey S, O'Byrne KJ and Gately K:
Strategies for co-targeting the PI3K/AKT/mTOR pathway in NSCLC.
Cancer Treat Rev. 40:445–456. 2014. View Article : Google Scholar
|
|
21
|
Kaidar-Person O, Lai C, Kuten A and
Belkacemi Y; AROME: 'The Infinite Maze̓ of breast cancer, signaling
pathways and radioresistance. Breast. 22:411–418. 2013. View Article : Google Scholar : PubMed/NCBI
|
|
22
|
Ni J, Cozzi P, Hao J, Beretov J, Chang L,
Duan W, Shigdar S, Delprado W, Graham P, Bucci J, et al: Epithelial
cell adhesion molecule (EpCAM) is associated with prostate cancer
metastasis and chemo/radioresistance via the PI3K/Akt/mTOR
signaling pathway. Int J Biochem Cell Biol. 45:2736–2748. 2013.
View Article : Google Scholar : PubMed/NCBI
|
|
23
|
Zhuang W, Qin Z and Liang Z: The role of
autophagy in sensitizing malignant glioma cells to radiation
therapy. Acta Biochim Biophys Sin (Shanghai). 41:341–351. 2009.
View Article : Google Scholar
|
|
24
|
Chang L, Graham PH, Hao J, Ni J, Bucci J,
Cozzi PJ, Kearsley JH and Li Y: Acquisition of
epithelial-mesenchymal transition and cancer stem cell phenotypes
is associated with activation of the PI3K/Akt/mTOR pathway in
prostate cancer radioresistance. Cell Death Dis. 4:e8752013.
View Article : Google Scholar : PubMed/NCBI
|
|
25
|
Carón RW, Yacoub A, Zhu X, Mitchell C, Han
SI, Sasazuki T, Shirasawa S, Hagan MP, Grant S and Dent P: H-RAS
V12-induced radioresistance in HCT116 colon carcinoma cells is
heregulin dependent. Mol Cancer Ther. 4:243–255. 2005.PubMed/NCBI
|
|
26
|
Kao GD, Jiang Z, Fernandes AM, Gupta AK
and Maity A: Inhibition of phosphatidylinositol-3-OH kinase/Akt
signaling impairs DNA repair in glioblastoma cells following
ionizing radiation. J Biol Chem. 282:21206–21212. 2007. View Article : Google Scholar : PubMed/NCBI
|
|
27
|
Bao YY, Zhou SH, Fan J and Wang QY:
Anticancer mechanism of apigenin and the implications of GLUT-1
expression in head and neck cancers. Future Oncol. 9:1353–1364.
2013. View Article : Google Scholar : PubMed/NCBI
|
|
28
|
Shukla S, Bhaskaran N, Babcook MA, Fu P,
Maclennan GT and Gupta S: Apigenin inhibits prostate cancer
progression in TRAMP mice via targeting PI3K/Akt/FoxO pathway.
Carcinogenesis. 35:452–460. 2014. View Article : Google Scholar :
|
|
29
|
Lee WJ, Chen WK, Wang CJ, Lin WL and Tseng
TH: Apigenin inhibits HGF-promoted invasive growth and metastasis
involving blocking PI3K/Akt pathway and beta 4 integrin function in
MDA-MB-231 breast cancer cells. Toxicol Appl Pharmacol.
226:178–191. 2008. View Article : Google Scholar
|
|
30
|
Zhu Y, Mao Y, Chen H, Lin Y, Hu Z, Wu J,
Xu X, Xu X, Qin J and Xie L: Apigenin promotes apoptosis, inhibits
invasion and induces cell cycle arrest of T24 human bladder cancer
cells. Cancer Cell Int. 13:542013. View Article : Google Scholar : PubMed/NCBI
|
|
31
|
Gao AM, Ke ZP, Wang JN, Yang JY, Chen SY
and Chen H: Apigenin sensitizes doxorubicin-resistant
hepatocellular carcinoma BEL-7402/ADM cells to doxorubicin via
inhibiting PI3K/Akt/Nrf2 pathway. Carcinogenesis. 34:1806–1814.
2013. View Article : Google Scholar : PubMed/NCBI
|
|
32
|
Xu YY, Wu TT, Zhou SH, Bao YY, Wang QY,
Fan J and Huang YP: Apigenin suppresses GLUT-1 and p-AKT expression
to enhance the chemosensitivity to cisplatin of laryngeal carcinoma
Hep-2 cells: An in vitro study. Int J Clin Exp Pathol. 7:3938–3947.
2014.PubMed/NCBI
|
|
33
|
Shukla S and Gupta S: Apigenin-induced
cell cycle arrest is mediated by modulation of MAPK, PI3K-Akt, and
loss of cyclin D1 associated retinoblastoma dephosphorylation in
human prostate cancer cells. Cell Cycle. 6:1102–1114. 2007.
View Article : Google Scholar : PubMed/NCBI
|
|
34
|
Huang XQ, Chen X, Xie XX, Zhou Q, Li K, Li
S, Shen LF and Su J: Co-expression of CD147 and GLUT-1 indicates
radiation resistance and poor prognosis in cervical squamous cell
carcinoma. Int J Clin Exp Pathol. 7:1651–1666. 2014.PubMed/NCBI
|
|
35
|
Kunkel M, Moergel M, Stockinger M, Jeong
JH, Fritz G, Lehr HA and Whiteside TL: Overexpression of GLUT-1 is
associated with resistance to radiotherapy and adverse prognosis in
squamous cell carcinoma of the oral cavity. Oral Oncol. 43:796–803.
2007. View Article : Google Scholar : PubMed/NCBI
|
|
36
|
Doki Y, Takachi K, Ishikawa O, Sasaki Y,
Miyashiro I, Ohigashi H, Yano M, Ishihara R, Tsukamoto Y, Nishiyama
K, et al: Reduced tumor vessel density and high expression of
glucose transporter 1 suggest tumor hypoxia of squamous cell
carcinoma of the esophagus surviving after radiotherapy. Surgery.
137:536–544. 2005. View Article : Google Scholar : PubMed/NCBI
|
|
37
|
Jacobs SR, Herman CE, Maciver NJ, Wofford
JA, Wieman HL, Hammen JJ and Rathmell JC: Glucose uptake is
limiting in T cell activation and requires CD28-mediated
Akt-dependent ad independent pathways. J Immunol. 180:4476–4486.
2008. View Article : Google Scholar : PubMed/NCBI
|
|
38
|
Wieman HL, Wofford JA and Rathmell JC:
Cytokine stimulation promotes glucose uptake via
phosphatidylinositol-3 kinase/Akt regulation of Glut1 activity and
trafficking. Mol Biol Cell. 18:1437–1446. 2007. View Article : Google Scholar : PubMed/NCBI
|
|
39
|
Schuurbiers OC, Kaanders JH, van der
Heijden HF, Dekhuijzen RP, Oyen WJ and Bussink J: The
PI3-K/AKT-pathway and radiation resistance mechanisms in non-small
cell lung cancer. J Thorac Oncol. 4:761–767. 2009. View Article : Google Scholar : PubMed/NCBI
|