Introduction
Yes-associated protein (YAP), along with the
transcriptional co-activator TAZ, is a main downstream effector of
the Hippo pathway, which regulates tissue homeostasis, organ size,
regeneration and tumorigenesis (1).
In mammalian systems, the Hippo pathway is composed of the core
kinase complexes mammalian Ste2-like kinases 1/2 and large tumor
suppressor kinases 1/2 (2). The
main function of the Hippo pathway is to negatively regulate the
activity of YAP and TAZ, to promote cellular proliferation, and to
induce anti-apoptotic genes via interactions with various
transcription factors (2–4). When the Hippo pathway is active, the
inhibitory mammalian Ste2-like kinases/large tumor suppressor
kinases phosphorylate YAP and TAZ. Phosphorylation leads to nuclear
exclusion of YAP and TAZ. Then, YAP and TAZ are sequestered and
subjected to proteasomal degradation in the cytoplasm; also, gene
expression of YAP- and TAZ-driven molecules is suppressed (4,5).
Overexpression of YAP1 has been found in various
types of cancers (6–9), and may lead to oncogenic
transformation of immortalized epithelial cells (10). The expression and role of YAP1 in
cancer is cell type-dependent (11,12).
Overexpression of YAP was observed in 62% of hepatocellular
carcinomas and 72.6% of colorectal cancers, and was found to be an
independent predictor associated with poor disease-free survival
and overall survival (13). In
66.3% of non-small cell lung cancers, YAP was found to be
overexpressed, and was associated with reduced overall survival
(14). Several studies reported
that YAP1 is overexpressed in ovarian cancer (6) and acts as an oncogene (15). Zhang et al reported that high
levels of nuclear YAP1 correlate with poor prognosis in ovarian
cancer patients with clear cell carcinoma (15). Another study showed that YAP1 is
highly expressed in serous/endometrioid cystadenocarcinomas, and is
positively associated with patient prognosis (16). However, the role of YAP1 as an
oncogene has not yet been fully investigated in a large group of
ovarian serous cystadenocarcinoma (OSC) patients, who account for
the largest proportion of malignant ovarian cancer cases (17,18).
Therefore, in the present study, we investigated the expression of
YAP1 and determined its clinical significance in OSC.
Materials and methods
Gene expression profiles
Level 3 mRNA expression data from 8 normal and 590
OSC samples were obtained from the TCGA data portal (https://tcga-data.nci.nih.gov/tcga/).
Analysis of mRNA microarray data
The raw data was initially analyzed using R software
(v.3.2.5; http://www.r-project.org/). The chip
data was normalized using the RankNormalize module in GenePattern
(http://www.broadinstitute.org/cancer/software/genepattern).
GeneNeighbors and ClassNeighbors, modules programmed in GenePattern
(http://www.broadinstitute.org/cancer/software/genepattern),
were used to select genes closely related to YAP1 (19). cBioportal (http://www.cbioportal.org/) was also used to analyze
cross-cancer alterations in YAP1.
Functional enrichment analysis
The DEGs were imported into the Database for
Annotation, Visualization and Integrated Discovery (http://david.abcc.ncifcrf.gov/) (20) in order to perform Gene Ontology (GO)
functional enrichment analysis. Gene set enrichment analysis (GSEA)
was used to enrich the mRNAs predicted to have a correlation with
pathway in C2, curated gene set enrichment analysis (21,22).
GO analysis encompasses 3 domains: biological processes, cellular
components and molecular functions. P<0.05 was considered to
indicate statistical significance.
Statistical analysis
The distributions of characteristics between the 2
groups were compared using the t-test for continuous variables (or
the Kolmogorov-Smirnov test when the expected frequency within any
cell was <5), and the χ2 test (or Fisher's exact test
when the expected frequency within any cell was <5) for
categorical variables. The distributions of characteristics between
3 or more groups were compared using ANOVA. Cumulative event
(death) rate was calculated by the Kaplan-Meier method, using the
time to the first event as the outcome variable. Probability of and
calculated risk for recurrence were determined by actuarial
analysis. The criteria for statistical analysis were date of
operation and date of death. Survival curves were compared by the
log-rank test for various recurrence factors and Cox's model for
multivariate analysis. A P-value of<0.05 was considered
statistically significant. Statistical analyses were performed
using the Prism 5.0 software (GraphPad Prism Software, La Jolla,
CA, USA), and the Statistical Package for Social Sciences for
Windows (SPSS, Inc., Chicago, IL, USA).
Results
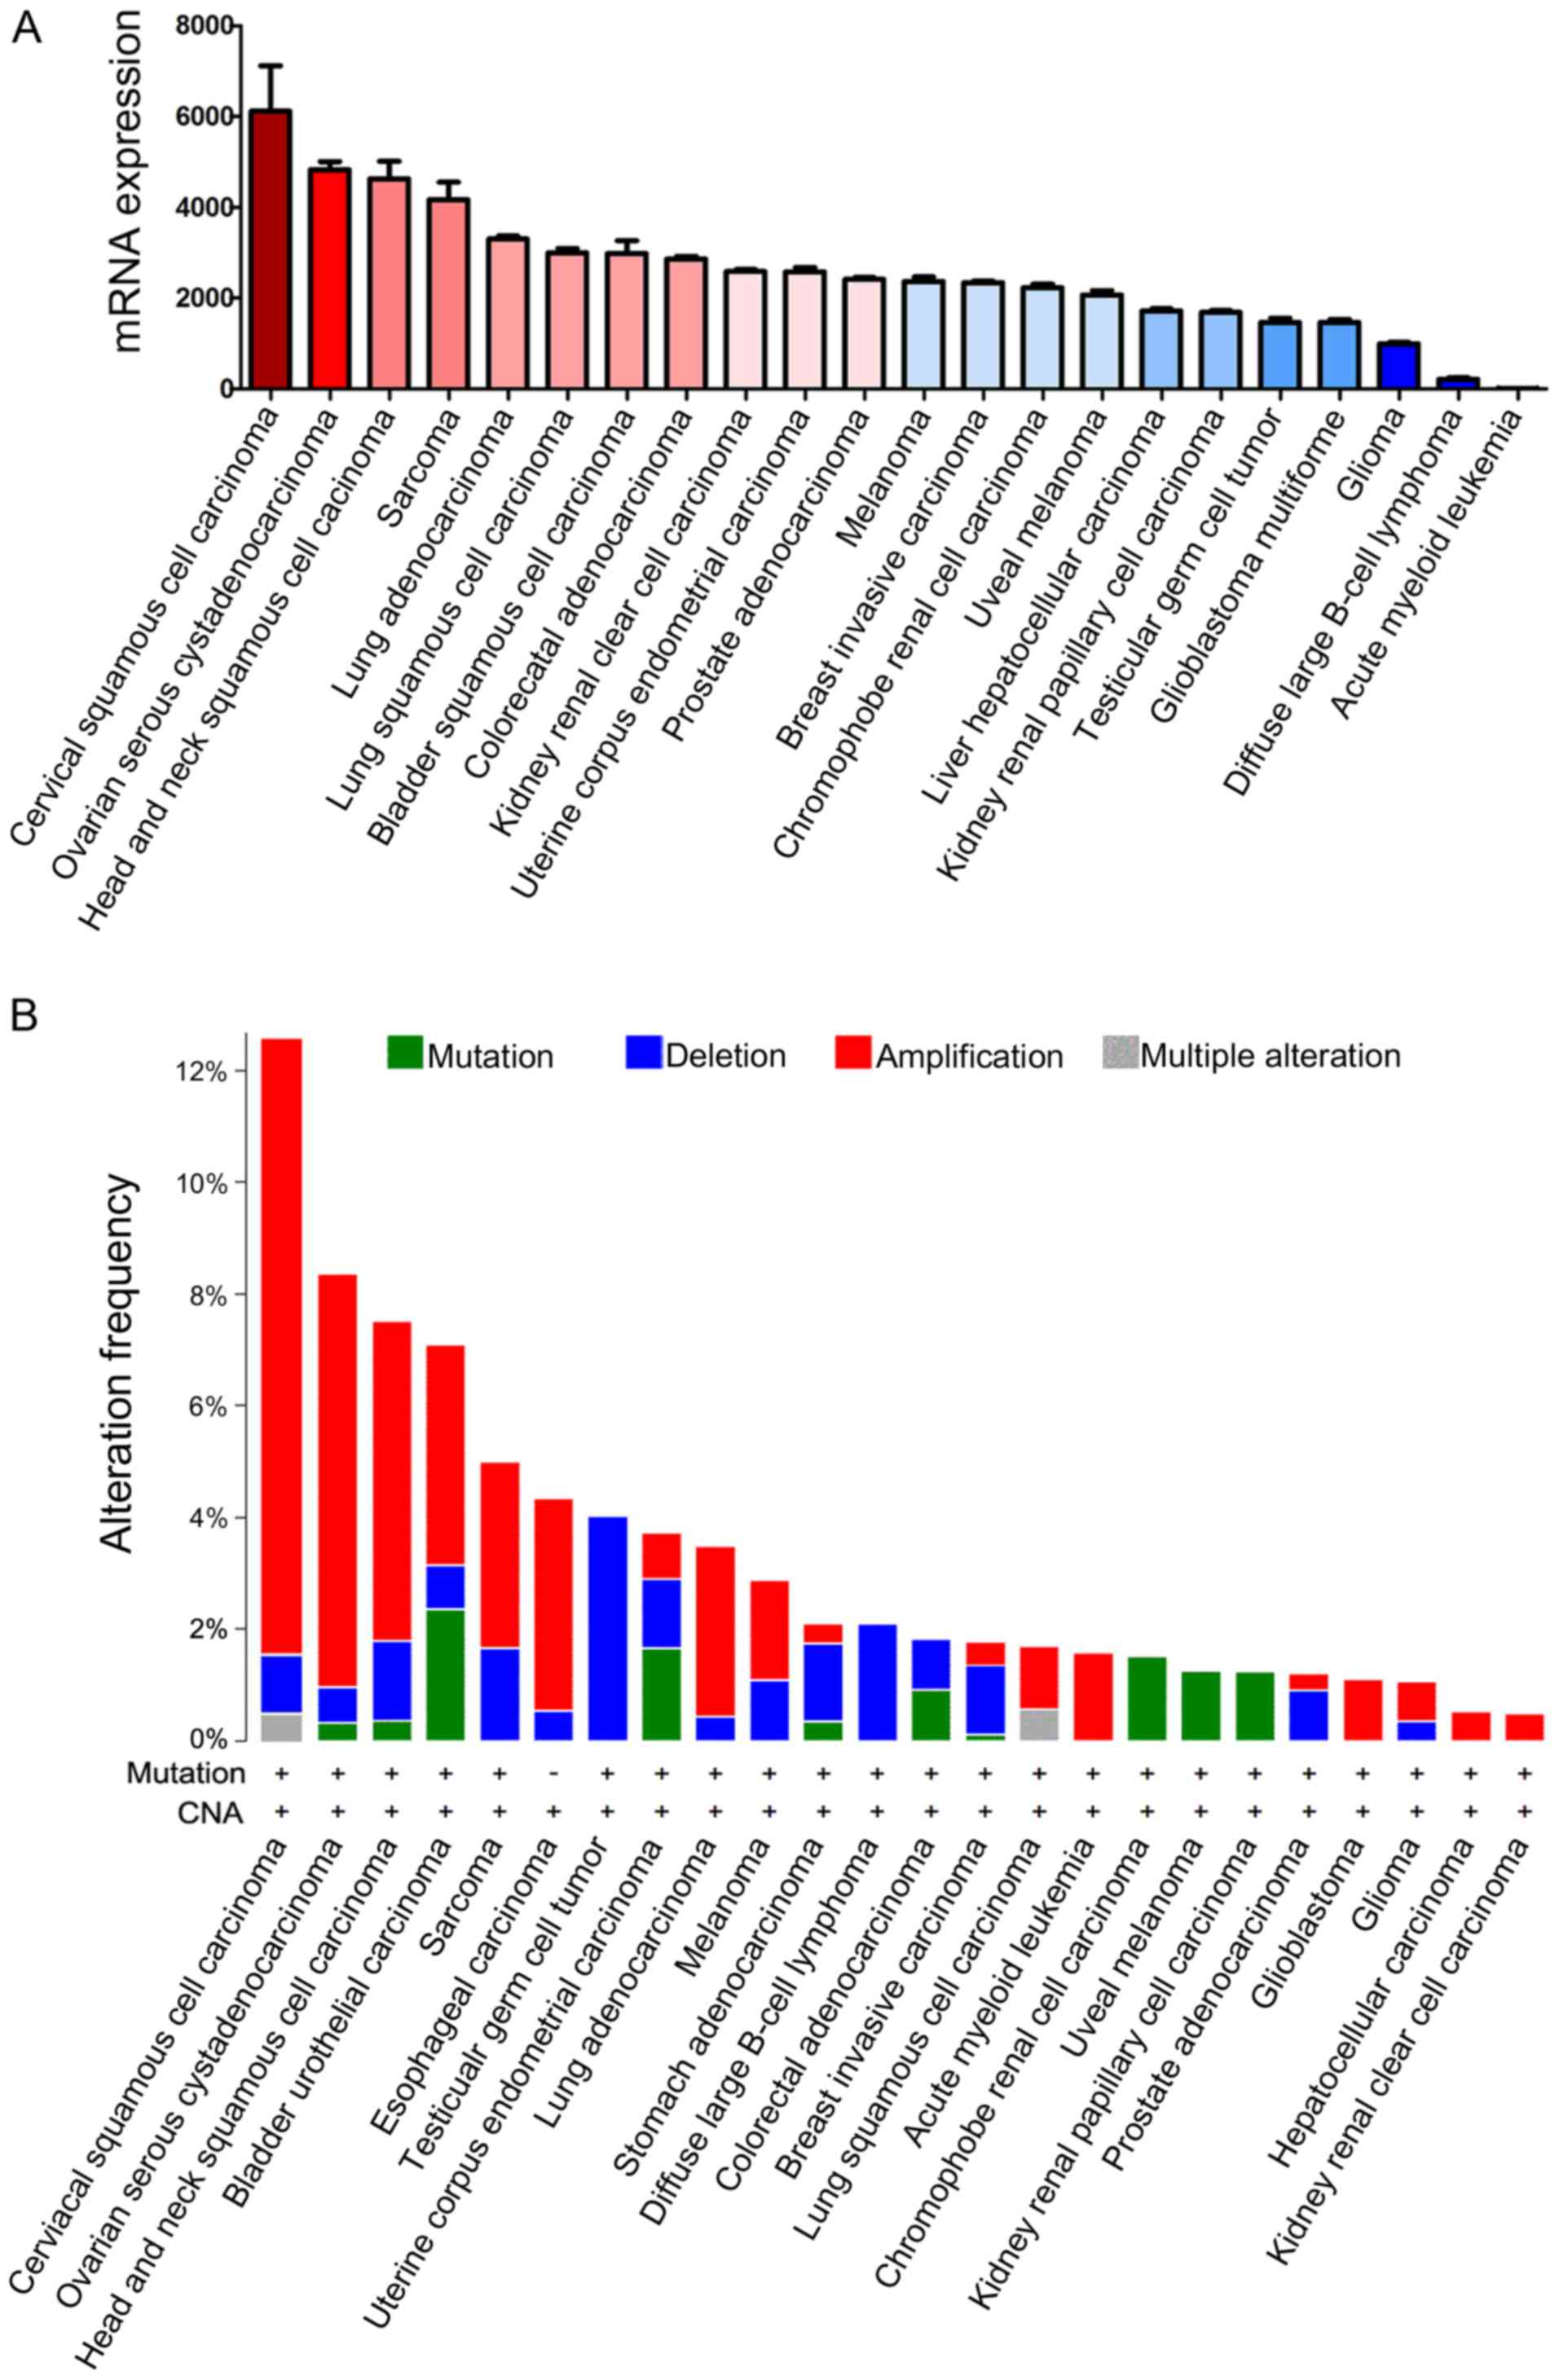
Cross-cancer mRNA expression and
alterations in the YAP1 gene
YAP1 mRNA expression in cases of OSC was higher than
in 21 other cancer types recorded in the TCGA database. mRNA
expression of YAP1 was lowest in acute myeloid leukemia (Fig. 1). Cross-cancer alteration was
investigated in 21 types of cancer, and YAP1 expression in OSC was
the greatest among the 21 types of cancers recorded in the
TCGA.
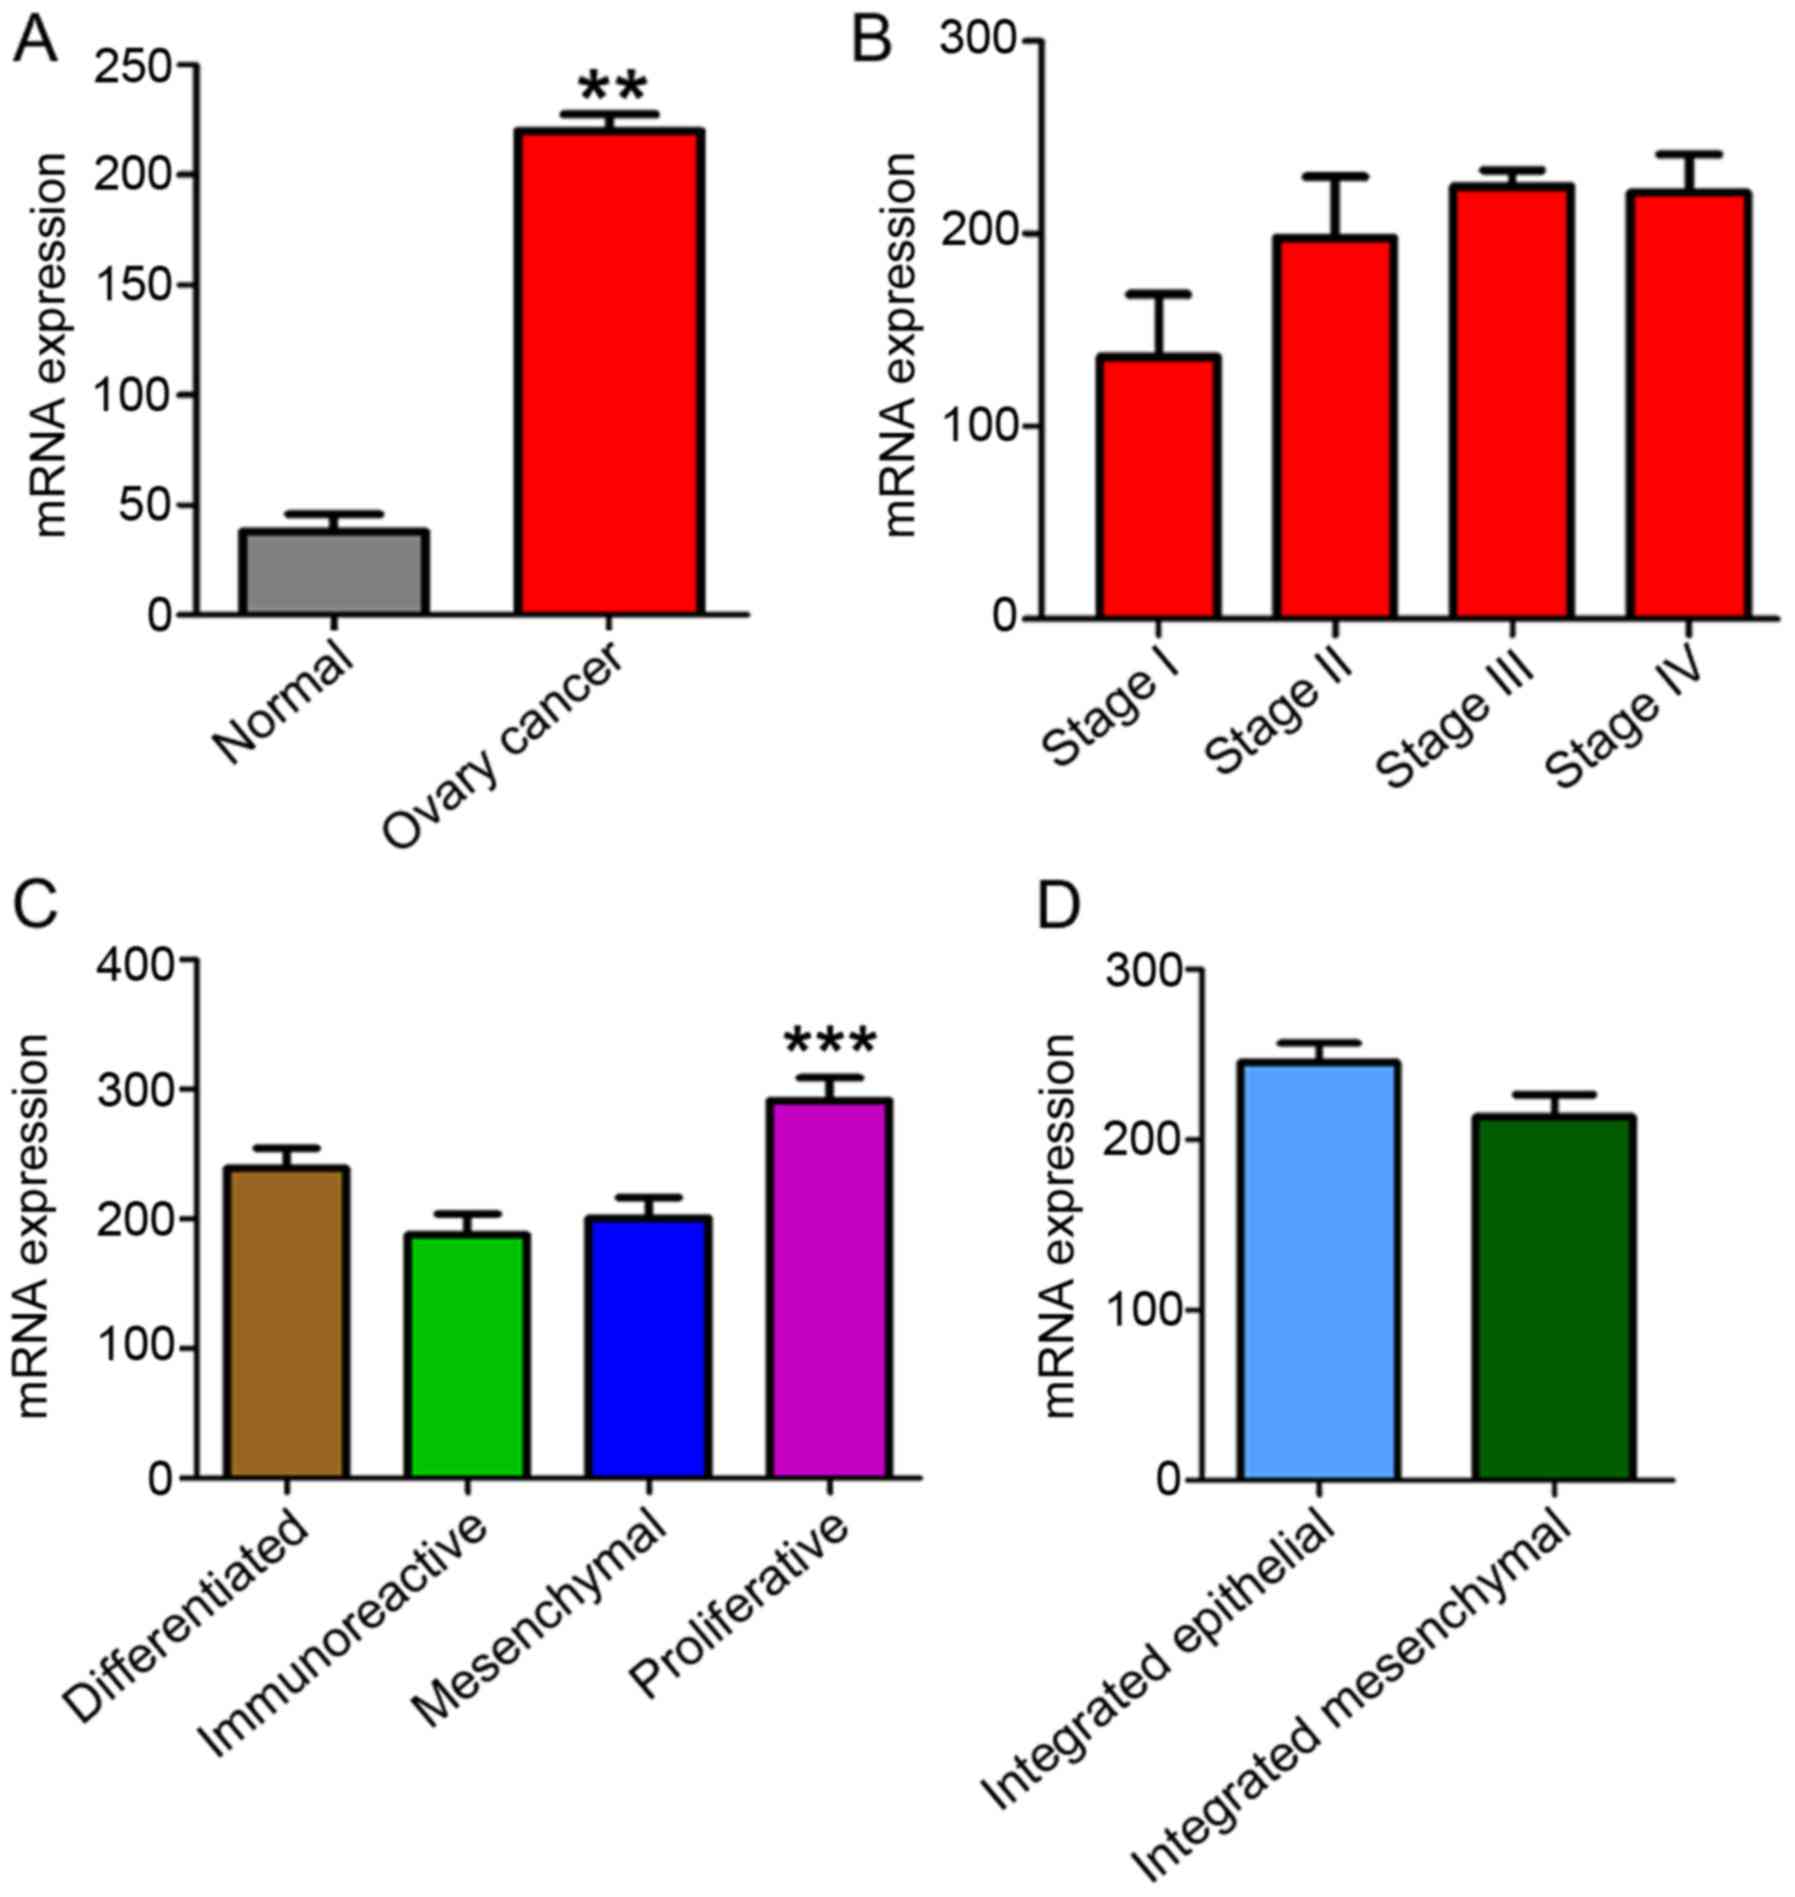
YAP1 mRNA expression in OSC
The present study examined YAP1 mRNA expression in
OSC compared with 8 normal control samples (Fig. 2). Clinicopathological information of
the patients is shown in Table I.
YAP1 mRNA expression was significantly higher in cases of OSC
compared to normal controls (Fig.
2A). YAP1 mRNA expression was higher in stages III and IV
compared to earlier stages (Fig.
2B). When comparing YAP1 mRNA expression in 4 subtypes of
ovarian cancer, differentiated, immunoreactive, mesenchymal and
proliferative, and in 2 subtypes of ovarian cancer, integrated
mesenchymal and epithelial subtypes (23,24),
YAP1 mRNA expression in the proliferative subtype was significantly
higher than that in the differentiated, immunoreactive and
mesenchymal subtypes (Fig. 2C).
However, there was no significant difference in expression between
the integrated mesenchymal subtype vs. the integrated epithelial
subtype (Fig. 2D).
 | Table I.Clinicopathological information of
the ovarian serous cystadenocarcinoma patients of The Cancer Genome
Atlas (TCGA). |
Table I.
Clinicopathological information of
the ovarian serous cystadenocarcinoma patients of The Cancer Genome
Atlas (TCGA).
|
| mRNA YAP
expression | YAP protein
expression | Phosphorylated YAP
protein expression |
|---|
|
|
|
|
|
|---|
| Feature | Total | 2X Down | 2X Up | Low | Intermediate | High | Low | Intermediate | High |
|---|
| No. of
patients | 563 | 205 | 83 | 137 | 138 | 137 | 137 | 138 | 137 |
| Mean age
(years) | 59.7 | 60.2 | 58.8 | 61.1 | 59.7 | 61.3 | 61.7 | 58.5 | 58.9 |
| Stage |
|
|
|
|
|
|
|
|
|
| I | 16 | 9 | 0 | 5 | 3 | 3 | 3 | 9 | 2 |
| II | 27 | 11 | 4 | 6 | 7 | 8 | 10 | 4 | 7 |
|
III | 440 | 152 | 66 | 108 | 105 | 110 | 110 | 109 | 103 |
| IV | 85 | 30 | 13 | 16 | 22 | 16 | 14 | 14 | 23 |
| Tumor grade |
|
|
|
|
|
|
|
|
|
| G1 | 6 | 4 | 0 | 1 | 0 | 2 | 2 | 2 | 1 |
| G2 | 65 | 29 | 7 | 15 | 20 | 16 | 15 | 17 | 22 |
| G3 | 478 | 166 | 75 | 112 | 117 | 118 | 117 | 116 | 113 |
| Surgical
outcome |
|
|
|
|
|
|
|
|
|
|
Optimal | 369 | 125 | 55 | 86 | 87 | 91 | 85 | 86 | 88 |
|
Suboptimal | 142 | 56 | 17 | 30 | 38 | 36 | 39 | 36 | 37 |
| Vital status |
|
|
|
|
|
|
|
|
|
|
Living | 269 | 100 | 37 | 60 | 65 | 61 | 62 | 66 | 67 |
|
Deceased | 291 | 103 | 45 | 76 | 73 | 75 | 75 | 71 | 68 |
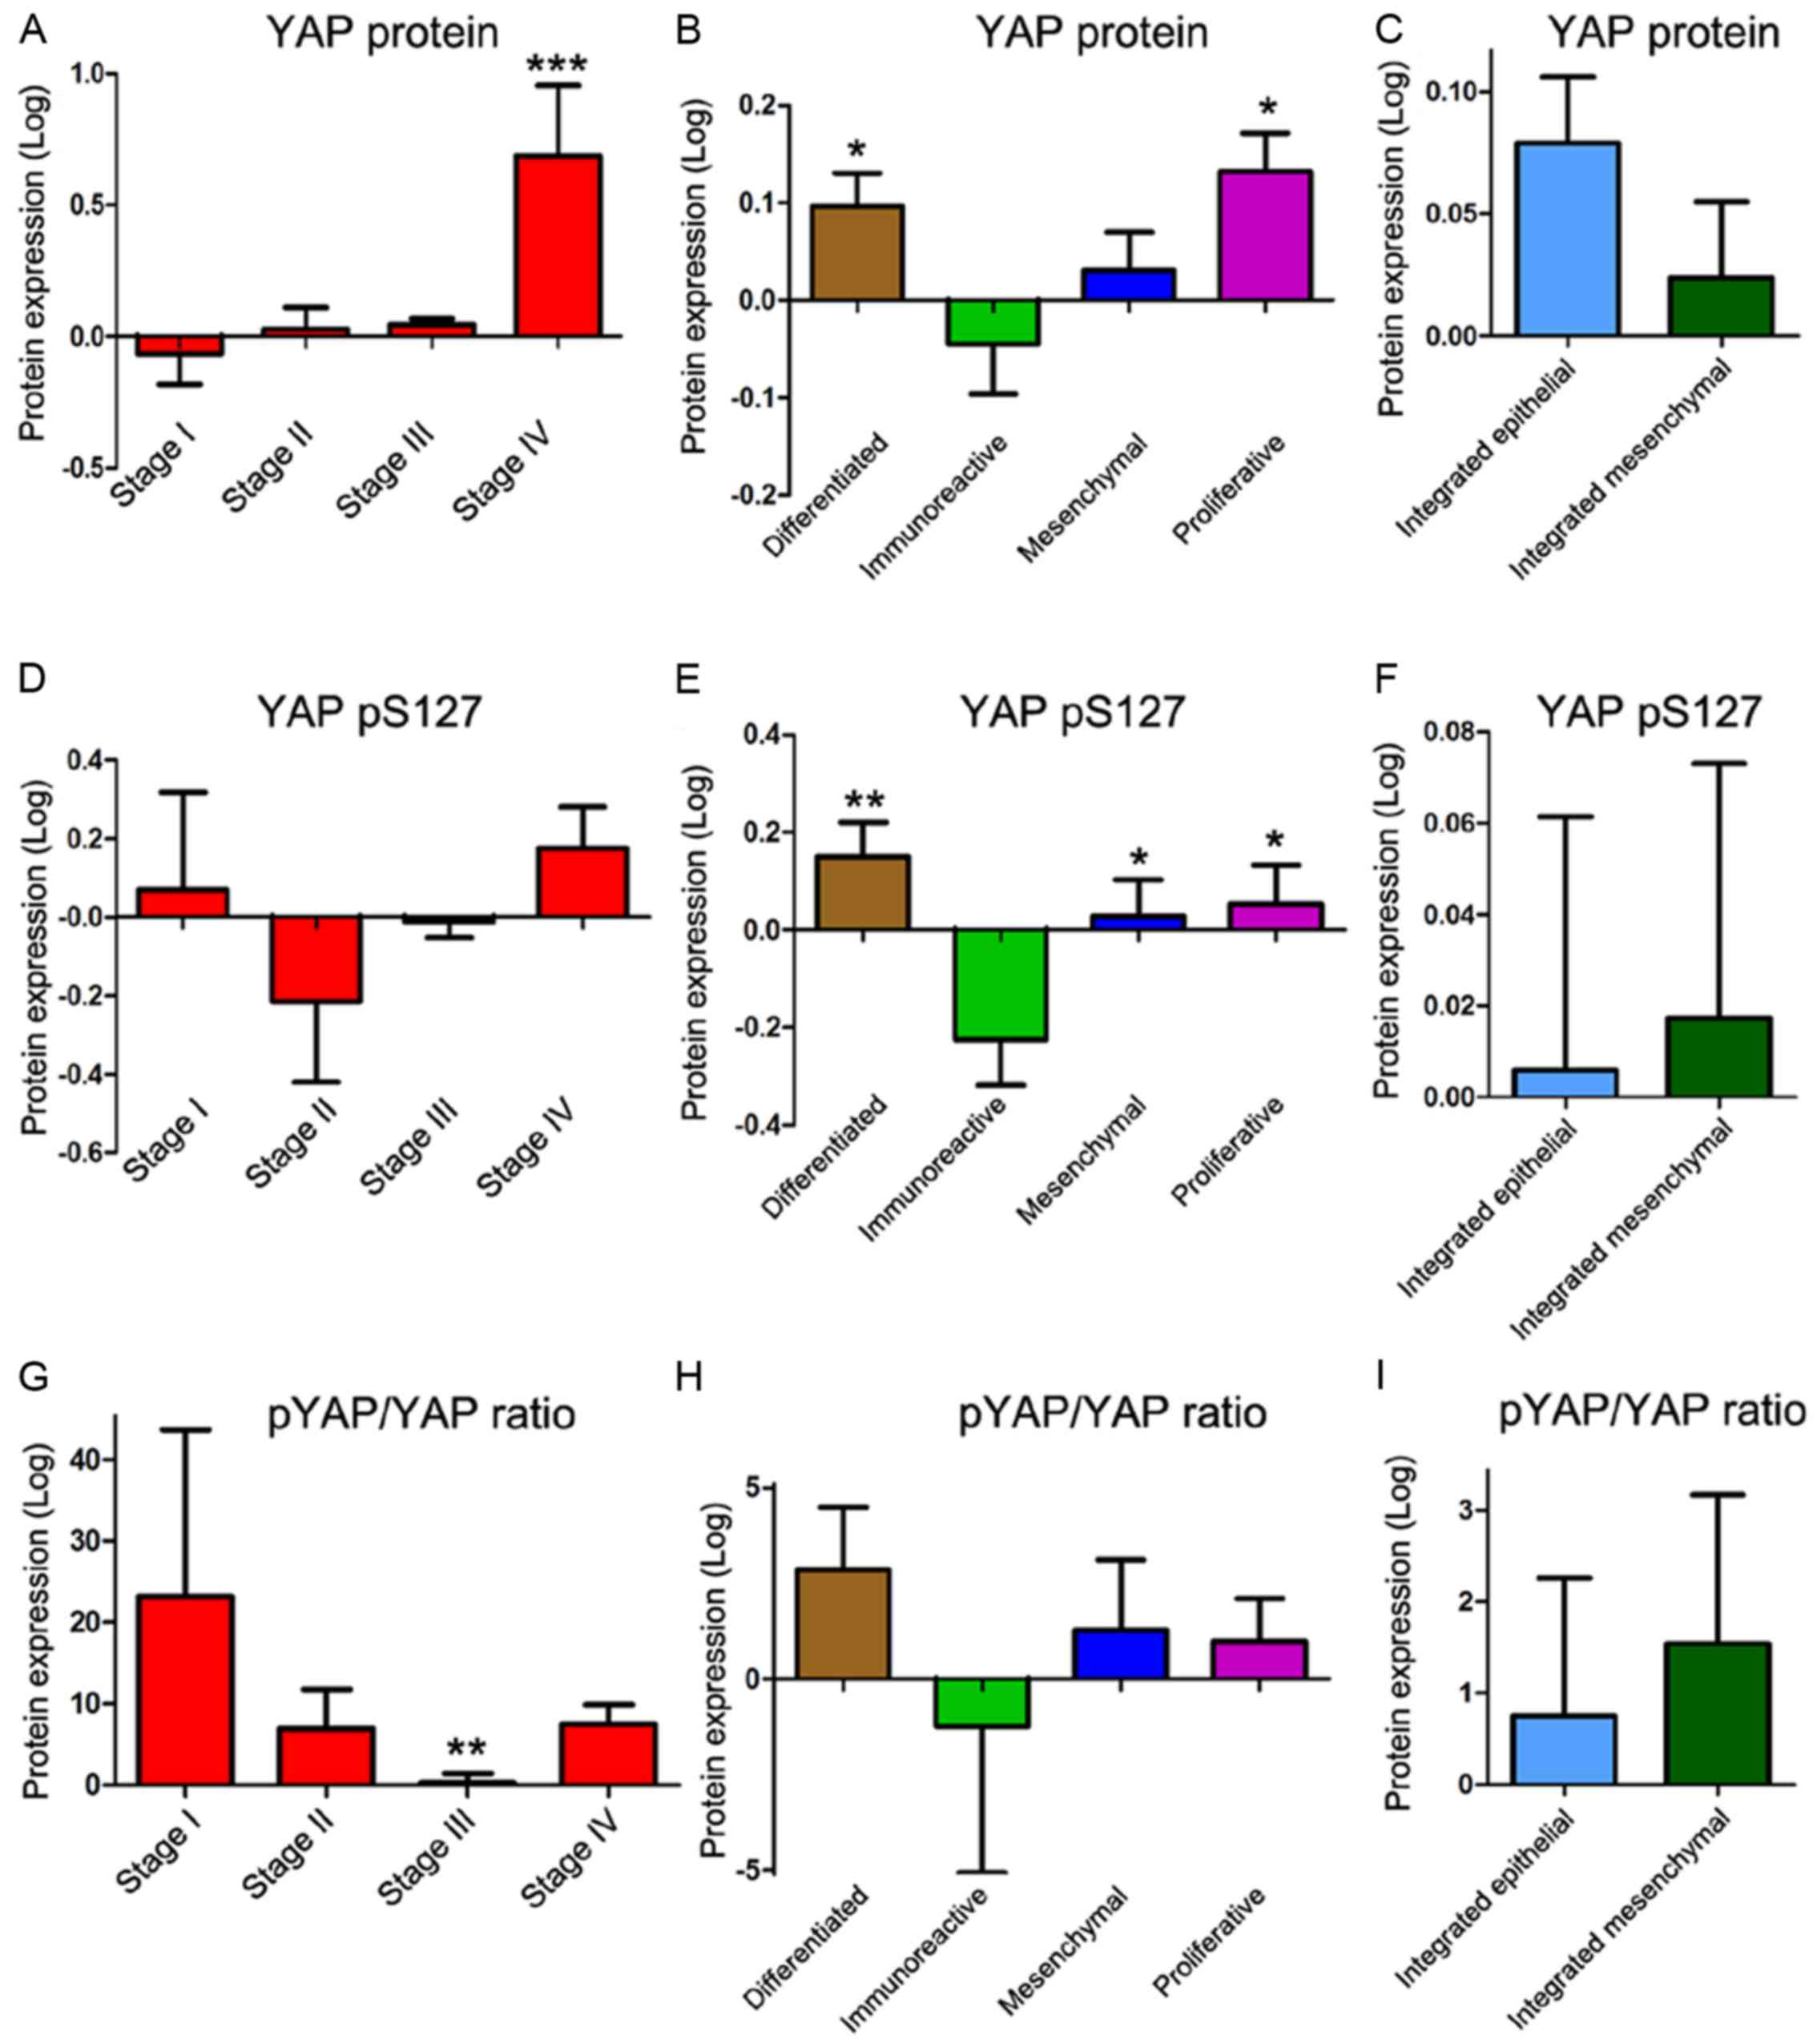
YAP1 protein expression in OSC
When a comparison was conducted between stages of
ovarian cancer, YAP1 protein expression was only significantly
higher in stage IV compared to stages I, II and III (Fig. 3A). The proliferative and
differentiated subtypes showed significantly higher protein
expression than did the immunoreactive subtype (Fig. 3B). However, there was no significant
difference in YAP1 protein level between the integrated epithelial
and mesenchymal subtypes (Fig. 3C).
The phosphorylated form of YAP1, at serine 127 (pYAP), which is
inactivate and is localized to the cytoplasm, did not show any
significant differences in protein expression (Fig. 3D). pYAP in the immunoreactive
subtype was significantly lower than that in other subtypes;
however, the pYAP/YAP ratio, which indicates higher YAP1 activity
when it is lower, was lower in stage III than in stage I (Fig. 3E and G). There was no significant
difference in the pYAP/YAP ratio between the subtypes of ovarian
cancer (Fig. 3H and I).
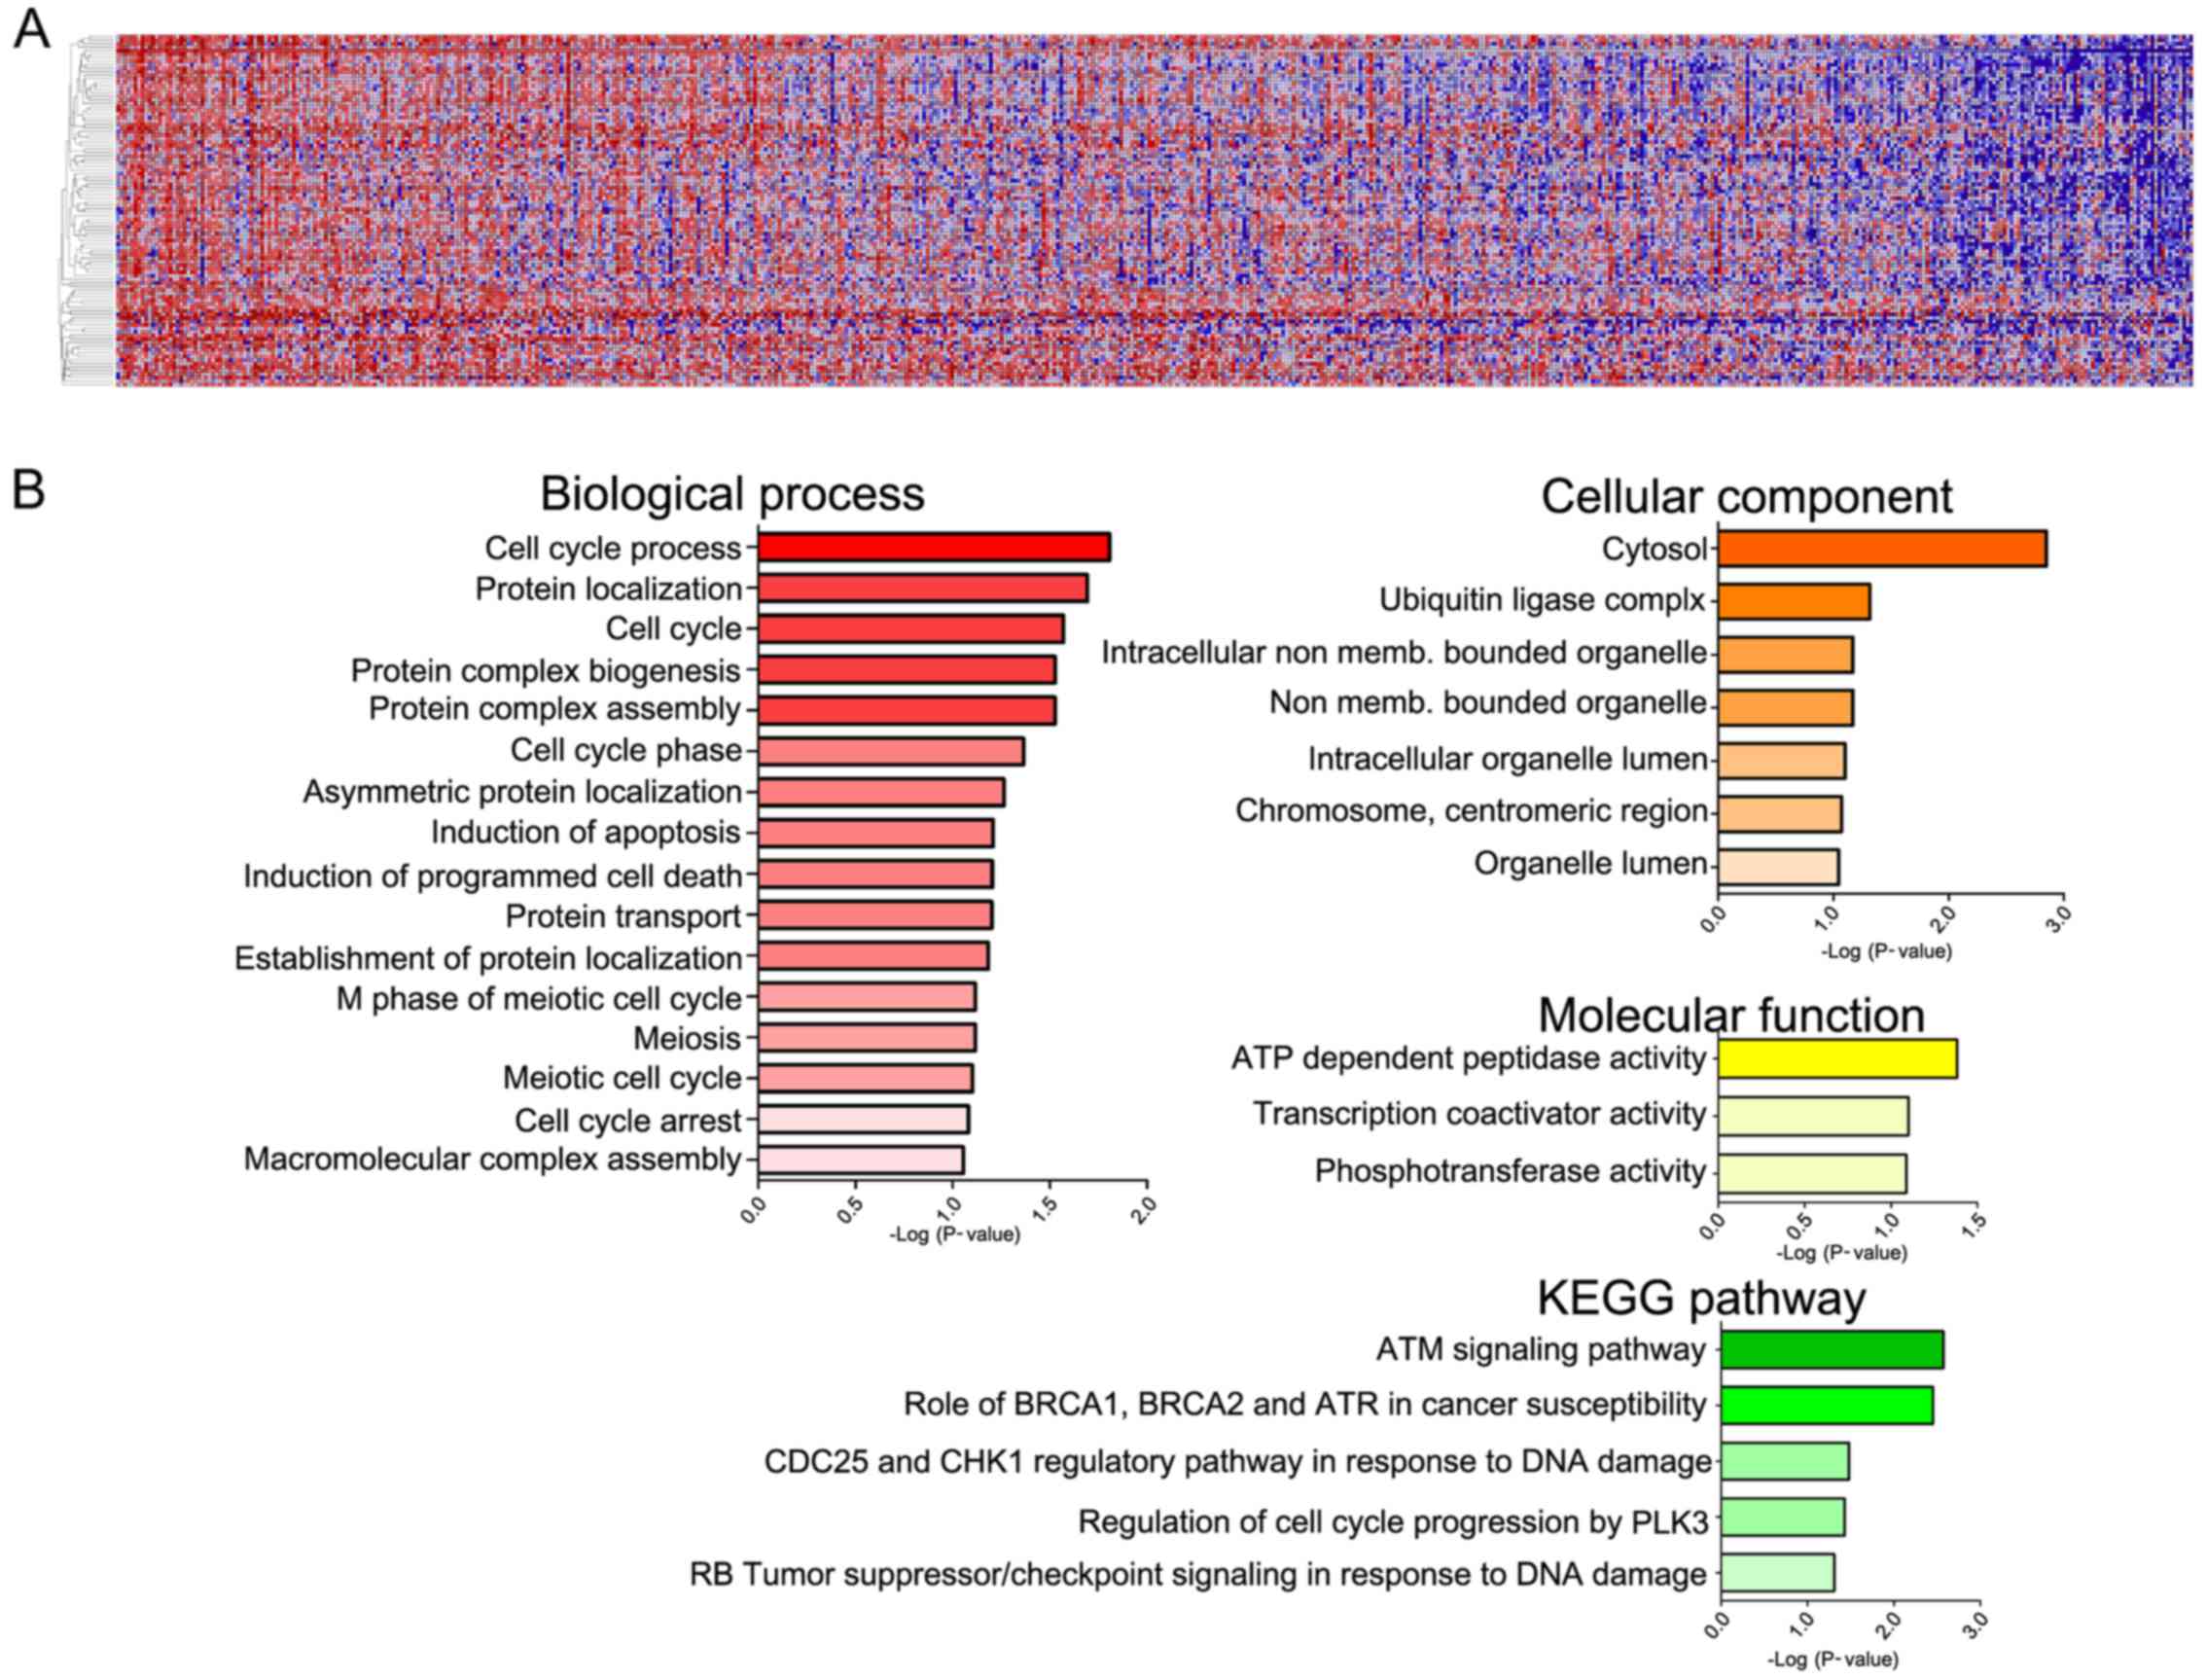
GeneNeighbors of YAP1
The range of YAP1 mRNA expression in the 590 OSC
samples was 2.12 (log2) to 9.78 (log2), with
a fold-change of 4.61. The 100 genes that were most highly
correlated with YAP1 were selected using GeneNeighbors (Fig. 4A), and classified using DAVID. The
genes were classified into 3 groups based on biological processes,
cellular components and molecular functions. GO terms with
significant differences (P<0.05) were: i) biological process,
ii) cellular components, and iii) molecular functions. Genes highly
expressed in OSC were mainly associated with the cell cycle (cell
cycle process, cell cycle and cell cycle phase) and protein
complexes (protein localization, protein complex biogenesis and
protein complex assembly) when analyzed by biological process
(Fig. 4B). Genes highly expressed
in OSC were mainly associated with the cytosol and ubiquitin ligase
complexes when analyzed by cellular components. Genes highly
expressed in OSC were mainly associated with ATP-dependent
peptidase activity when analyzed by molecular function. In
addition, when genes were analyzed according to cell signaling
pathway [Kyoto Encyclopedia of Genes and Genomes (KEGG)], 5
signaling pathways had significant P-values. The analysis
illustrated the importance of the ATM signaling pathway, the role
of BRCA1, BRCA2 and ATR in cancer susceptibility, the Cdc25 and
Chk1 regulatory pathways that respond to DNA damage, regulation of
cell cycle progression by Plk3, and RB tumor-suppressor/checkpoint
signaling in response to DNA damage.
ClassNeighbors of YAP1 upregulated and
downregulated in OSC
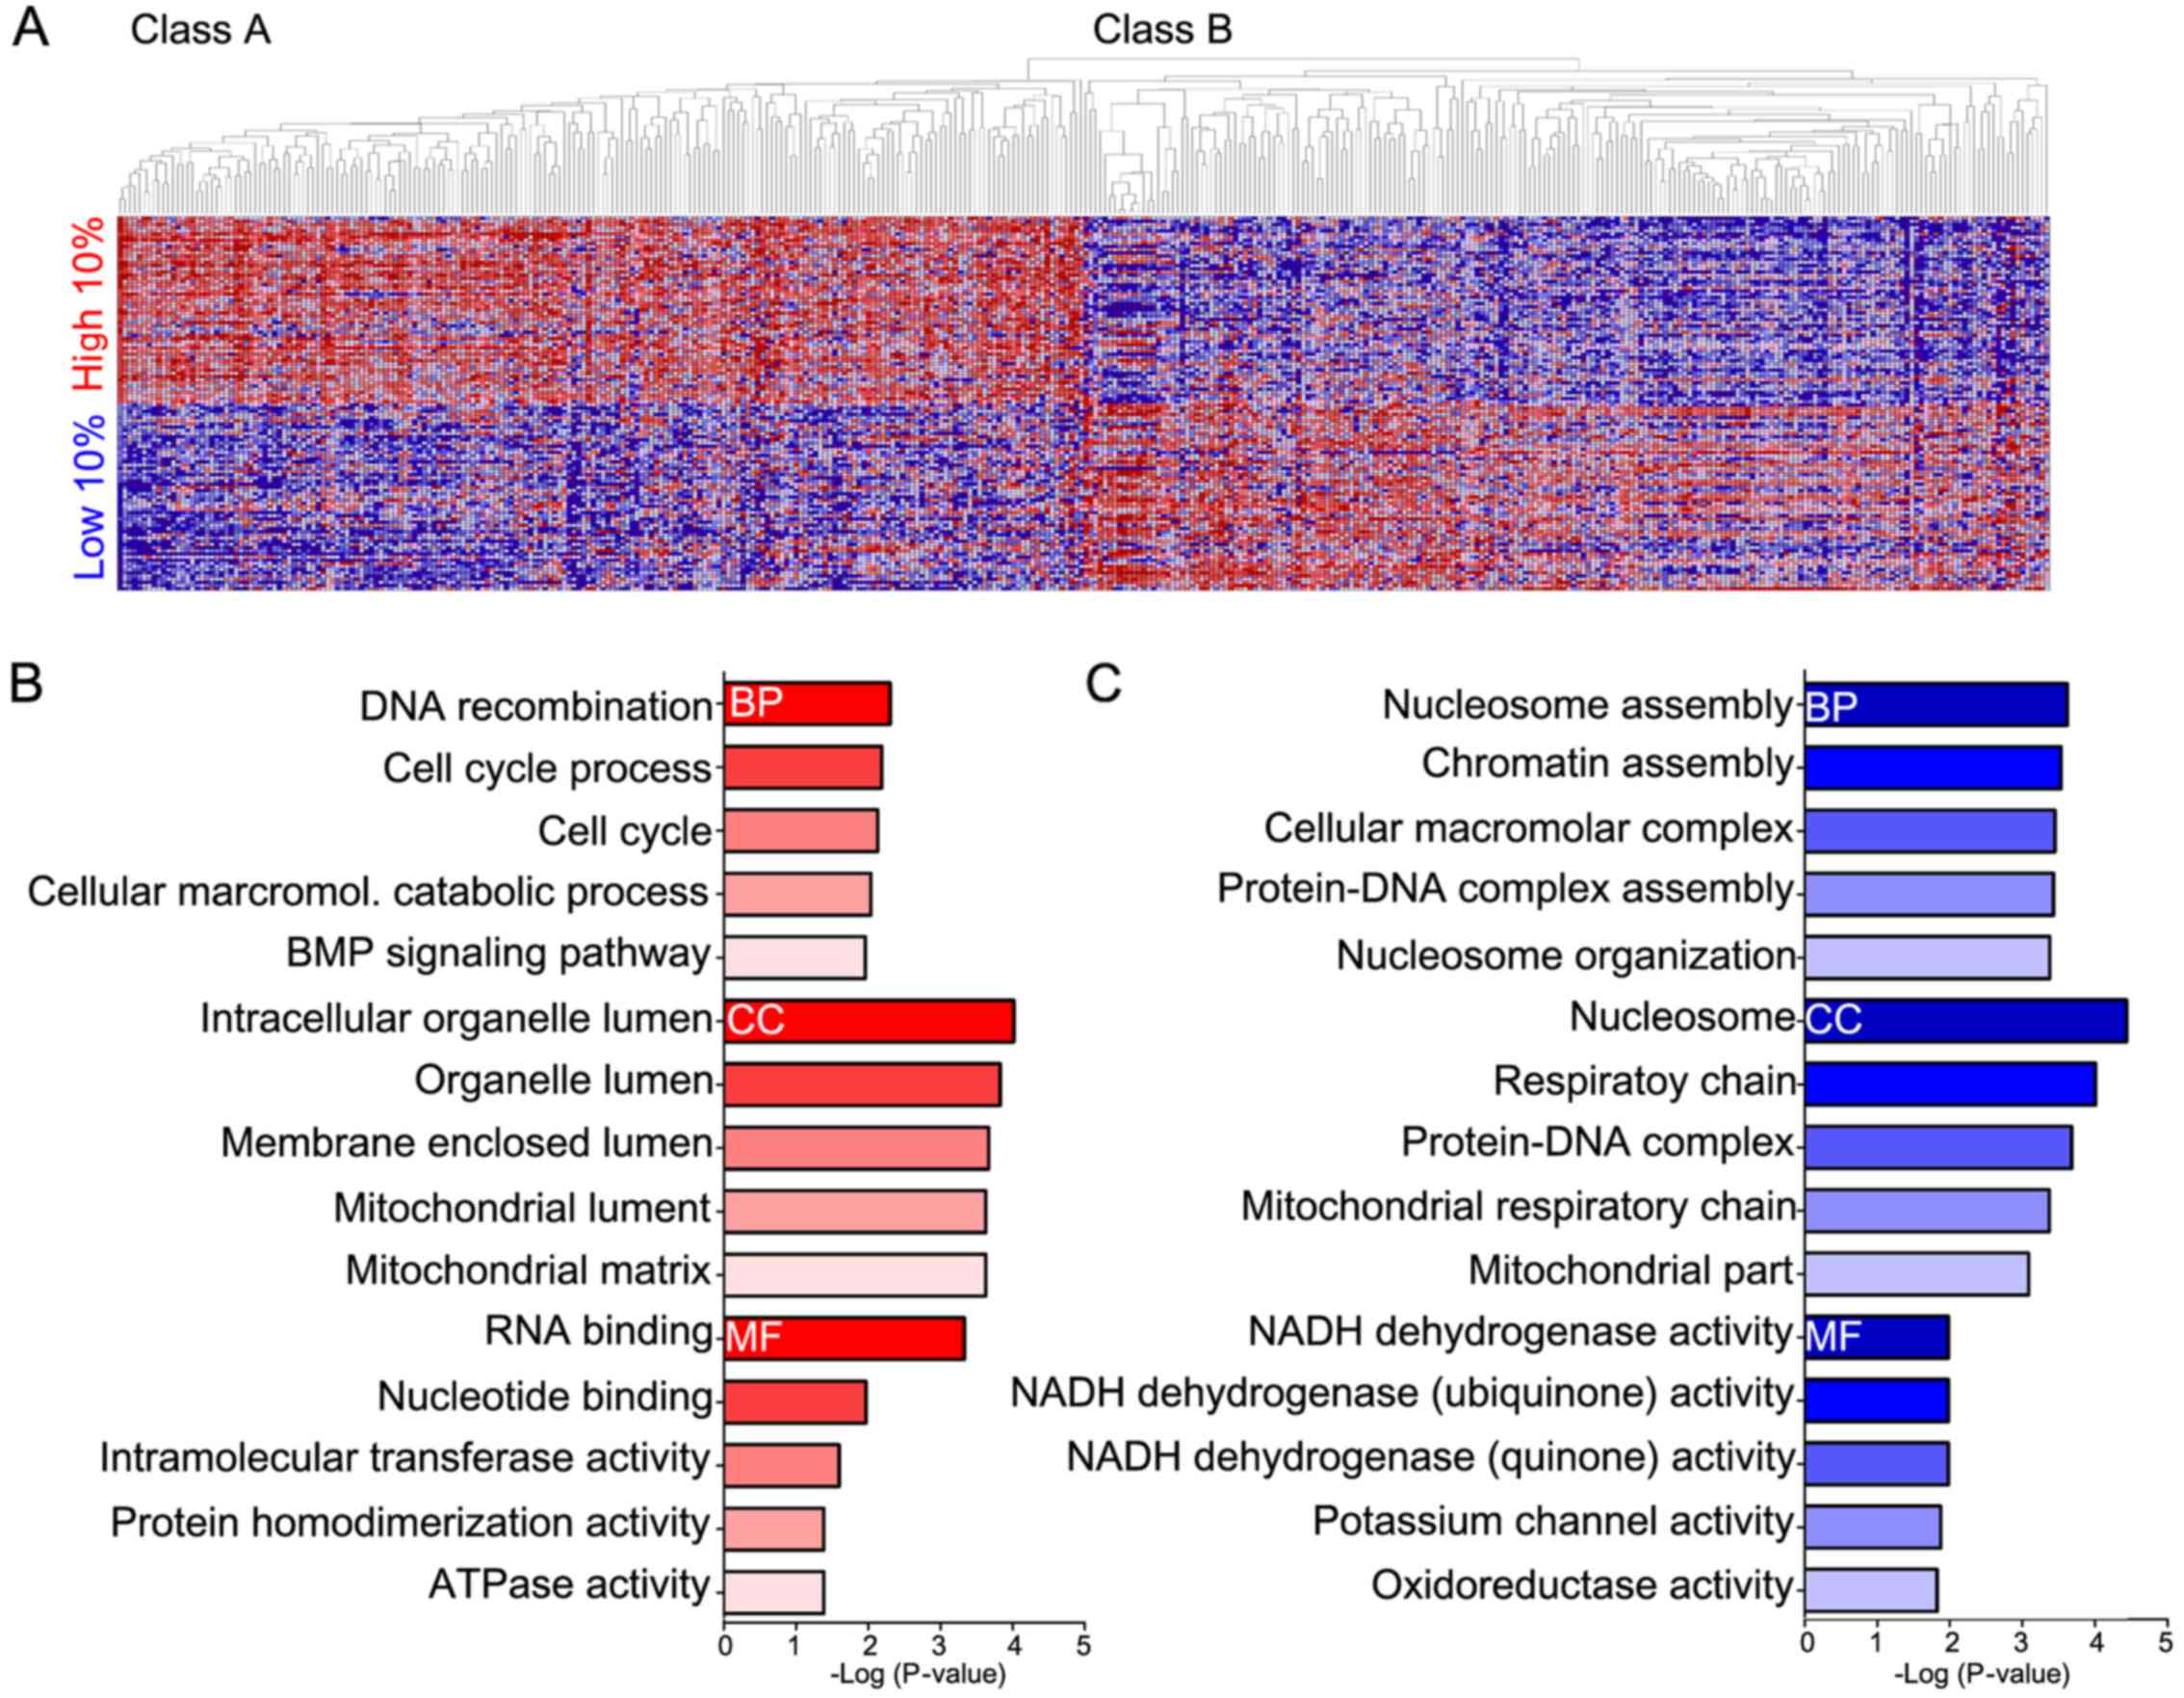
Analysis using ClassNeighbors yielded 2 classes of
OSC: Class A contained the top 59 (10%) YAP1-upregulated OSC
samples and Class B contained the 59 (10%) most YAP1-downregulated
OSC samples (Fig. 5A). Of the
17,814 probe sets, the 200 genes that were most strongly correlated
and most highly expressed in Classes A and B were selected. DAVID
analysis classified these genes into groups based on GO terms: i)
biological processes, ii) cellular components, iii) molecular
functions, and iv) the KEGG pathway (Fig. 5B and C and Table II). Genes highly expressed in Class
A were mostly associated with DNA recombination and the cell cycle
(biological processes), intracellular organelle lumen (cellular
components), and RNA and nucleotide binding (molecular functions)
(Fig. 5B). Genes highly expressed
in Class B were mostly associated with nucleosome and chromatin
assembly (biological processes), nucleosomes and the respiratory
chain (cellular components), and NADH dehydrogenase (molecular
functions) (Fig. 5C).
| Table II.DAVID analysis of ClassNeighbors. |
Table II.
DAVID analysis of ClassNeighbors.
| A, Class A |
|---|
|
|---|
| Term | Count | % | P-value |
|---|
| Biological process
(BP) |
|
|
|
|
GO:0006310~DNA
recombination | 6 | 3.24 | 0.005 |
|
GO:0022402~cell cycle
process | 14 | 7.57 | 0.006 |
|
GO:0007049~cell cycle | 17 | 9.19 | 0.007 |
|
GO:0044265~cellular
macromolecule catabolic process | 16 | 8.65 | 0.009 |
|
GO:0030509~BMP signaling
pathway | 4 | 2.16 | 0.011 |
|
GO:0008104~protein
localization | 18 | 9.73 | 0.011 |
|
GO:0022403~cell cycle
phase | 11 | 5.95 | 0.012 |
|
GO:0000077~DNA damage
checkpoint | 4 | 2.16 | 0.014 |
|
GO:0009451~RNA
modification | 4 | 2.16 | 0.014 |
|
GO:0000075~cell cycle
checkpoint | 5 | 2.70 | 0.015 |
|
GO:0009057~macromolecule
catabolic process | 16 | 8.65 | 0.017 |
|
GO:0031570~DNA integrity
checkpoint | 4 | 2.16 | 0.017 |
|
GO:0007126~meiosis | 5 | 2.70 | 0.020 |
|
GO:0051327~M phase of meiotic
cell cycle | 5 | 2.70 | 0.020 |
|
GO:0010719~negative regulation
of epithelial to mesenchymal transition | 2 | 1.08 | 0.021 |
|
GO:0051321~meiotic cell
cycle | 5 | 2.70 | 0.021 |
|
GO:0065003~macromolecular
complex assembly | 14 | 7.57 | 0.023 |
|
GO:0007178~transmembrane
receptor protein serine/threonine kinase signaling pathway | 5 | 2.70 | 0.023 |
|
GO:0007131~reciprocal meiotic
recombination | 3 | 1.62 | 0.026 |
|
GO:0045596~negative regulation
of cell differentiation | 7 | 3.78 | 0.026 |
|
GO:0015031~protein
transport | 15 | 8.11 | 0.029 |
|
GO:0010771~negative regulation
of cell morphogenesis involved in differentiation | 2 | 1.08 | 0.031 |
|
GO:0045184~establishment of
protein localization | 15 | 8.11 | 0.031 |
|
GO:0051276~chromosome
organization | 11 | 5.95 | 0.032 |
|
GO:0051222~positive regulation
of protein transport | 4 | 2.16 | 0.033 |
|
GO:0050821~protein
stabilization | 3 | 1.62 | 0.035 |
|
GO:0043933~macromolecular
complex subunit organization | 14 | 7.57 | 0.036 |
|
GO:0016567~protein
ubiquitination | 5 | 2.70 | 0.037 |
|
GO:0002377~immunoglobulin
production | 3 | 1.62 | 0.039 |
|
GO:0016071~mRNA metabolic
process | 9 | 4.86 | 0.041 |
|
GO:0002440~production of
molecular mediator of immune response | 3 | 1.62 | 0.042 |
|
GO:0006974~response to DNA
damage stimulus | 9 | 4.86 | 0.043 |
|
GO:0032446~protein
modification by small protein conjugation | 5 | 2.70 | 0.050 |
| Cellular component
(CC) |
|
|
|
|
GO:0070013~intracellular
organelle lumen | 33 | 17.84 | 0.000 |
|
GO:0043233~organelle
lumen | 33 | 17.84 | 0.000 |
|
GO:0031974~membrane-enclosed
lumen | 33 | 17.84 | 0.000 |
|
GO:0031980~mitochondrial
lumen | 10 | 5.41 | 0.000 |
|
GO:0005759~mitochondrial
matrix | 10 | 5.41 | 0.000 |
|
GO:0000794~condensed nuclear
chromosome | 5 | 2.70 | 0.001 |
|
GO:0000793~condensed
chromosome | 6 | 3.24 | 0.007 |
|
GO:0005829~cytosol | 22 | 11.89 | 0.009 |
|
GO:0031981~nuclear lumen | 23 | 12.43 | 0.012 |
|
GO:0030135~coated vesicle | 6 | 3.24 | 0.015 |
|
GO:0000228~nuclear
chromosome | 6 | 3.24 | 0.017 |
|
GO:0044429~mitochondrial
part | 12 | 6.49 | 0.020 |
|
GO:0005694~chromosome | 10 | 5.41 | 0.025 |
|
GO:0005654~nucleoplasm | 15 | 8.11 | 0.030 |
|
GO:0042645~mitochondrial
nucleoid | 3 | 1.62 | 0.033 |
|
GO:0009295~nucleoid | 3 | 1.62 | 0.033 |
|
GO:0031090~organelle
membrane | 17 | 9.19 | 0.041 |
|
GO:0042175~nuclear
envelope-endoplasmic reticulum network | 7 | 3.78 | 0.046 |
| Molecular function
(MF) |
|
|
|
|
GO:0003723~RNA binding | 18 | 9.73 | 0.000 |
|
GO:0000166~nucleotide
binding | 33 | 17.84 | 0.011 |
|
GO:0016866~intramolecular
transferase activity | 3 | 1.62 | 0.025 |
|
GO:0042803~protein
homodimerization activity | 8 | 4.32 | 0.041 |
|
GO:0016887~ATPase
activity | 8 | 4.32 | 0.041 |
|
GO:0019237~centromeric DNA
binding | 2 | 1.08 | 0.047 |
|
| B, Class B |
|
| Term | Count | % | P-value |
|
| Biological process
(BP) |
|
|
|
|
GO:0006334~nucleosome
assembly | 7 | 3.91 | 0.000 |
|
GO:0031497~chromatin
assembly | 7 | 3.91 | 0.000 |
|
GO:0034621~cellular
macromolecular complex subunit organization | 13 | 7.26 | 0.000 |
|
GO:0065004~protein-DNA complex
assembly | 7 | 3.91 | 0.000 |
|
GO:0034728~nucleosome
organization | 7 | 3.91 | 0.000 |
|
GO:0006091~generation of
precursor metabolites and energy | 12 | 6.70 | 0.000 |
|
GO:0022900~electron transport
chain | 7 | 3.91 | 0.001 |
|
GO:0006323~DNA packaging | 7 | 3.91 | 0.001 |
|
GO:0034622~cellular
macromolecular complex assembly | 11 | 6.15 | 0.002 |
|
GO:0006812~cation
transport | 15 | 8.38 | 0.002 |
|
GO:0006333~chromatin assembly
or disassembly | 7 | 3.91 | 0.002 |
|
GO:0006119~oxidative
phosphorylation | 6 | 3.35 | 0.004 |
|
GO:0045454~cell redox
homeostasis | 5 | 2.79 | 0.004 |
|
GO:0006811~ion transport | 17 | 9.50 | 0.006 |
|
GO:0043281~regulation of
caspase activity | 5 | 2.79 | 0.009 |
|
GO:0006120~mitochondrial
electron transport, NADH to ubiquinone | 4 | 2.23 | 0.009 |
|
GO:0052548~regulation of
endopeptidase activity | 5 | 2.79 | 0.011 |
|
GO:0052547~regulation of
peptidase activity | 5 | 2.79 | 0.012 |
|
GO:0015672~monovalent
inorganic cation transport | 9 | 5.03 | 0.018 |
|
GO:0006917~induction of
apoptosis | 9 | 5.03 | 0.019 |
|
GO:0012502~induction of
programmed cell death | 9 | 5.03 | 0.019 |
|
GO:0042981~regulation of
apoptosis | 16 | 8.94 | 0.020 |
|
GO:0042775~mitochondrial ATP
synthesis coupled electron transport | 4 | 2.23 | 0.021 |
|
GO:0042773~ATP synthesis
coupled electron transport | 4 | 2.23 | 0.021 |
|
GO:0043067~regulation of
programmed cell death | 16 | 8.94 | 0.022 |
|
GO:0010941~regulation of cell
death | 16 | 8.94 | 0.023 |
|
GO:0030001~metal ion
transport | 11 | 6.15 | 0.024 |
|
GO:0051336~regulation of
hydrolase activity | 9 | 5.03 | 0.025 |
|
GO:0006813~potassium ion
transport | 6 | 3.35 | 0.026 |
|
GO:0022904~respiratory
electron transport chain | 4 | 2.23 | 0.029 |
|
GO:0043933~macromolecular
complex subunit organization | 14 | 7.82 | 0.034 |
|
GO:0042127~regulation of cell
proliferation | 15 | 8.38 | 0.035 |
|
GO:0008285~negative regulation
of cell proliferation | 9 | 5.03 | 0.035 |
|
GO:0043065~positive regulation
of apoptosis | 10 | 5.59 | 0.036 |
|
GO:0007268~synaptic
transmission | 8 | 4.47 | 0.037 |
|
GO:0043068~positive regulation
of programmed cell death | 10 | 5.59 | 0.037 |
|
GO:0010942~positive regulation
of cell death | 10 | 5.59 | 0.038 |
|
GO:0050728~negative regulation
of inflammatory response | 3 | 1.68 | 0.041 |
|
GO:0044093~positive regulation
of molecular function | 12 | 6.70 | 0.043 |
|
GO:0006325~chromatin
organization | 9 | 5.03 | 0.044 |
|
GO:0050727~regulation of
inflammatory response | 4 | 2.23 | 0.045 |
| Cellular component
(CC) |
|
|
|
|
GO:0000786~nucleosome | 7 | 3.91 | 0.000 |
|
GO:0070469~respiratory
chain | 7 | 3.91 | 0.000 |
|
GO:0032993~protein-DNA
complex | 7 | 3.91 | 0.000 |
|
GO:0005746~mitochondrial
respiratory chain | 6 | 3.35 | 0.000 |
|
GO:0044429~mitochondrial
part | 16 | 8.94 | 0.001 |
|
GO:0044455~mitochondrial
membrane part | 7 | 3.91 | 0.002 |
|
GO:0019866~organelle inner
membrane | 11 | 6.15 | 0.002 |
|
GO:0005739~mitochondrion | 22 | 12.29 | 0.002 |
|
GO:0005740~mitochondrial
envelope | 12 | 6.70 | 0.003 |
|
GO:0005743~mitochondrial inner
membrane | 10 | 5.59 | 0.003 |
|
GO:0000785~chromatin | 8 | 4.47 | 0.004 |
|
GO:0031966~mitochondrial
membrane | 11 | 6.15 | 0.006 |
|
GO:0009897~external side of
plasma membrane | 7 | 3.91 | 0.007 |
|
GO:0045271~respiratory chain
complex I | 4 | 2.23 | 0.008 |
|
GO:0005747~mitochondrial
respiratory chain complex I | 4 | 2.23 | 0.008 |
|
GO:0030964~NADH dehydrogenase
complex | 4 | 2.23 | 0.008 |
|
GO:0031967~organelle
envelope | 14 | 7.82 | 0.009 |
|
GO:0031975~envelope | 14 | 7.82 | 0.009 |
|
GO:0009986~cell surface | 9 | 5.03 | 0.023 |
|
GO:0031090~organelle
membrane | 19 | 10.61 | 0.023 |
|
GO:0044427~chromosomal
part | 9 | 5.03 | 0.039 |
| Molecular function
(MF) |
|
|
|
|
GO:0003954~NADH dehydrogenase
activity | 4 | 2.23 | 0.010 |
|
GO:0008137~NADH dehydrogenase
(ubiquinone) activity | 4 | 2.23 | 0.010 |
|
GO:0050136~NADH dehydrogenase
(quinone) activity | 4 | 2.23 | 0.010 |
|
GO:0005267~potassium channel
activity | 6 | 3.35 | 0.013 |
|
GO:0016655~oxidoreductase
activity, acting on NADH or NADPH, quinone or similar compound as
acceptor | 4 | 2.23 | 0.015 |
|
GO:0047485~protein N-terminus
binding | 4 | 2.23 | 0.043 |
|
GO:0030955~potassium ion
binding | 5 | 2.79 | 0.047 |
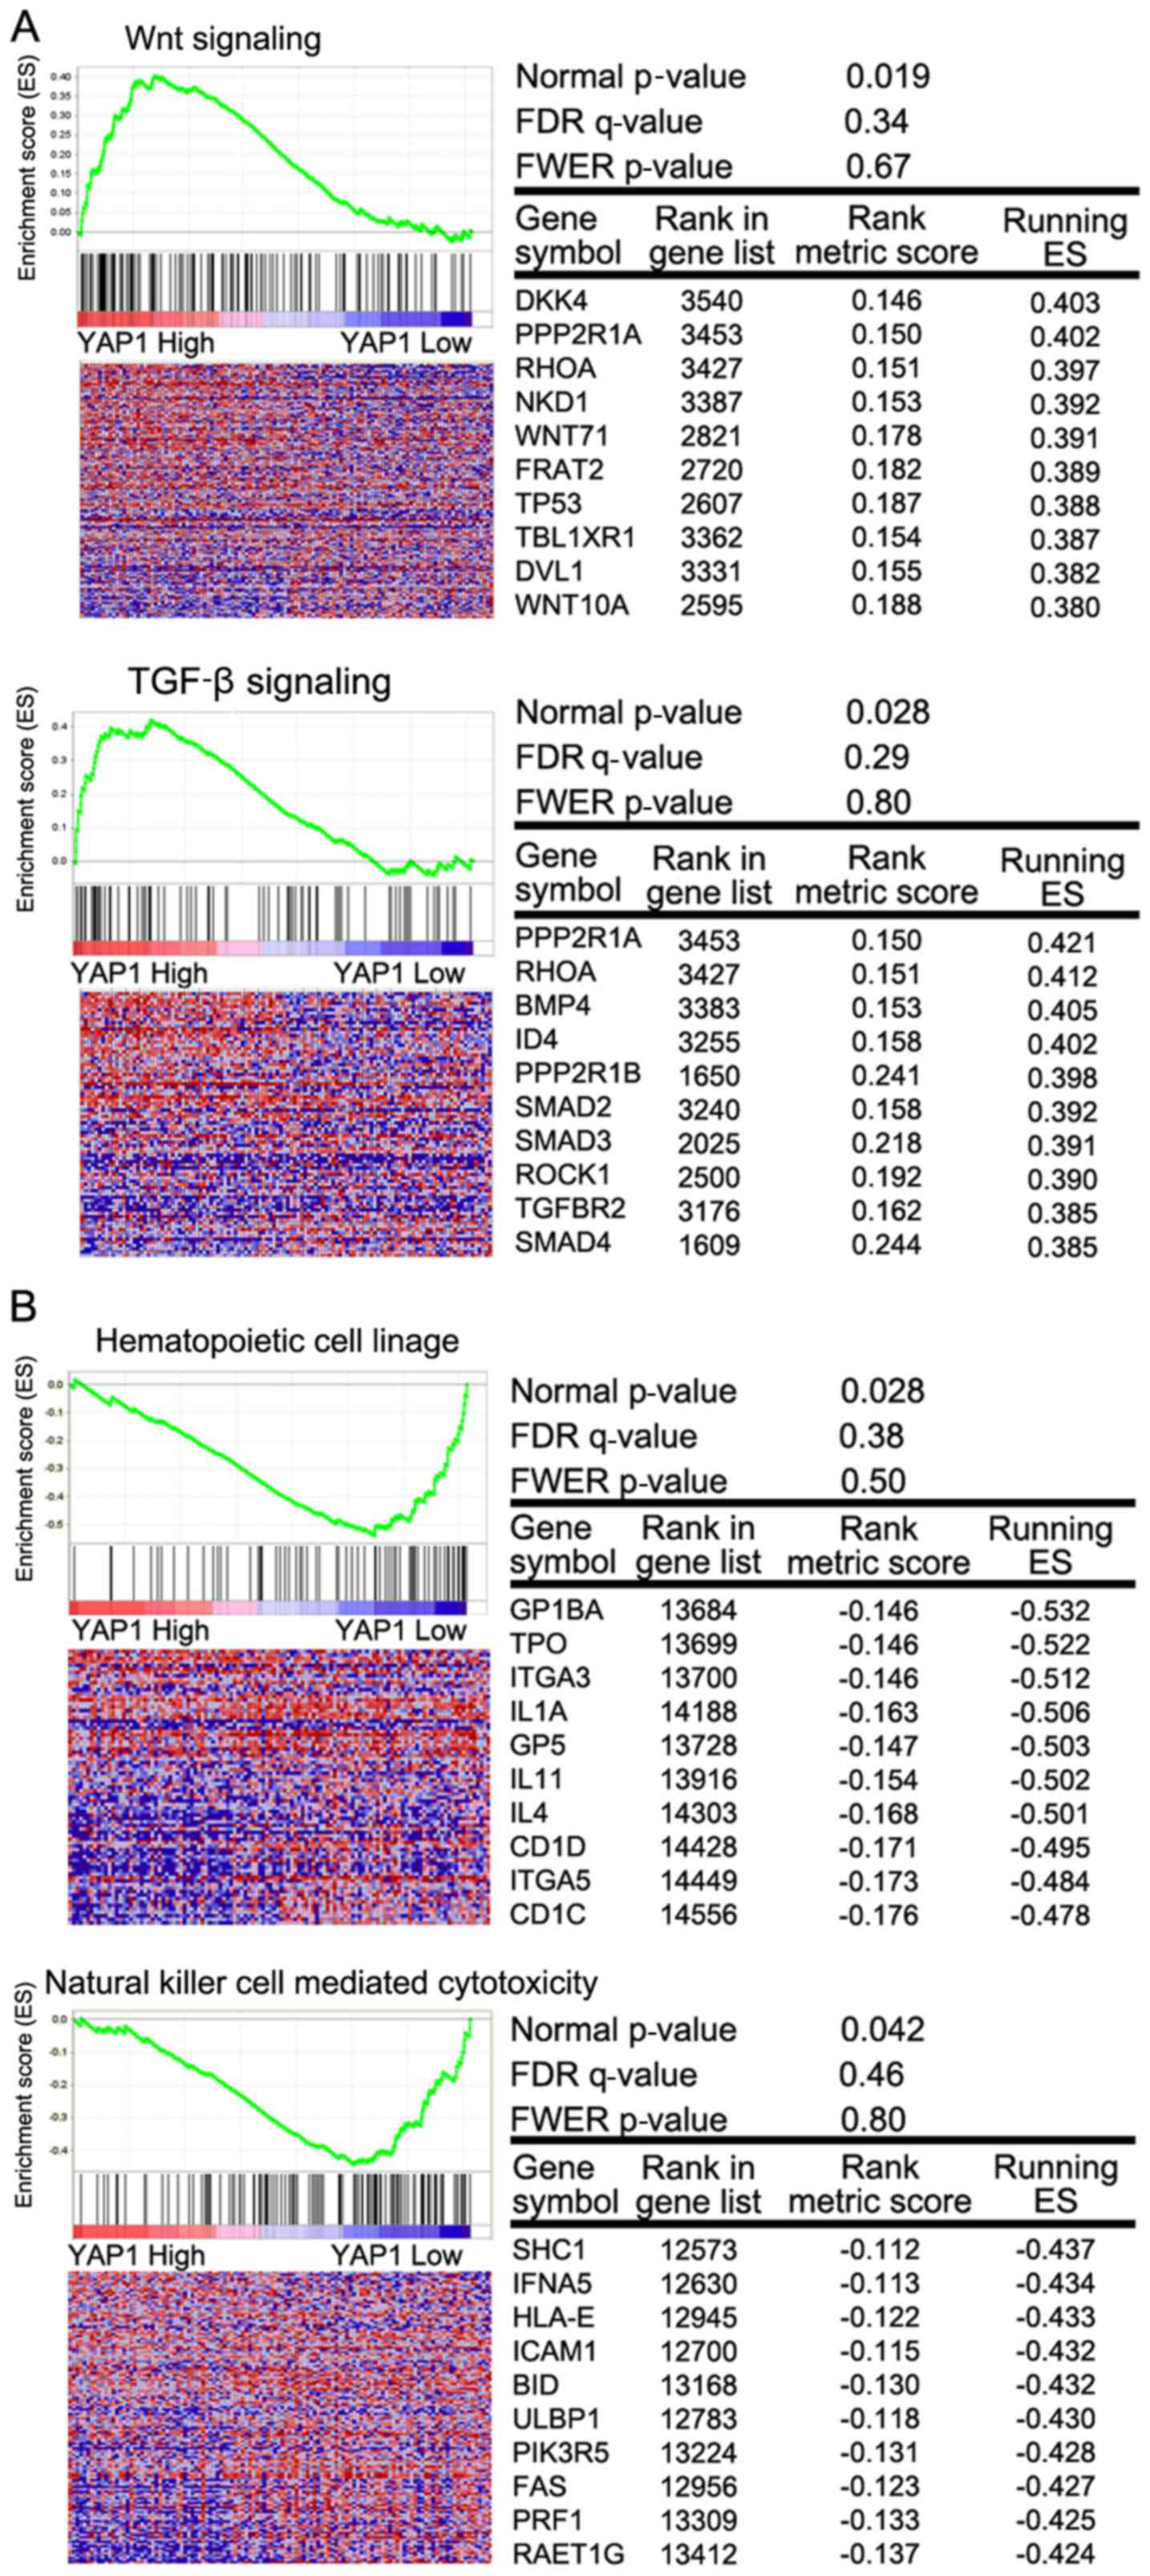
In addition, GSEA was performed in order to
investigate the significantly enriched pathways that differed
between Classes A and B. In Class A, pathways involving tight
junctions, endometrial cancer, WNT signaling, TGF-β signaling,
adherent junctions, basal cell carcinoma and prostate cancer were
significantly enriched when compared with Class B. In Class B,
pathways involved with primary immunodeficiency, systematic lupus
erythematosus, the intestinal immune network for IgA production,
regulation of autophagy, autoimmune thyroid disease and natural
killer cell-mediated cytotoxicity were enriched (Table III). In Class A, WNT (25) and TGF-β signaling (26) were related to cancer progression
(Fig. 6A). Immune-related signaling
pathways were related to Class B (Fig.
6B).
| Table III.Gene set enrichment analysis (GSEA)
of Class A and Class B. |
Table III.
Gene set enrichment analysis (GSEA)
of Class A and Class B.
| A, Class A |
|---|
|
|---|
| Name | Size | ES | NES | NOM p-val |
|---|
|
KEGG_TIGHT_JUNCTION | 125 | 0.38 | 1.63 | 0.004 |
|
KEGG_ENDOMETRIAL_CANCER | 52 | 0.49 | 1.67 | 0.014 |
|
KEGG_WNT_SIGNALING_PATHWAY | 147 | 0.40 | 1.63 | 0.019 |
|
KEGG_SELENOAMINO_ACID_METABOLISM | 23 | 0.55 | 1.62 | 0.025 |
|
KEGG_LYSINE_DEGRADATION | 43 | 0.49 | 1.64 | 0.025 |
|
KEGG_AMINOACYL_TRNA_BIOSYNTHESIS | 41 | 0.54 | 1.60 | 0.026 |
|
KEGG_TGF_BETA_SIGNALING_PATHWAY | 82 | 0.42 | 1.57 | 0.028 |
|
KEGG_ADHERENS_JUNCTION | 73 | 0.46 | 1.62 | 0.032 |
|
KEGG_BASAL_CELL_CARCINOMA | 55 | 0.51 | 1.69 | 0.036 |
|
KEGG_PROSTATE_CANCER | 87 | 0.37 | 1.48 | 0.049 |
|
| B, Class B |
|
|
KEGG_ARACHIDONIC_ACID_METABOLISM | 51 | −0.43 | −1.58 | 0.010 |
|
KEGG_PRIMARY_IMMUNODEFICIENCY | 34 | −0.61 | −1.73 | 0.026 |
|
KEGG_SYSTEMIC_LUPUS_ERYTHEMATOSUS | 114 | −0.61 | −1.86 | 0.027 |
|
KEGG_HEMATOPOIETIC_CELL_LINEAGE | 79 | −0.54 | −1.71 | 0.029 |
|
KEGG_ALPHA_LINOLENIC_ACID_METABOLISM | 17 | −0.54 | −1.53 | 0.034 |
|
KEGG_INTESTINAL_IMMUNE_NETWORK_FOR_IGA_PRODUCTION | 43 | −0.51 | −1.60 | 0.038 |
|
KEGG_REGULATION_OF_AUTOPHAGY | 32 | −0.44 | −1.51 | 0.039 |
|
KEGG_AUTOIMMUNE_THYROID_DISEASE | 47 | −0.54 | −1.62 | 0.042 |
|
KEGG_NATURAL_KILLER_CELL_MEDIATED_CYTOTOXICITY | 128 | −0.44 | −1.57 | 0.043 |
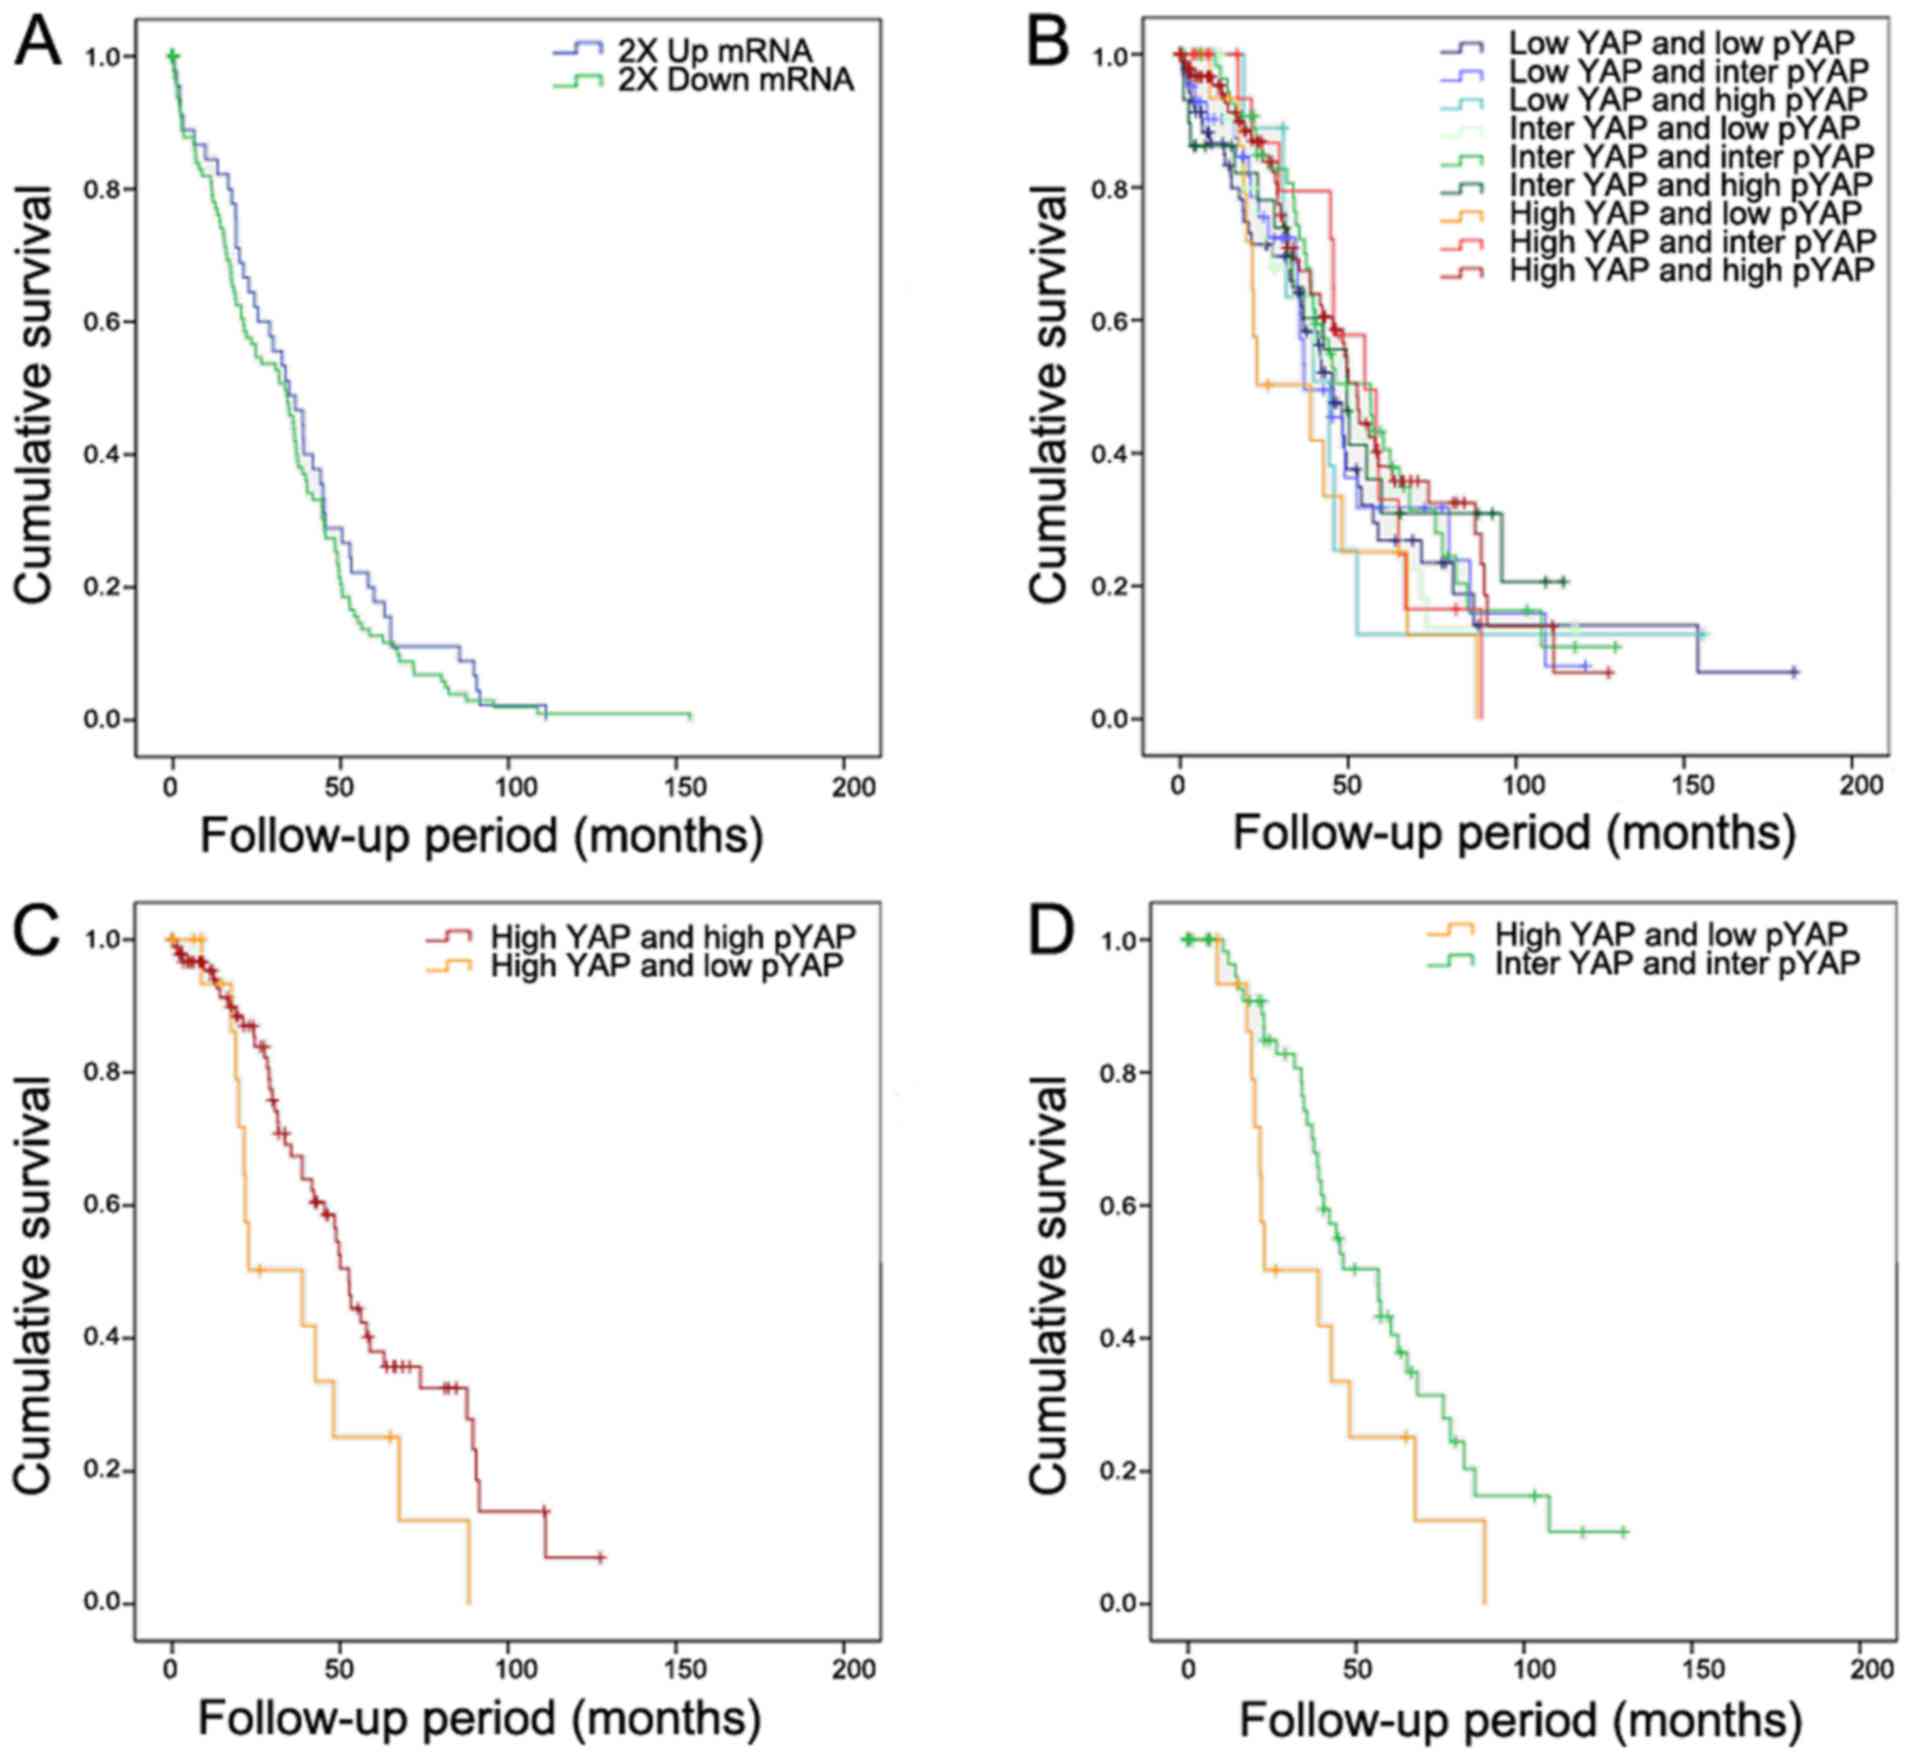
Survival analysis
In order to determine the prognostic significance of
YAP1 expression in patients with OSC, we assessed the correlation
between YAP mRNA and protein expression profiles and clinically
significant characteristics: survival, tumor stage, grade and
residual disease status. Initially, Kaplan-Meier curves were used
to plot overall survival in samples with mRNA expression that was
either 2-fold upregulated or downregulated (Fig. 7). YAP1 mRNA expression was not
significantly associated with patient prognosis in OSC (Fig. 7A). To determine whether YAP and pYAP
distribution are associated with overall patient survival in OSC,
YAP and pYAP expression levels were categorized as high,
intermediate and low, since neither YAP nor pYAP alone were
associated with OSC prognosis. Among 9 categories studied, the
category of high YAP and low pYAP showed the poorest prognosis
(Fig. 7B). The category of high YAP
and low pYAP showed significantly poorer prognosis than did the
category of high YAP and high pYAP and the category of intermediate
YAP and intermediate pYAP (Fig. 7C and
D).
Discussion
In the present study, alterations in the YAP1 gene
in cases of OSC were found to be higher than that in various other
cancer types. YAP1 mRNA expression was significantly higher in OSC
compared with normal ovarian samples, and was higher in stages III
and IV than in stages I and II. YAP1 protein, which mainly
localized to the nucleus, was also expressed more highly in stage
IV than in stages I, II and III. However, the protein level of
pYAP1, which is localized to the cytoplasm, was not significantly
different between stages. The ratio of pYAP/YAP, which indicates
higher activity at a low ratio, was lower in stage III than in
stages I and II. When considering OSC subtypes, YAP1 mRNA and
protein expression in the proliferative subtype was significantly
higher than that in the differentiated, immunoreactive and
mesenchymal subtypes. However, there was no significant difference
in YAP1 mRNA or protein expression between the integrated
mesenchymal and the integrated epithelial subtypes. In
bioinformatic analysis, YAP1 was mainly correlated with the cell
cycle. TGF-β and WNT signaling were significantly increased in the
high-YAP1 class as assessed by gene set enrichment analysis.
Finally, high-YAP and low-pYAP were associated with poor overall
survival in cases of OSC.
Elevated YAP1 expression and nuclear localization
have been observed in multiple types of human cancers, including
liver, colon, lung and prostate cancer (6–8,27). In
hepatocellular carcinoma, YAP1 was found to be an independent
prognostic marker for overall and disease-free survival (13). In epithelial ovarian cancer,
subcellular levels of YAP1 showed an exceptionally strong
association with poor prognosis; high levels of nuclear YAP or low
levels of cytoplasmic phosphorylated YAP1 were associated with poor
prognosis (28). Patients with both
high levels of nuclear YAP and low levels of phosphorylated YAP had
an ~50% lower 5-year survival rate, and this combination served as
an independent prognostic marker for survival (28). In accordance with previous findings,
we showed that high YAP and low pYAP were associated with a poor
prognosis. High YAP1 expression and its subcellular distribution
may be related to poor overall survival in OSC. This finding should
be confirmed in further studies.
The Cancer Genome Atlas Research Network separates
OSC into 4 subtypes (immunoreactive, differentiated, proliferative
and mesenchymal) based on mRNA analysis (24). Yang et al found that the
integrated epithelial and mesenchymal subtypes were associated with
poor overall survival based on miRNA analysis of OSC patients
(23). In the present study, we
revealed that YAP1 mRNA and protein expression in the proliferative
subtype was significantly higher than that in the differentiated,
immunoreactive and mesenchymal subtypes. However, there was no
significant difference in YAP1 mRNA and protein expression between
the integrated mesenchymal subtype and the integrated epithelial
subtype. Molecular subgroups of ovarian cancer have been poorly
examined and need to be further elucidated.
To verify the involvement of YAP1 in OSC, we
performed bioinformatic analysis. This analysis revealed that cell
cycle- and protein localization-related genes were highly
correlated with YAP1 in 563 OSC patient samples (Fig. 4A). In addition, ClassNeighbors
analysis classified YAP1-expressing OSC into Class A, which
expresses genes associated with DNA recombination, cell cycle and
RNA binding (Fig. 5B) and Class B,
which expresses genes associated with nucleosome assembly, the
respiratory chain, and NADH dehydrogenase activity (Fig. 5C). Class A genes enhance cell
cycle-related functions, while Class B genes enhance nucleosome and
oxidative phosphorylation pathways. GSEA was performed to
investigate significantly enriched pathways that differed between
Classes A and B. In Class A, pathways involving tight junctions,
WNT and TGF-β signaling, and adherens junctions were more active
than they were in Class B. In Class B, pathways involving primary
immunodeficiency, systematic lupus erythematosus, intestinal immune
network for IgA production, regulation of autophagy, and natural
killer cell-mediated cytotoxicity were enriched (Table III). In Class A, WNT signaling
(25) and TGF-β signaling (26) were related to cancer
progression.
In conclusion, we investigated alterations in YAP1
gene expression in OSC, which was higher than that in 20 other
types of cancers. mRNA expression and protein levels of YAP1 were
significantly higher in advanced-stage OSC. High YAP and low pYAP
were significantly correlated with poor prognosis in OSC. High YAP
expression level and also its subcellular distribution may be
associated with overall patient survival in OSC.
Acknowledgements
The present study (research) was supported by the
Chungnam National University Hospital Research Fund (2016).
References
|
1
|
Moroishi T, Hansen CG and Guan KL: The
emerging roles of YAP and TAZ in cancer. Nat Rev Cancer. 15:73–79.
2015. View
Article : Google Scholar : PubMed/NCBI
|
|
2
|
Mo JS, Park HW and Guan KL: The Hippo
signaling pathway in stem cell biology and cancer. EMBO Rep.
15:642–656. 2014.PubMed/NCBI
|
|
3
|
Hong W and Guan KL: The YAP and TAZ
transcription co-activators: Key downstream effectors of the
mammalian Hippo pathway. Semin Cell Dev Biol. 23:785–793. 2012.
View Article : Google Scholar : PubMed/NCBI
|
|
4
|
Johnson R and Halder G: The two faces of
Hippo: Targeting the Hippo pathway for regenerative medicine and
cancer treatment. Nat Rev Drug Discov. 13:63–79. 2014. View Article : Google Scholar : PubMed/NCBI
|
|
5
|
Piccolo S, Dupont S and Cordenonsi M: The
biology of YAP/TAZ: Hippo signaling and beyond. Physiol Rev.
94:1287–1312. 2014. View Article : Google Scholar : PubMed/NCBI
|
|
6
|
Steinhardt AA, Gayyed MF, Klein AP, Dong
J, Maitra A, Pan D, Montgomery EA and Anders RA: Expression of
Yes-associated protein in common solid tumors. Hum Pathol.
39:1582–1589. 2008. View Article : Google Scholar : PubMed/NCBI
|
|
7
|
Zender L, Spector MS, Xue W, Flemming P,
Cordon-Cardo C, Silke J, Fan ST, Luk JM, Wigler M, Hannon GJ, et
al: Identification and validation of oncogenes in liver cancer
using an integrative oncogenomic approach. Cell. 125:1253–1267.
2006. View Article : Google Scholar : PubMed/NCBI
|
|
8
|
Zhao B, Wei X, Li W, Udan RS, Yang Q, Kim
J, Xie J, Ikenoue T, Yu J, Li L, et al: Inactivation of YAP
oncoprotein by the Hippo pathway is involved in cell contact
inhibition and tissue growth control. Genes Dev. 21:2747–2761.
2007. View Article : Google Scholar : PubMed/NCBI
|
|
9
|
Yu FX and Guan KL: The Hippo pathway:
Regulators and regulations. Genes Dev. 27:355–371. 2013. View Article : Google Scholar : PubMed/NCBI
|
|
10
|
Overholtzer M, Zhang J, Smolen GA, Muir B,
Li W, Sgroi DC, Deng CX, Brugge JS and Haber DA: Transforming
properties of YAP, a candidate oncogene on the chromosome
11q22 amplicon. Proc Natl Acad Sci USA. 103:12405–12410. 2006.
View Article : Google Scholar : PubMed/NCBI
|
|
11
|
Strano S, Monti O, Pediconi N, Baccarini
A, Fontemaggi G, Lapi E, Mantovani F, Damalas A, Citro G, Sacchi A,
et al: The transcriptional coactivator Yes-associated protein
drives p73 gene-target specificity in response to DNA damage. Mol
Cell. 18:447–459. 2005. View Article : Google Scholar : PubMed/NCBI
|
|
12
|
Harvey KF, Zhang X and Thomas DM: The
Hippo pathway and human cancer. Nat Rev Cancer. 13:246–257. 2013.
View Article : Google Scholar : PubMed/NCBI
|
|
13
|
Xu MZ, Yao TJ, Lee NP, Ng IO, Chan YT,
Zender L, Lowe SW, Poon RT and Luk JM: Yes-associated protein is an
independent prognostic marker in hepatocellular carcinoma. Cancer.
115:4576–4585. 2009. View Article : Google Scholar : PubMed/NCBI
|
|
14
|
Wang Y, Dong Q, Zhang Q, Li Z, Wang E and
Qiu X: Overexpression of yes-associated protein contributes to
progression and poor prognosis of non-small-cell lung cancer.
Cancer Sci. 101:1279–1285. 2010. View Article : Google Scholar : PubMed/NCBI
|
|
15
|
Zhang X, George J, Deb S, Degoutin JL,
Takano EA, Fox SB, Bowtell DD and Harvey KF: AOCS Study group: The
Hippo pathway transcriptional co-activator, YAP, is an ovarian
cancer oncogene. Oncogene. 30:2810–2822. 2011. View Article : Google Scholar : PubMed/NCBI
|
|
16
|
Xia Y, Chang T, Wang Y, Liu Y, Li W, Li M
and Fan HY: YAP promotes ovarian cancer cell tumorigenesis and is
indicative of a poor prognosis for ovarian cancer patients. PLoS
One. 9:e917702014. View Article : Google Scholar : PubMed/NCBI
|
|
17
|
Jayson GC, Kohn EC, Kitchener HC and
Ledermann JA: Ovarian cancer. Lancet. 384:1376–1388. 2014.
View Article : Google Scholar : PubMed/NCBI
|
|
18
|
Kim SI, Lim MC, Lim J, Won YJ, Seo SS,
Kang S and Park SY: Incidence of epithelial ovarian cancer
according to histologic subtypes in Korea, 1999 to 2012. J Gynecol
Oncol. 27:e52016. View Article : Google Scholar : PubMed/NCBI
|
|
19
|
Golub TR, Slonim DK, Tamayo P, Huard C,
Gaasenbeek M, Mesirov JP, Coller H, Loh ML, Downing JR, Caligiuri
MA, et al: Molecular classification of cancer: Class discovery and
class prediction by gene expression monitoring. Science.
286:531–537. 1999. View Article : Google Scholar : PubMed/NCBI
|
|
20
|
Huang DW, Sherman BT, Tan Q, Collins JR,
Alvord WG, Roayaei J, Stephens R, Baseler MW, Lane HC and Lempicki
RA: The DAVID Gene Functional Classification Tool: A novel
biological module-centric algorithm to functionally analyze large
gene lists. Genome Biol. 8:R1832007. View Article : Google Scholar : PubMed/NCBI
|
|
21
|
Kanehisa M, Goto S, Sato Y, Furumichi M
and Tanabe M: KEGG for integration and interpretation of
large-scale molecular data sets. Nucleic Acids Res. 40:D109–D114.
2012. View Article : Google Scholar : PubMed/NCBI
|
|
22
|
Kanehisa M and Goto S: KEGG: Kyoto
encyclopedia of genes and genomes. Nucleic Acids Res. 28:27–30.
2000. View Article : Google Scholar : PubMed/NCBI
|
|
23
|
Yang D, Sun Y, Hu L, Zheng H, Ji P, Pecot
CV, Zhao Y, Reynolds S, Cheng H, Rupaimoole R, et al: Integrated
analyses identify a master microRNA regulatory network for the
mesenchymal subtype in serous ovarian cancer. Cancer Cell.
23:186–199. 2013. View Article : Google Scholar : PubMed/NCBI
|
|
24
|
Bell D, Berchuck A, Birrer M, Chien J,
Cramer DW, Dao F, Dhir R, DiSaia P, Gabra H, Glenn P, et al: Cancer
Genome Atlas Research Network: Integrated genomic analyses of
ovarian carcinoma. Nature. 474:609–615. 2011. View Article : Google Scholar : PubMed/NCBI
|
|
25
|
DiMeo TA, Anderson K, Phadke P, Fan C,
Perou CM, Naber S and Kuperwasser C: A novel lung metastasis
signature links Wnt signaling with cancer cell self-renewal and
epithelial-mesenchymal transition in basal-like breast cancer.
Cancer Res. 69:5364–5373. 2009. View Article : Google Scholar : PubMed/NCBI
|
|
26
|
Ikushima H and Miyazono K: TGFbeta
signalling: A complex web in cancer progression. Nat Rev Cancer.
10:415–424. 2010. View
Article : Google Scholar : PubMed/NCBI
|
|
27
|
Dong J, Feldmann G, Huang J, Wu S, Zhang
N, Comerford SA, Gayyed MF, Anders RA, Maitra A and Pan D:
Elucidation of a universal size-control mechanism in Drosophila and
mammals. Cell. 130:1120–1133. 2007. View Article : Google Scholar : PubMed/NCBI
|
|
28
|
Hall CA, Wang R, Miao J, Oliva E, Shen X,
Wheeler T, Hilsenbeck SG, Orsulic S and Goode S: Hippo pathway
effector Yap is an ovarian cancer oncogene. Cancer Res.
70:8517–8525. 2010. View Article : Google Scholar : PubMed/NCBI
|