Introduction
In patients with cancer, the treatment strategy,
outcome and prognosis are strongly dependent on immune status,
which should thus be monitored, ideally via markers that are easily
and non-invasively measurable in the peripheral blood. Cytotoxic
effector cluster of differentiation (CD)8+ T cells
(equivalent to terminal CD8+ T cells) become exhausted
by persistent stimulation with tumor antigens, resulting in
cessation of proliferation, cytokine production and immune
activities (1,2). Programmed cell death 1 (PD-1) has been
proposed as a marker of exhausted T cells (1). PD-1 is abundantly expressed in
circulating CD8+ T cells in patients with cancer, as
well as in tumor-infiltrating lymphocytes, and is associated with a
poor prognosis in various cancer types, including breast,
pancreatic and gastric cancer (3–6). As
recently reported, exhausted tumor-infiltrating (7) and circulating (8) CD8+ T cells exhibit
metabolic insufficiency, characterized most prominently by
persistent loss of mitochondrial function and mass (7), typically following progressive loss of
peroxisome proliferator-activated receptor γ coactivator 1α
(PGC-1α) (7).
Molecular hydrogen, that is dihydrogen or
H2, was previously reported to efficiently neutralize
hydroxyl radicals (•OH), but not other reactive oxygen species,
including superoxide anions (O2•−), hydrogen
peroxide (H2O2) and nitric oxide (NO•)
(9). Accordingly, hydrogen is now
believed to reduce oxidative stress and ischemia-reperfusion injury
in the brain, spinal cord (10),
myocardium (11), intestinal
epithelium (12), retina, testes
(13) and kidneys (14). Hydrogen has been used to treat
various states associated with oxidative stress, including trauma
(15), neurodegenerative disease
(16), inflammatory disease
(17), organ transplantation,
metabolic syndrome (18), diabetes
mellitus (19), sepsis (20), burns (21), adverse reactions to chemotherapy
(22), radiation injury (23), hearing disorders and preeclampsia
(24). There are several studies on
the preventive and therapeutic effects of hydrogen on various
diseases, including cancer (25–27).
Notably, it was reported that molecular hydrogen activates PGC-1α
(28), which is a positive
regulator of mitochondrial biogenesis and respiration, adaptive
thermogenesis, gluconeogenesis and a number of other metabolic
processes (29), suggesting that it
may rescue exhausted CD8+ T cells with mitochondrial
dysfunction.
Therefore, the present study investigated whether
PD-1 expression in circulating CD8+ T cells in 55
patients with colorectal carcinoma was associated with
progression-free survival (PFS) and overall survival (OS), and
whether hydrogen gas impacts prognosis via influencing
PD-1+ CD8+ T lymphocytes.
Materials and methods
Patients, sample collection and
processing
All participants provided written informed consent
prior to enrollment, and the Institutional Review Boards at the
Tamana Regional Health Medical Center (Tamana, Kumamoto, Japan)
approved the study protocol. All methods and procedures were
consistent with Good Clinical Practice, the Declaration of Helsinki
and local laws. In total, 55 patients with histologically and
clinically diagnosed stage IV colorectal carcinoma, based on the
unified Tumor-Node-Metastasis criteria (30), were enrolled at Tamana Regional
Health Medical Center between July 2014 and July 2017. The specific
inclusion and exclusion criteria were a performance status of ≥2
and <2, respectively. Among the patients with colorectal
carcinoma, there were 21 men and 34 women, who ranged in age from
28 to 96 years, with a mean age of 65.7±14.8 years (Table I). The patients were treated with
chemotherapy using XELOX (CapeOX) (1,200-1,800 mg capecitabine for
14 days continuously, followed by a 7-day rest period, and 85
mg/m2 oxaliplatin at a 3-week interval) + bevacizumab
(7.5 mg/m2 at a 3-week interval). A total of 3 weeks was
regarded as one cycle. Treatment was repeated until the cancer
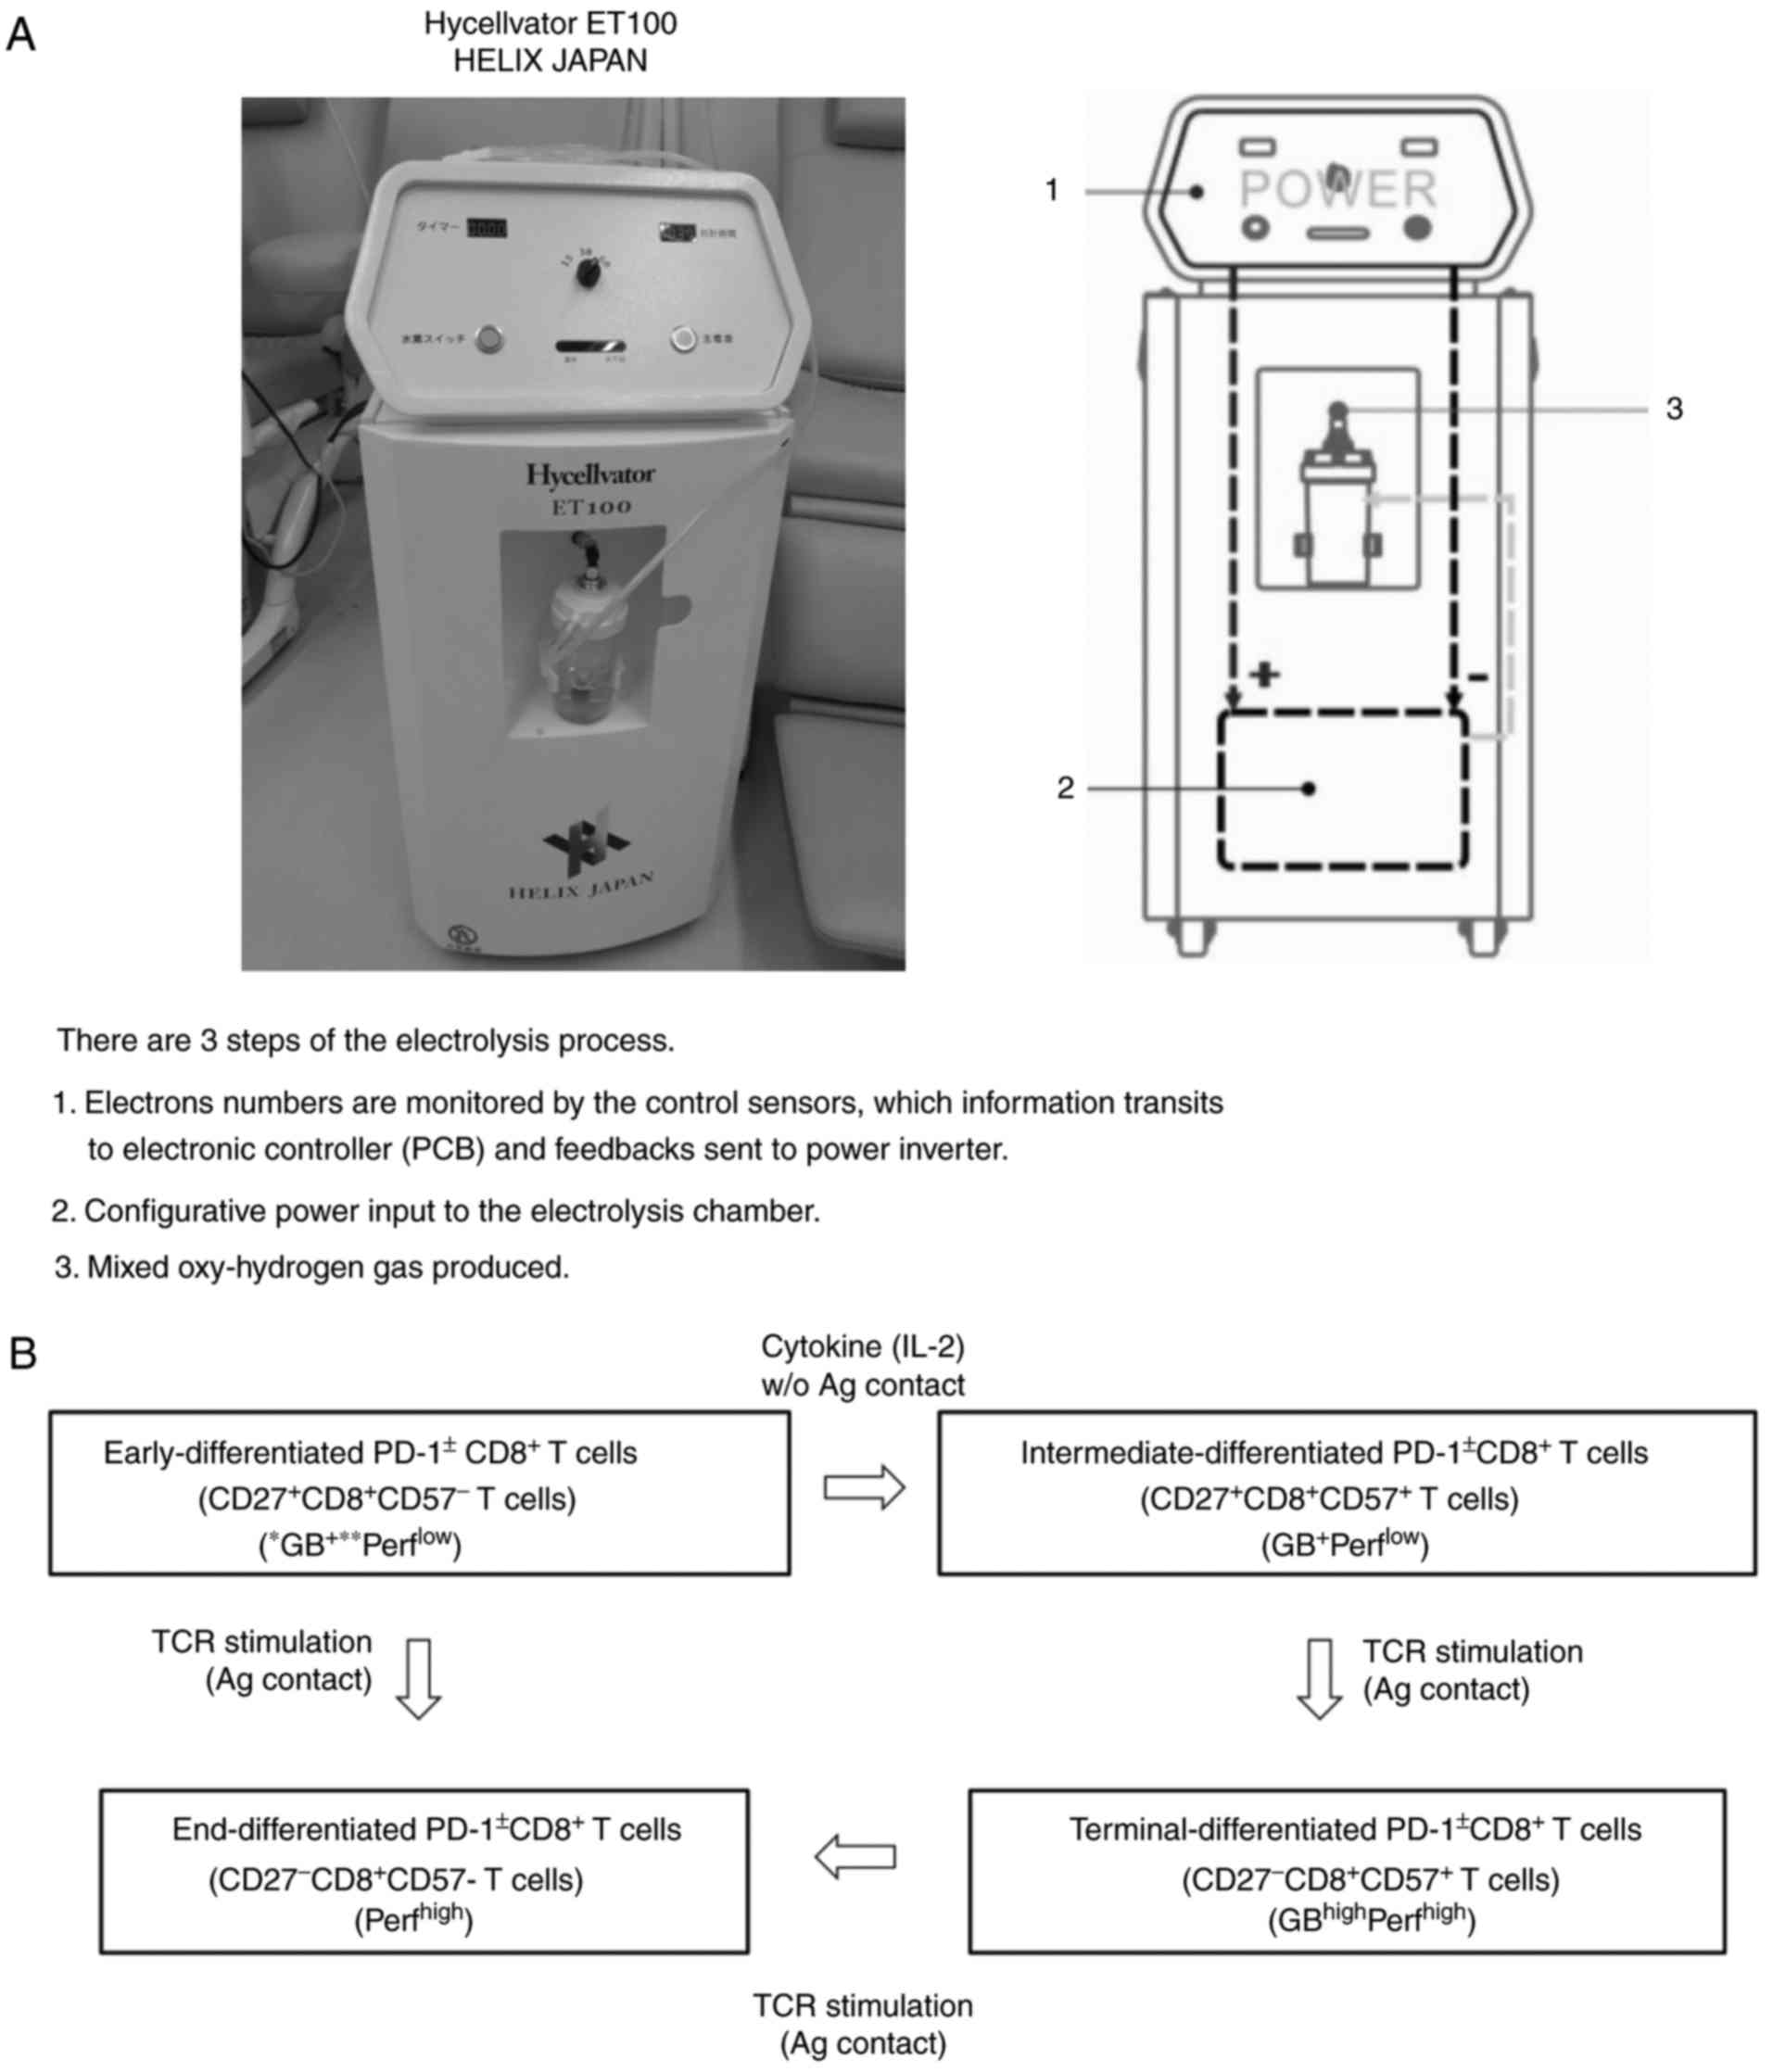
progression was confirmed by imaging. The patients inhaled hydrogen
gas for 3 h daily at their own homes through a cannula or mask,
rented or purchased by themselves, connected to a Hycellvator ET
100 (Helix Japan, Co., Ltd., Tokyo, Japan) (Fig. 1A). None of the patients reported any
complaints regarding the daily 3-h hydrogen gas inhalation.
Peripheral blood (10 ml) was collected from the patients prior to
and 3 months after treatment with hydrogen gas.
 | Table I.Comparison of clinicopathological
data between patients with high- and low-terminal PD-1+
CD8+ T cells. |
Table I.
Comparison of clinicopathological
data between patients with high- and low-terminal PD-1+
CD8+ T cells.
|
| Terminal
PD-1+ CD8+ T cells (PFS) |
| Terminal
PD-1+ CD8+ T cells (OS) |
|
|---|
|
|
|
|
|
|
|---|
| Characteristic | High >8.18% | Low <8.18% | P-value | High >6.81% | Low <6.81% | P-value |
|---|
| Age, years | 66.1±14.5 | 65.4±14.9 | NS | 66.1±14.3 | 65.2±15.6 | NS |
| Sex, n |
|
| NS |
|
| NS |
|
Male | 10 | 11 |
| 12 | 9 |
|
|
Female | 14 | 20 |
| 17 | 17 |
|
| T factor, n |
|
| NS |
|
| NS |
| T1 | 1 | 0 |
| 1 | 0 |
|
| T2 | 5 | 3 |
| 5 | 3 |
|
| T3 | 8 | 9 |
| 9 | 8 |
|
| T4 | 4 | 6 |
| 5 | 5 |
|
| Tx | 6 | 13 |
| 9 | 10 |
|
| N factor, n |
|
| NS |
|
| NS |
| N0 | 3 | 5 |
| 5 | 3 |
|
| N1 | 6 | 5 |
| 7 | 4 |
|
| N2 | 3 | 5 |
| 4 | 4 |
|
| N3 | 4 | 5 |
| 4 | 5 |
|
| Nx | 8 | 11 |
| 9 | 10 |
|
| M factor, n |
|
| NS |
|
| NS |
| M0 | 0 | 0 |
| 0 | 0 |
|
| M1 | 24 | 31 |
| 29 | 26 |
|
| Histology, n |
|
| NS |
|
| NS |
|
Tub1 | 6 | 9 |
| 8 | 7 |
|
|
Tub2 | 10 | 11 |
| 11 | 10 |
|
|
Poor | 8 | 11 |
| 10 | 9 |
|
Hydrogen gas treatment
The Hycellvator ET 100 (Helix Japan, Co., Ltd.)
generates 1.67 l/min hydrogen gas (hydrogen purity, 99.99%) by
electrolysis. As measured by gas chromatography at Kureha Special
Laboratory (Iwaki, Fukushima, Japan), the gas generated consisted
of 680,000 ppm hydrogen gas and 320,000 ppm oxygen gas. Recently,
hydrogen gas inhalation was used in patients with post-cardiac
arrest syndrome, and adverse events were not observed (31). Furthermore, no adverse events were
observed in the 55 patients who inhaled hydrogen gas for 3 months
in the present study.
Antibodies and fluorescence-activated
cell sorting (FACS)
Briefly, Ficoll-Hypaque solution (20 ml) was placed
into a 50-ml conical centrifuge tube using a sterile pipette.
Anti-coagulated blood (10 ml) mixed with an equal volume of PBS was
then slowly layered over the Ficoll-Hypaque solution by gently
pipetting down the side of the tube. Subsequently, samples were
centrifuged for 40 min at 400 × g and 22°C for 30–40 min with no
braking. Mononuclear cells that accumulated at the interface
between the plasma (upper) and Ficoll-Hypaque layers (bottom) were
carefully recovered using a Pasteur pipette and transferred to a
15-ml conical tube. Cells were then analyzed on a BD FACSCalibur
(Nippon Becton Dickinson, Tokyo, Japan) with BD CellQuest software
(version 5.1), using anti-CD57 conjugated to fluorescein
isothiocyanate (clone NK-1; cat. no. 347393; Nippon Becton
Dickinson), mouse anti-human CD27 conjugated to APC (clone M-T271;
cat. no. B09983; Beckman Coulter, Tokyo, Japan), mouse anti-human
PD-1 conjugated to PE (clone EH12.1; cat. no. 557946; Nippon
Beckton Dickinson) and mouse anti-human CD8 conjugated to PerCP
(clone SK1; cat. no. 347314) (BD Pharmingen, San Jose, CA, USA),
incubated at 4°C for 30 min, following blocking with 1% γ-globulin
for 15 min at 4°C. To determine the independent contributions of
each marker to PFS and OS, FACS data were used to stratify patients
based on the proportion of early, intermediate, terminal, and end
PD-1+ and PD-1− CD8+ T cells. All
blood samples obtained from the patients were transferred to SRL,
Inc. (Tokyo Japan), where lymphocyte separation and flow cytometry
were performed. Therefore, the status of the laboratory data,
reliable protocols and flow cytometry assays were certified by SRL,
Inc., one of the most reliable clinical laboratory centers in
Japan. The flow cytometry data was analyzed using SPSS version 19.0
for Windows (IBM Corp., Armonk, NY, USA).
Study endpoints and assessments
The primary endpoints were PFS and OS time, which
were measured from the date of randomization to the first
recurrence and mortality regardless of cause, respectively.
Patients were monitored by dynamic computed tomography or magnetic
resonance imaging every 3 months from the baseline up to 60 months
and every 3–6 months thereafter. Two independent and blinded
radiologists, each with >5 years of experience, reviewed all
scans at each site. In cases of discord, the two radiologists
reviewed the images to reach the same conclusion following
discussion. Adverse events were classified and graded every 2
months according to the Common Terminology Criteria for Adverse
Events version 3.0 (National Cancer Institute, Bethesda, MD, USA)
(32) from the day of consent until
the end of the study at least 30 days after the treatment. Multiple
events were counted once for each patient, of which the most severe
was noted.
Statistical analysis
Testing of the significance of the differences
between groups was performed using the χ2 test. In case
of persistent abnormal distribution, the linear correlation between
two continuous variables was tested with the Spearman correlation
coefficient. Receiver operating characteristic (ROC) analysis was
used to determine optimal cut-off values for continuous variables.
The ROC curve shows 1-specificity on the x-axis and sensitivity on
the y-axis. The optimal cut-off value is calculated by maximizing
the sensitivity and specificity across various cut-off points on
the ROC curve. The probability of survival was estimated by the
Kaplan-Meier method, and differences in survival were evaluated by
the log-rank test. Prognostic factors were tested by univariate and
multivariate Cox regression. All statistical analyses were
performed using SPSS version 19.0 for Windows (IBM Corp.).
Differences were considered statistically significant at
P<0.05.
Results
Circulating terminal PD-1+
CD8+ T cells are critical for prognosis in colorectal
cancer
In the normal state, early CD8+ T cells
abundantly express PD-1, which gradually diminishes with
differentiation into terminal CD8+ T cells. However,
loss of PD-1 is delayed in patients with cancer and may result in a
poor prognosis. Hence, Cox proportional-hazards regression analysis
was used to identify PD-1+/− CD8+ T cell
subsets (Fig. 1B) and
clinicopathological factors [age, sex, primary tumor (T), regional
lymph nodes (N), distant metastasis (M) and histology] associated
with PFS and OS in patients with stage IV colorectal cancer. By
univariate analysis of 18 factors, including 6 clinicopathological
factors, terminal PD-1+ CD8+ T cells were
found to be significantly associated with poorer PFS [hazard ratio
(HR), 1.239; 95% confidence interval (CI), 1.106–1.389;
P<0.0001] and OS (HR, 1.183; 95% CI, 1.066–1.314; P=0.002), as
were end PD-1+ CD8+ T cells (PFS: HR, 1.296;
95% CI, 1.053–1.595; P=0.015; OS: HR, 1.333; 95% CI, 1.103–1.610;
P=0.003). By contrast, early PD-1− and end
PD-1− CD8+ T cells were associated with
better (HR, 0.961; 95% CI, 0.926–0.997; P=0.036) and worse (HR,
1.044; 95% CI, 1.005–1.084; P=0.025) OS, respectively. The
univariate analysis data of the other 14 factors for PFS and OS,
respectively, were as follows: Age, P=0.270 and P=0.886; sex,
P=0.894 and P=0.398; T factor, P=0.332 and P=0.664; N factor,
P=0.080 and P=0.150; M factor (the univariate analysis could not be
performed as all patients had distant metastasis); histology,
P=0.503 and P=0.184; early CD8+ T cells, P=0.953 and
P=0.273; early PD-1+ CD8+ T cells, P=0.757
and P=0.560; intermediate CD8+ T cells, P=0.434 and
P=0.560; intermediate PD-1+ CD8+ T cells
P=0.799 and P=0.505; intermediate PD-1− CD8+
T cells P=0.137 and P=0.099; terminal CD8+ T cells,
P=0.453 and P=0.595; terminal PD-1− CD8+ T
cells, P=0.681 and P=0.886; and end CD8+ T cells,
P=0.285 and P=0.566.
Based on multivariate Cox regression, terminal
PD-1+ CD8+ T cells were more strongly
associated with PFS (HR, 1.239; 95% CI, 1.106–1.389; P<0.0001)
and OS (HR, 1.136; 95% CI, 1.019–1.266; P=0.022) than others. The
multivariate data of the other 3 factors were as follows: Early
PD-1− CD8+ T cells, P=0.677 for PFS and
P=0.352 for OS; end PD-1+ CD8+ T cells,
P=0.274 for PFS; HR, 1.247; 95% CI, 1.007–1.543; P=0.043; and end
PD-1− CD8+ T cells, P=0.561 for PFS and
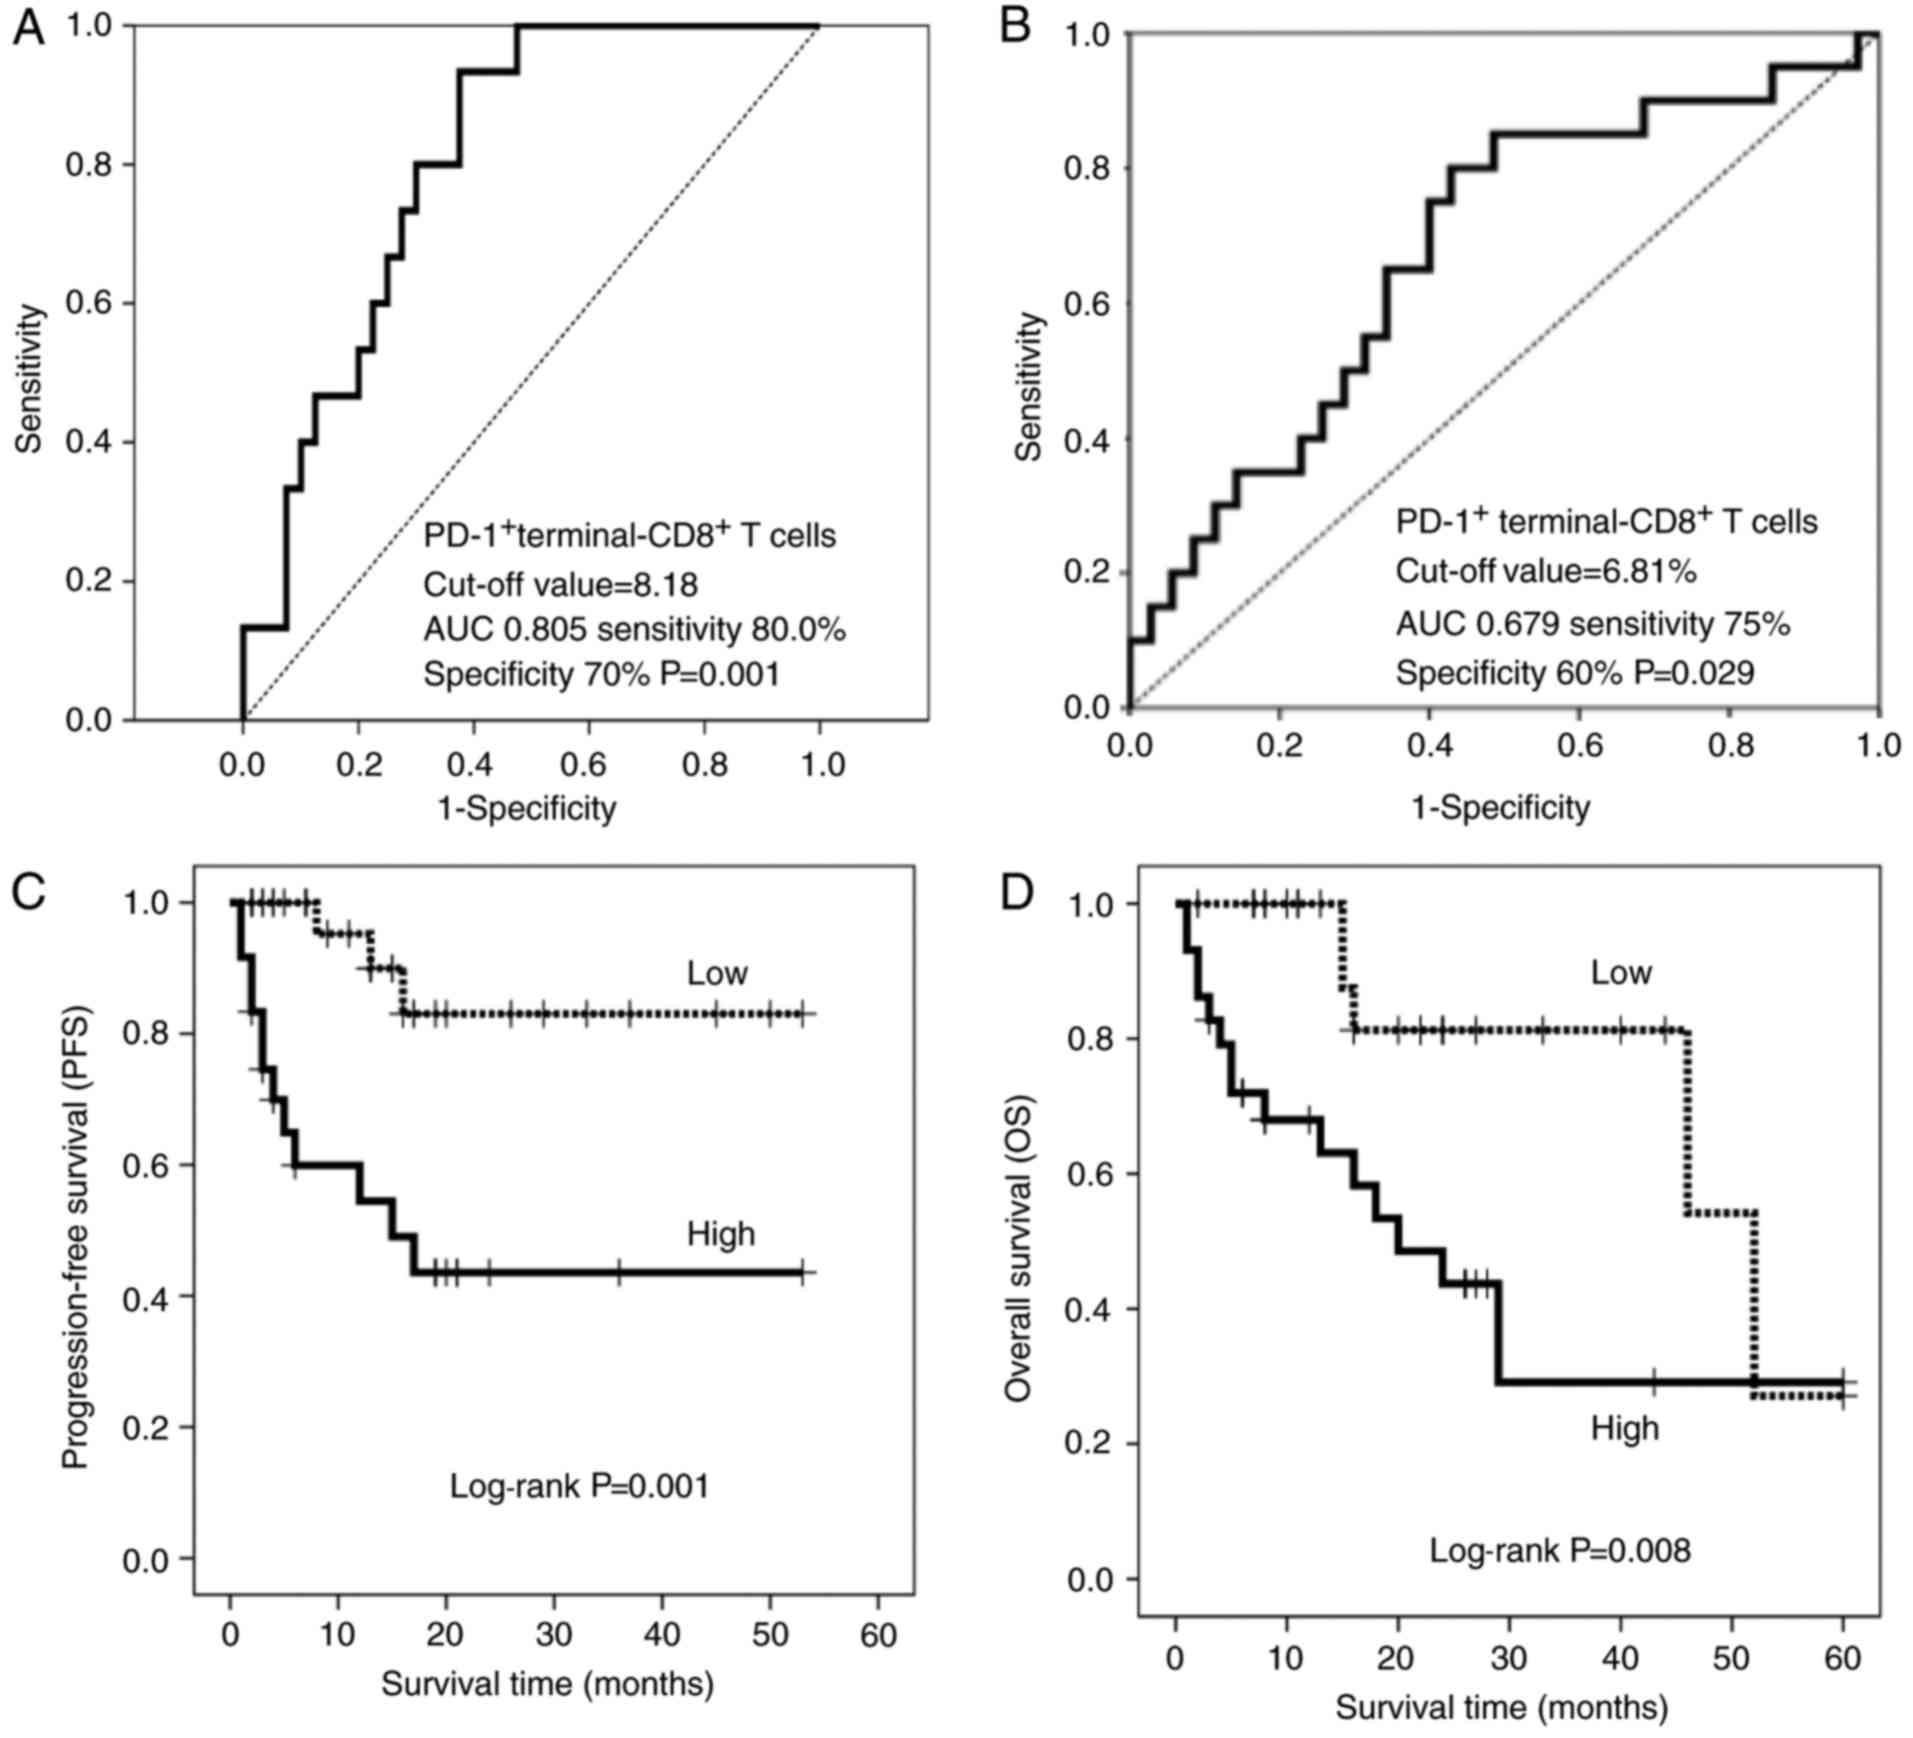
P=0.206 for OS). Accordingly, patients were stratified based on the
abundance of terminal PD-1+ CD8+ T cells,
using cut-off values of 8.18 and 6.81% for PFS and OS,
respectively, as determined from receiver operating characteristic
curves (Fig. 2A and B). There were
no significant differences in clinicopathological factors between
the patients with high and low terminal PD-1+
CD8+ T cells (Table I).
The resulting stratified Kaplan-Meier survival curves revealed that
PFS (log-rank test, P=0.001) and OS (log-rank test, P=0.008) were
significantly worse for patients with terminal PD-1+
CD8+ T cells higher than the cut-off (Fig. 2C and D). The median PFS time was 18
months for the patients with a high-terminal PD-1+
CD8+ T cell ratio, but was not reached (>50% of
patients remained alive) for those with a low-terminal
PD-1+ CD8+ T cell ratio, while OS was 18
months for the patients with a high-terminal PD-1+
CD8+ T cell ratio and 46 months for those with a
low-terminal PD-1+ CD8+ T cell ratio.
Hydrogen gas reduces the proportion of
PD-1+ CD8+ T cells and improves
prognosis
Molecular hydrogen was reported to activate PGC-1α
(28), which enhances mitochondrial
activity (29), thereby rescuing
exhausted CD8+ T cells with inactive mitochondria
following progressive loss of PGC-1α (15). Therefore, the present study
investigated whether hydrogen gas alters the proportion of
PD-1+/− CD8+ T cell subsets and whether
alterations, if any, are associated with prognosis in patients with
stage IV cancer. Notably, hydrogen gas reduced the proportion of
early, intermediate, terminal and end PD-1+
CD8+ T cells in 27 (49.1%), 28 (50.9%), 35 (63.6%) and
32 (58.2%) out of 55 patients, respectively. Conversely, hydrogen
gas enhanced the proportion of early, intermediate, terminal and
end PD-1− CD8+ T cells in 32 (58.2%), 27
(49.1%), 39 (70.9%) and 31 (56.4%) patients, respectively.
Univariate analysis showed that the ratio of the proportion of
intermediate PD-1+ CD8+ T cells following
treatment with hydrogen gas to that prior to treatment
(intermediate PD-1+ CD8+ T cell ratio) was
significantly associated with shorter PFS (HR, 2.286; 95% CI,
1.284–4.070; P=0.005) and OS (HR, 2.398; 95% CI, 1.384–4.156;
P=0.002) times. Similar associations were observed for the
intermediate PD-1− CD8+ T cell ratio (PFS:
HR, 2.286; 95% CI, 1.284–4.070; P=0.005; OS: HR, 2.398; 95%
confidence interval, 1.384–4.156; P=0.002) and terminal
PD-1+ CD8+ T cell ratio (PFS: HR, 6.459; 95%
CI, 2.384–17.50; P<0.0001; OS: HR, 4.158; 95% CI, 1.718–10.06;
P=0.002). By contrast, the early PD-1− CD8+ T
cell ratio was predictive of worse OS time (HR, 2.398; 95% CI,
1.384–4.156; P=0.002), whereas the terminal PD-1−
CD8+ T cell ratio was significantly associated with
increased overall survival time (HR, 0.002; 95% CI, 0.000–0.131;
P=0.004). For the multivariate analysis, the terminal
PD-1+ CD8+ T cell ratio was found to be an
independent predictor of poor PFS (HR, 6.459; 95% CI, 2.384–17.50;
P<0.0001) and OS (HR, 2.957; 95% CI, 1.185–7.378; P=0.020).
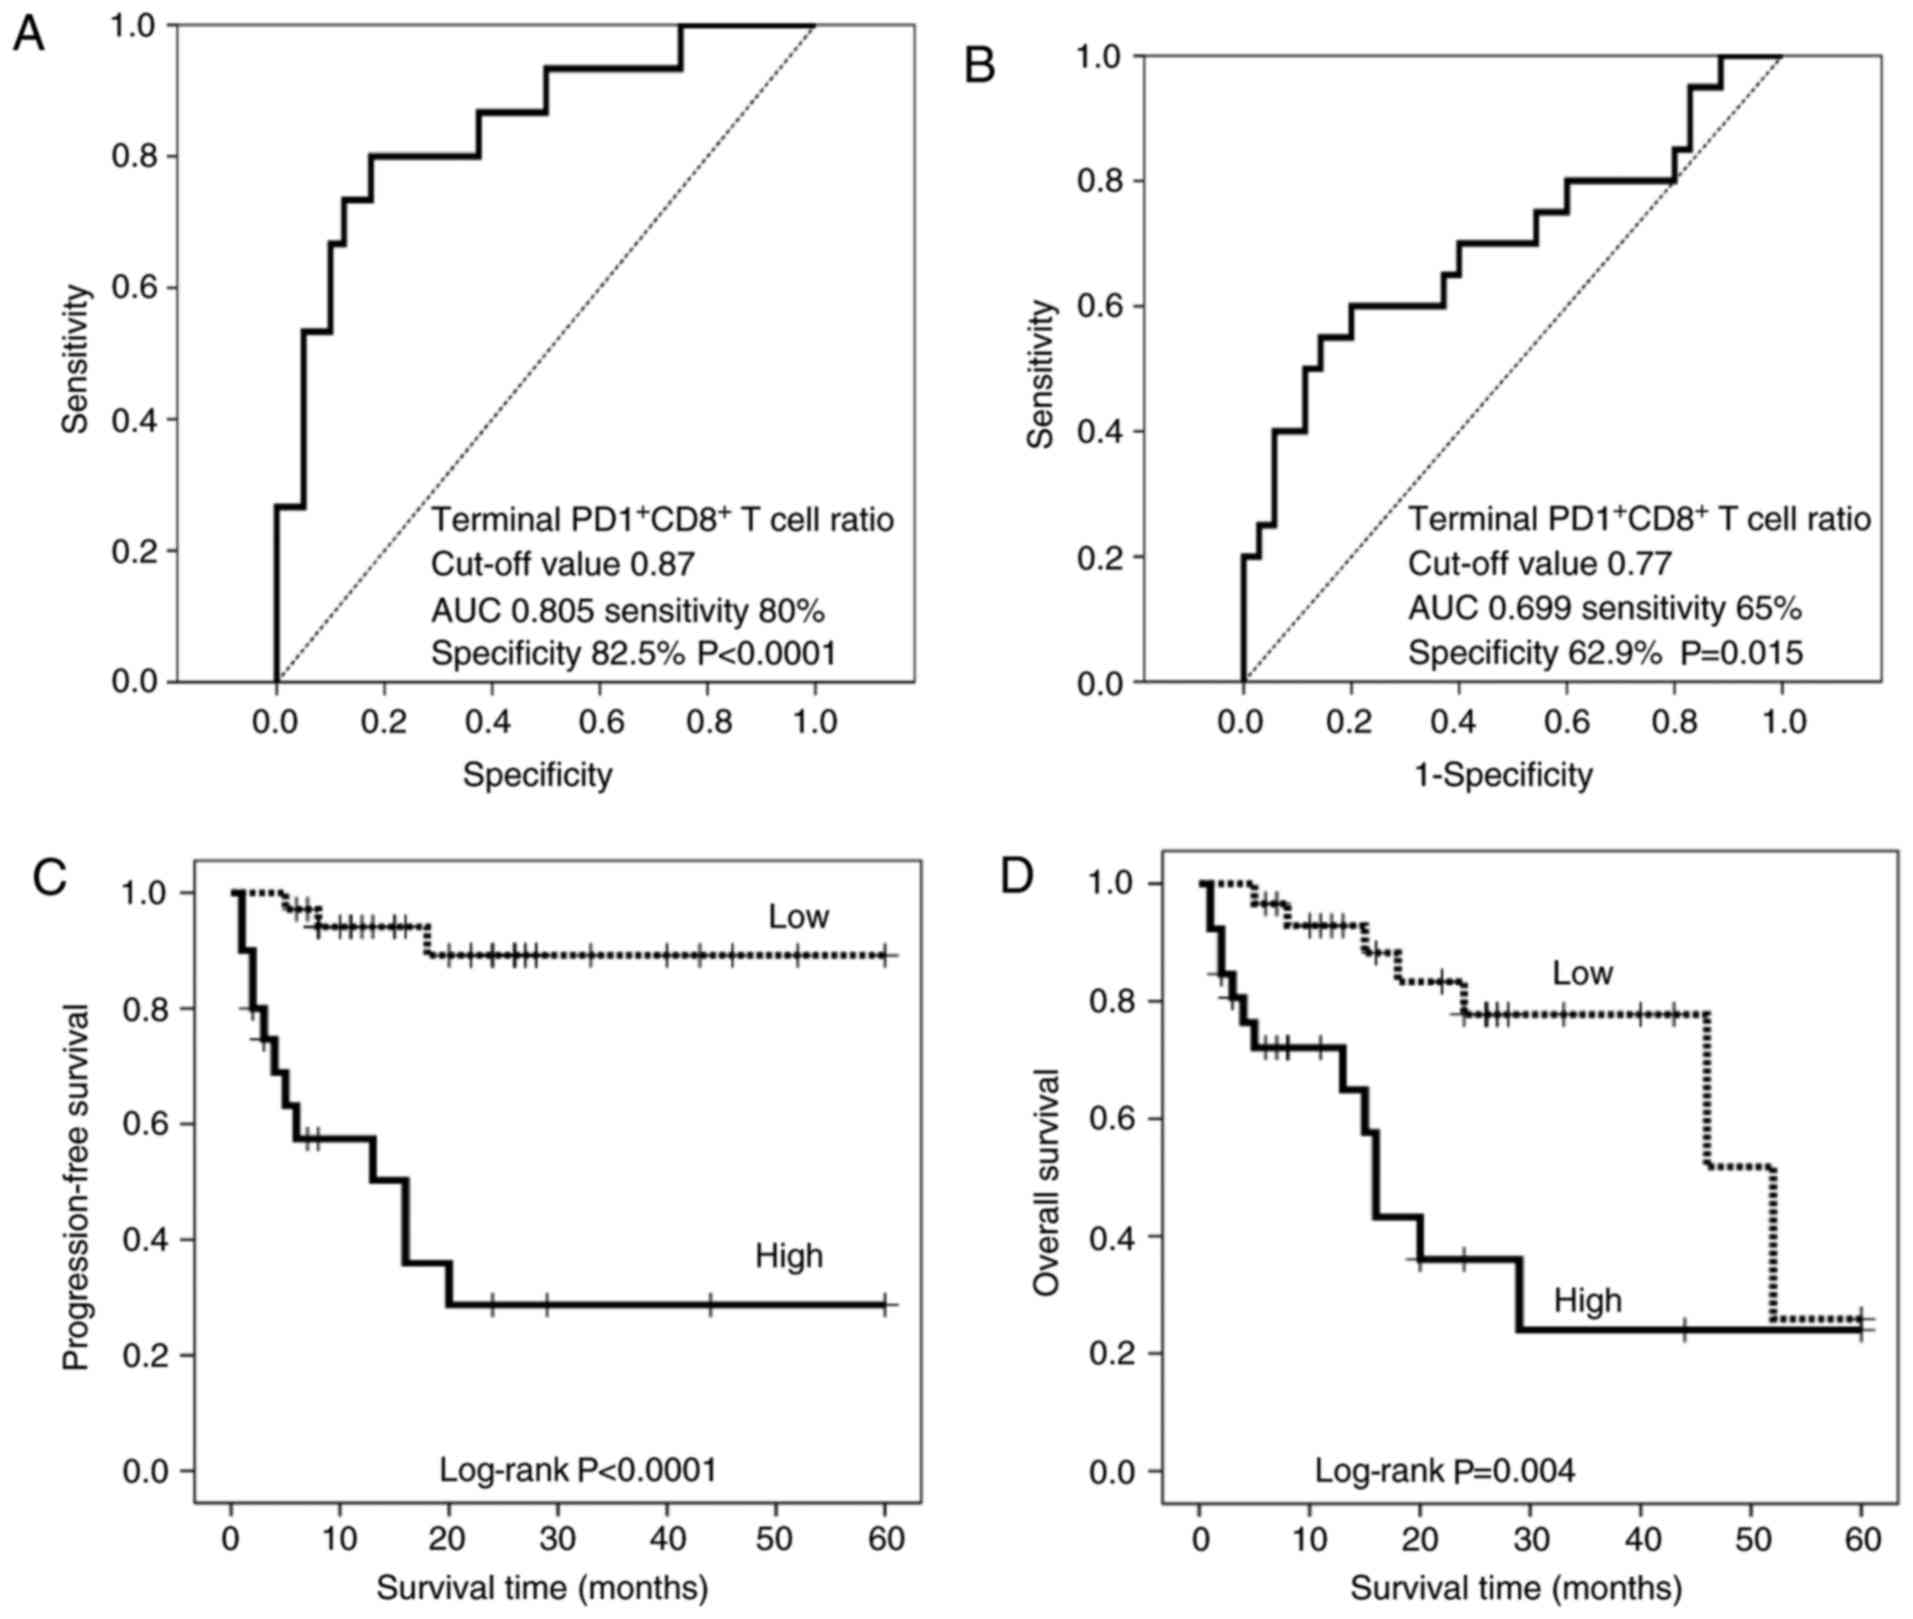
Based on these results, patients were stratified as having a high
and low terminal PD-1+ CD8+ T cell ratio
using cut-off values of 0.87 and 0.77% for PFS and OS, respectively
(Fig. 3A and B). There were no
significant differences in clinicopathological factors between the
patients with high and low terminal PD-1+
CD8+ T cell ratio (Table
II). The resulting stratified PFS and OS curves are plotted in
Fig. 3C and D, and show that
patients with a low terminal PD-1+ CD8+ T
cell ratio have significantly increased PFS (P<0.0001) and OS
(P=0.004) times compared with those with high ratios. The median
follow-up time was 13 months for the patients with a high-terminal
PD-1+ CD8+ T cell ratio, but was not reached
(>50% of patients remained alive) for those with a low-terminal
PD-1+ CD8+ T cello ratio, while that of OS
was 15 months for the patients with a high-terminal
PD-1+ CD8+ T cell ratio and 46 months for
those with a low-terminal PD-1+ CD8+ T cell
ratio.
| Table II.Comparison of clinicopathological
data between patients with high- and low-terminal PD-1+
CD8+ T cell ratio (the ratio of terminal
PD-1+ CD8+ T cells following the hydrogen
treatment to prior to it). |
Table II.
Comparison of clinicopathological
data between patients with high- and low-terminal PD-1+
CD8+ T cell ratio (the ratio of terminal
PD-1+ CD8+ T cells following the hydrogen
treatment to prior to it).
|
| Terminal
PD-1+ CD8+ T cell ratio (PFS) |
| Terminal
PD-1+ CD8+ T cell ratio (OS) |
|
|---|
|
|
|
|
|
|
|---|
| Characteristic | High >0.87% | Low <0.87% | P-value | High >0.77% | Low <0.77% | P-value |
|---|
| Age, years | 64.1±17.4 | 66.6±13.2 | NS | 65.3±15.8 | 66.0±14.0 | NS |
| Sex, n |
|
| NS |
|
| NS |
|
Male | 10 | 11 |
| 13 | 8 |
|
|
Female | 10 | 24 |
| 13 | 21 |
|
| T factor, n |
|
|
|
|
| NS |
| T1 | 0 | 1 |
| 1 | 0 |
|
| T2 | 1 | 3 |
| 2 | 2 |
|
| T3 | 3 | 10 | NS | 5 | 8 |
|
| T4 | 3 | 8 |
| 3 | 8 |
|
| Tx | 13 | 13 |
| 15 | 11 |
|
| N factor, n |
|
| NS |
|
| NS |
| N0 | 0 | 5 |
| 1 | 4 |
|
| N1 | 1 | 6 |
| 2 | 5 |
|
| N2 | 4 | 4 |
| 5 | 3 |
|
| N3 | 1 | 5 |
| 2 | 4 |
|
| Nx | 14 | 15 |
| 16 | 13 |
|
| M factor, n |
|
| NS |
|
| NS |
| M0 | 0 | 0 |
| 0 | 0 |
|
| M1 | 20 | 35 |
| 26 | 29 |
|
| Histology, n |
|
| NS |
|
| NS |
|
Tub1 | 5 | 15 |
| 8 | 12 |
|
|
Tub2 | 7 | 11 |
| 9 | 9 |
|
|
Poor | 8 | 9 |
| 9 | 8 |
|
Hydrogen-induced accumulation of
terminal PD-1− CD8+ T cells is associated
with an improved prognosis
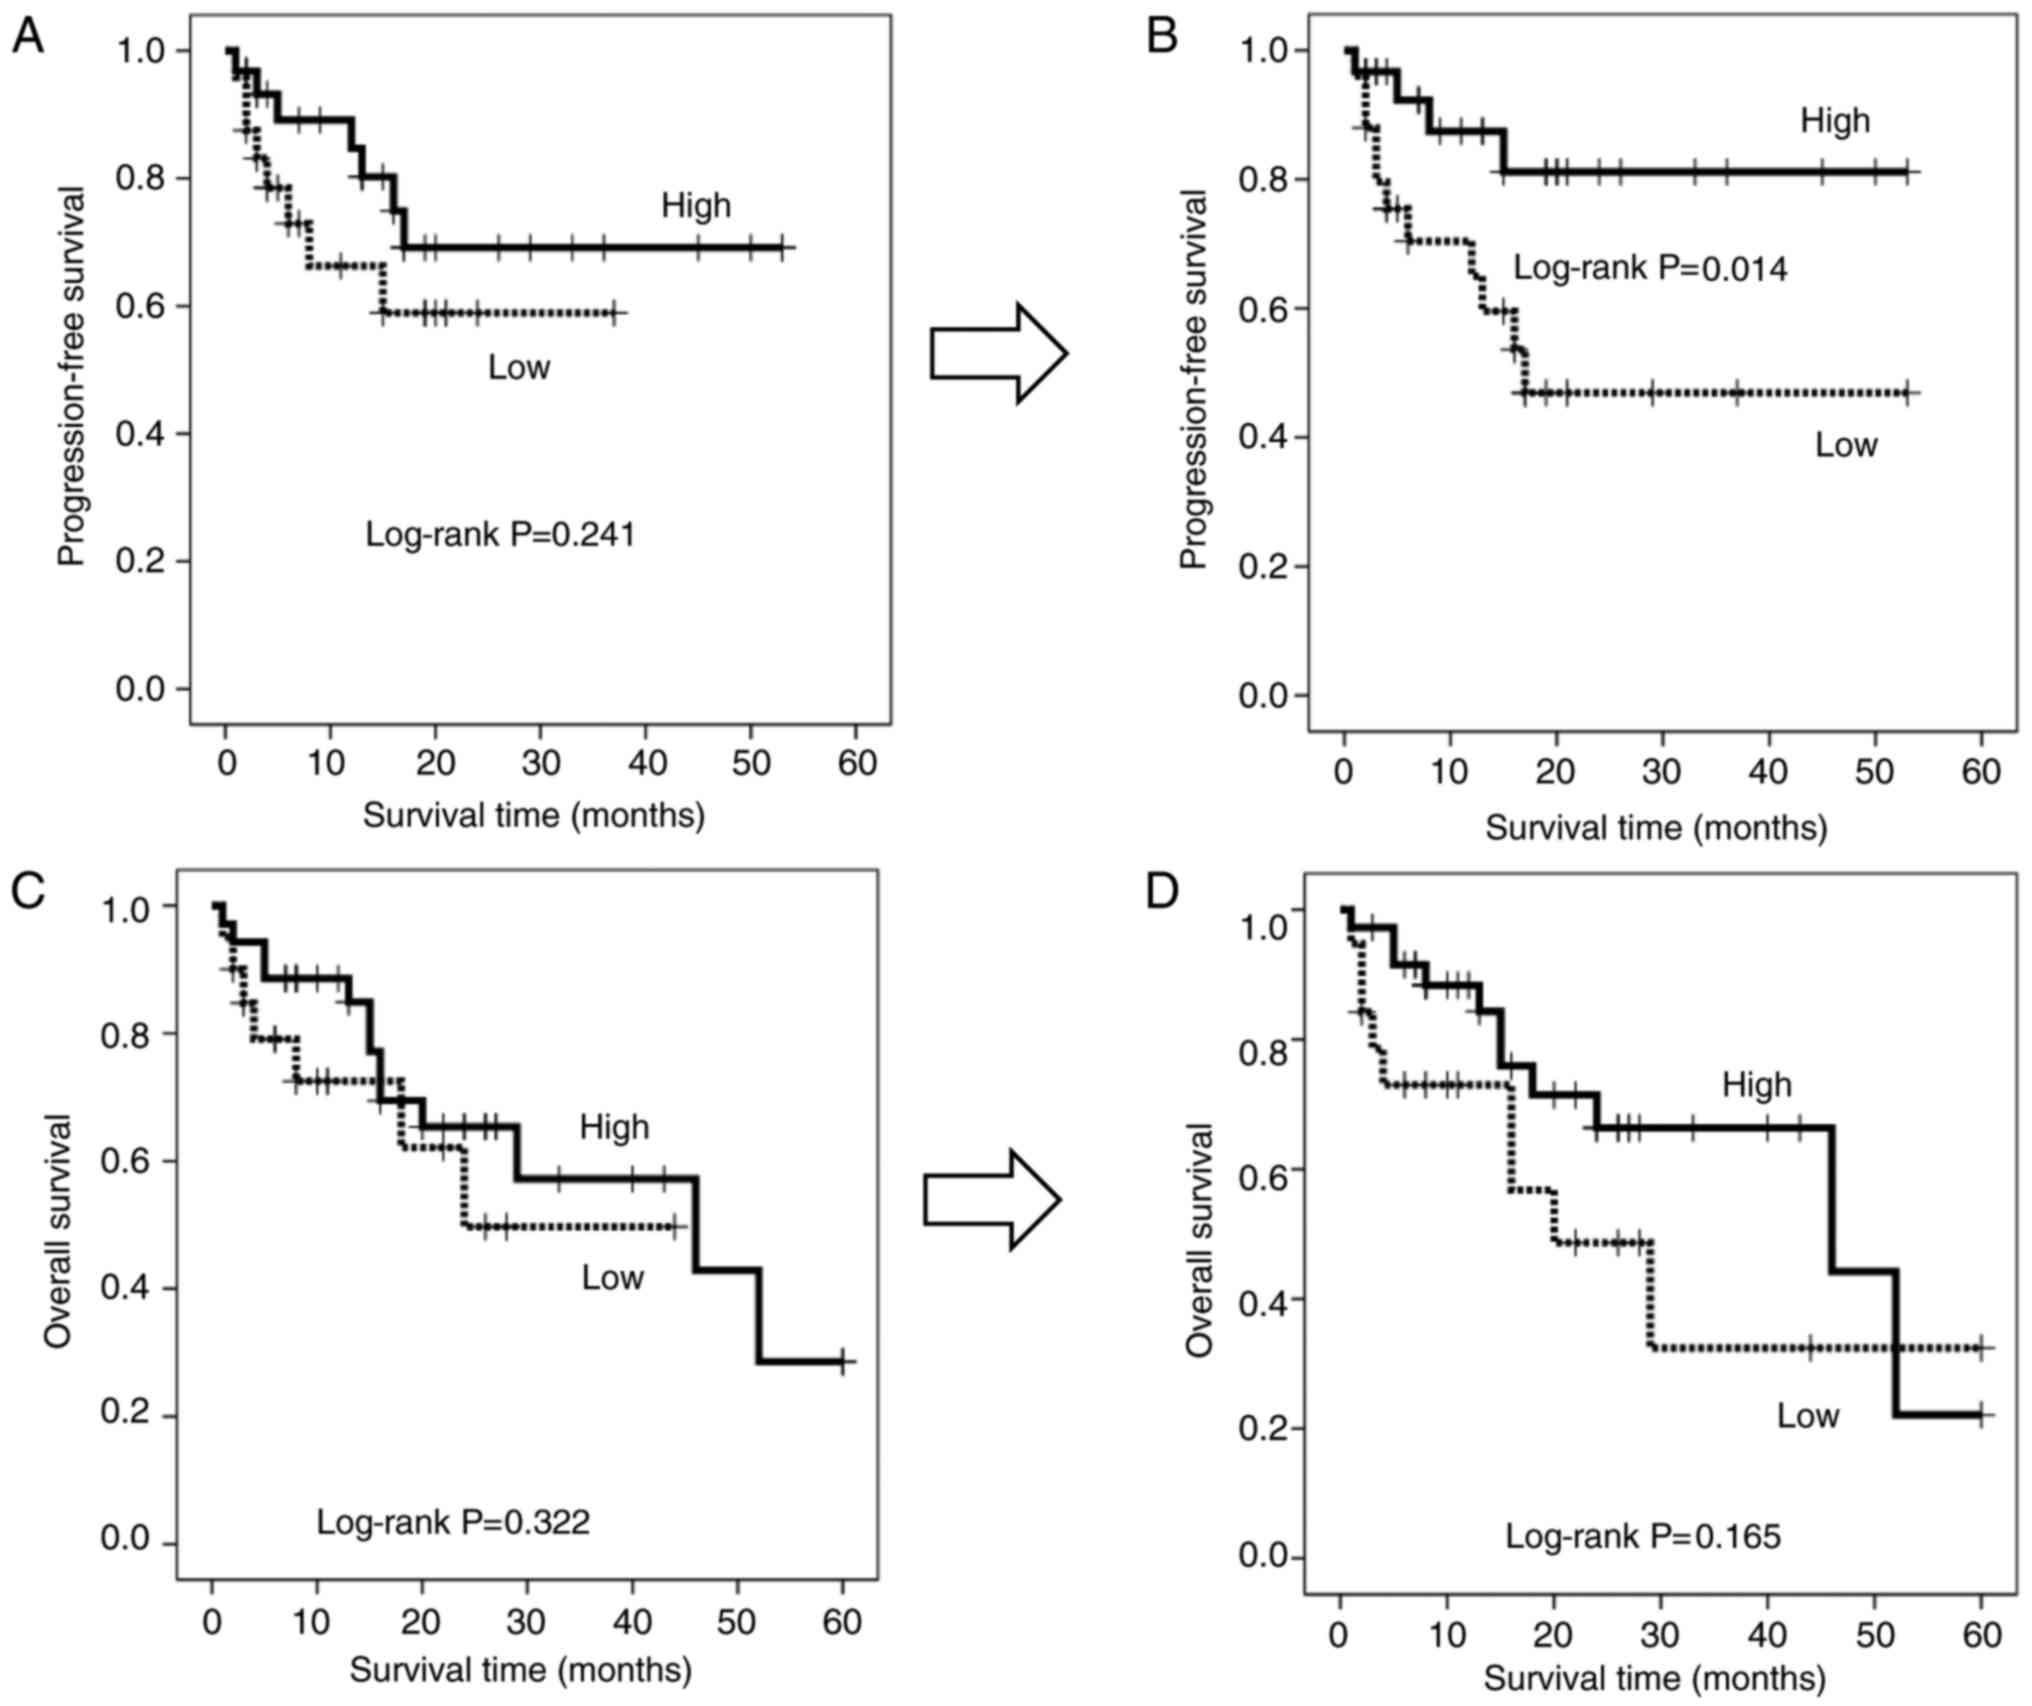
Based on the hypothesis that hydrogen gas may
activate mitochondrial function and thereby convert exhausted
terminal PD-1+ CD8+ T cells into active
terminal PD-1− CD8+ T cells, the present
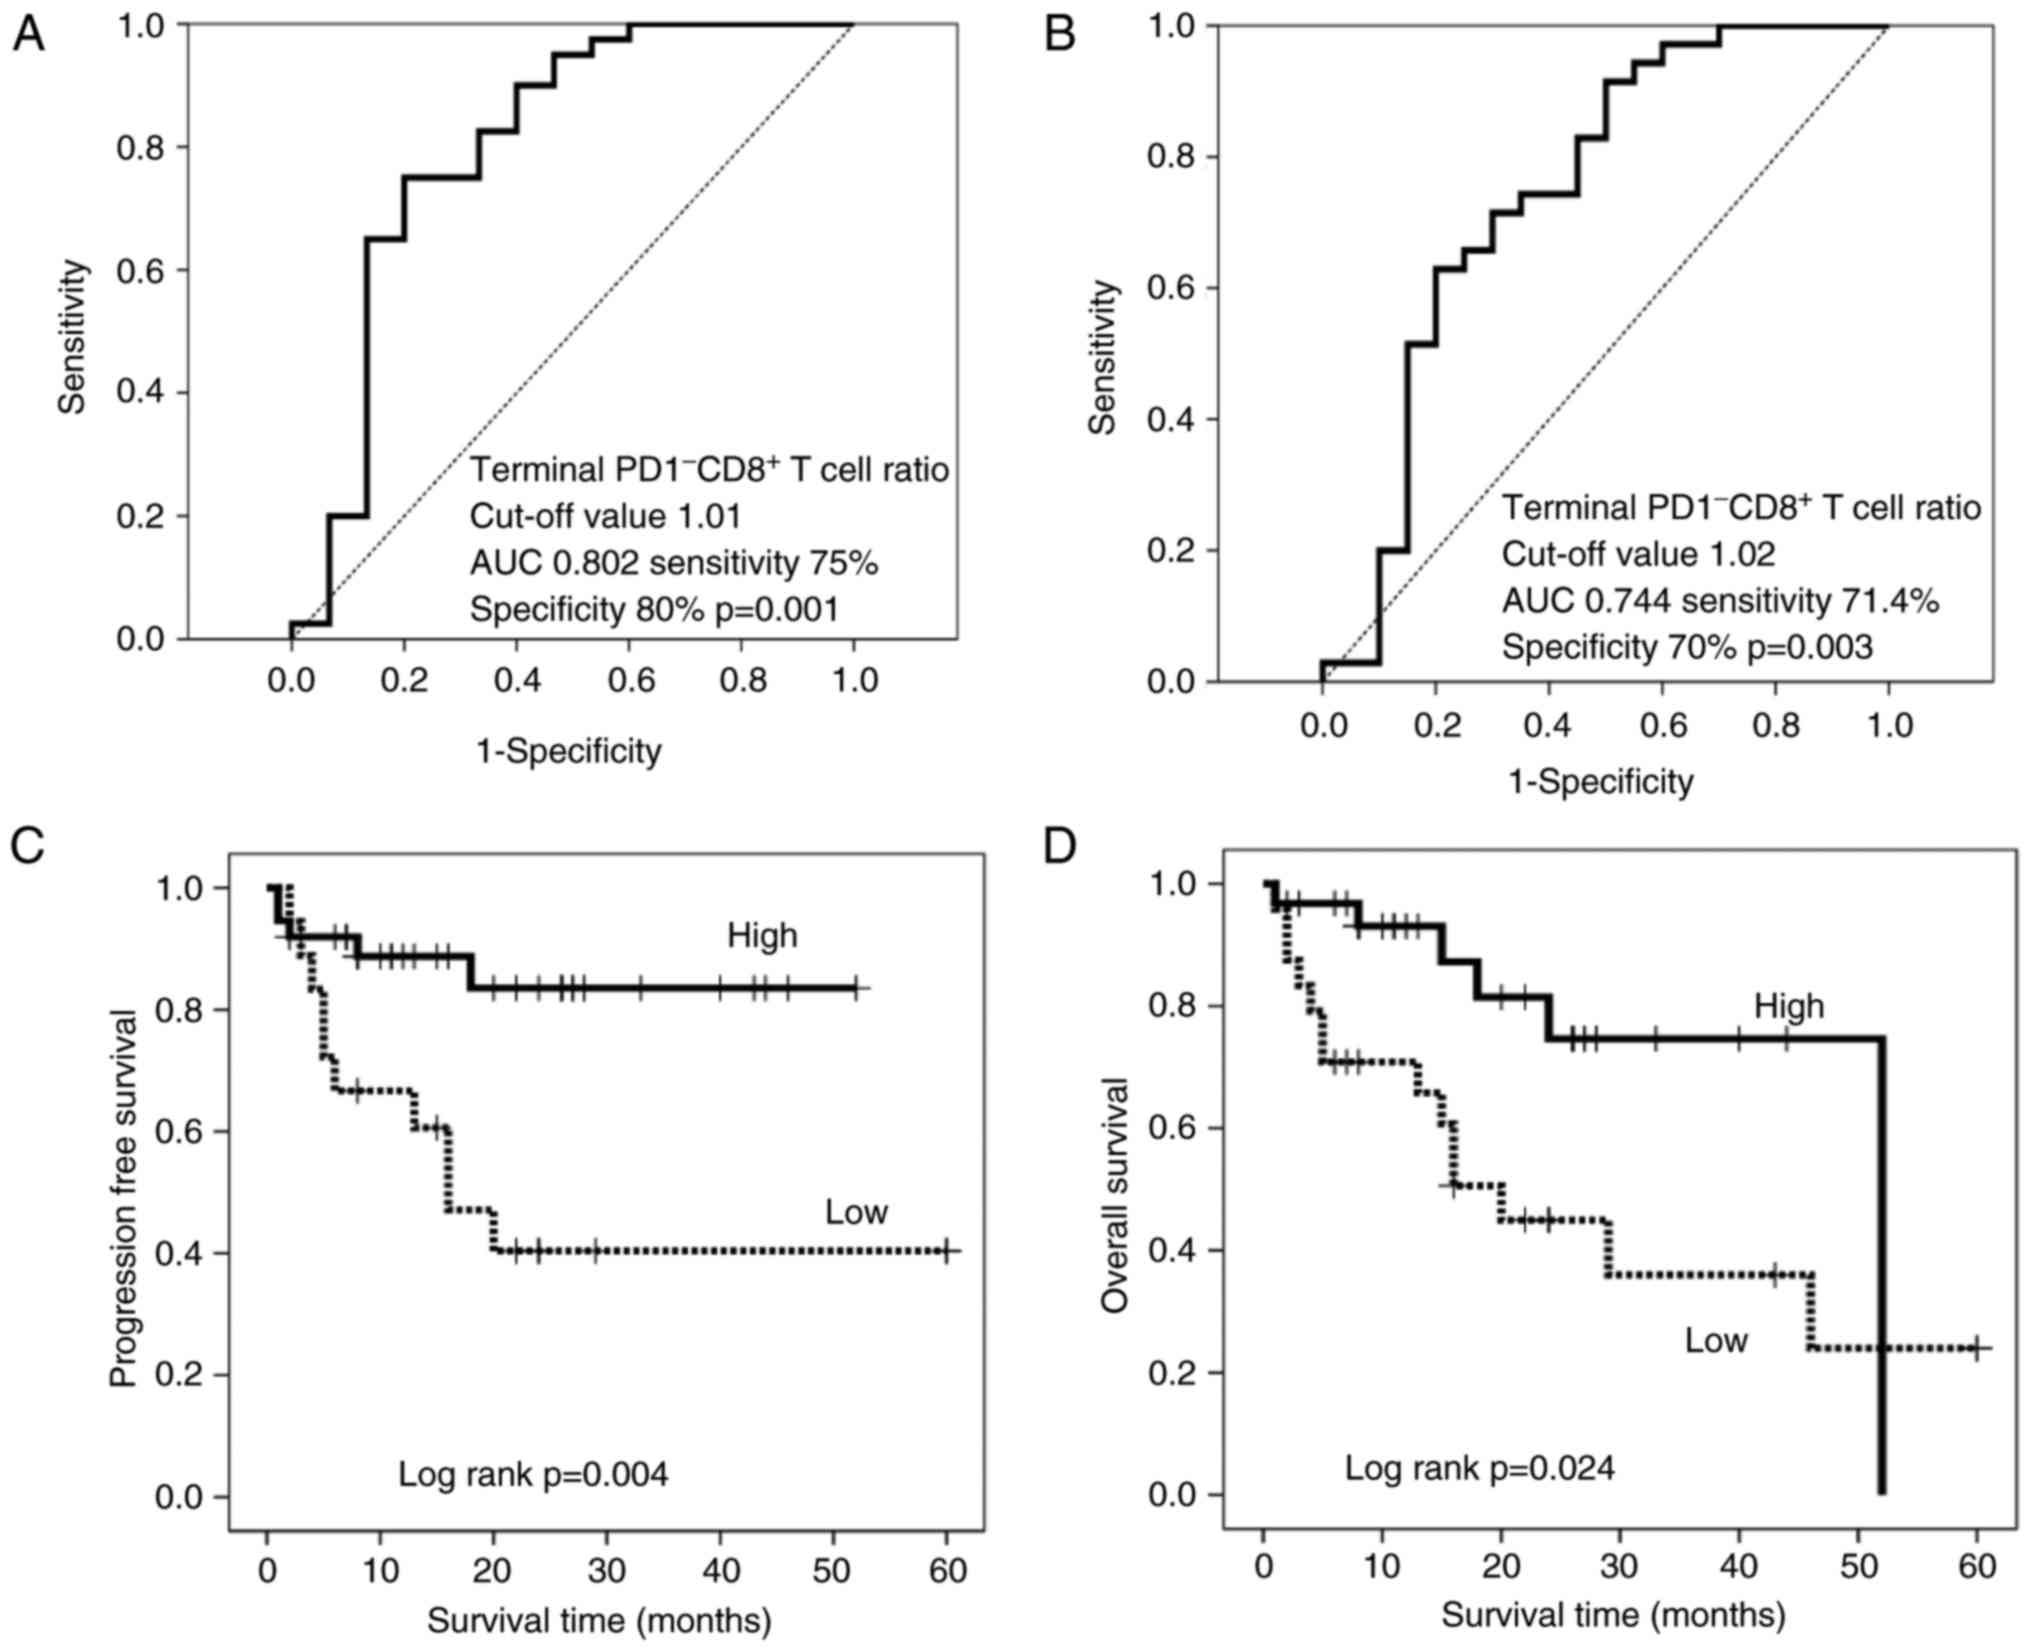
study investigated whether the change in the abundance of the
latter impacts prognosis in patients treated with hydrogen gas.
Thus, patients were stratified by the terminal PD-1−
CD8+ T cell ratio based on cut-off values of 1.01 and
1.02 for PFS (Fig. 4A) and OS
(Fig. 4B), respectively. There were
no significant differences in clinicopathological factors between
the patients with high- and low-terminal PD-1−
CD8+ T cell ratios (Table
III). The resulting stratified survival curves are plotted in
Fig. 4C and D, respectively, and
indicate that patients with high ratios have significantly
increased PFS (P=0.004) and OS (P=0.024) times compared with those
with low ratios. The median follow-up time was 15 months for the
patients with a low-terminal PD-1− CD8+ T
cell ratio, but was not reached (>50% of patients remained
alive) for those with a high-terminal PD-1−
CD8+ T cell ratio, while that of OS was 16 months for
the patients with a low-terminal PD-1− CD8+ T
cell ratio and 52 months for those with a high-terminal
PD-1− CD8+ T cell ratio. Furthermore,
hydrogen gas treatment resulted in a significantly longer PFS time
(P=0.014) and a generally longer, but non-significant, OS time
(P=0.165) in patients with a high level of terminal
PD-1− CD8+ T cells compared with that in
patients with a low level, although there was no significant
difference between the groups prior to treatment (Fig. 5A and C).
| Table III.Comparison of clinicopathological
data between patients with high- and low-terminal PD-1−
CD8+ T cell ratio. |
Table III.
Comparison of clinicopathological
data between patients with high- and low-terminal PD-1−
CD8+ T cell ratio.
|
| Terminal
PD-1− CD8+ T cell ratio (PFS) |
| Terminal
PD-1− CD8+ T cell ratio (OS) |
|
|---|
|
|
|
|
|
|
|---|
| Characteristic | High >1.01% | Low <1.01% | P-value | High >1.02% | Low <1.02% | P-value |
|---|
| Age, years | 65.8±13.8 | 65.3±17.0 | NS | 64.7±13.8 | 66.9±16.2 | NS |
| Sex |
|
| NS |
|
| NS |
|
Male | 13 | 8 |
| 10 | 11 |
|
|
Female | 24 | 10 |
| 21 | 13 |
|
| T factor |
|
| NS |
|
| NS |
| T1 | 1 | 0 |
| 1 | 0 |
|
| T2 | 2 | 2 |
| 2 | 2 |
|
| T3 | 12 | 1 |
| 11 | 2 |
|
| T4 | 8 | 3 |
| 6 | 5 |
|
| Tx | 14 | 12 |
| 11 | 15 |
|
| N factor |
|
| NS |
|
| NS |
| N0 | 5 | 0 |
| 4 | 1 |
|
| N1 | 5 | 2 |
| 5 | 2 |
|
| N2 | 4 | 4 |
| 3 | 5 |
|
| N3 | 5 | 1 |
| 5 | 1 |
|
| Nx | 18 | 11 |
| 14 | 15 |
|
| M factor |
|
| NS |
|
| NS |
| M0 | 0 | 0 |
| 0 | 0 |
|
| M1 | 37 | 18 |
| 31 | 24 |
|
| Histology |
|
| NS |
|
| NS |
|
Tub1 | 14 | 6 |
| 13 | 7 |
|
|
Tub2 | 13 | 5 |
| 12 | 6 |
|
|
Poor | 10 | 7 |
| 6 | 11 |
|
Serum terminal PD-1+/−
CD8+ T cells are important immune indices in patients
with advanced cancer
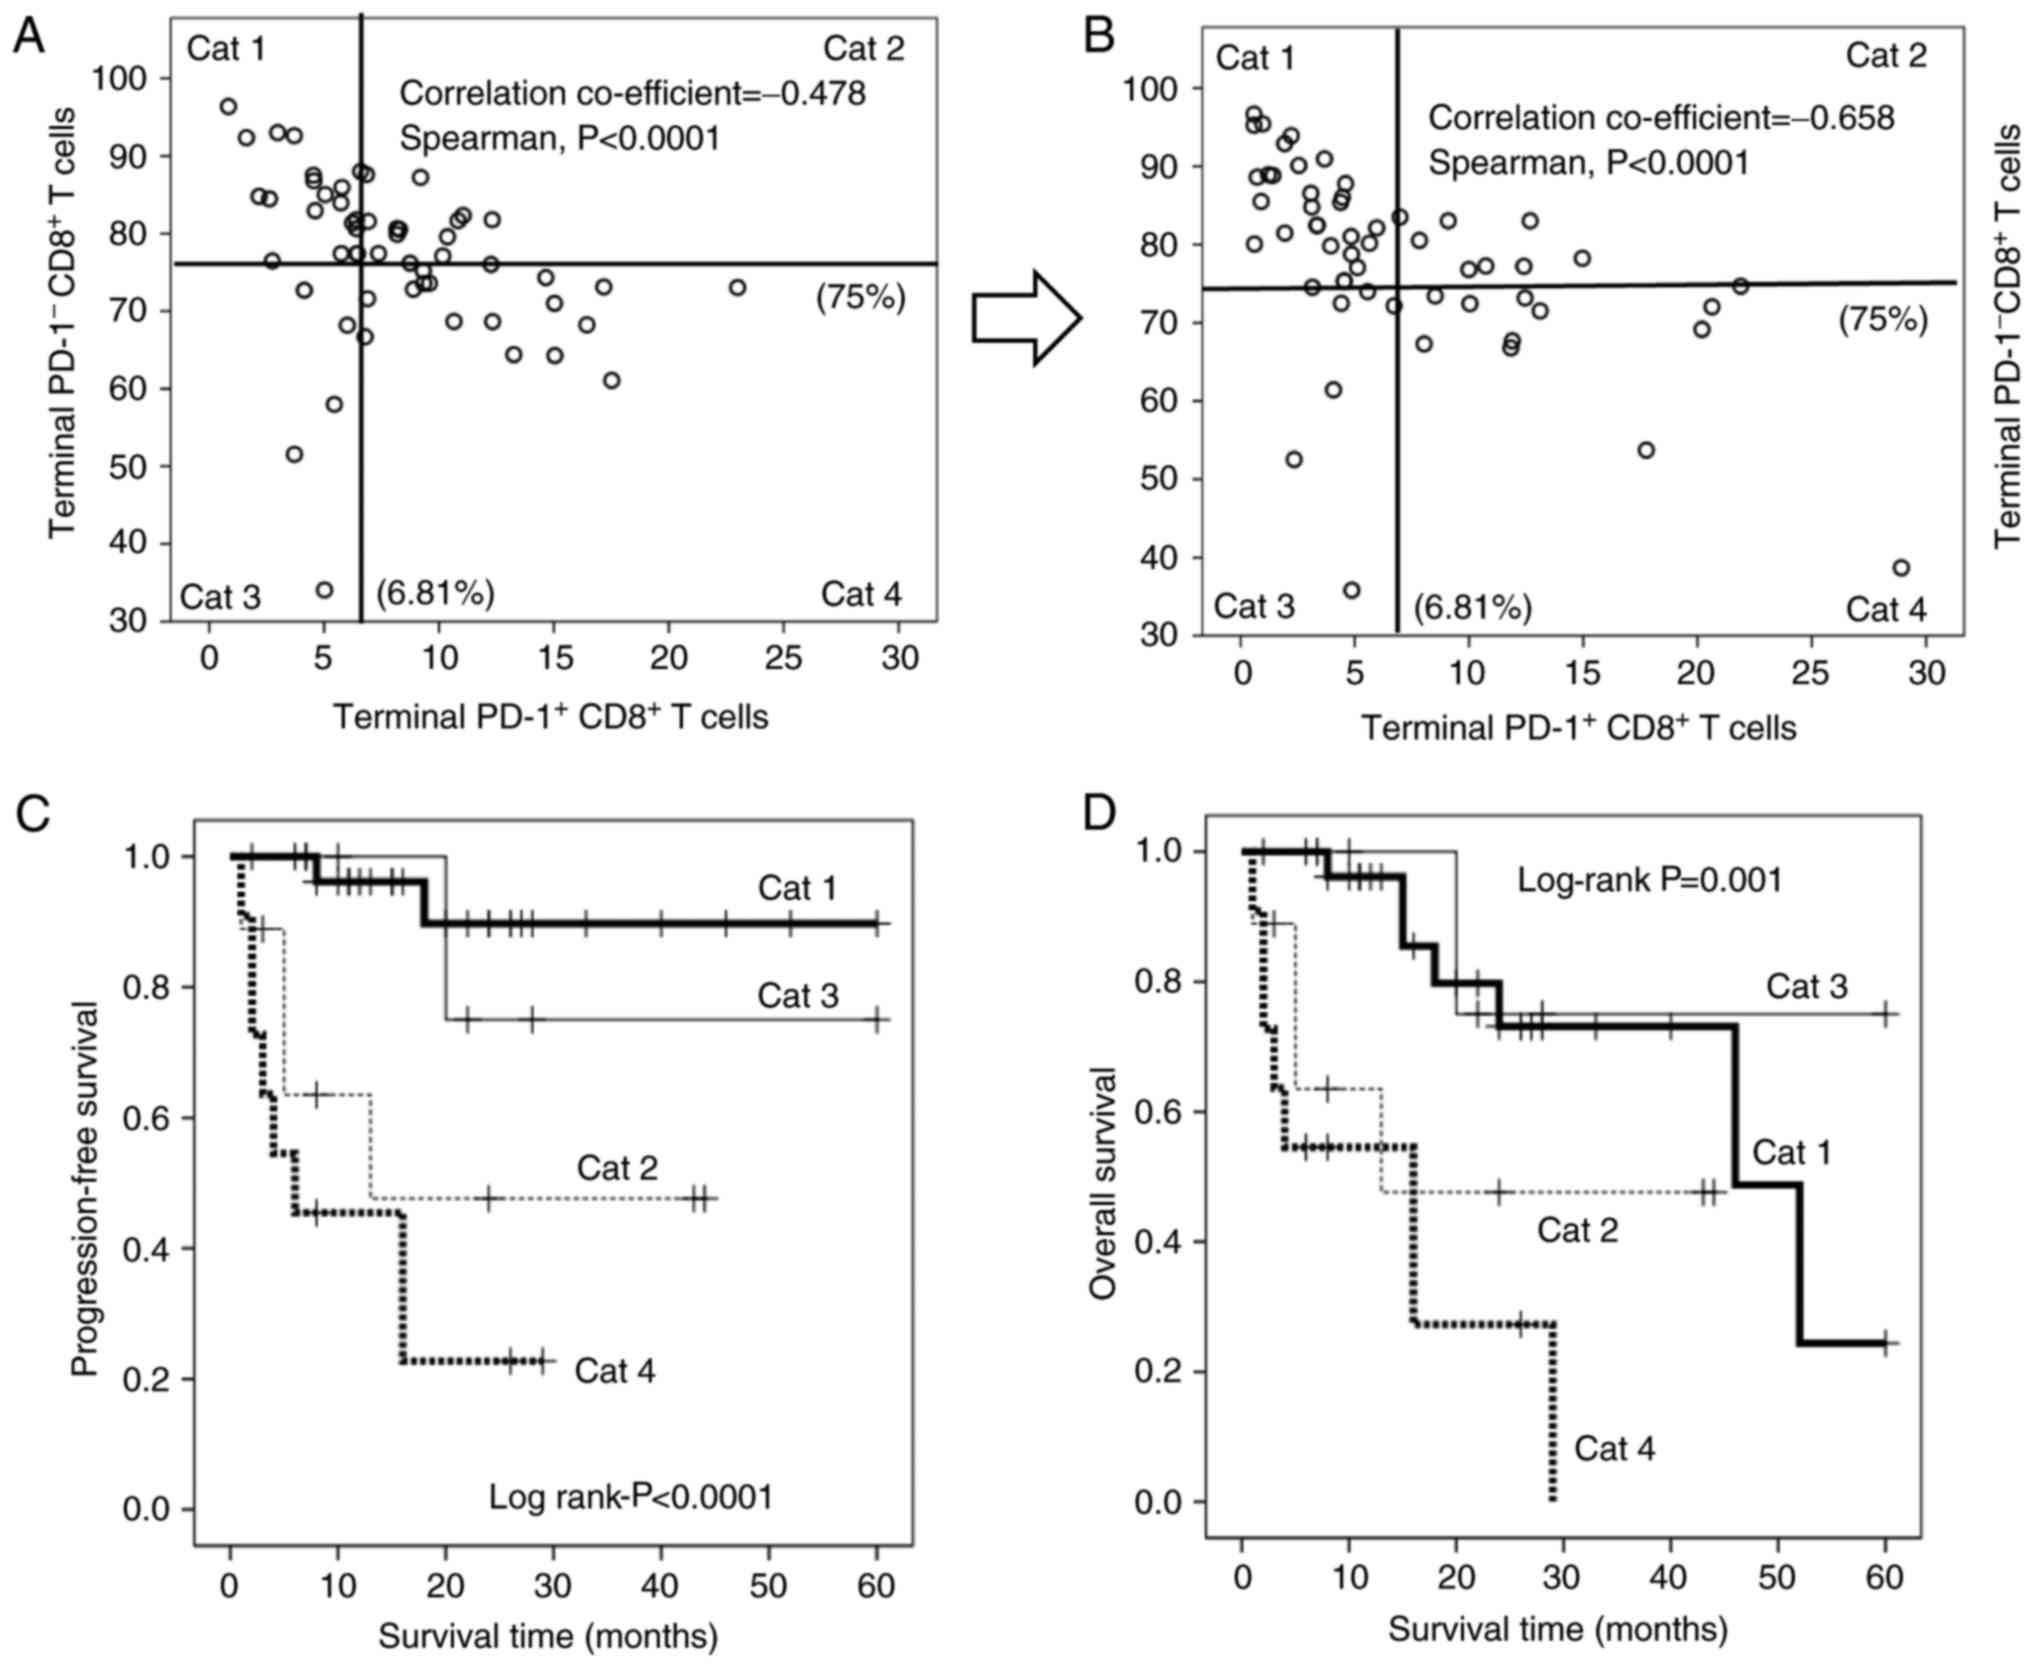
As aforementioned, hydrogen gas reduces the
proportion of terminal PD1+ CD8+ T cells, but
increases the abundance of terminal PD1− CD8+
T cells, and the magnitude of these changes is strongly associated
with the prognosis. Notably, the terminal PD1+
CD8+ T cells were significantly and inversely correlated
with the terminal PD1− CD8+ T cells (Fig. 6A and B), suggesting that the dynamic
balance between these subsets contributes strongly to prognosis in
patients with advanced colorectal carcinomas. Therefore, patients
were stratified based on all possible high/low combinations of
these subsets [category (Cat) 1–4; Cat 1: Patients with low
PD1+ and high PD1− terminal CD8+ T
cells; Cat 2: Patients with high PD1+ and high
PD1− terminal CD8+ T cells; Cat 3: Patients
with low PD1+ and low PD1− terminal
CD8+ T cells; Cat 4: Patients with high PD1+
and high PD1− terminal CD8+ T cells; Fig. 6A and B]. Kaplan-Meier analysis
revealed that Cat 1 patients experienced significantly longer PFS
times than all other groups, whereas Cat 3 patients experienced
significantly longer OS times than the others. By contrast, Cat 4
patients experienced significantly worse PFS (Fig. 6C) and OS (Fig. 6D) times than others. Hydrogen gas
also increased the number of patients with low PD1+
terminal CD8+ T cells (Cat 1 and 3), but decreased the
number of patients with high PD1+ terminal
CD8+ T cells (Cat 2 and 4), leading to an improved
prognosis in patients with stage IV colorectal carcinoma (Fig. 6A and B; Table IV).
| Table IV.Change of category following hydrogen
gas treatment. |
Table IV.
Change of category following hydrogen
gas treatment.
|
| Hydrogen gas
treatment |
|
|---|
|
|
|
|
|---|
| Category
classification | Prior to
treatment | Following
treatment | Rate of
variability |
|---|
| Cat 1 | 14 | 21 ↑ | 7/14=50% ↑ |
| Cat 2 | 13 | 9 ↓ | 4/13=31% ↓ |
| Cat 3 | 14 | 18 ↑ | 4/18=22% ↑ |
| Cat 4 | 14 | 7 ↓ | 7/14=50% ↓ |
Discussion
Persistent stimulation by carcinoma cells renders
cytotoxic CD8+ T cells into an exhausted state without
proliferation, cytokine production or cytotoxic capabilities.
Accumulation of exhausted CD8+ T cells in the peripheral
blood, as well as at the tumor site, has been reported to result in
a poor prognosis in patients with cancer (3–6). In
the present study, terminal PD-1+ CD8+ T
cells were an independent poor prognostic factor in the patients
with stage IV colorectal carcinoma. It was recently reported that
exhausted CD8+ T cells exhibit mitochondrial
dysfunction, caused by the inactivation of PGC-1α, to express
immune checkpoint inhibitors such as PD-1 and Tim-3, but return to
the active effector state following exposure to certain stimulants
(7). Hydrogen was recently reported
to stimulate PGC-1α (28), which
enhances mitochondrial function (29) and thus may rescue exhausted
CD8+ T cells. The present study found that hydrogen gas
reduced the proportion of all four PD-1+ CD8+
T cell subsets and increased the proportions of all four
PD-1− CD8+ subsets. Univariate and
multivariate analyses indicated that loss of terminal
PD-1+ CD8+ T cells is the most significant
contributor to improved prognosis. Furthermore, reduction of
terminal PD-1+ CD8+ T cells and accumulation
of terminal PD-1− CD8+ T cells following
hydrogen gas treatment were significantly associated with improved
PFS (Figs. 3C and 4C) and OS (Figs. 3D and 4D) times. Moreover, treatment with
hydrogen gas significantly extended PFS time in patients with
abundant PD-1− CD8+ T cells compared with
time in others (Fig. 5B) and
slightly improved OS, although this result was not significant
(Fig. 5D). Collectively, these
results suggested that hydrogen gas converts exhausted terminal
PD-1+ CD8+ T cells into active terminal
PD-1− CD8+ T cells, thereby improving
prognosis.
The present study found that circulating terminal
PD-1+ CD8+ T cells in patients with stage IV
colorectal cancer were strongly and independently associated with
short PFS and OS times, in agreement with recent reports that
circulating and tumor-infiltrating PD-1+ CD8+
T cells contribute to poor prognosis in various cancer types,
including breast, pancreatic and gastric cancer (7–10).
These results suggested that prognosis and therapeutic response in
patients with cancer may be easily and non-invasively predicted
based on terminal PD-1+ CD8+ T lymphocytes in
the peripheral blood, consistent with data demonstrating that
circulating CD8+ PD-1+ lymphocytes could
provide a window into determining the characteristics of
tumor-resident antitumor lymphocytes (8). The abundance of terminal
PD-1+ CD8+ T cells was inversely correlated
with that of terminal PD-1− CD8+ T cells
(Fig. 6A and B), and a novel
classification system composed of four quadrants was created
(Fig. 6). The patients belonging to
the first (Cat 1) and third (Cat 3) quadrants, in whom the
proportion of terminal PD-1+ CD8+ T cells was
below the cut-off value, had an improved prognosis (Fig. 6C and D). By contrast, the patients
belonging to the second (Cat 2) and fourth (Cat 4) quadrants, who
had a higher level of terminal PD-1+ CD8+ T
cells than the cut-off value had a poorer prognosis, particularly
the patients of Cat 4, with the worst PFS and OS times (Fig. 6C and D). These results suggested
that the balance between terminal PD-1+ and
PD-1+ CD8+ T cells is critical for cancer
prognosis and that the novel patient classification system based on
terminal PD-1+ and PD-1− CD8+ T
cells is useful to predict therapeutic effects, as well as
prognosis.
In the future, in order to confirm that hydrogen
gas can restore exhausted CD8+ T cells (PD-1+
CD8+ T cells) into active CD8+ T cells
(PD-1− CD8+ T cells) by the activation of the
mitochondria, we will investigate whether the aforementioned
conversion (PD-1+ CD8+ T cells →
PD-1− CD8+ T cells) is associated with
measured values of coenzyme Q10 (CoQ10) and growth
differentiation factor 15 (GDF15), which are supposed to reflect
actual mitochondrial function. Tim-3, a member of the recently
discovered T cell Immunoglobulin and mucin domain family, is
supposed to be expressed on senescent CD8+ T cells, of
which mitochondrial function may be irreversible (33). CoQ10 and GDF15 will also be measured
on senescent CD8+ T cells (Tim-3+
CD8+ T cells). Furthermore, future studies will
investigate whether hydrogen gas actually converts PD-1+
CD8+ T culture cells into PD-1−
CD8+ T culture cells in vitro.
In conclusion, hydrogen gas decreases the number of
terminal PD-1+ CD8+ T cells, i.e., exhausted
CD8+ T cells, possibly by activating mitochondria via
PGC-1α, thereby increasing the number of terminal PD-1−
CD8+ T cells and improving the patient prognosis. Thus,
terminal PD-1+ and PD-1− CD8+ T
cells are critical immune parameters in patients with cancer and
are conveniently measurable in the peripheral blood. A novel system
for patient classification (Cat 1–4) based on these indices was
also developed in the present study in order to assist in
predicting prognosis and therapeutic response.
Acknowledgements
The authors would like to thank Helix Japan, Co.,
Ltd. (Tokyo, Japan) for providing the Hycellvator ET 100 hydrogen
gas generator.
Funding
No funding was received.
Availability of data and materials
The datasets used and/or analyzed during the
current study are available from the corresponding author on
reasonable request.
Authors' contributions
JA was involved in the analysis and interpretation
of the data, and HB was involved in the analysis of the data. All
authors read and approved the final manuscript.
Ethics approval and consent to
participate
All procedures performed in studies involving human
participants were approved and in accordance with the ethical
standards of Kumamoto University (Kumamoto, Japan) and with the
1964 Helsinki Declaration and its later amendments or comparable
ethical standards. Informed consent was obtained from all
individual participants included in the study.
Patient consent for publication
Approval was obtained from all patients for the
publication of the study.
Competing interests
The authors declare that they have no conflicts of
interest.
Glossary
Abbreviations
Abbreviations:
|
FACS
|
fluorescence-activated cell
sorting
|
|
PD-1
|
programmed cell death 1
|
|
PGC-1α
|
peroxisome proliferator-activated
receptor γ coactivator 1α
|
|
PFS
|
progression-free survival
|
|
OS
|
overall survival
|
References
|
1
|
Barber DL, Wherry EJ, Masopust D, Zhu B,
Allison JP, Sharpe AH, Freeman GJ and Ahmed R: Restoring function
in exhausted CD8 T cells during chronic viral infection. Nature.
439:682–687. 2006. View Article : Google Scholar : PubMed/NCBI
|
|
2
|
Wherry EJ: T cell exhaustion. Nat Immunol.
12:492–499. 2011. View Article : Google Scholar : PubMed/NCBI
|
|
3
|
Ahmadzadeh M, Johnson LA, Heemskerk B,
Wunderlich JR, Dudley ME, White DE and Rosenberg SA: Tumor
antigen-specific CD8 T cells infiltrating the tumor express high
levels of PD-1 and are functionally impaired. Blood. 114:1537–1544.
2009. View Article : Google Scholar : PubMed/NCBI
|
|
4
|
Sun S, Fei X, Mao Y, Wang X, Garfield DH,
Huang O, Wang J, Yuan F, Sun L, Yu Q, et al: PD-1+
immune cell infiltration inversely correlates with survival of
operable breast cancer patients. Cancer Immunol Immunother.
63:395–406. 2014. View Article : Google Scholar : PubMed/NCBI
|
|
5
|
Zarour HM: Reversing T-Cell dysfunction
and exhaustion in cancer. Clin Cancer Res. 22:1856–1864. 2016.
View Article : Google Scholar : PubMed/NCBI
|
|
6
|
Lu X, Yang L, Yao D, Wu X, Li J, Liu X,
Deng L, Huang C, Wang Y, Li D, et al: Tumor antigen-specific
CD8+ T cells are negatively regulated by PD-1 and Tim-3
in human gastric cancer. Cell Immunol. 313:43–51. 2017. View Article : Google Scholar : PubMed/NCBI
|
|
7
|
Scharping NE, Menk AV, Moreci RS,
Whetstone RD, Dadey RE, Watkins SC, Ferris RL and Delgoffe GM: The
tumor microenvironment represses T cell mitochondrial biogenesis to
drive intratumoral T cell metabolic insufficiency and dysfunction.
Immunity. 45:374–388. 2016. View Article : Google Scholar : PubMed/NCBI
|
|
8
|
Gros A, Parkhurst MR, Tran E, Pasetto A,
Robbins PF, Ilyas S, Prickett TD, Gartner JJ, Crystal JS, Roberts
IM, et al: Prospective identification of neoantigen-specific
lymphocytes in the peripheral blood of melanoma patients. Nat Med.
22:433–438. 2016. View Article : Google Scholar : PubMed/NCBI
|
|
9
|
Ohsawa I, Ishikawa M, Takahashi K,
Watanabe M, Nishimaki K, Yamagata K, Katsura KI, Katayama Y, Asoh S
and Ohta S: Hydrogen acts as a therapeutic antioxidant by
selectively reducing cytotoxic oxygen radicals. Nat Med.
13:688–694. 2007. View
Article : Google Scholar : PubMed/NCBI
|
|
10
|
Zhou L, Wang X, Xue W, Xie K, Huang Y,
Chen H, Gong G and Zeng Y: Beneficial effects of hydrogen-rich
saline against spinal cord ischemia-reperfusion injury in rabbits.
Brain Res. 1517:150–160. 2013. View Article : Google Scholar : PubMed/NCBI
|
|
11
|
Hayashida K, Sano M, Ohsawa I, Shinmura K,
Tamaki K, Kimura K, Endo J, Katayama T, Kawamura A, Kohsaka S, et
al: Inhalation of hydrogen gas reduces infarct size in the rat
model of myocardial ischemia-reperfusion injury. Biochem Biophys
Res Commun. 373:30–35. 2008. View Article : Google Scholar : PubMed/NCBI
|
|
12
|
Zheng X, Zheng X, Mao Y, Cai J, Li Y, Liu
W, Sun P, Zhang JH, Sun X and Yuan H: Hydrogen-rich saline protects
against intestinal ischemia/reperfusion injury in rats. Free Radic
Res. 43:478–484. 2009. View Article : Google Scholar : PubMed/NCBI
|
|
13
|
Lee JW, Kim JI, Lee YA, Lee DH, Song CS,
Cho YJ and Han JS: Inhaled hydrogen gas therapy for prevention of
testicular ischemia/reperfusion injury in rats. J Pediatr Surg.
4:736–742. 2012. View Article : Google Scholar
|
|
14
|
Wang F, Yu G, Liu SY, Li JB, Wang JF, Bo
LL, Qian LR, Sun XJ and Deng XM: Hydrogen-rich saline protects
against renal ischemia/reperfusion injury in rats. J Surg Res.
167:e339–e344. 2011. View Article : Google Scholar : PubMed/NCBI
|
|
15
|
Ji X, Tian Y, Xie K, Liu W, Qu Y and Fei
Z: Protective effects of hydrogen-rich saline in a rat model of
traumatic brain injury via reducing oxidative stress. J Surg Res.
178:e9–e16. 2012. View Article : Google Scholar : PubMed/NCBI
|
|
16
|
Chen T, Tao Y, Yan W, Yang G, Chen X, Cao
R, Zhang L, Xue J and Zhang Z: Protective effects of hydrogen-rich
saline against N-methyl-N-nitrosourea-induced photoreceptor
degeneration. Exp Eye Res. 148:65–73. 2016. View Article : Google Scholar : PubMed/NCBI
|
|
17
|
Ren JD, Ma J, Hou J, Xiao WJ, Jin WH, Wu J
and Fan KH: Hydrogen-rich saline inhibits NLRP3 inflammasome
activation and attenuates experimental acute pancreatitis in mice.
Mediators Inflamma. 2014:9308942014. View Article : Google Scholar
|
|
18
|
Nakao A, Toyoda Y, Sharma P, Evans M and
Guthrie N: Effectiveness of hydrogen rich water on antioxidant
status of subjects with potential metabolic syndrome-an open label
pilot study. J Clin Biochem Nutr. 46:140–149. 2010. View Article : Google Scholar : PubMed/NCBI
|
|
19
|
Amitani H, Asakawa A, Cheng K, Amitani M,
Kaimoto K, Nakano M, Ushikai M, Li Y, Tsai M, Li JB, et al:
Hydrogen improves glycemic control in type1 diabetic animal model
by promoting glucose uptake into skeletal muscle. PLoS One.
8:e539132013. View Article : Google Scholar : PubMed/NCBI
|
|
20
|
Li GM, Ji MH, Sun XJ, Zeng QT, Tian M, Fan
YX, Li WY, Li N and Yang JJ: Effects of hydrogen-rich saline
treatment on polymicrobial sepsis. J Surg Res. 181:279–286. 2013.
View Article : Google Scholar : PubMed/NCBI
|
|
21
|
Guo SX, Jin YY, Fang Q, You CG, Wang XG,
Hu XL and Han CM: Beneficial effects of hydrogen-rich saline on
early burn-wound progression in rats. PLoS One. 10:e01248972015.
View Article : Google Scholar : PubMed/NCBI
|
|
22
|
Kikkawa YS, Nakagawa T, Taniguchi M and
Ito J: Hydrogen protects auditory hair cells from cisplatin-induced
free radicals. Neurosci Lett. 579:125–129. 2014. View Article : Google Scholar : PubMed/NCBI
|
|
23
|
Watanabe S, Fujita M, Ishihara M,
Tachibana S, Yamamoto Y, Kaji T, Kawauchi T and Kanatani Y:
Protective effect of inhalation of hydrogen gas on
radiation-induced dermatitis and skin injury in rats. J Radiat Res.
55:1107–1113. 2014. View Article : Google Scholar : PubMed/NCBI
|
|
24
|
Ushida T, Kotani T, Tsuda H, Imai K,
Nakano T, Hirako S, Ito Y, Li H, Mano Y, Wang J, et al: Molecular
hydrogen ameliorates several characteristics of preeclampsia in the
Reduced Uterine Perfusion Pressure (RUPP) rat model. Free Radic
Biol Med. 101:524–533. 2016. View Article : Google Scholar : PubMed/NCBI
|
|
25
|
Ge L, Yang M, Yang NN, Yin XX and Song WG:
Molecular hydrogen: A preventive and therapeutic medical gas for
various diseases. Oncotarget. 8:102653–102673. 2017. View Article : Google Scholar : PubMed/NCBI
|
|
26
|
Runtuwene J, Amitani H, Amitani M, Asakawa
A, Cheng KC and Inui A: Hydrogen-water enhances
5-fluorouracil-induced inhibition of colon cancer. PeerJ.
3:e8592015. View Article : Google Scholar : PubMed/NCBI
|
|
27
|
Wang D, Wang L, Zhang Y, Zhao Y and Chen
G: Hydrogen gas inhibits lung cancer progression through targeting
SMC3. Biomed Pharmacother. 104:788–797. 2018. View Article : Google Scholar : PubMed/NCBI
|
|
28
|
Kamimura N, Ichimiya H, Iuchi K and Ohta
S: Molecular hydrogen stimulates the gene expression of
transcriptional coactivator PGC-1α to enhance fatty acid
metabolism. NPJ Aging Mech Dis. 2:160082016. View Article : Google Scholar : PubMed/NCBI
|
|
29
|
Handschin C and Spiegelman BM: Peroxisome
proliferator-activated receptor gamma coactivator 1 coactivators,
energy homeostasis, and metabolism. Endocr Rev. 27:728–735. 2006.
View Article : Google Scholar : PubMed/NCBI
|
|
30
|
Sobin LH and Wittekind CH: UICC TNM
Classification of malignant tumors. John Wiley and Sons; New York:
1997,
|
|
31
|
Tamura T, Hayashida K, Sano M, Suzuki M,
Shibusawa T, Yoshizawa J, Kobayashi Y, Suzuki T, Ohta S, Morisaki
H, et al: Feasibility and safety of hydrogen gas inhalation for
post-cardiac arrest syndrome-First-in-Human Pilot Study. Circ J.
80:1870–1873. 2016. View Article : Google Scholar : PubMed/NCBI
|
|
32
|
Cancer therapy evaluation program, common
terminology criteria for adverse events, Version 3.0, DCTD, NCI,
NIH, DHHS. Int J Clin Oncol 9. (Sup PIII). S1–S82. 2004.
|
|
33
|
Crespo J, Sun H, Welling TH, Tian Z and
Zou W: T cell anergy, exhaustion, senescence, and stemness in the
tumor microenvironment. Curr Opin Immunol. 25:214–221. 2013.
View Article : Google Scholar : PubMed/NCBI
|