Introduction
Liver cancer is the fifth most commonly occurring
cancer in men and the ninth most commonly occurring cancer in
women, worldwide, ranking third in cancer-related mortality
(1). Standard management of liver
cancer includes surgery, chemotherapy and radiation therapy, which
are dependent upon tumor stage, liver function and patient
performance (2). Sorafenib is an oral
inhibitor of multiple kinases, and is the standard treatment for
patients with liver cancer (3).
Sorafenib inhibits expression of several tyrosine kinases that are
critical for angiogenesis and tumor progression, including vascular
endothelial growth factor receptor (VEGFR)-2/3, platelet-derived
growth factor receptor (PDGF-R) and Raf kinases involved in the
MAPK/ERK pathway (4). Human breast
carcinoma metastasis-suppressor 1 (BRMS1) gene was first
discovered over a decade ago, and was found to reduce the
metastatic capacity of MDA-MB-435 human breast carcinoma cells by
70–90% without affecting tumorigenicity (5). Another study found that the metastatic
potential of MDA-MB-435 cells stably transfected with BRMS1 to the
lungs and regional lymph nodes was significantly reduced (50–90%
inhibition) (6). In addition,
hypermethylation is consistently found in the promoter region of
BRMS1 in malignant tumor cells, indicating that decreased BRMS1
expression may be a clinical biomarker of malignant tumors.
Multiple patient tissues with lymph node metastases were found to
have hypermethylated CpG island of the BRMS1 gene (7). A previous study found hypermethylation
in 60% of lymph node metastases and in 45% of primary tumors,
suggesting that methylation is related to tumor development and
progression (8). A recent study
identified hypermethylation of the BRMS1 promoter region in tumor
cells isolated from peripheral blood of breast cancer patients when
compared to healthy controls (9).
Another study found that loss of BRMS1 was associated with reduced
disease-free survival when patient samples were stratified by loss
of the estrogen receptor (ER) or the progesterone receptor (PR) or
by expression of HER2 (10).
In the present study, BRMS1 overexpression and
knockdown models were initially established in HepG2 cells. It was
demonstrated that overexpression of BRMS1 significantly increased
the inhibitory effect of sorafenib on cell proliferation when
compared to that noted in the controls, while knockdown of BRMS1
attenuated this effect. Sorafenib was also found to induce the
apoptosis of HepG2 cells. In addition, expression of inflammatory
response-related genes was increased, while secretion of
angiogenesis-related molecules was decreased, in response to
sorafenib treatment. We further demonstrated that these effects on
tumor cells might be mediated by inhibition of the
PI3K/AKT/mTOR/ERK signaling pathway. Overexpression of BRMS1
potentiated the treatment effect of sorafenib and knockdown of
BRMS1 attenuated these effects. Therefore, overexpression of BRMS1
synergistically enhanced the therapeutic effect of sorafenib on
liver cancer and may represent a novel therapeutic strategy.
Materials and methods
Materials
Fetal bovine serum (FBS) (MF191-01) and high glucose
Dulbecco's modified Eagle's medium (H-DMEM) (MF219-01) were
purchased from Mei5 Biotechnology Co., Ltd. (Beijing, China). MTT
Cell Proliferation and Cytotoxicity Assay kit (M1020), Lip2000
transfection reagent (L7800) and G418 (G8160) were purchased from
Solarbio (Beijing, China). HindIII (R0104L), EcoRI
(R0101L), Quick Ligase (M2200S) and T4 PNK (M0201S) were purchased
from New England Biolabs, Inc. (NEB; Ipswich, MA, USA). FastDigest
BsmBI (FD0454) was purchased from Fermentas (Thermo Fisher
Scientific, Inc.). Protease inhibitor cocktail (CW2200),
phosphatase inhibitor cocktail (CW2383), Ultrapure RNA kit (CW0597)
and Super TaqMan OneStep RT-qPCR kit (CW2695) were purchased from
CWbio Biological Technology Company (Beijing, China). TRITC
phalloidin (40734ES75), DAPI stain solution (40728ES03) and PI
staining solution (40755ES64) were purchased from Yeasen
Biotechnology Co. (Shanghai, China). Anti-BRMS1 (ab180852), p-AKT
(ab38449), AKT (ab179463), p-mTOR (ab137133), mTOR (ab134903),
p-ERK (ab50011), ERK (ab17942), p-BIM (ab17935), BIM (ab32158),
p-PTEN (ab109454), PTEN (ab32199), Bax (ab32503), Bcl-2 (ab196495),
TNF-α (ab109322), caspase-9 (ab52298), caspase-3 (ab13847)
antibodies and human IGF1 (ab211651), TGF-β (ab100647) and VEGF
(ab100662) ELISA kits were purchased from Abcam (Cambridge, UK).
Sorafenib (BAY 43-9006) was purchased from Enzo Life Science
(Farmingdale, NY, USA). HepG2 cells (TCHu 72) and 293T cells
(SCSP-502) were purchased from the Cell Library of the Typical
Culture Preservation Committee of the Chinese Academy of
Sciences.
Vector construction
The cDNA of BRMS1 was cloned from cells using PCR
methods using the following primers: Forward,
5′-ATCGAAGCTTACTATGCCTGTCCAGCCTCCAAGC-3′ and reverse,
5′-ATGCGAATTCTCAAGGTCCATCCGATTC-3′. Blank pCNDA3.1 vector and PCR
product of BRMS1 were digested with HindIII and
EcoRI, and the BRMS1 fragment was cloned into the vector to
construct the pCDNA3.1-BRMS1 overexpression vector. HepG2 cells
were transfected with pCDNA3.1-BRMS1 and pcDNA3.1 blank vector
using Lip2000 transfection reagent for 48 h according to the
manufacturer's protocol. Stable BRMS1 overexpression cells and
blank vector cells were screened using 800 µg/ml G418. The BRSM1
knockdown vector was constructed according to a previous study
(11). Briefly, the CRISPR vector was
firstly digested with BsmBI according to the protocol, and
annealed oligos were constructed using the following primers:
Forward, 5′-CACCGCTACACAGTGCAATTGCCTCC-3′ and reverse,
5′-AAACGATGTGTCACGTTAACGGAGC-3′. Ligation reactions were
subsequently performed using annealed oligos and digested CRISPR
vector according to the Quick Ligase protocol to construct the
BRSM1 knockdown vector. Stable BRMS1 knockdown cells were screened
using 2 µg/ml puromycin.
Cell culture and experimental
groups
Cells were cultured in a humidified atmosphere
supplied with 5% CO2 at 37°C with H-DMEM and 10% FBS.
Cells were divided into four groups: Controls (NC), sorafenib
treatment (ST), sorafenib treatment with BRMS1 overexpression (BO)
and sorafenib treatment with BRMS1 knockdown (BD). The
concentration and treatment period for sorafenib used in this
experiment (10 µM for 24 h) was determined according to a previous
study (12).
Cellular proliferation assay
MTT assay was performed according to the protocol of
MTT Cell Proliferation and Cytotoxicity Assay kit. Briefly, cells
were firstly cultured and grouped as previously described, seeded
into a 96-well plate at a concentration of 1×10⁴
cells/well, and cultured until cell confluence reached 80–85%.
Then, the cells were incubated with 5 mg/ml MTT reagent for 4 h
after washing with phosphate-buffered saline (PBS), and optical
density (OD) values were determined at 560 nm using the SuPerMax
3100 microplate reader (Shanghai, China) after formazan was added.
Cell viability was calculated as
(ODExperiment-ODBlank/ODControl-ODBlank)
× 100%.
RNA extraction and reverse
transcription
RNA extraction was performed according to t
Ultrapure RNA Kit protocol. Briefly, cells were lysed in lysis
buffer for 5 min at room temperature, followed by vigorous shaking
for 15 sec after mixing with chloroform. The mixture was then
centrifuged at 13,523 × g for 5 min after thorough mixing with 70%
ethanol and loaded onto an adsorption column. RNA was adsorbed onto
the column after samples were centrifuged at 13,523 × g for 1 min.
RNA was eluted from adsorption columns using elution buffer after
washing with designated wash buffer.
Reverse transcription and real-time
quantitative polymerase chain reaction (qPCR)
Reverse transcription and qPCR were performed
according to the Super TaqMan OneStep RT-qPCR Kit protocol. Primers
used were as follows: IL-1β: Forward, 5′-ATAAGCCCACTCTACAGCT-3′ and
reverse, 5′-ATTGGCCCTGAAAGGAGAGA-3′; IL-2: Forward,
5′-GTCCAAGGACACAGGCTTCTT-3′ and reverse,
5′-AAATTTTGGCTGGTGCCAAGG-3′; IL-6: Forward,
5′-GGCTACGAGTGGGATACTG-3′ and reverse, 5′-GGCTGGAAGGAGAAGATG-3′;
Bcl-2: Forward, 5′-TGGCCTTCTTTGAGTTCGGT-3′ and reverse,
5′-GTTCCACAAAGGCATCCCAGC-3′; Bax: Forward,
5′-ACACCTGAGCTGACCTTGGA-3′ and reverse, 5′-AGTTCATCGCCAATTCGCCT-3′;
TNF-α: Forward, 5′-CAGAGGGAAGAGTTCCCCAG-3′ and reverse,
5′-CCTTGGTCTGGTAGGAGACG-3′. Reaction mixtures were prepared as
recommended by the protocol, and the PCR cycle was set as follows:
Reverse transcription at 45°C for 20 min, predegeneration at 95°C
for 5 min, and degeneration at 95°C for 15 sec with extension at
60°C for 45 sec repeated for 45 cycles. Relative gene expression
was determined using the 2−ΔΔCq method (13). GAPDH was used as an internal
reference, and the quantified results for each target gene were
normalized to GAPDH. Each experiment was repeated three times.
Western blot analysis
Cells in each group were first cultured and grouped
as described above, and then lysed with lysis buffer [50 mM Tris
(pH, 8.1), 1% SDS and protease inhibitor cocktail, phosphatase
inhibitor cocktail] for 30 min on ice after washing with sterile
PBS. The supernatant was collected after centrifugation at 13,523 ×
g for 10 min, and the protein concentration was determined using a
BCA assay. Protein samples (60 µg) from each group were separated
using 10% SDS-PAGE electrophoresis, and transferred onto 0.22-µm
nitrocellulose membranes using the Trans-Blot Turbo system
(Bio-Rad). Membranes were incubated with 5% skim milk, and then
incubated with primary antibodies (dilution 1:1,000) at 4°C
overnight followed by incubation with secondary antibodies
(dilution 1:5,000) at room temperature for 1 h. Chemiluminiscence
was performed using ECL reagents to detect expression levels of the
target proteins. The gray values of bands were quantified using
Scion Image software (version 4.0.3.2; Scion Corp., Frederick, MD,
USA) and normalized to GAPDH. Each experiment was independently
repeated three times.
Immunofluorescence experiments
Cells were cultured and grouped as described above.
Phalloidin staining was performed according to the protocol, and
cells were seeded onto a confocal plate at a concentration of
1×10⁵ and cultured for 24 h. Cells were fixed with 4%
formaldehyde at room temperature for 10 min, and then permeabilized
with 0.5% Triton X-100 for 5 min at room temperature. Cells were
stained with phalloidin staining buffer for 30 min and re-stained
with DAPI for 5 min. DAPI/PI double staining was performed
according to the protocol. Cells were digested with trypsin-EDTA
buffer and then stained with DAPI and PI for 10 min followed by
imaging using fluorescence microscopy. Images were analyzed using
Image-Pro Plus software (version 6.0; Media Cybernetics, Inc.,
Bethesda, MD, USA).
Flow cytometry
Cells were seeded onto a 100-mm plate at a
concentration of 1×10⁶ cells, after being grouped and
treated as described above. After treatment, cells were digested
with trypsinization and washed with pre-cooled PBS. Then, the cells
were incubated with propidium iodide (PI) for 15 min and apoptotic
cells were quantified by FACScan flow cytometry (Becton Dickinson,
Heidelberg, Germany).
Enzyme linked immunosorbent assay
(ELISA)
ELISA was performed according to the protocol for
each ELISA kit. Briefly, standards and supernatants of cultured
medium in each group were added into each well of a 96-well plate,
and incubated overnight at 4°C with gentle shaking. Biotinylated
detection antibodies were added into each well after sufficient
washing with wash buffer and incubation for 1 h at room
temperature. Then, each sample was incubated with HRP-streptavidin
solution for 45 min at room temperature followed by incubation with
TMB One-Step substrate reagent for 30 min at room temperature, OD
values were measured at 450 nm using a SuPerMax 3100 microplate
reader (Shanghai, China).
Statistical analysis
Data are shown as the mean ± SD, and each experiment
was independently repeated three times. One-way analysis of
variance (ANOVA) was performed to compare differences between
groups followed by Tukey's post hoc test. P<0.05 was indicative
of a statistically significant difference. GraphPad version 7
(GraphPad Software, Inc., La Jolla, CA, USA) was used to analyze
the data.
Results
Effect of BRMS1 overexpression on the
proliferation of HepG2 cells
Cells were divided into four groups: Controls (NC),
sorafenib treatment (ST), sorafenib treatment with BRMS1
overexpression (BO) and sorafenib treatment with BRMS1 knockdown
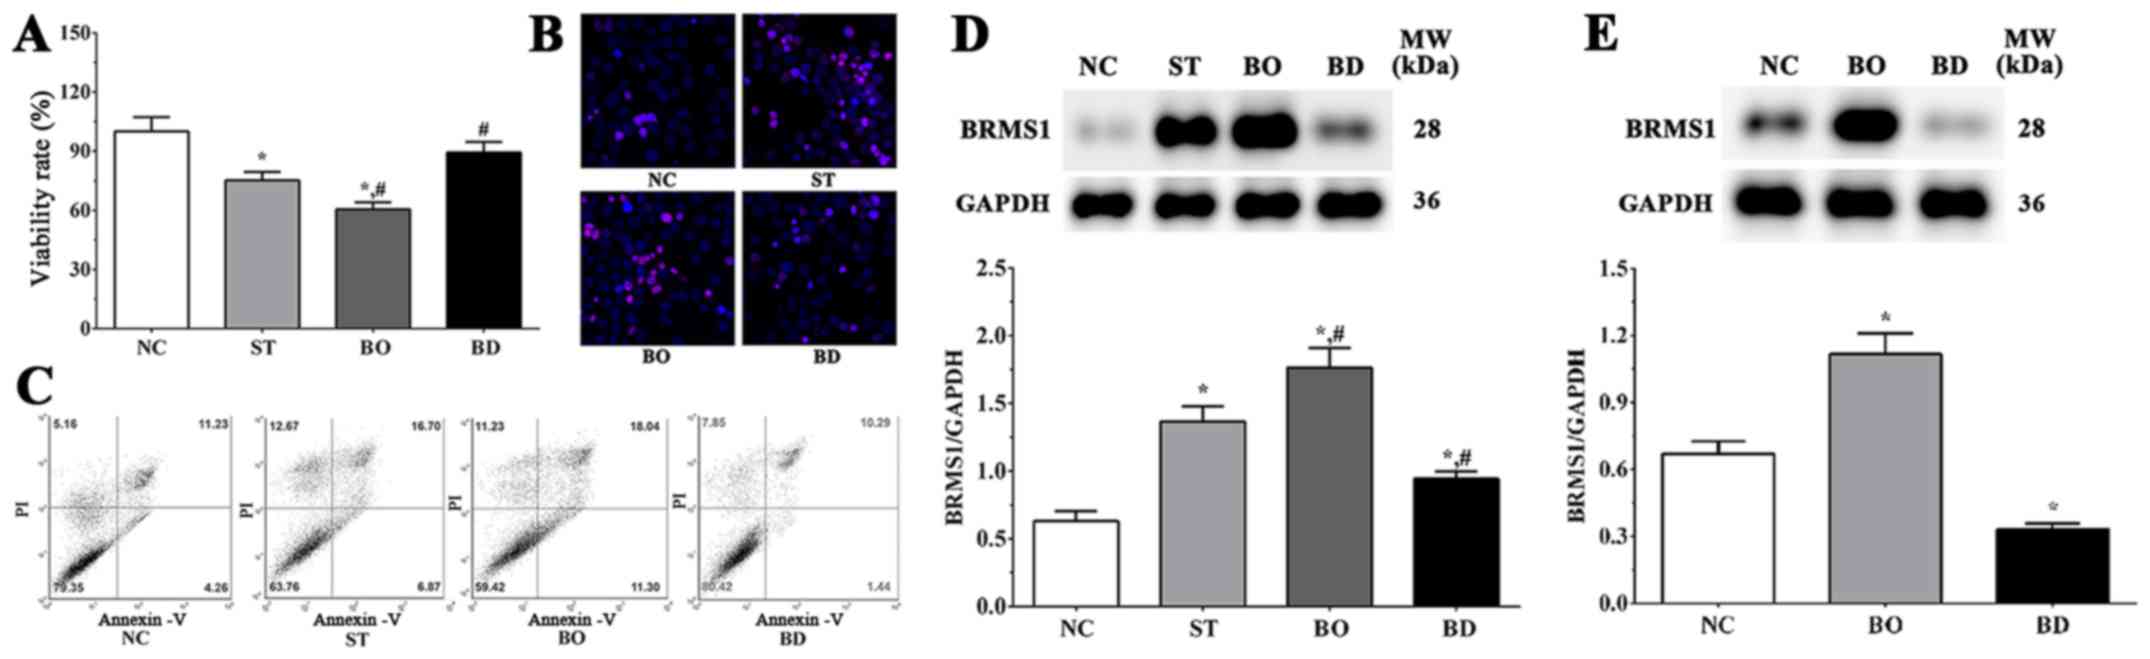
(BD). As shown in Fig. 1A, the
viability of HepG2 cells in the ST, BO and BD groups were 75.3±4.2,
60.5±3.6 and 89.3±5.4%, respectively, in response to 10 µM
sorafenib treatment for 24 h. Compared with the NC group, cell
viability was significantly decreased in the ST and BO groups
(P<0.05), while remaining unchanged in the BD group. Compared to
the ST group, cell viability was significantly decreased in the BO
group (P<0.05) and significantly increased in the BD group
(P<0.05).
Immunofluorescence results are shown in Fig. 1B, illustrating that PI-stained cells
in the ST and BO groups were increased compared to the NC and BD
groups. However, there were no significant changes noted between
the NC and BD groups. As shown in Fig.
1C, the ratios of apoptotic cells were 21.24±2.12, 37.14±3.08,
42.57±4.52 and 18.32±2.20 in the NC, ST, BO and BD groups,
respectively. The proportion of apoptotic cells was significantly
increased in the ST and BO groups (P<0.05) compared with the NC
group, and was significantly decreased in the BO group compared
with the ST group (P<0.05). These results indicate that
sorafenib inhibits the proliferation of HepG2 cells by inducing
apoptosis in cancer cells, and overexpression of BRMS1 may
synergize with sorafenib in enhancing the effects. As shown in
Fig. 1D, the expression level of
BRMS1 in each group was 0.63±0.08, 1.41±0.11, 1.81±0.13 and
0.86±0.09. Compared with the NC group, the expression of BRMS1 was
significantly increased in the ST and BO group (P<0.05) and
significantly decreased in the BD group (P<0.05). Expression of
BRMS1 was significantly increased in the BO group (P<0.05) and
significantly decreased in the BD group (P<0.05) when compared
with the ST group. As shown in Fig.
1E, the expression levels of BRSM1 without sorafenib treatment
in the normal, BRMS1 overexpression and BRMS1 knockdown groups were
0.68±0.05, 1.12±0.13 and 0.32±0.02. Compared with the NC group, the
expression of BRMS1 was significantly increased in the
overexpression group (P<0.05) and significantly decreased in the
knockdown group (P<0.05), indicating that the cell model was
successfully constructed.
Effect of sorafenib on expression of
apoptosis-related genes
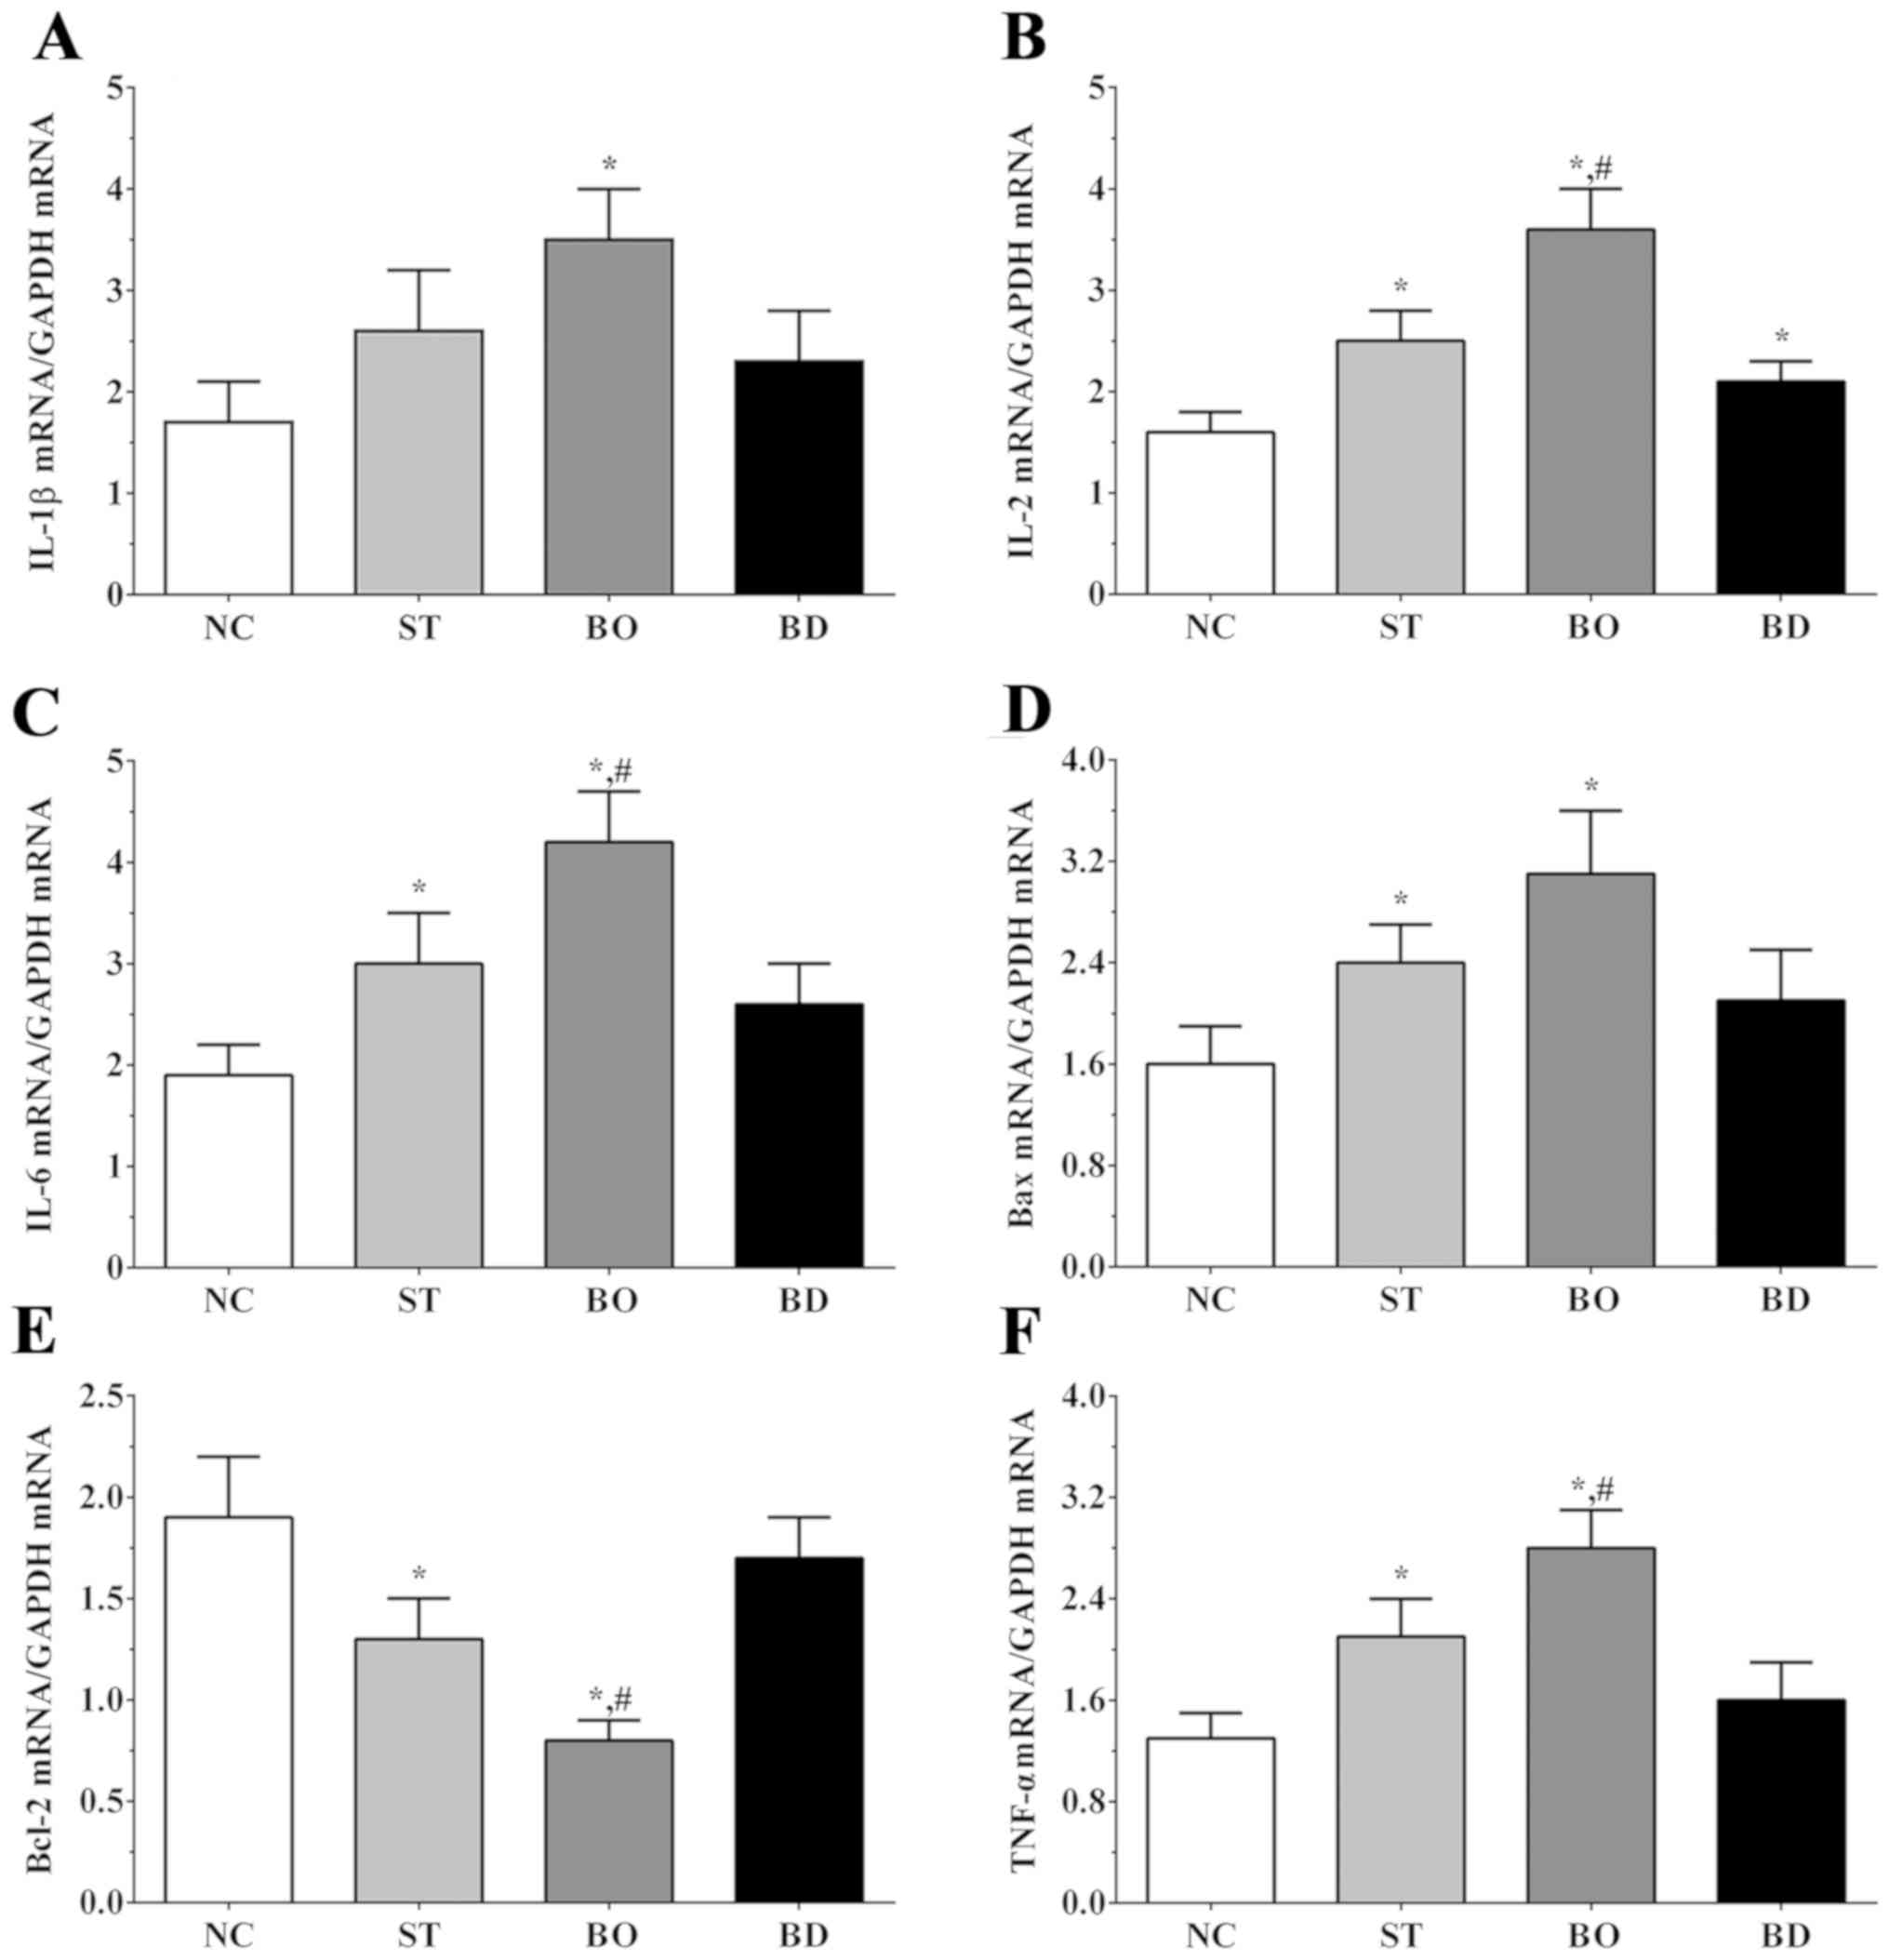
As shown in Fig. 2A,
expression levels of IL-1β in the NC, ST, BO and BD groups were
1.7±0.4, 2.6±0.6, 3.5±0.5 and 2.3±0.5, respectively. Expression of
IL-1β was significantly increased in the BO groups when compared to
that noted in the NC group (P<0.05). The expression levels of
IL-2 in these groups were 1.6±0.2, 2.5±0.3, 3.6±0.4 and 2.1±0.2,
respectively. As shown in Fig. 2B,
IL-2 expression was significantly increased in all
sorafenib-treated groups compared to the NC group (P<0.05), and
was significantly increased in the BO group compared to the ST
group (P<0.05). As shown in Fig.
2C, expression levels of IL-6 in these groups were 1.8±0.4,
3.0±0.5, 3.7±0.5 and 2.6±0.4. Expression of IL-6 was significantly
increased in ST and BO groups compared to the NC group (P<0.05),
and significantly increased in the BO group compared to the ST
group (P<0.05). As shown in Fig.
2D, Bax expression in these groups was 1.6±0.3, 2.4±0.3,
3.1±0.5 and 2.1±0.4, respectively. The Bax expression was
significantly increased in the ST and BO groups compared to the NC
group (P<0.05). As shown in Fig.
2E, Bcl-2 expression in these groups was 1.9±0.3, 1.4±0.2,
0.8±0.1 and 1.7±0.2, respectively. Expression of Bcl-2 was
significantly decreased in the ST and BO groups compared to the NC
group (P<0.05), and was significantly decreased in the BO group
compared to the ST group (P<0.05). As shown in Fig. 2F, expression levels of TNF-α in these
groups were 1.3±0.2, 2.1±0.3, 2.8±0.5 and 1.6±0.3, respectively.
TNF-α expression was significantly increased in the ST and BO
groups compared to the NC group (P<0.05), and significantly
increased in the BO group compared to the ST group (P<0.05).
Effect of sorafenib on expression
levels of molecules of the PI3K/AKT/mTOR/ERK signaling pathway
As shown in Fig. 3A and
B, the ratio of p-AKT/AKT was 1.41±0.07, 0.85±0.04, 0.65±0.03
and 1.33±0.07 in the NC, ST, BO and BD groups, respectively.
Compared to the NC group, the ratio of p-AKT/AKT was significantly
decreased in the ST and BO groups (P<0.05). Furthermore, and
compared to the ST group, the ratio of p-AKT/AKT was significantly
decreased in the BO group (P<0.05) and significantly increased
in the BD group (P<0.05). As shown in Fig. 3A and C, the ratio of p-mTOR/mTOR was
0.80±0.04, 0.65±0.03, 0.52±0.03 and 0.65±0.03 in these groups,
respectively. Compared to the NC group, the ratio of p-mTOR/mTOR
was significantly decreased in all experimental groups (P<0.05),
and compared with the ST group, the ratio of p-mTOR/mTOR was
significantly decreased in the BO group (P<0.05). As shown in
Fig. 3A and D, the ratio of p-ERK/ERK
was 0.75±0.04, 0.80±0.03, 0.43±0.02 and 0.50±0.03 in these groups,
respectively. Compared to the NC and ST group, the ratio of
p-ERK/ERK was significantly decreased in the BO and BD groups
(P<0.05). As shown in Fig. 3A and
E, the ratios of p-BIM/BIM was 0.37±0.02, 0.80±0.04, 0.91±0.05
and 0.24±0.01 in these groups, respectively. Compared to the NC
group, the ratio of p-BIM/BIM was significantly increased in the ST
and BO groups (P<0.05) and significantly decreased in BD group
(P<0.05). Compared to the ST group, the ratio was significantly
increased in the BO group (P<0.05) and significantly decreased
in the BD group (P<0.05). As shown in Fig. 3A and F, the ratio of p-PTEN/PTEN was
0.24±0.01, 0.59±0.03, 0.87±0.04 and 0.62±0.03 in these groups,
respectively. Compared to the NC group, the ratio of p-PTEN/PTEN
was significantly increased in all experimental groups (P<0.05),
and compared to the ST group, the ratio was significantly increased
in the BO group (P<0.05).
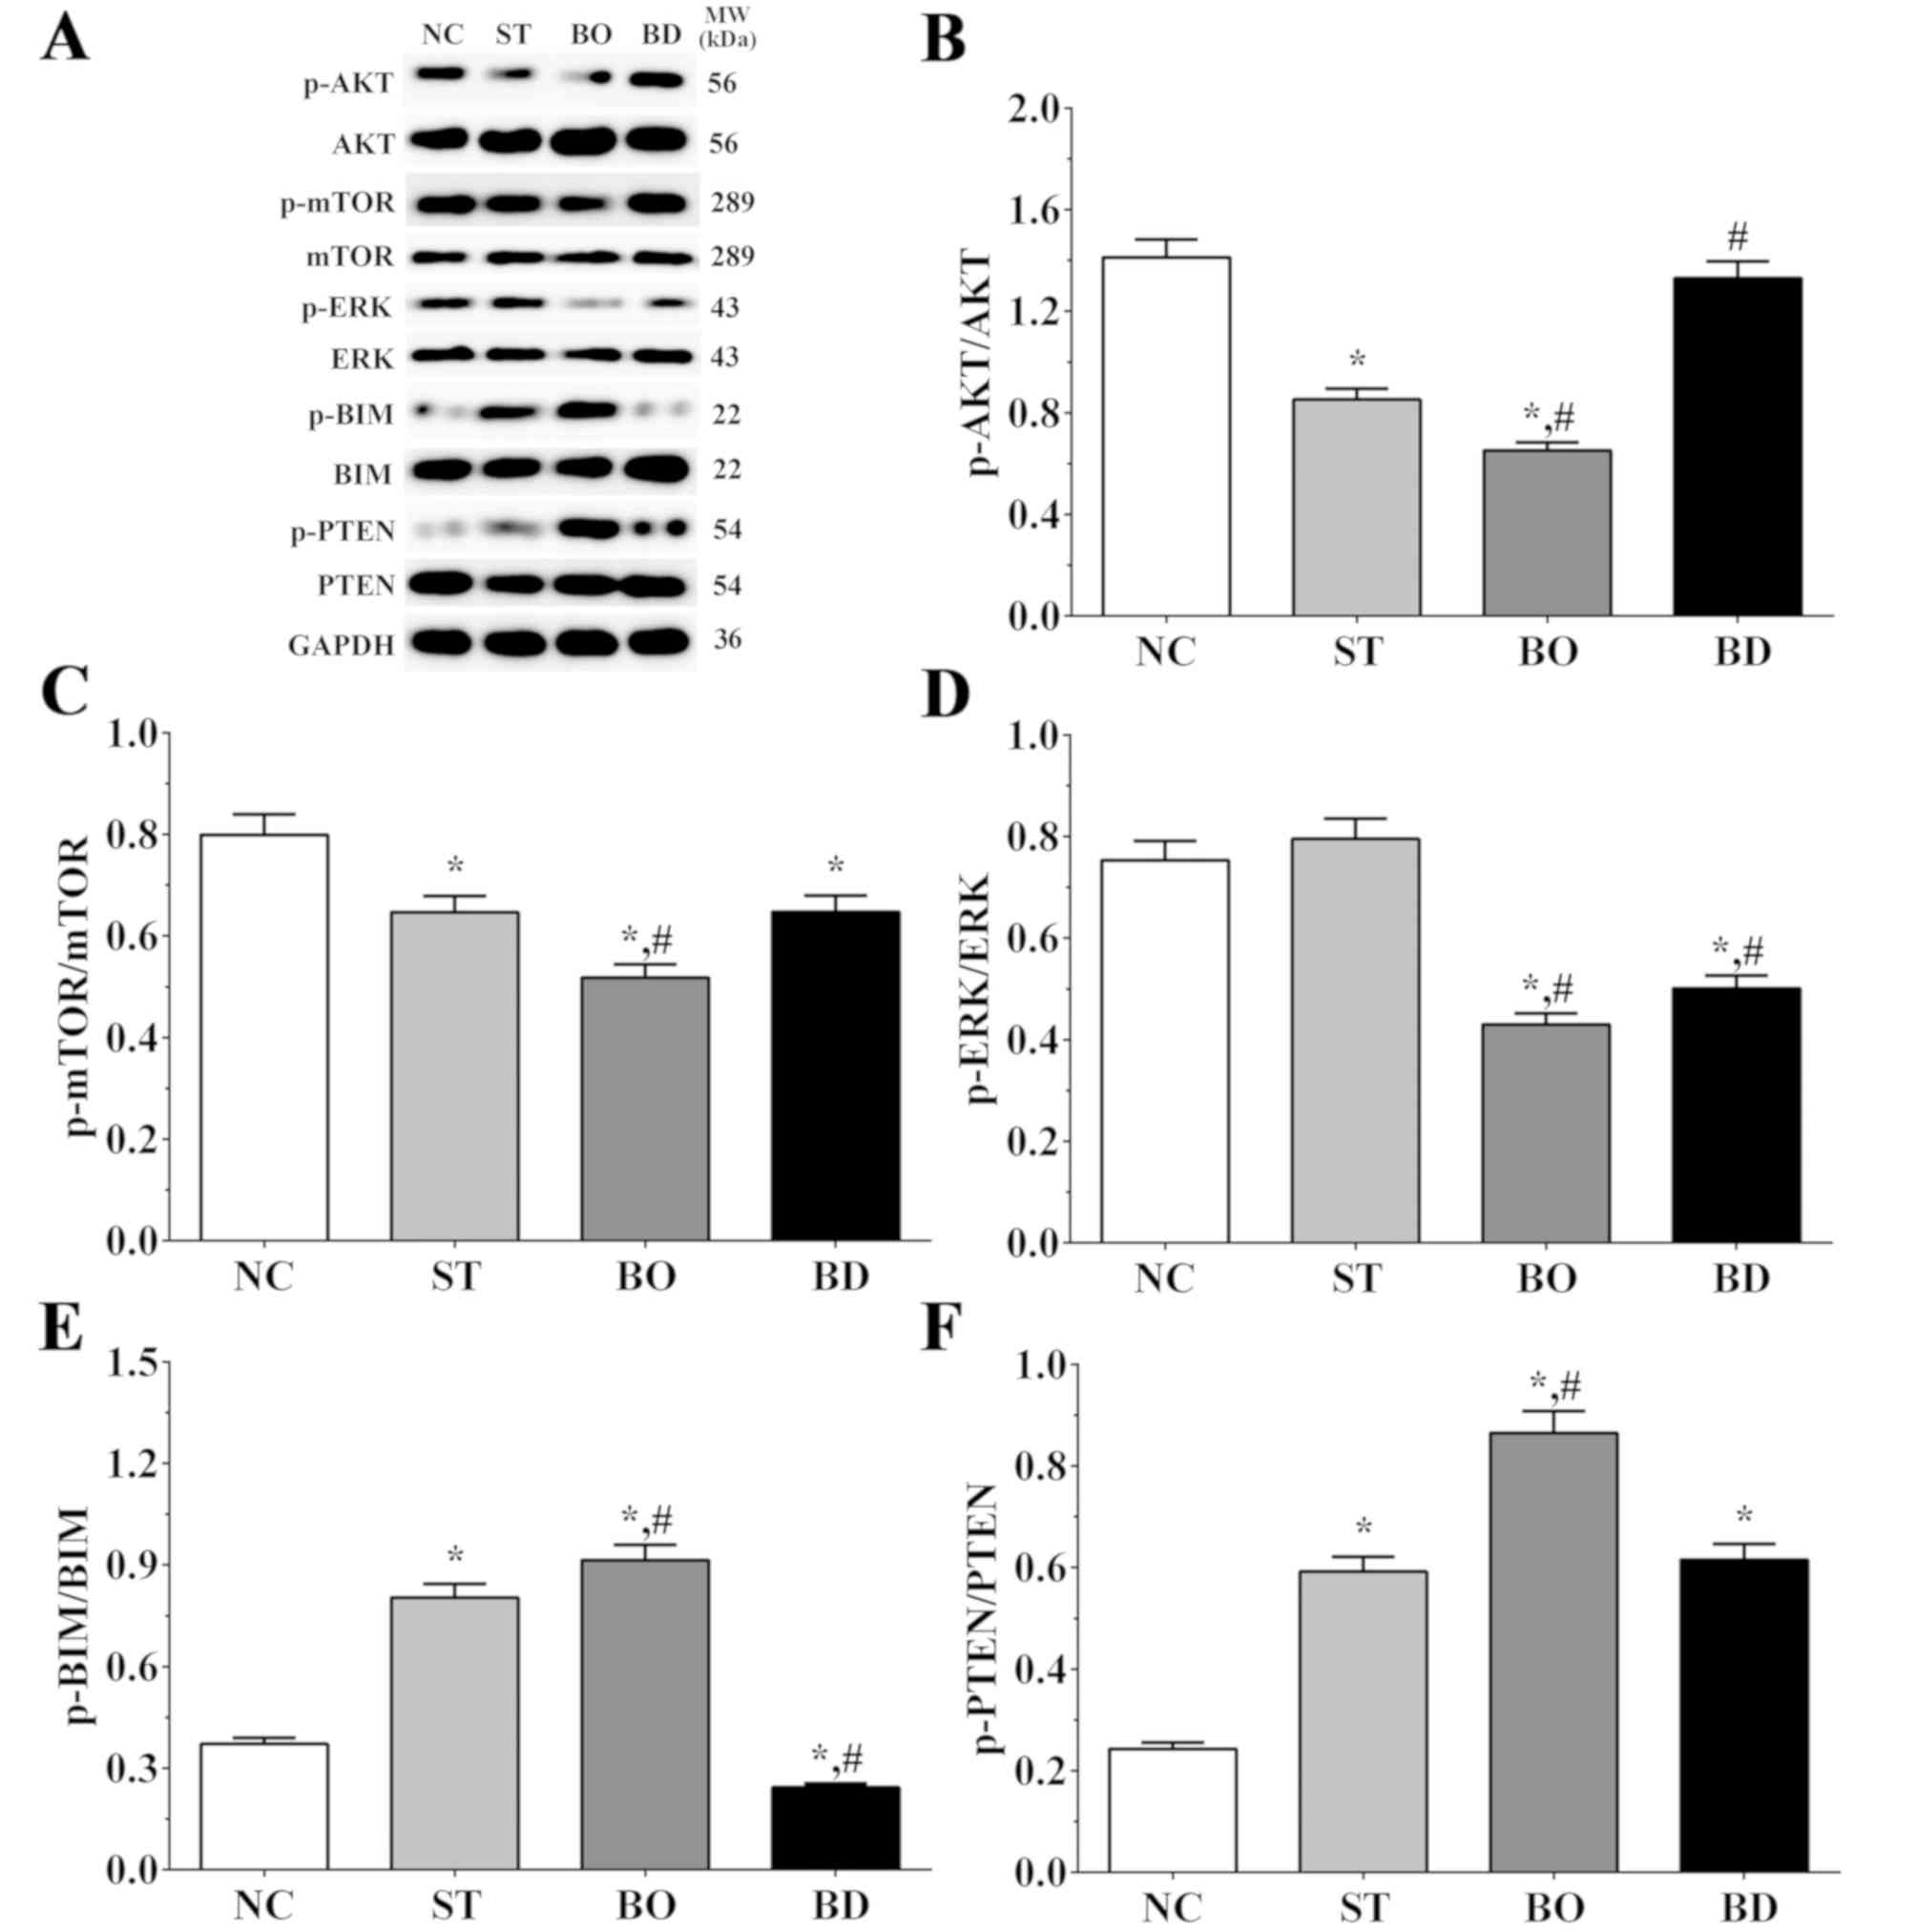 | Figure 3.Expression levels of molecules in the
AKT/mTOR/ERK signaling pathway. (A) The levels of p-AKT, AKT,
p-mTOR, mTOR, p-ERK, ERK, p-BIM, BIM, p-PTEN and PTEN as detected
using western blot analysis. (B-F) Quantitative analysis of the
western blot results. Experiments were independently repeated three
times. Data are shown as the mean ± SEM. *P<0.05 vs. the NC
group. #P<0.05 vs. the ST group. GAPDH was used as an
internal control. Groups: NC, control group; ST, sorafenib
treatment group; BO, sorafenib treatment with BRMS1 overexpression
group; BD, sorafenib treatment with BRMS1 knockdown group. BRMS1,
breast carcinoma metastasis-suppressor 1 gene. |
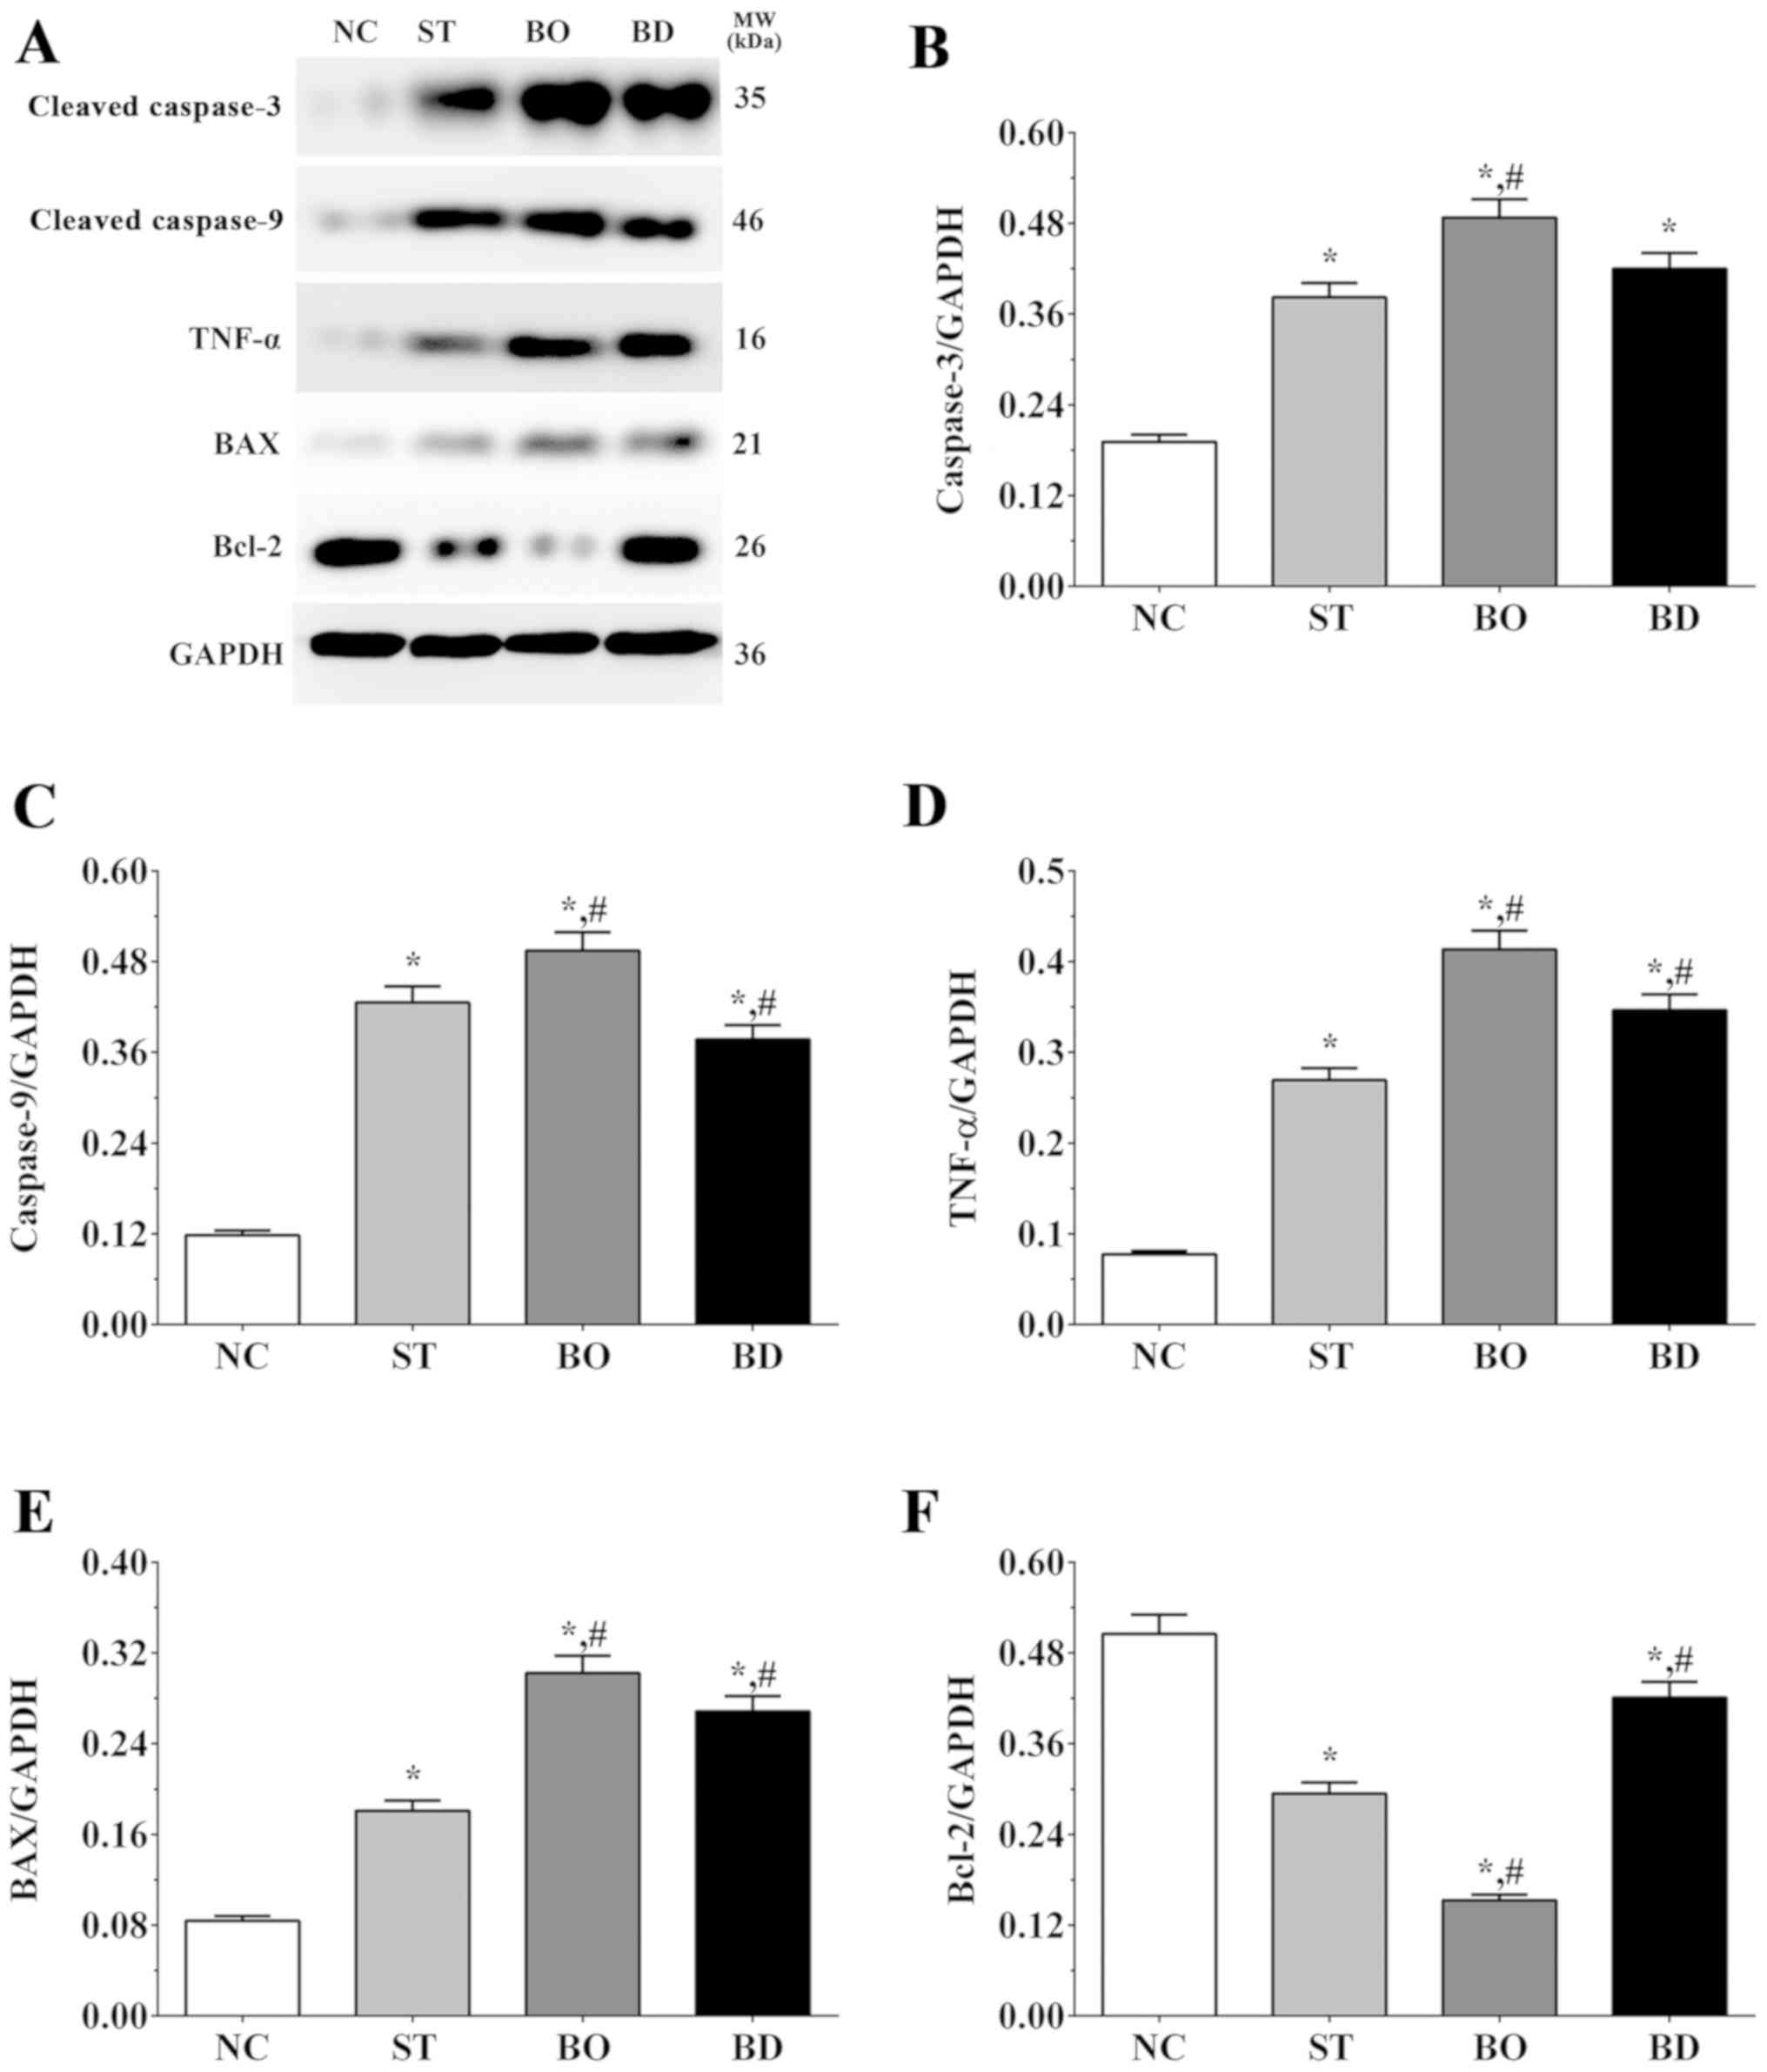
Effect of sorafenib on the expression
levels of apoptosis-related molecules
As shown in Fig. 4A and
B, the expression level of caspase-3 was 0.19±0.01, 0.38±0.02,
0.49±0.02 and 0.42±0.02 in the NC, ST, BO and BD groups,
respectively. Compared to the NC group, expression of caspase-3 was
significantly increased in all experimental groups (P<0.05), and
compared to the ST group, expression of caspase-3 was significantly
increased in the BO group (P<0.05). As shown in Fig. 4A and C, the expression level of
caspase-9 was 0.12±0.01, 0.43±0.02, 0.49±0.02 and 0.38±0.02 in
these groups, respectively. Compared to the NC group, expression of
caspase-9 was significantly increased in all experimental groups
(P<0.05), and compared with the ST group, expression of
caspase-9 was significantly increased in the BO group (P<0.05)
and significantly decreased in the BD group (P<0.05). As shown
in Fig. 4A and D, the TNF-α
expression level was 0.08±0.01, 0.27±0.01, 0.41±0.02 and 0.35±0.02
in these groups, respectively. Compared to the NC group, expression
of TNF-α was significantly increased in all experimental groups
(P<0.05), and compared to the ST group, the expression of TNF-α
was significantly increased in the BO and BD group (P<0.05). As
shown in Fig. 4A and E, the
expression level of Bax was 0.08±0.01, 0.18±0.01, 0.30±0.02 and
0.27±0.01 in these groups, respectively. Expression changes in Bax
were similar to those for TNF-α. As shown in Fig. 4A and F, the expression level of Bcl-2
was 0.51±0.03, 0.29±0.01, 0.15±0.01 and 0.42±0.02 in these groups,
respectively. Compared to the NC group, expression of Bcl-2 was
significantly decreased in all the experimental groups (P<0.05),
and compared to the ST group, expression of Bcl-2 was significantly
decreased in the BO (P<0.05) and significantly increased in the
BD group (P<0.05).
Effect of sorafenib on secretion of
angiogenesis-related molecules
As shown in Fig. 5A,
the concentration of IGF was 1,040.3±23.1, 922.5±21.2, 856.4±18.5
and 990.6±23.8 in the NC, ST, BO and BD groups, respectively.
Compared to the NC group, the IGF concentration was significantly
decreased in the ST and BO groups (P<0.05). Compared to the ST
group, the concentration of IGF was significantly decreased in the
BO group (P<0.05) and significantly increased in the BD group
(P<0.05). As shown in Fig. 5B, the
concentration of TGF-β was 858.3±15.6, 930.5±19.7, 1154.2±21.6 and
886.2±18.1 in these groups, respectively. The concentration of
TGF-β was significantly increased in the ST and BO groups compared
to the NC group (P<0.05). In addition, compared to the ST group,
the concentration of TGF-α was significantly decreased in the BD
group (P<0.05) and significantly increased in the BO group
(P<0.05). As shown in Fig. 5C, the
VEGF concentration was 1,823.0±28.4, 1,577.2±21.4, 1,085.6±18.2 and
1,780.5±23.2 in these groups, respectively. Compared to the NC
group, the concentration of VEGF was significantly decreased in the
ST and BO groups (P<0.05). Compared to the ST group, the
concentration of VEGF was significantly decreased in the BO group
(P<0.05), and significantly increased in BD group (P<0.05).
As shown in Fig. 5D, the
concentrations of EGF was 156.3±20.3, 114.5±10.2, 93.4±7.1 and
138.9±13.2 in these groups, respectively. Compared to the NC group,
the concentration of VEGF was significantly decreased in the ST and
BO group (P<0.05). Compared to the ST group, the concentration
of VEGF was significantly decreased in BO group (P<0.05) and
significantly increased in the BD group (P<0.05).
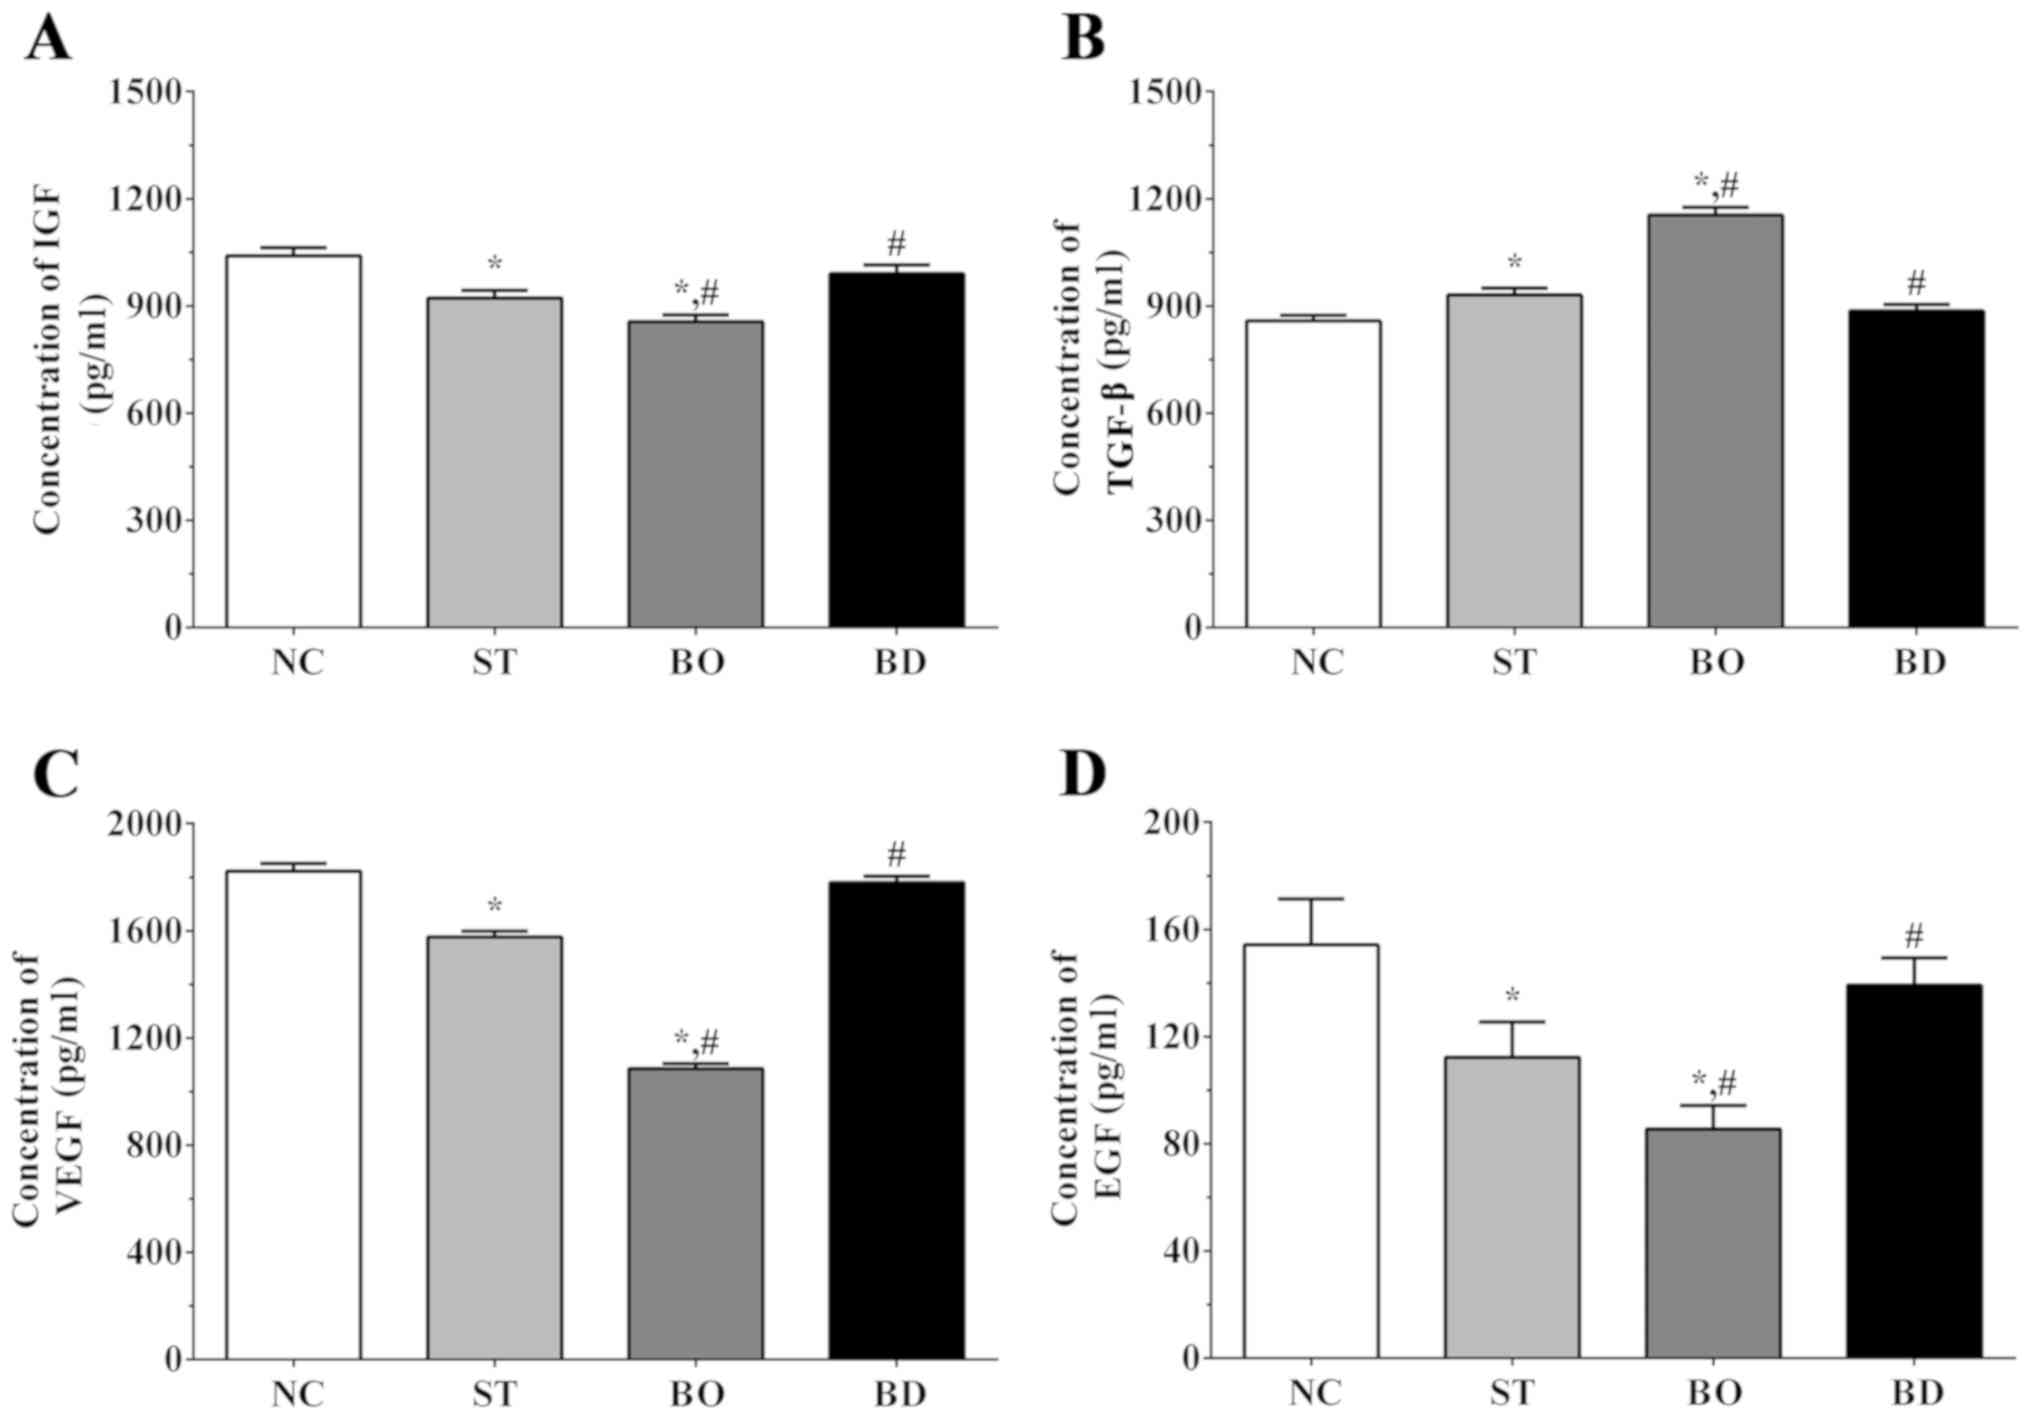 | Figure 5.Angiogenesis-related cytokines in
medium as detected using ELISA method. Concentrations of (A) IGF,
(B) TGF-β, (C) VEGF and (D) EGF in medium. Experiments were
independently repeated three times. Data are shown as the mean ±
SEM. *P<0.05 vs. the NC group. #P<0.05 vs. the ST
group. Groups: NC, control group; ST, sorafenib treatment group;
BO, sorafenib treatment with BRMS1 overexpression group; BD,
sorafenib treatment with BRMS1 knockdown group. IGF, insulin-like
growth factor; VEGF, vascular endothelial growth factor; EGF,
epidermal growth factor; BRMS1, breast carcinoma
metastasis-suppressor 1 gene. |
Discussion
Liver cancer is the fifth most commonly occurring
cancer in men and the ninth most commonly occurring cancer in
women, worldwide, ranking third in cancer-related mortality and is
especially common in Asia due to the presence of endemic hepatitis
B viral infection. Other etiologies also contribute to the
occurrence of liver cancer, including hepatitis C viral infection,
alcoholic cirrhosis, hereditary hemochromatosis and primary biliary
cirrhosis (14). Standard treatment
for liver cancer differs depending on the prognosis of these
patients, and most patients with early disease are not symptomatic.
Liver resection is the cornerstone of surgical management for liver
cancer. However, resection is only achievable in 25% of patients
since tumors are often at an advanced stage at the time of
diagnosis. Furthermore, post-resection local recurrence remains
high, reaching 50% at 5 years (15).
Sorafenib was approved for the treatment for liver cancer in Europe
and in the USA in 2007 (16), and
remains the only agent approved to treat systemic liver cancer.
The effect of breast carcinoma metastasis-suppressor
1 gene (BRMS1) on cell invasion and metastasis has been
demonstrated in multiple cell types. However, the effect of BRMS1
on the proliferation of cancer cells remains unclear, as few
studies have focused on the effect of BRMS1 on the proliferation of
cancer cells. BRMS1 has been shown to inhibit the proliferation of
breast cancer (17), non-small cell
lung cancer (18) and forestomach
carcinoma (19). In the present
study, a cell model of BRMS1 overexpression and knockdown was first
established. We observed that overexpression of BRMS1 enhanced the
inhibitory effect of sorafenib on the proliferation of a hepatoma
carcinoma cell line using MTT assay and immunofluorescence by
disrupting the normal structure of hepatoma carcinoma cells. It was
also found that sorafenib inhibited activation of the PI3K/AKT/mTOR
signaling pathway, further inducing apoptosis via BIM, Bax, Bak,
Bcl-2 and caspase enzymes. In addition, we observed activation of
the immune response in response to sorafenib treatment. Expression
of key factors in angiogenesis and cancer development were also
inhibited after sorafenib treatment. BRMS1 overexpression enhanced
the antitumor effects of sorafenib, while BRMS1 knockdown
attenuated these effects. Thus, BRMS1 synergizes with sorafenib in
regards to its effects on hepatoma carcinoma cells, potentially
representing a novel therapeutic strategy.
Mast cells (MCs) are immune cells derived from stem
cells that migrate and mature close to epithelial cells. MCs also
participate in late-phase responses via releasing a variety of
cytokines (TNF, IL-1β, IL-2 and IL-6), and induce Th2 cell
responses (20). IL-1β could affect
all innate immune cells, acting as a pro-inflammatory cytokine. A
previous study found that IL-1β activates MCs, further aggregating
the FcεRI receptor, followed by secretion of biologically active
compounds (21). In addition, IL-1β
induces expression of TNF-α in innate immune cells, including MCs
and macrophages. IL-1β also induces expression of TNF-α via
blocking the combination of IL-1β and IL-37 (22). IL-2 is a helical cytokine primarily
produced by activated T cells that promotes lymphocytes,
macrophages and NK cells (23). IL-2
binds with IL-2 receptor in T cells, further activating Janus
kinase (JAK)/signal transducer and activator of transcription
(STAT) pathways and mitogen-activated protein kinase (MAPK) and
phosphoinositide 3-kinase signaling (PI3K) pathways, resulting in
transcription of pro-inflammatory cytokines, as well as survival
and cell cycle genes (24). Thus,
IL-2 is considered a lymphocyte-activating and immune-stimulating
factor. IL-6 is also an important cytokine in the immune response
process. IL-6 is primarily produced by monocytes and T cells, but
also epithelial cells (25). And in
the present study, sorafenib treatment was found to significantly
increase the expression of IL-1β, IL-2 and IL-6 in HepG2 cells,
indicating that sorafenib treatment activates the inflammatory
response process in liver cancer cells, further inducing the
apoptosis process. Moreover, BRMS1 overexpression was found to
enhance the effect of sorafenib, while knockdown of BRMS1 reduced
the effect of sorafenib. The change in the expression of
pro-inflammatory cytokines further induces the change in expression
of downstream molecules, leading to the change in multiple
physiological processes. IL-6 promotes the development of Th17
cells via combination with TGF-β, inhibits the differentiation of
Tregs induced by TGF-β, and plays an important role in the
pathogenesis of chronic inflammatory disease. IL-6 not only
participates in cancer-related inflammation but also plays a
crucial role in DNA damage repair, proliferation, metastasis,
angiogenesis and metabolic remodeling (26).
Activation of apoptosis is also an important step in
the treatment of cancer. Bcl-2 was first identified through
chromosomal mapping in follicular lymphoma (27). Decreased expression of pro-apoptotic
proteins of the Bcl-2 family is commonly seen in cancer with
increased expression of pro-survival proteins. Bcl-2 was found to
increase the development of cancer by resisting cell death
(28). Bcl-2 is also important for
embryogenesis, and Bcl-2-deficient mice exhibit growth retardation,
premature greying, and apoptotic involution of spleen/thymus,
succumbing to death via polycystic kidney disease with inhibition
of cellular differentiation (29).
Bax and Bak are pro-apoptotic molecules in the Bcl-2 family that
contain membrane anchoring C-terminal tails. Bax and Bak usually
exist in dynamic equilibrium between the cytosol and membrane and
are constitutively translocated to the cytosol by pro-survival
Bcl-2 proteins. In the absence of Bcl-2, Bax and Bak localize to
the membrane. Activation of Bax/Bak is mediated by BH3-only
proteins, including BIM, tBID and PUMA, which directly interact
with Bax/Bak to trigger conformational changes (30). Tumor necrosis factor α (TNF-α) is a
major pro-inflammatory cytokine that participates in multiple
inflammatory pathologies and is produced by macrophages,
endothelial cells, fibroblasts and T lymphocytes (31). TNF-α binds with TNFR1, leading to
conformational changes that activate TNF receptor type-1-associated
death domain protein, the adaptor protein of TNF-α, resulting in
activation of NF-κB, MAPK and apoptotic signaling pathways. In a
pulmonary sarcoidosis model, macrophages were found to
spontaneously produce TNF-α in excess quantities, as well as IL-1β,
IL-2, IL-6 and IL-10, leading to the formation of non-caseating
granulomas (32). Furthermore,
secretion of cytokines induced by TNF-α are especially predominant
in progressive disease. In the present study, we found that the
expression of pro-apoptosis molecules TNF-α and Bax was increased,
while the expression of anti-apoptosis molecule Bcl-2 was decreased
at the gene and protein levels. This result indicated that
sorafenib could increase the apoptosis process in liver cancer
cells, and this phenomenon might be a consequence of the activation
of the inflammatory process. Moreover, activation of apoptosis was
enhanced by overexpression of BRMS1, while knockdown of the
expression of BRMS1 reduced the effect of sorafenib.
The PI3K/AKT/mTOR signaling pathway performs an
important role in the regulation of cellular metabolism, growth and
survival, and dysfunction of PI3K/AKT/mTOR is commonly observed in
human malignancies including renal cell carcinoma, breast cancer
and neuroendocrine tumors (33). As a
downstream molecule of PI3K/AKT signaling, mTOR is a 289-kDa
serine/threonine kinase that contains two large multiprotein
complexes, mTORC1 and mTORC2. mTORC1 activates eukaryotic
initiation factor 4E (eIF4E) binding protein 1 (p-4E-BP1) via
phosphorylation, promoting dissociation of 4E-BP1 and eIF4E and
subsequent eIF4E-dependent protein synthesis. AKT promotes the
activation of mTOR via inhibiting phosphorylation of tuberous
sclerosis complex (TSC) proteins 1/2, an inhibitor of mTOR.
PI3K/AKT signaling is negatively regulated by PTEN (tumor
suppressor phosphatase and tensin homolog), which converts the
active form of PIP3 into inactive PIP2, impairing activation of the
AKT signaling pathway (34). Bim is
another molecule downstream of AKT, and is an essential initiator
of the apoptotic response. During the last decade, BIM was
considered a critical pro-apoptotic protein for initiating the
intrinsic apoptosis pathway (35).
Downregulation of Bim caused by various signaling pathways may lead
to tumor metastasis. Bim along with tBid and Puma, directly
activate Bax/Bak, and once activated, Bax and Bak oligomers induce
permeabilization of the mitochondrial outer membrane (MOM), leading
to the release of cytochrome c, further binding with
apoptotic protease-activating factor 1 (Apaf-1), and initiating the
apoptotic cascade (36). Thus, we
speculated that the activation of the inflammatory and apoptosis
processes may be mediated by inhibition of the PI3K/AKT/mTOR/ERK
signaling pathway. Furthermore, activation of PTEN was also
increased after sorafenib treatment, performing an antitumor role.
In addition, overexpression of BRMS1 enhanced this process. The
activation of the PI3K/AKT/mTOR/ERK signaling pathway would further
induce activation of the apoptosis and inflammatory response,
leading to the apoptosis of liver cancer cells, ensuring an
antitumor effect.
IGF is a critical molecule for angiopoiesis, and the
main function of IGF in liver physiology includes organ
development, growth and regeneration (37). Molecules in the IGF system are
generally hepato-protective, playing an important role in hormonal
and metabolic effects (38). In liver
cancer patients, the concentrations of IGF in serum samples are
significantly reduced compared to healthy controls. Additionally,
in virus-associated liver cancer, patients also exhibit greater IGF
levels than in non-infected liver cancer patients (39). Reduced IGF levels in serum sample are
also correlated with advanced progression and poor overall
survival. TGF-β is a proliferation inhibiting cytokine and a
tumor-suppressor factor (40). TGF-β
reduces the progression and metastasis of advanced cancer. However
in latter stages of disease, TGF-β becomes an oncogenic factor via
inducing angiogenesis, invasion and immunosuppression (41). Vascular endothelial growth factor α
(VEGF-α) was firstly isolated by Ferrara's group, and was
demonstrated to perform an important role in angiogenesis in a
mouse model of VEGF haplo-insufficiency (42). Animal experiments identified that
inhibition of VEGF-α reduces the growth and vascular density of
tumor tissues. Furthermore, expression of VEGF-α is regulated by
multiple factors including hypoxia, signal transducers and
activators of transcription, NO gradient, microRNAs, and other
factors (43). Using ELISA assay, we
found that the secretion of pro-angiogenesis- and
pro-proliferation-related cytokines in cultured medium was
inhibited after sorafenib treatment, and overexpression of BRMS1
enhanced this trend while knockdown of BRMS1 reduced this trend.
The inhibitory function in angiogenesis and proliferation further
inducing the apoptosis of liver cancer cells would induce the
release of inflammatory cytokines in a feedback way, further
inhibiting the release of angiogenesis and proliferation
cytokines.
In the present study, a model of BRMS1
overexpression and knockdown was established in HepG2 cells,
demonstrating that sorafenib inhibited the proliferation in these
cells. In addition, sorafenib increased the expression of
apoptosis-related molecules in the HepG2 cells at both the gene and
protein levels. Next, we observed that the inflammatory response
and secretion of angiogenic factors were inhibited in response to
sorafenib treatment. We further demonstrated that these effects
might be mediated by inhibition of the PI3K/AKT/mTOR/ERK signaling
pathway. Overexpression of BRMS1 enhanced the treatment effect of
sorafenib while knockdown of BRMS1 attenuated this effect,
potentially representing a novel therapeutic strategy for liver
cancer. However, more experiments concerning the phenotype of cells
and detailed molecular changes are helpful for us to explore the
possible mechanism, and clinical trials on a large scale are
helpful for us to apply these findings into the treatment of
cancers.
Acknowledgements
Not applicable.
Funding
The present study was supported by the Tianjin
Science and Technology Project (no. 16ZXHLSY00120).
Availability of data and materials
The datasets used and/or analyzed during the current
study are available from the corresponding author on reasonable
request.
Authors' contributions
JJ, YG and YL performed the experiment of this
manuscript. XY performed the flow cytometric analysis and wrote the
manuscript. ZW and SS designed the present study and revised the
manuscript. All authors read and approved the manuscript and agree
to be accountable for all aspects of the research in ensuring that
the accuracy or integrity of any part of the work are appropriately
investigated and resolved.
Ethics approval and consent to
participate
Not applicable.
Patient consent for publication
Not applicable.
Competing interests
The authors state that they have no competing
interests.
Glossary
Abbreviations
Abbreviations:
|
BRMS1
|
breast carcinoma metastasis-suppressor
1
|
|
PI3K
|
phosphatidylinositol 3-kinase
|
|
AKT
|
PKB protein kinase
|
|
mTOR
|
mammalian target of rapamycin
|
|
ERK
|
extracellular signal-regulated
kinase
|
|
qPCR
|
real-time quantitative polymerase
chain reaction
|
|
IGF
|
insulin-like growth factor
|
|
TNF-α
|
tumor necrosis factor-α
|
|
VEGF
|
vascular endothelial growth factor
|
|
EGF
|
epidermal growth factor
|
References
|
1
|
Parkin DM: Global cancer statistics in the
year 2000. Lancet Oncol. 2:533–543. 2001. View Article : Google Scholar : PubMed/NCBI
|
|
2
|
Raza A and Sood GK: Hepatocellular
carcinoma review: Current treatment, and evidence-based medicine.
World J Gastroenterol. 20:4115–4127. 2014. View Article : Google Scholar : PubMed/NCBI
|
|
3
|
Keating GM: Sorafenib: A review in
hepatocellular carcinoma. Target Oncol. 12:243–253. 2017.
View Article : Google Scholar : PubMed/NCBI
|
|
4
|
Chen J, Jin R, Zhao J, Liu J, Ying H, Yan
H, Zhou S, Liang Y, Huang D, Liang X, et al: Potential molecular,
cellular and microenvironmental mechanism of sorafenib resistance
in hepatocellular carcinoma. Cancer Lett. 367:1–11. 2015.
View Article : Google Scholar : PubMed/NCBI
|
|
5
|
Kodura MA and Souchelnytskyi S: Breast
carcinoma metastasis suppressor gene 1 (BRMS1): Update on its role
as the suppressor of cancer metastases. Cancer Metastasis Rev.
34:611–618. 2015. View Article : Google Scholar : PubMed/NCBI
|
|
6
|
Samant RS, Seraj MJ, Saunders MM, Sakamaki
TS, Shevde LA, Harms JF, Leonard TO, Goldberg SF, Budgeon L, Meehan
WJ, et al: Analysis of mechanisms underlying BRMS1 suppression of
metastasis. Clin Exp Metastasis. 18:683–693. 2000. View Article : Google Scholar : PubMed/NCBI
|
|
7
|
Qiu R, Shi H, Wang S, Leng S, Liu R, Zheng
Y, Huang W, Zeng Y, Gao J, Zhang K, et al: BRMS1 coordinates with
LSD1 and suppresses breast cancer cell metastasis. Am J Cancer Res.
8:2030–2045. 2018.PubMed/NCBI
|
|
8
|
Rivera J, Megías D, Navas C and Bravo J:
Identification of essential sequences for cellular localization in
BRMS1 metastasis suppressor. PLoS One. 4:e64332009. View Article : Google Scholar : PubMed/NCBI
|
|
9
|
Chimonidou M, Strati A, Tzitzira A,
Sotiropoulou G, Malamos N, Georgoulias V and Lianidou ES: DNA
methylation of tumor suppressor and metastasis suppressor genes in
circulating tumor cells. Clin Chem. 57:1169–1177. 2011. View Article : Google Scholar : PubMed/NCBI
|
|
10
|
Hicks DG, Yoder BJ, Short S, Tarr S,
Prescott N, Crowe JP, Dawson AE, Budd GT, Sizemore S, Cicek M, et
al: Loss of breast cancer metastasis suppressor 1 protein
expression predicts reduced disease-free survival in subsets of
breast cancer patients. Clin Cancer Res. 12:6702–6708. 2006.
View Article : Google Scholar : PubMed/NCBI
|
|
11
|
Wang T, Lander ES and Sabatini DM:
Large-scale single guide RNA library construction and use for
CRISPR-Cas9-based genetic screens. Cold Spring Harb Protoc 2016.
pdb.top086892. 2016. View Article : Google Scholar
|
|
12
|
Witt-Kehati D, Fridkin A, Alaluf MB, Zemel
R and Shlomai A: Inhibition of pMAPK14 overcomes resistance to
sorafenib in hepatoma cells with hepatitis B virus. Transl Oncol.
11:511–517. 2018. View Article : Google Scholar : PubMed/NCBI
|
|
13
|
Al Dubayee MS, Alayed H, Almansour R,
Alqaoud N, Alnamlah R, Obeid D, Alshahrani A, Zahra MM, Nasr A,
Al-Bawab A and Aljada A: Differential expression of human
peripheral mononuclear cells phenotype markers in type 2 diabetic
patients and type 2 diabetic patients and type 2 diabetic patients
on metformin. Front Endocrinol (Lausanne). 9:5372018. View Article : Google Scholar
|
|
14
|
Hartke J, Johnson M and Ghabril M: The
diagnosis and treatment of hepatocellular carcinoma. Semin Diagn
Pathol. 34:153–159. 2017. View Article : Google Scholar : PubMed/NCBI
|
|
15
|
Tung-Ping Poon R, Fan ST and Wong J: Risk
factors, prevention, and management of postoperative recurrence
after resection of hepatocellular carcinoma. Ann Surg. 232:10–24.
2000. View Article : Google Scholar : PubMed/NCBI
|
|
16
|
Tzogani K, Skibeli V, Westgaard I, Dalhus
M, Thoresen H, Slot KB, Damkier P, Hofland K, Borregaard J, Ersbøll
J, et al: The European medicines agency approval of axitinib
(Inlyta) for the treatment of advanced renal cell carcinoma after
failure of prior treatment with sunitinib or a cytokine: Summary of
the scientific assessment of the committee for medicinal products
for human use. Oncologist. 20:196–201. 2015. View Article : Google Scholar : PubMed/NCBI
|
|
17
|
Hedley BD, Vaidya KS, Phadke P, MacKenzie
L, Dales DW, Postenka CO, MacDonald IC and Chambers AF: BRMS1
suppresses breast cancer metastasis in multiple experimental models
of metastasis by reducing solitary cell survival and inhibiting
growth initiation. Clin Exp Metastasis. 25:727–740. 2008.
View Article : Google Scholar : PubMed/NCBI
|
|
18
|
You J, He X, Ding H and Zhang T: BRMS1
regulates apoptosis in non-small cell lung cancer cells. Cell
Biochem Biophys. 71:465–472. 2015. View Article : Google Scholar : PubMed/NCBI
|
|
19
|
Guo XL, Wang YJ, Cui PL, Wang YB, Liang
PX, Zhang YN and Xu YQ: Effect of BRMS1 expression on
proliferation, migration and adhesion of mouse forestomach
carcinoma. Asian Pac J Trop Med. 8:724–730. 2015. View Article : Google Scholar : PubMed/NCBI
|
|
20
|
Toniato E, Frydas I, Robuffo I, Ronconi G,
Caraffa Al, Kritas SK and Conti P: Activation and inhibition of
adaptive immune response mediated by mast cells. J Biol Regul
Homeost Agents. 31:543–548. 2017.PubMed/NCBI
|
|
21
|
De Feo D, Merlini A, Brambilla E, Ottoboni
L, Laterza C, Menon R, Srinivasan S, Farina C, Garcia Manteiga JM,
Butti E, et al: Neural precursor cell-secreted TGF-β2 redirects
inflammatory monocyte-derived cells in CNS autoimmunity. J Clin
Invest. 127:3937–3953. 2017. View
Article : Google Scholar
|
|
22
|
Clark IA and Vissel B: Excess cerebral TNF
causing glutamate excitotoxicity rationalizes treatment of
neurodegenerative diseases and neurogenic pain by anti-TNF agents.
J Neuroinflammation. 13:2362016. View Article : Google Scholar : PubMed/NCBI
|
|
23
|
Apert C, Romagnoli P and van Meerwijk JPM:
IL-2 and IL-15 dependent thymic development of Foxp3-expressing
regulatory T lymphocytes. Protein Cell. 9:322–332. 2018.PubMed/NCBI
|
|
24
|
Mazumder AG, Patial V and Singh D:
Mycophenolate mofetil contributes to downregulation of the
hippocampal interleukin type 2 and 1β mediated PI3K/AKT/mTOR
pathway hyperactivation and attenuates neurobehavioral
comorbidities in a rat model of temporal lobe epilepsy. Brain Behav
Immun. 75:84–93. 2019. View Article : Google Scholar : PubMed/NCBI
|
|
25
|
Yan C, Deng C, Liu X, Chen Y, Ye J, Cai R,
Shen Y and Tang H: TNF-α induction of IL-6 in alveolar type II
epithelial cells: Contributions of JNK/c-Jun/AP-1 element,
C/EBPδ/C/EBP binding site and IKK/NF-κB p65/κB site. Mol Immunol.
101:585–596. 2018. View Article : Google Scholar : PubMed/NCBI
|
|
26
|
Kumari N, Dwarakanath BS, Das A and Bhatt
AN: Role of interleukin-6 in cancer progression and therapeutic
resistance. Tumour Biol. 37:11553–11572. 2016. View Article : Google Scholar : PubMed/NCBI
|
|
27
|
Tsujimoto Y, Finger LR, Yunis J, Nowell PC
and Croce CM: Cloning of the chromosome breakpoint of neoplastic B
cells with the t(14;18) chromosome translocation. Science.
226:1097–1099. 1984. View Article : Google Scholar : PubMed/NCBI
|
|
28
|
D'Orsi B, Mateyka J and Prehn JHM: Control
of mitochondrial physiology and cell death by the Bcl-2 family
proteins Bax and Bok. Neurochem Int. 109:162–170. 2017. View Article : Google Scholar : PubMed/NCBI
|
|
29
|
Veis DJ, Sorenson CM, Shutter JR and
Korsmeyer SJ: Bcl-2-deficient mice demonstrate fulminant lymphoid
apoptosis, polycystic kidneys, and hypopigmented hair. Cell.
75:229–240. 1993. View Article : Google Scholar : PubMed/NCBI
|
|
30
|
Chipuk JE, Moldoveanu T, Llambi F, Parsons
MJ and Green DR: The BCL-2 family reunion. Mol Cell. 37:299–310.
2010. View Article : Google Scholar : PubMed/NCBI
|
|
31
|
Sedano Muñoz R, Quera Pino R, Lubascher
Correa J, Pizarro Jofré G and Simian Marín D: Evaluation of
de-escalation of anti-TNF-α therapy in inflammatory bowel disease.
Gastroenterol Hepatol. 42:133–140. 2019.(In English, Spanish).
View Article : Google Scholar : PubMed/NCBI
|
|
32
|
Mortaz E, Sereshki HA, Abedini A, Kiani A,
Mirsaeidi M, Soroush D, Garssen J, Velayati A, Redegeld FA and
Adcock IM: Association of serum TNF-α, IL-8 and free light chain
with HLA-DR B alleles expression in pulmonary and extra-pulmonary
sarcoidosis. J Inflamm (Lond). 12:212015. View Article : Google Scholar : PubMed/NCBI
|
|
33
|
Laplante M and Sabatini DM: mTOR signaling
in growth control and disease. Cell. 149:274–293. 2012. View Article : Google Scholar : PubMed/NCBI
|
|
34
|
Ocana A, Vera-Badillo F, Al-Mubarak M,
Templeton AJ, Corrales-Sanchez V, Diez-Gonzalez L, Cuenca-Lopez MD,
Seruga B, Pandiella A and Amir E: Activation of the PI3K/mTOR/AKT
pathway and survival in solid tumors: Systematic review and
meta-analysis. PLoS One. 9:e952192014. View Article : Google Scholar : PubMed/NCBI
|
|
35
|
Ersahin T, Tuncbag N and Cetin-Atalay R:
The PI3K/AKT/mTOR interactive pathway. Mol Biosyst. 11:1946–1954.
2015. View Article : Google Scholar : PubMed/NCBI
|
|
36
|
Sionov RV, Vlahopoulos SA and Granot Z:
Regulation of Bim in health and disease. Oncotarget. 6:23058–23134.
2015. View Article : Google Scholar : PubMed/NCBI
|
|
37
|
Chen F, Zhang L, Wu J, Huo F, Ren X, Zheng
J and Pei D: HCRP-1 regulates EGFR-AKT-BIM-mediated anoikis
resistance and serves as a prognostic marker in human colon cancer.
Cell Death Dis. 9:11762018. View Article : Google Scholar : PubMed/NCBI
|
|
38
|
Kasprzak A and Adamek A: The insulin-like
growth factor (IGF) signaling axis and hepatitis C virus-associated
carcinogenesis (review). Int J Oncol. 41:1919–1931. 2012.
View Article : Google Scholar : PubMed/NCBI
|
|
39
|
Adamek A and Kasprzak A: Insulin-like
growth factor (IGF) system in liver diseases. Int J Mol Sci.
19(pii): E13082018. View Article : Google Scholar : PubMed/NCBI
|
|
40
|
Wang J, Li YC, Deng M, Jiang HY, Guo LH,
Zhou WJ and Ruan B: Serum insulin-like growth factor-1 and its
binding protein 3 as prognostic factors for the incidence,
progression, and outcome of hepatocellular carcinoma: A systematic
review and meta-analysis. Oncotarget. 8:81098–81108.
2017.PubMed/NCBI
|
|
41
|
Seoane J and Gomis RR: TGF-β family
signaling in tumor suppression and cancer progression. Cold Spring
Harb Perspect Biol. 9(pii): a0222772017. View Article : Google Scholar : PubMed/NCBI
|
|
42
|
Feng ZT, Yang T, Hou XQ, Wu HY, Feng JT,
Ou BJ, Cai SJ, Li J and Mei ZG: Sinomenine mitigates
collagen-induced arthritis mice by inhibiting angiogenesis. Biomed
Pharmacother. 113:1087592019. View Article : Google Scholar : PubMed/NCBI
|
|
43
|
Xue D, Yang Y, Liu Y, Wang P, Dai Y, Liu
Q, Chen L, Shen J, Ju H, Li Y and Tan Z: MicroRNA-206 attenuates
the growth and angiogenesis in non-small cell lung cancer cells by
blocking the 14-3-3ζ/STAT3/HIF-1α/VEGF signaling. Oncotarget.
7:79805–79813. 2016. View Article : Google Scholar : PubMed/NCBI
|