Introduction
Myasthenia gravis (MG) is an autoimmune disease
characterized by dysfunctional transmission of nerve impulses to
muscles (1), which impedes eyelid
movement, facial expression, chewing, talking, swallowing and
breathing. The global incidence of MG is 1.7-21.3/1,000,000
individuals per year (2). Although
studies have shown that the mortality rate of MG is currently lower
than two decades ago (3,4), MG still impacts the quality of life
of patients. In current clinical practice, MG diagnosis is
dependent on disease stage and involves clinical examination based
on serum autoantibody detection. The specific diagnostic tools
evaluate levels of anti-acetylcholine receptor (AChR) and
anti-muscle-specific tyrosine kinase (MuSK) Abs (5). However, ~10% of patients with MG test
negative for both anti-AChR and anti-MuSK Abs (6). Therefore, developing novel methods to
diagnose MG is vital.
Mitochondria are abundant in muscle cells and
provide most of the energy required to maintain daily activity of
the human body (7). They are key
for energy production and cell proliferation and death (8). Mitochondrial function is regulated
and depends on structure, dynamics and biogenesis (9). Mitochondria serve a key role in
improving the metabolic quality and plasticity of skeletal muscles
by maintaining biogenesis, dynamics and autophagy/mitophagy
(10).
Mitofusion 1 (Mfn1), Mfn2, optic atrophy type 1
(Opa1), dynamin-related protein 1 (Drp1) and fission 1 (Fis1) are
key factors associated with mitochondrial fusion and fission
(11). Mfn1 and Mfn2 are located
in the outer mitochondrial membrane (OMM) and regulate
mitochondrial fusion. Opa1 is a member of the dynamin family of
mechanoenzymes that are localized in the inner MM, where they
regulate mitochondrial fusion (12).
Previous studies have indicated that regulation of
Mfn2 to restore mitochondrial homeostasis inhibits development of
diabetic cardiomyopathy (13,14).
Drp1 dissociates in the cytosol, while Fis1 is anchored to the OMM.
Specific signals induce transfer of Drp1 from the cytosol to the
surface of the organelle where it interacts with Fis1 to complete
organelle division (12,15). This physiological process is known
as mitochondrial dynamics (8).
AMP-activated protein kinase (AMPK) is an energy
metabolism receptor that serves an important role in maintaining
balanced energy metabolism in cells (16). Peroxisome proliferator-activated
receptor-γ co-activator-1α (PGC-1α) is the primary transcriptional
regulator of mitochondrial biogenesis, respiration and oxidative
phosphorylation (17). Nuclear
respiratory factor-1 (NRF-1) is a nuclear transcription factor that
stimulates expression of nuclear genes to enhance mitochondrial
respiratory function. Mitochondrial transcription factor A (TFAM),
a DNA-binding protein, controls mitochondrial metabolism and
dysfunction by regulating the transcription of its genome and
organizing mitochondrial DNA (mtDNA) (18). PGC-1α activates TFAM by serving as
a co-transcription factor of NRF-1, thereby regulating
mitochondrial biogenesis (19).
Previous studies have shown that mitochondria serve
a role in the development of rare neuromuscular diseases, such as
Duchenne and Becker muscular dystrophy (20,21).
Mitochondrial dysfunction affects muscle function, leading to
atrophy (22). Muscle weakness is
the primary symptom of MG. Both muscle contraction and relaxation
require mitochondria for energy supply; the dynamic balance and
biogenesis of mitochondria are key for these processes (23). Therefore, it was hypothesized that
mitochondrial dynamics and biogenesis factors may serve as
diagnostic biomarkers for MG. The aim of the present study was to
investigate the differences in mitochondrial dynamics and
biogenesis between patients with MG and healthy individuals.
Receiver operating characteristics (ROC) curves were plotted using
reverse transcription-quantitative (RT-q)PCR data to evaluate the
diagnostic value of mitochondria-associated genes, as well as to
determine whether mitochondrial dynamics and biogenesis factors can
serve as diagnostic biomarkers for MG.
Materials and methods
Participants
Patients with MG (19 males and 31 females) were
enrolled from The First Affiliated Hospital of Guangzhou University
of Chinese Medicine (Guangzhou, China) between August 2018 and
February 2019. Samples from 50 healthy volunteers (25 males, 25
females) were also included in the present cross-sectional study.
The following inclusion criteria were used: i) Age, 14-75 years,
ii) willing to participate in the study and iii) examination by
personnel trained in diagnosis of MG class IIb (based on the
clinical classification proposed by the MG Foundation of America)
(24). The following exclusion
criteria were used: i) Hormone, immunosuppression, plasmapheresis,
or intravenous γ globulin treatment during the previous 3 months,
ii) serious infectious disease or subsequent complications (such as
mental illness; cerebrovascular, heart or liver disease; kidney
failure; or malignant tumor) and iii) participation in another
clinical study in the past 3 months. All participants understood
the experimental procedure and provided written informed consent.
Written informed consent was obtained from the parents/guardians of
all participants <18 years old. All procedures involving human
subjects were approved by the Academic Ethics Committee of The
First Affiliated Hospital of Guangzhou University of Chinese
Medicine.
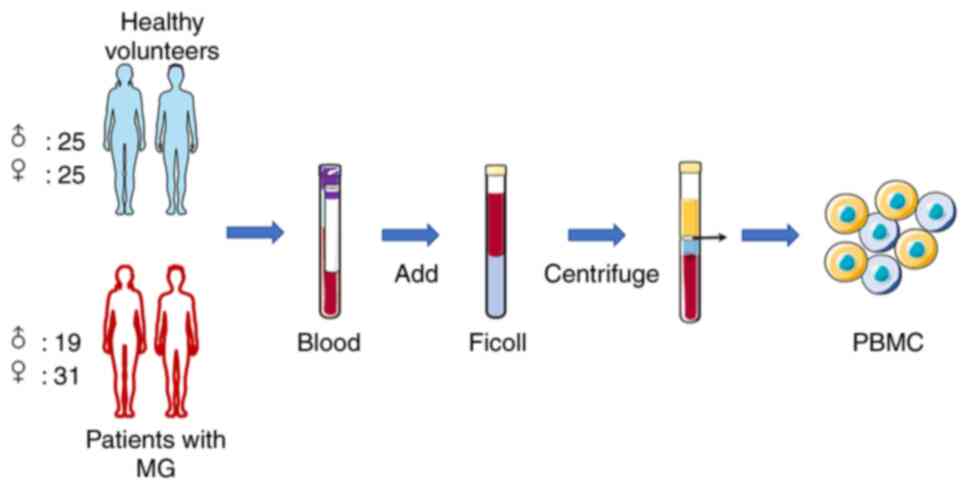
Isolation of human peripheral blood
mononuclear cells (PBMCs)
Peripheral blood samples (5 ml) were collected in an
anticoagulant tube. Within 1 h of sample collection, PBMCs were
isolated using Ficoll-Paque™ gradient (GE Healthcare). An equal
volume of phosphate buffer was added to dilute the blood sample,
which was added to the Ficoll-Paque separating solution and
centrifuged at 600 x g for 20 min at 25˚C. The samples were
separated into four layers. PBMCs were collected from the second
layer (mononuclear cells). PBMCs were washed three times with
phosphate-buffered saline and centrifuged (600 x g, 10 min, 4˚C),
and then stored at -80˚C (Fig.
1).
Total RNA extraction
Total RNA was isolated from PBMCs using
TRIzol® reagent, according to the manufacturer's
instructions (Invitrogen; Thermo Fisher Scientific, Inc.). TRIzol
reagent (1 ml) and chloroform (0.2 ml) were added to each sample
tube. The tubes were mixed for 15 sec, allowed to stand for 3 min
and centrifuged at 600 x g for 15 min at 4˚C. The upper aqueous
phase was carefully aspirated and transferred to a new tube. An
equal volume of isopropanol was added and samples were mixed at
25˚C for 20 min. The samples were centrifuged at 13,000 x g for 10
min at 4˚C to precipitate the RNA and the supernatant was removed.
The sediment was washed with 1 ml pre-cooled 75% ethanol and
centrifuged again (600 x g, 5 min, 4˚C). After discarding the
supernatant, the RNA pellet was dissolved in 30 µl diethyl
pyrocarbonate-treated water and stored at -80˚C.
RT-qPCR evaluation of target mRNA
expression in PBMCs
Total RNA was extracted from PBMCs using
TRIzol® reagent as aforementioned and
reverse-transcribed to cDNA using PrimeScript™ RT Master Mix (cat.
no. RR036Q; Takara Bio, Inc.) according to the manufacturer's
instructions. The mRNA expression levels were measured using SYBR
Green Master Mix (cat. no. RR036A; Takara Bio, Inc.) on a CFX96
Real-Time PCR System (Bio-Rad Laboratories, Inc.), according to the
manufacturer's instructions, using the following thermocycling
conditions: Initial denaturation at 95˚C for 20 sec, followed by 40
cycles of 95˚C for 10 sec, 60˚C for 30 sec and 70˚C for 1 sec. The
target gene sequences were obtained from GenBank (https://www.ncbi.nlm.nih.gov/genbank/)
and primer sequences for all target genes are listed in Table I. Relative expression was
determined using the 2-ΔΔCq method (25). GAPDH was used as the reference
gene.
 | Table IPrimers used for reverse
transcription-quantitative PCR. |
Table I
Primers used for reverse
transcription-quantitative PCR.
| Gene | Forward primer,
5'-3' | Reverse primer,
5'-3' |
|---|
| Mfn1 |
ATGTAACGGACGCCAATC |
ATCTTTAGCTTCTACTCCCACT |
| Mfn2 |
TGCAGGTGTAAGGGACGATT |
GAGGCTCTGCAAATGGGATG |
| Opa1 |
TGTCCTCCGCAAAGTCAT |
TGCTTGGGAGACCCTACA |
| Drp1 |
CAAAGCAGTTTGCCTGTGGA |
TCTTGGAGGACTATGGCAGC |
| Fis1 |
CCAGGTAGAAGACGTAATCCC |
GTCCAAGAGCACGCAGTTT |
| AMPK |
TTGAAACCTGAAAATGTCCTGCT |
GGTGAGCCACAACTTGTTCTT |
| PGC-1α |
TCAGTCCTCACTGGTGGACA |
TGCTTCGTCGTCAAAAACAG |
| NRF-1 |
GGTGCAGCACCTTTGGAGAA |
CCAGAGCAGACTCCAGGTCTTC |
| TFAM |
CACATTTTCCACCTGGTGAT |
CACTCCGCCCTATAAGCATC |
| GAPDH |
AAGAAGGTGGTGAAGCAGG |
GTCAAAGGTGGAGGAGTGG |
Western blotting evaluation of protein
expression in PBMCs
PBMCs were lysed on ice with RIPA lysis buffer (cat.
no. 78510; Thermo Fisher Scientific, Inc.) and centrifuged at
13,000 x g for 15 min at 4˚C, and then supernatant was collected.
Protein concentration was determined using the bicinchoninic acid
method. An equal amount (30 µg, 20 µl) of protein was loaded/lane
and samples were separated by 12% sodium dodecyl
sulfate-polyacrylamide gel electrophoresis. Samples were
transferred onto polyvinylidene difluoride membranes using a
Trans-Blot Turbo Transfer System (Bio-Rad Laboratories, Inc.) and
blocked at 25˚C with 5% non-fat powdered milk for 1.5 h. The
membranes were incubated overnight at 4˚C with the following
primary antibodies (all Abcam): Anti-Mfn1 (cat. no. ab129154;
rabbit; 1:2,000 in 5% non-fat dry milk), anti-Mfn2 (cat. no.
ab124773; rabbit; 1:1,000 in 5% non-fat dry milk), anti-Opa1 (cat.
no. ab42364; rabbit; 1:2,000 in 5% BSA), anti-Drp1 (cat. no.
ab219596; rabbit; 1:2,000 in 5% BSA), anti-Fis1 (cat. no. ab229969;
rabbit; 1:200 in 5% non-fat dry milk), anti-AMPK (cat. no. ab80039;
mouse; 1:1,000 in 5% non-fat dry milk), anti-phosphorylated-AMPK
(cat. no. ab133448; rabbit; 1:1,000 in 5% non-fat dry milk),
anti-PGC-1α (cat. no. ab54481; rabbit; 1:1,000 in 5% non-fat dry
milk), anti-NRF-1 (cat. no. ab34682; rabbit; 1:1,000 in 5% non-fat
dry milk), anti-TFAM (cat. no. ab176558; rabbit; 1:1,000 in 5%
non-fat dry milk) and anti-GAPDH (cat. no. ab8245; mouse; 1:5,000
in 5% non-fat dry milk). The membranes were then incubated with
goat anti-rabbit (cat. no. ab7085; 1:3,000 in 5% non-fat dry milk)
or goat anti-mouse (cat. no. ab7063; 1:3,000 in 5% non-fat dry
milk) secondary antibodies for 90 min at 25˚C, then washed three
times for 5 min each using Tris-buffered saline and polysorbate 20
(Beijing Solarbio Science & Technology Co., Ltd.). Protein
bands were visualized using Clarity™ Western ECL Substrate kit
(Bio-Rad Laboratories, Inc.). The chemiluminescent signal was
captured using a ChemiDoc™XRS+ system and resulting bands were
analyzed using Image Lab software version 3.0 (both Bio-Rad
Laboratories, Inc.).
Statistical analysis
The sensitivity and specificity of variables for MG
diagnosis were determined by ROC curve analysis using a
non-parametric approach. The optimal cutoff values were selected
based on those that minimized the sensitivity-specificity
difference and maximized the discriminating power of the tests. All
data were repeated three times and analyzed using SPSS 22.0 (IBM
Corp.) and are expressed as the mean ± standard deviation. Unpaired
t-test was used to compare differences between control and MG.
P<0.05 was considered to indicate a statistically significant
difference.
Results
Participant information
A total of 50 healthy volunteers (25 males and 25
females; mean age, 38.92±14.76 years) were recruited for the
control group and 50 patients with MG (19 males and 31 females;
mean age, 42.58±13.76 years) were recruited for the MG group. The
clinical characteristics of participants are listed in Table II (raw data are shown in Table SI). A higher number of women than
men were affected by MG, which was consistent with clinical reports
(26,27), and 66% of patients with MG were
aged 30-60 years. According to Table
II, the proportion of MG patients with a disease span of 0-6
years was 88%. The patients exhibited dysphagia, chewing weakness,
thymectomy and thyroid dysfunction (Table II). The hematology results of the
patients with MG are shown in Table
III. Routine blood examination values were all within normal
ranges. The results provide comprehensive information on the
participants.
| Table IIClinical characteristics of patients
and controls. |
Table II
Clinical characteristics of patients
and controls.
| Characteristic | MG (n=50) | Control (n=50) |
|---|
| Sex | | |
|
Male | 19 | 25 |
|
Female | 31 | 25 |
| Age, years | | |
|
14-29 | 9 | 23 |
|
30-44 | 20 | 6 |
|
45-59 | 16 | 17 |
|
≥60 | 5 | 4 |
| Course of disease,
months | | |
|
0-36 | 36 | - |
|
37-72 | 8 | - |
|
73-108 | 4 | - |
|
>108 | 2 | - |
| Symptom (+) | | - |
|
Neostigmine | 50 | - |
|
AchR-Ab | 44 | - |
|
MuSK-Ab | 30 | |
| Dysphagia | 25 | - |
| Chewing
weakness | 11 | - |
| Thymectomy | 28 | - |
| Thyroid
dysfunction | 10 | - |
| Table IIIHematology results of patients with
myasthenia gravis (mean ± SD, n=50). |
Table III
Hematology results of patients with
myasthenia gravis (mean ± SD, n=50).
| Variable | Male (n=19) | Normal male
range | Female (n=31) | Normal female
range |
|---|
| WBC,
103/µl | 8.59±4.63 | 4.0-10.0 | 9.94±3.13 | 4.0-10.0 |
| RBC,
106/µl | 4.45±0.57 | 4.0-5.5 | 4.58±0.62 | 3.5-5.0 |
| PLT,
103/µl | 227.11±60.22 | 100.0-300.0 | 229.78±41.86 | 100.0-300.0 |
| Hb, g/l | 130.89±19.18 | 120.0-160.0 | 130.42±18.06 | 110.0-150.0 |
mRNA expression of Mfn1, Mfn2, Opa1,
Drp1, Fis1, AMPK, PGC-1α, NRF-1 and TFAM measured by RT-qPCR
mRNA expression levels of Mfn1, Mfn2 and Opa1 were
significantly lower in the MG than the control group (P<0.05;
Fig. 2; Table SII). By contrast, mRNA expression
of Drp1 and Fis1 was higher in the MG group than the control
(P<0.05). In addition, mRNA expression of AMPK, PGC-1α, NRF-1
and TFAM was significantly lower in the MG group than in the
control (P<0.05). The results of 6 MG patients who were
anti-AChR-negative are shown in Table
SIII. According to the comparison of the results, there were
differences in mRNA expression between control group and MG group
patients (including antibody-negative patients).
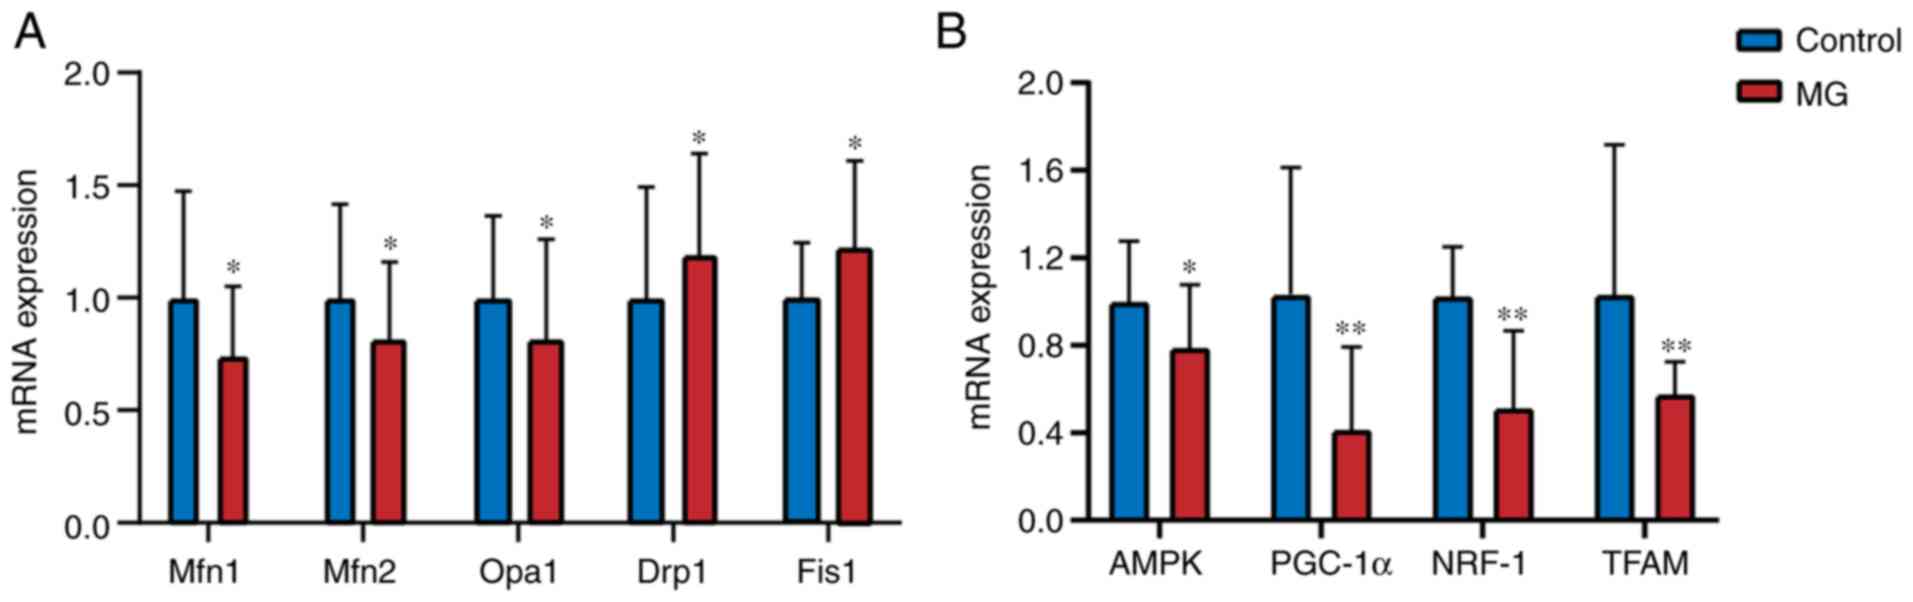 | Figure 2mRNA expression levels of
mitochondrial fusion/fission-associated genes in peripheral blood
mononuclear cells. (A) Mfn1/2, Opa 1, Fis 1, Drp 1, (B) AMPK,
PGC-1α, NRF-1 and TFAM, mRNA expression levels in control and MG
group. Data are presented as the mean ± SD. *P<0.05,
**P<0.01 vs. control. Mfn, mitofusion; Opa, optic
atrophy; Drp, dynamin-related protein; Fis, fission; AMPK,
AMP-activated protein kinase; PGC, peroxisome
proliferator-activated receptor-γ co-activator; NRF, nuclear
respiratory factor; TFAM, mitochondrial transcription factor A. |
Diagnostic value of Mfn1, Mfn2, Opa1,
Drp1, Fis1, AMPK, PGC-1α, NRF-1 and TFAM
To determine whether mitochondria-associated genes
serve as diagnostic biomarkers for MG, ROC curves were plotted
using RT-qPCR data (Fig. 3). In
ROC curve analysis (28), the area
under the curve (AUC) quantifies the diagnostic potential of each
candidate biomarker with a high AUC indicating a more accurate
distinction between patients with MG and controls. AUCs were 0.8628
for PGC-1α, 0.8696 for NRF-1, 0.8072 for TFAM, 0.6488 for Mfn1,
0.6441 for Mfn2, 0.6212 for Opa1, 0.6468 for Drp1, 0.6604 for Fis1
and 0.5408 for AMPK (Fig. 3A-I).
The results showed that mitochondrial energy metabolism (as
measured by PCG-1α, NRF-1 and TFAM) had higher diagnostic value for
MG.
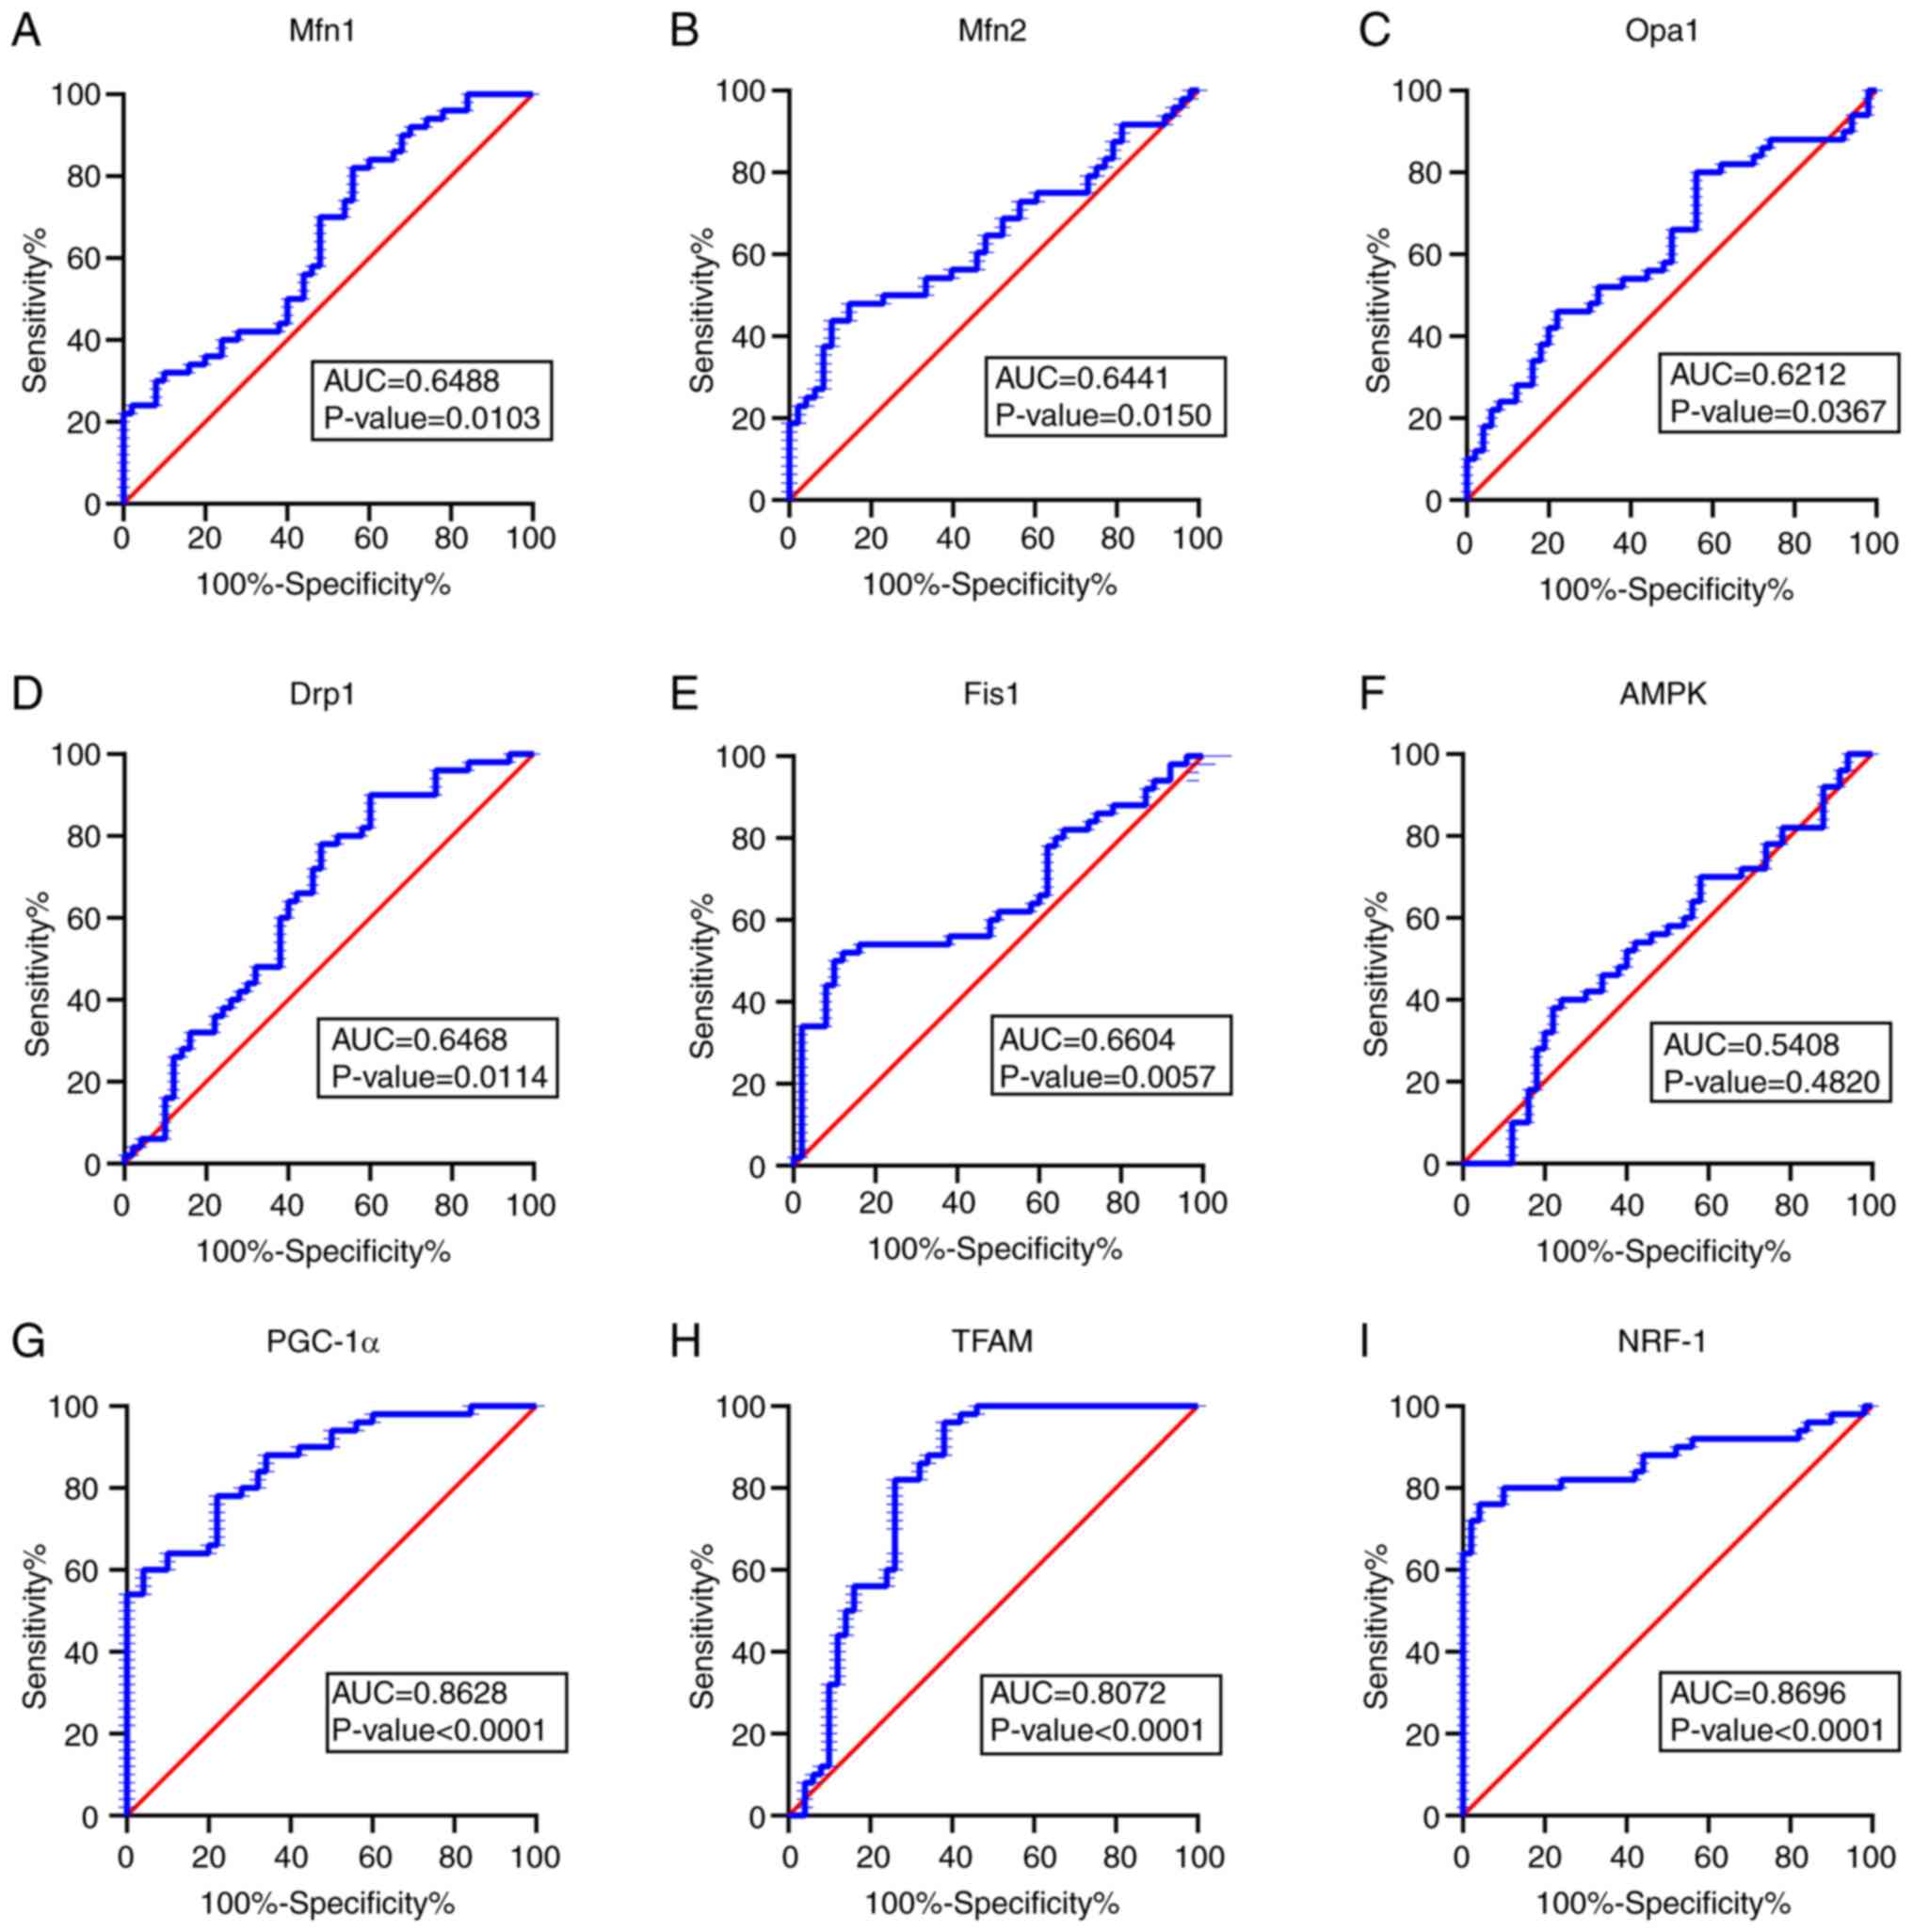 | Figure 3Receiver operating characteristic
curves for mitochondrial dynamics- and biogenesis-associated mRNAs.
AUC of (A) Mfn 1 is 0.6488, of (B) Mfn 2 is 0.6441, of (C) Opa 1 is
0.6212, of (D) Drp 1 is 0.6468, of (E) Fis 1 is 0.6604, of (F) AMPK
is 0.5408, of (G) PGC-1α is 0.8628, of (Η) TFAM is 0.8072 and of
(I) NRF-1 is 0.8696. Analysis based on the reverse
transcription-quantitative PCR results in mRNAs plotted as
sensitivity versus specificity. AUC>0.5 was considered
significant. AUC, area under the curve; Mfn, mitofusion; Opa, optic
atrophy; Drp, dynamin-related protein; Fis, fission; AMPK,
AMP-activated protein kinase; PGC, peroxisome
proliferator-activated receptor-γ co-activator; NRF, nuclear
respiratory factor; TFAM, mitochondrial transcription factor A. |
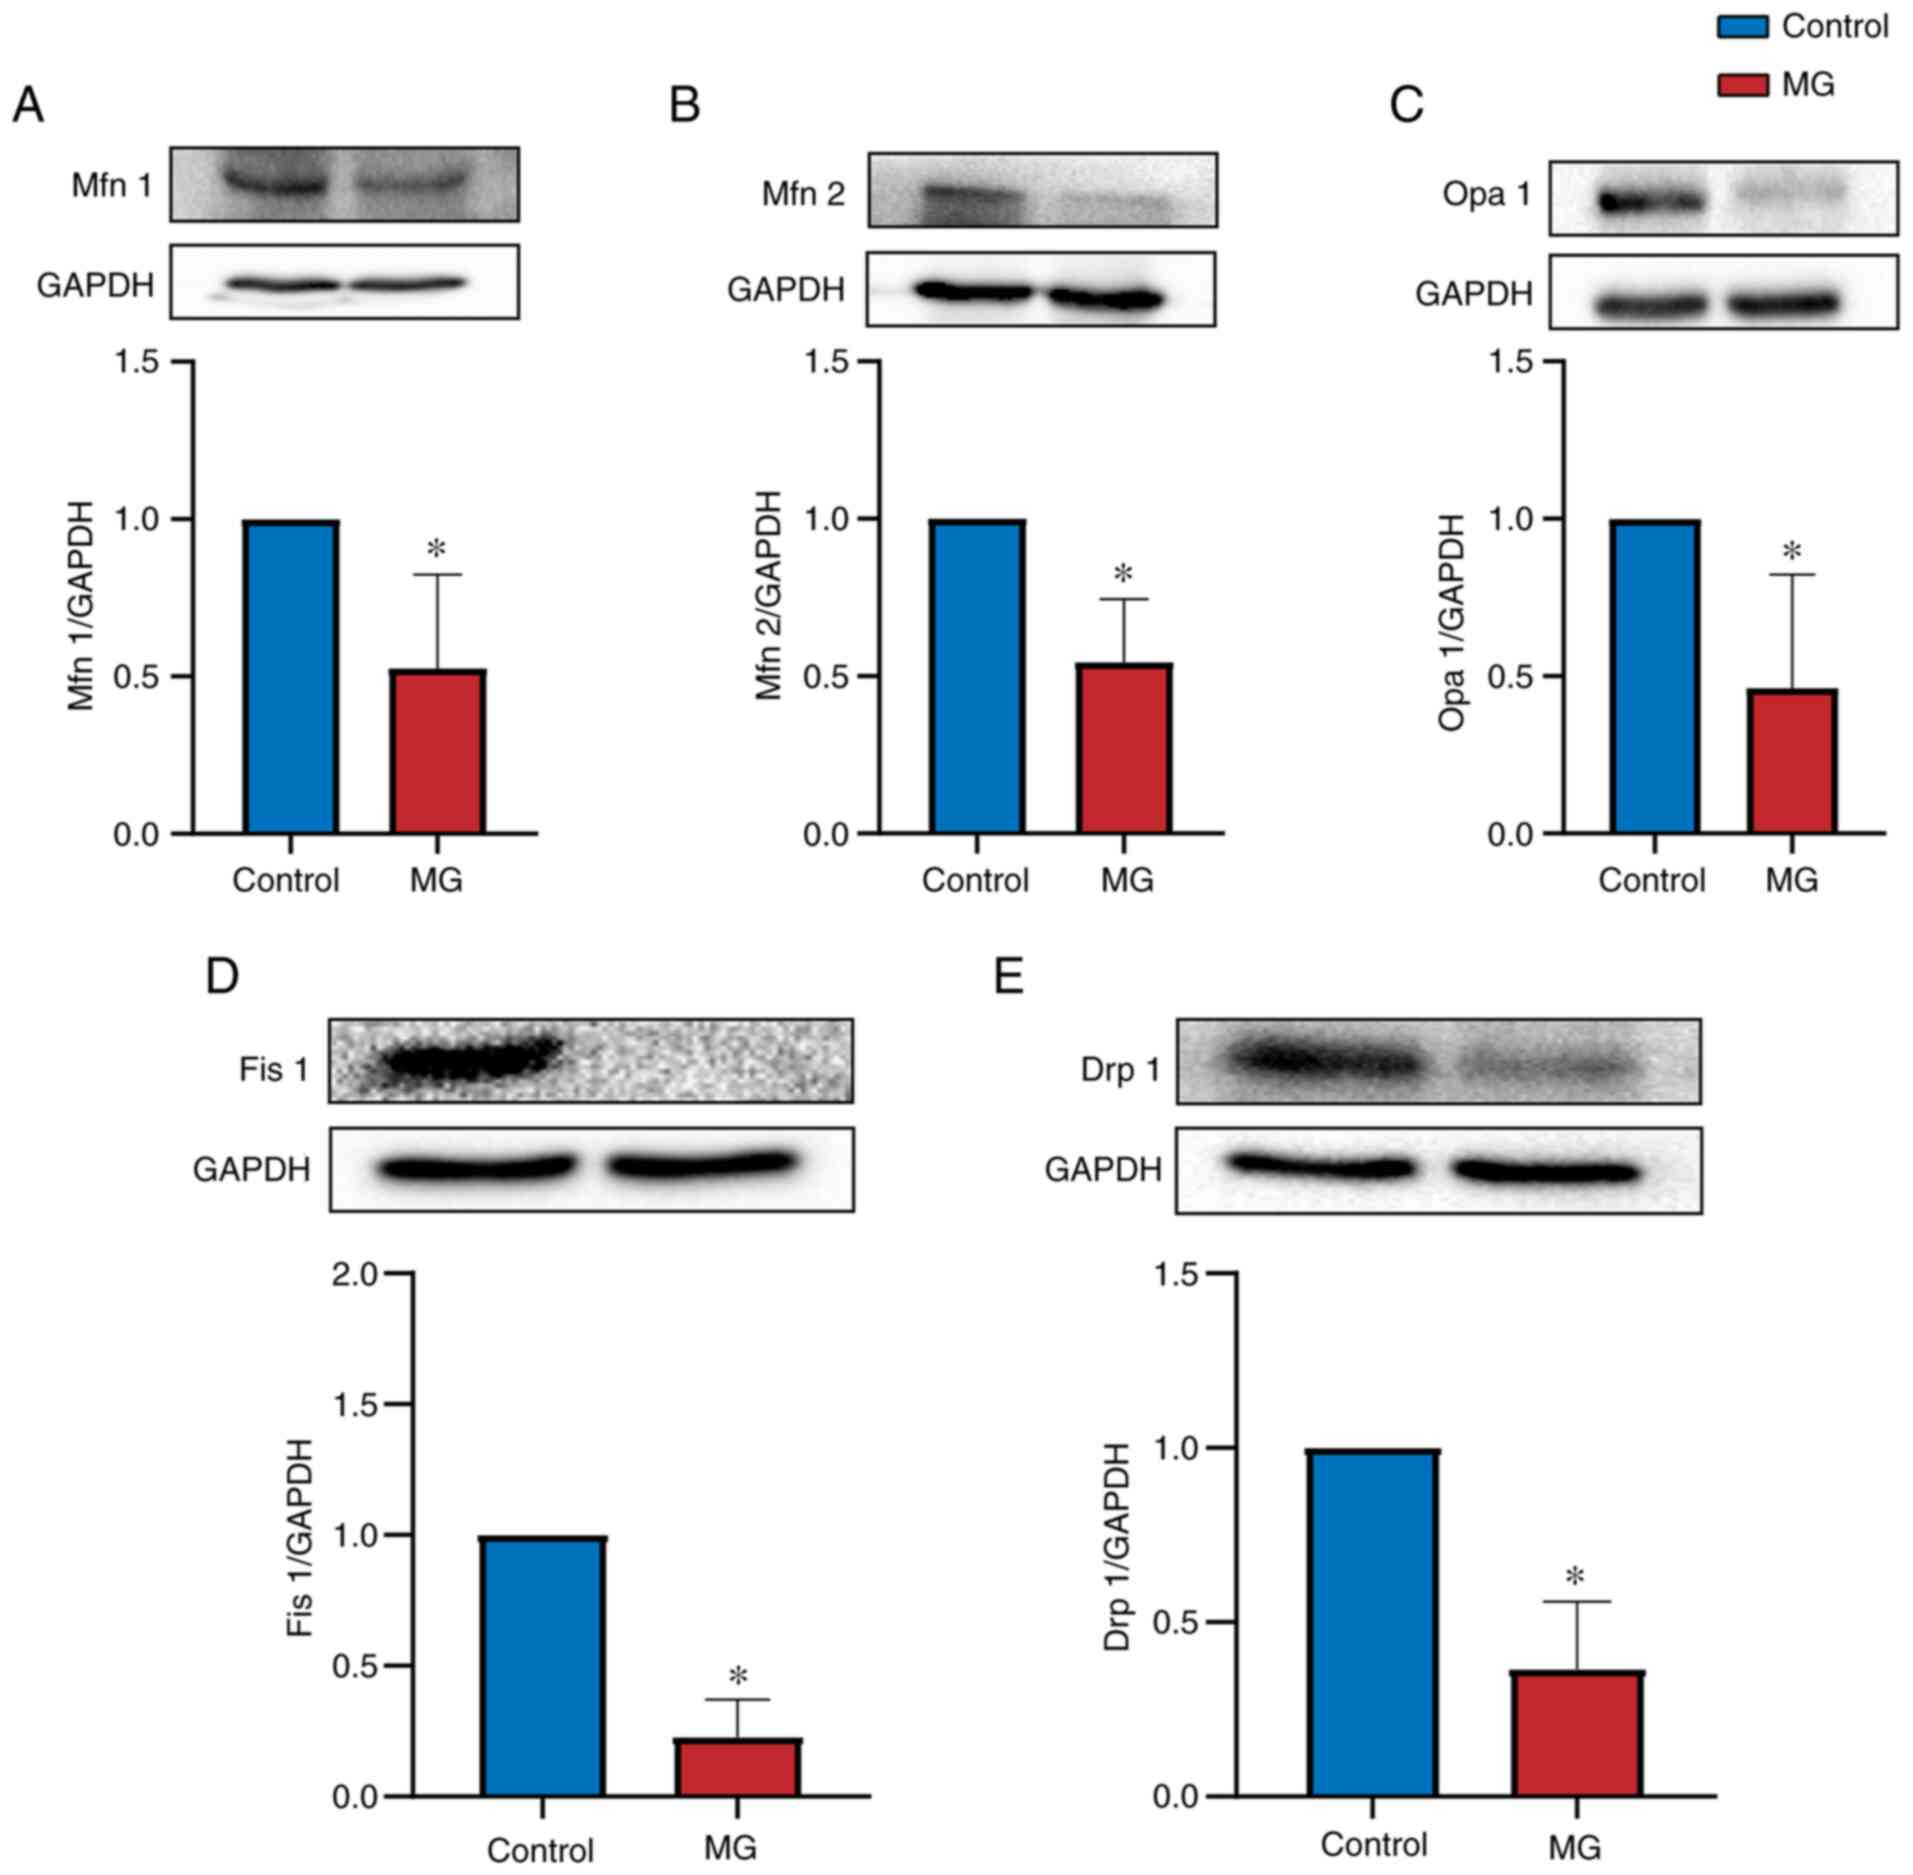
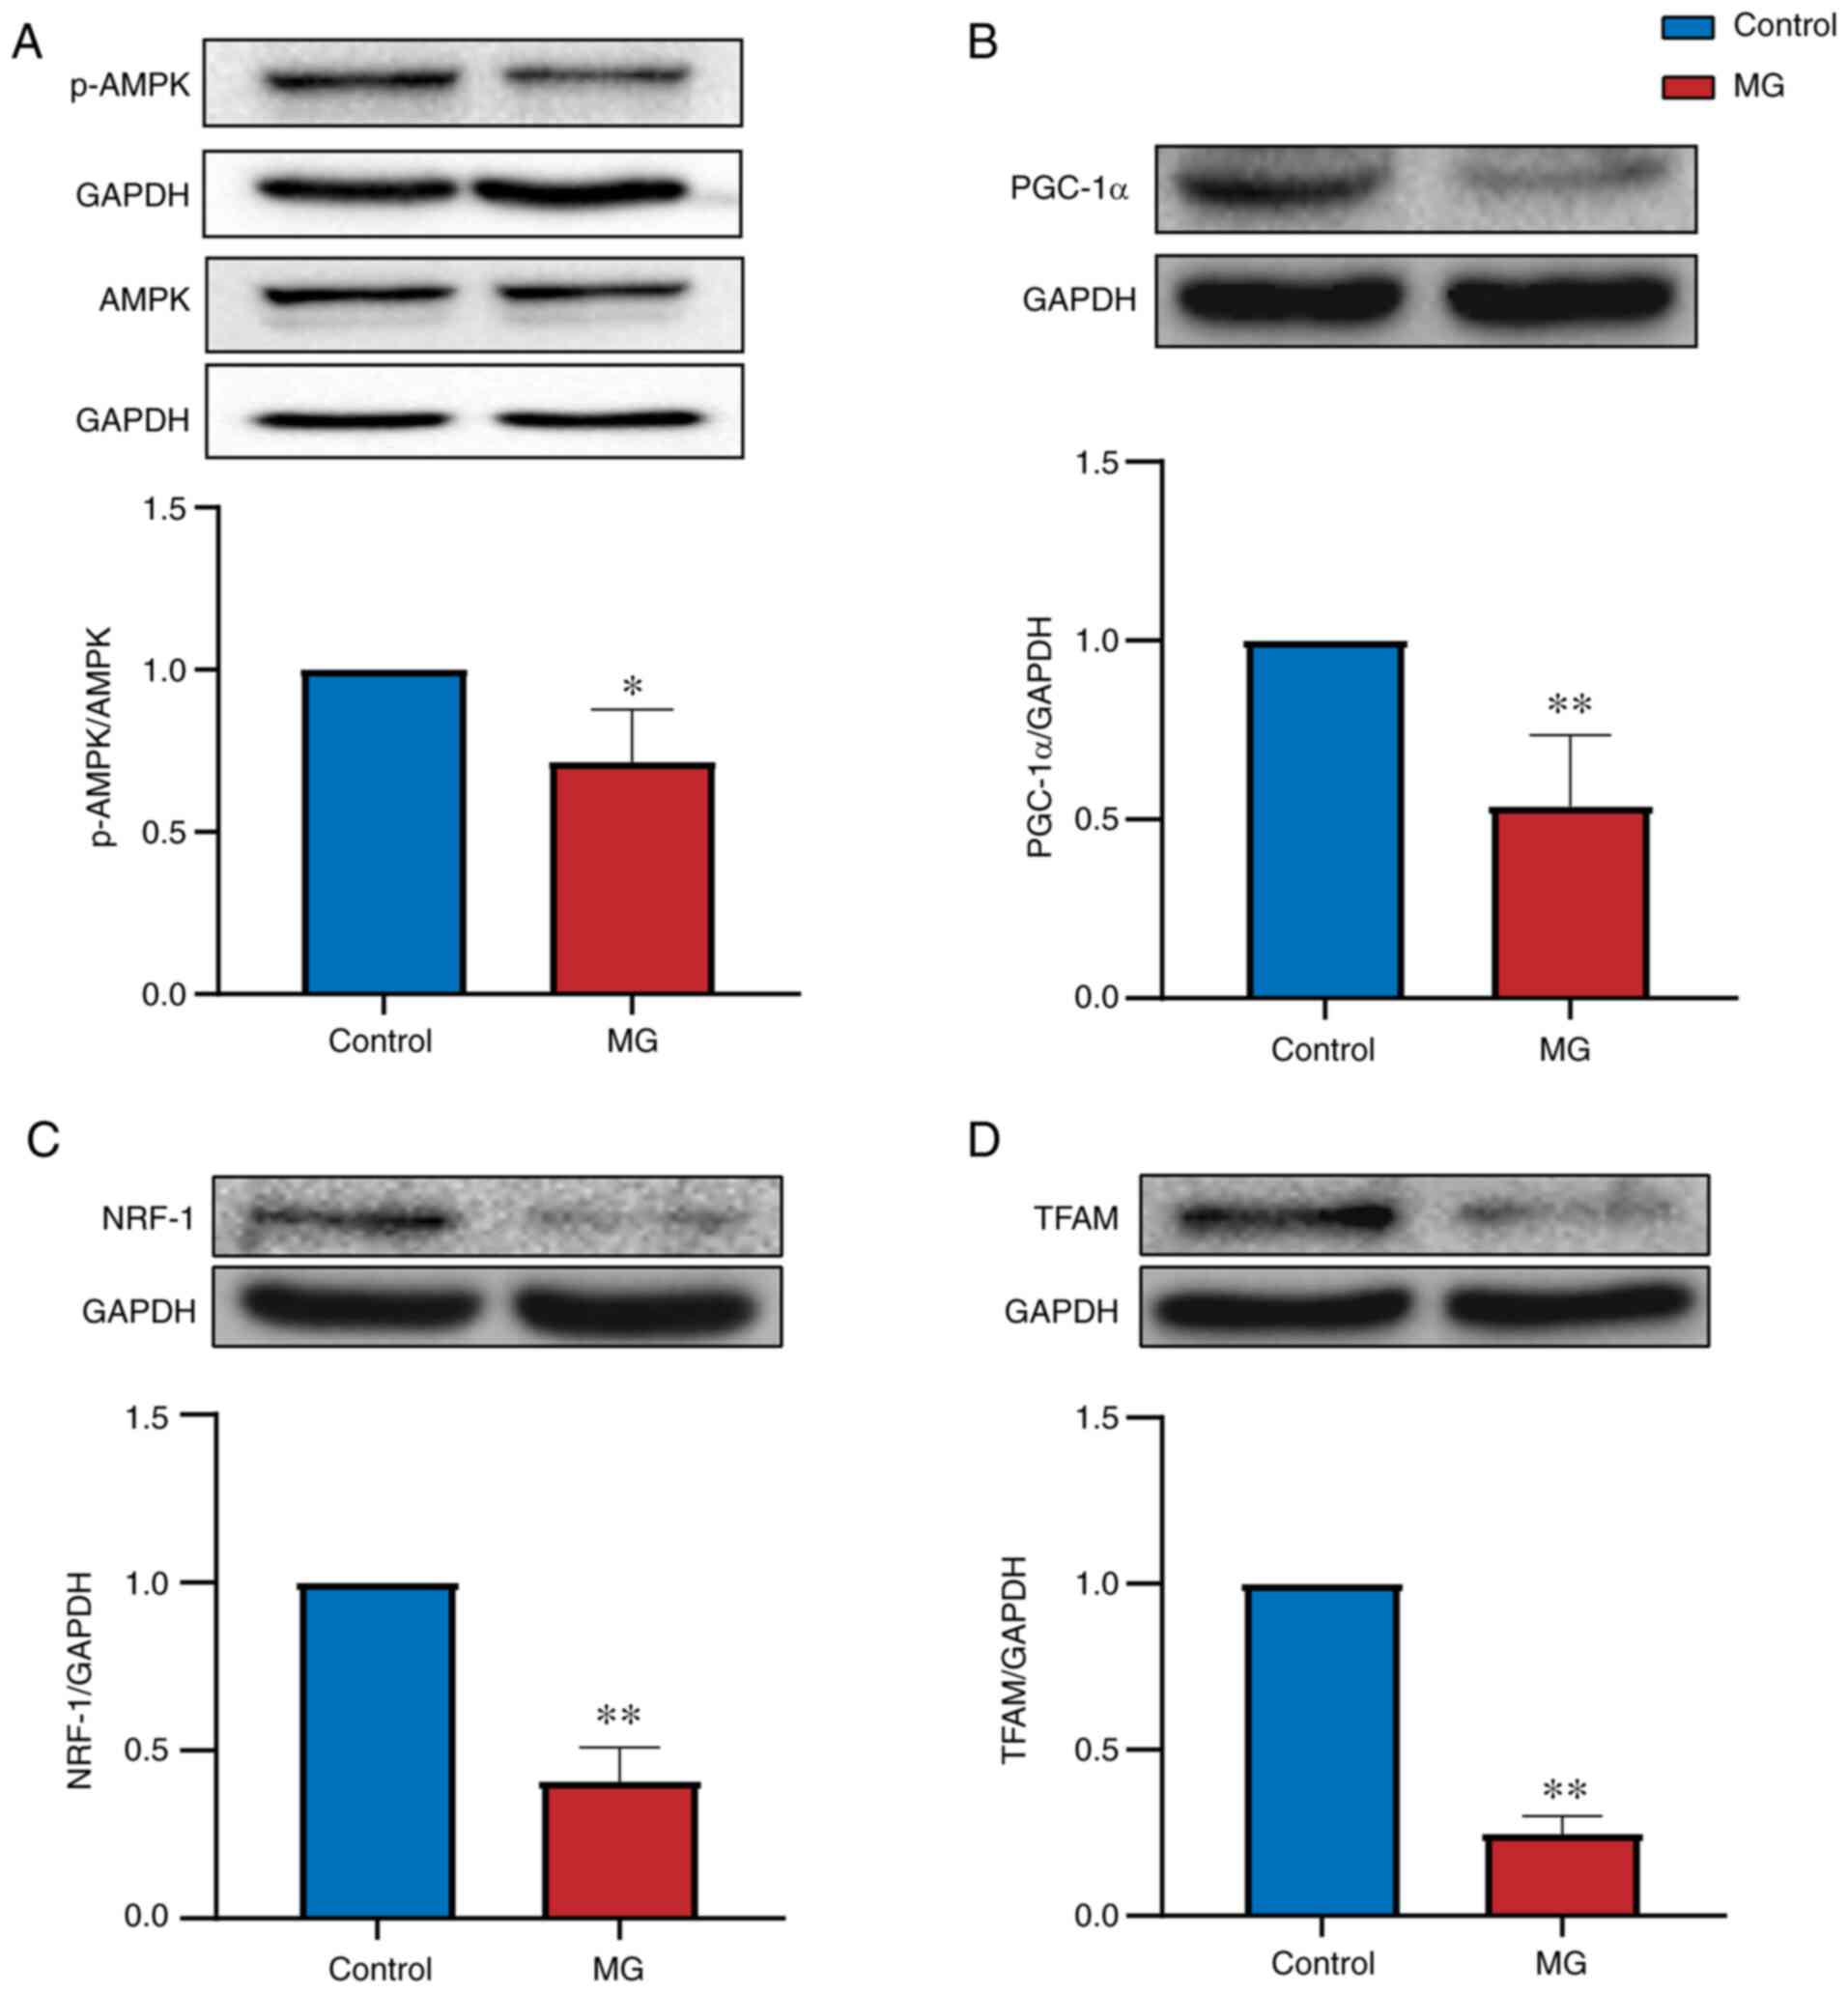
Evaluation of Mfn1, Mfn2, Opa1, Drp1,
Fis1, AMPK, PGC-1α, NRF-1 and TFAM expression by western
blotting
Western blotting was performed to determine whether
proteins were differentially expressed between control and MG
groups. Mitochondrial dynamics-associated proteins (Mfn1, Mfn2,
Opa1, Drp1 and Fis1) were expressed at significantly lower levels
in PBMCs from patients with MG than in control subjects (P<0.05;
Fig. 4). Mitochondrial
biogenesis-associated proteins (AMPK, PGC-1α, NRF-1 and TFAM) were
also expressed at lower levels in patients with MG than in control
subjects (P<0.05; Fig. 5). The
results indicate that these mitochondrial markers may have
diagnostic value for MG.
Discussion
Mitochondria are abundantly present in skeletal
muscle fibrils, which require large amounts of ATP for contraction
and diastolic movement (29).
Mitochondria are semi-autonomous organelles that are key sites of
tricarboxylic acid cycle reactions; their normal function
determines whether skeletal muscles contract freely and flexibly
(30). The accepted mechanism of
skeletal muscle contraction (sliding filament theory) asserts that,
when stimulated by neurotransmitters and in the presence of ATP
hydrolysis, muscle myosin and actin perform muscle contraction by
sliding on muscle fibers, leading to overall macro fiber shortening
and densifying (31). Furthermore,
studies (32,33) have shown that muscle cells in
patients with MG are highly sensitive to energy deficiency, which
affects signal transduction and normal physiological activity of
the neuromuscular junction. Histopathological analysis of
extraocular muscle tissues of patients with MG has shown that
myopathic features predominantly include substitution of muscle
fibers by adipocytes and mitochondrial dysfunction at the
ultrastructural level (34).
Another study reported mitochondrial dysfunction in a patient with
early-stage muscular dystrophy; these abnormal mitochondria were
susceptible to further damage following sarcolemma injury (35). These results suggest that
mitochondrial and neuromuscular disease are associated.
Insufficient mitochondrial ATP synthesis leads to development of
muscle movement disorders and clinical MG symptoms, such as limb
weakness, eyelid ptosis, chewing weakness, dysphagia and
respiratory muscle paralysis (Fig.
6).
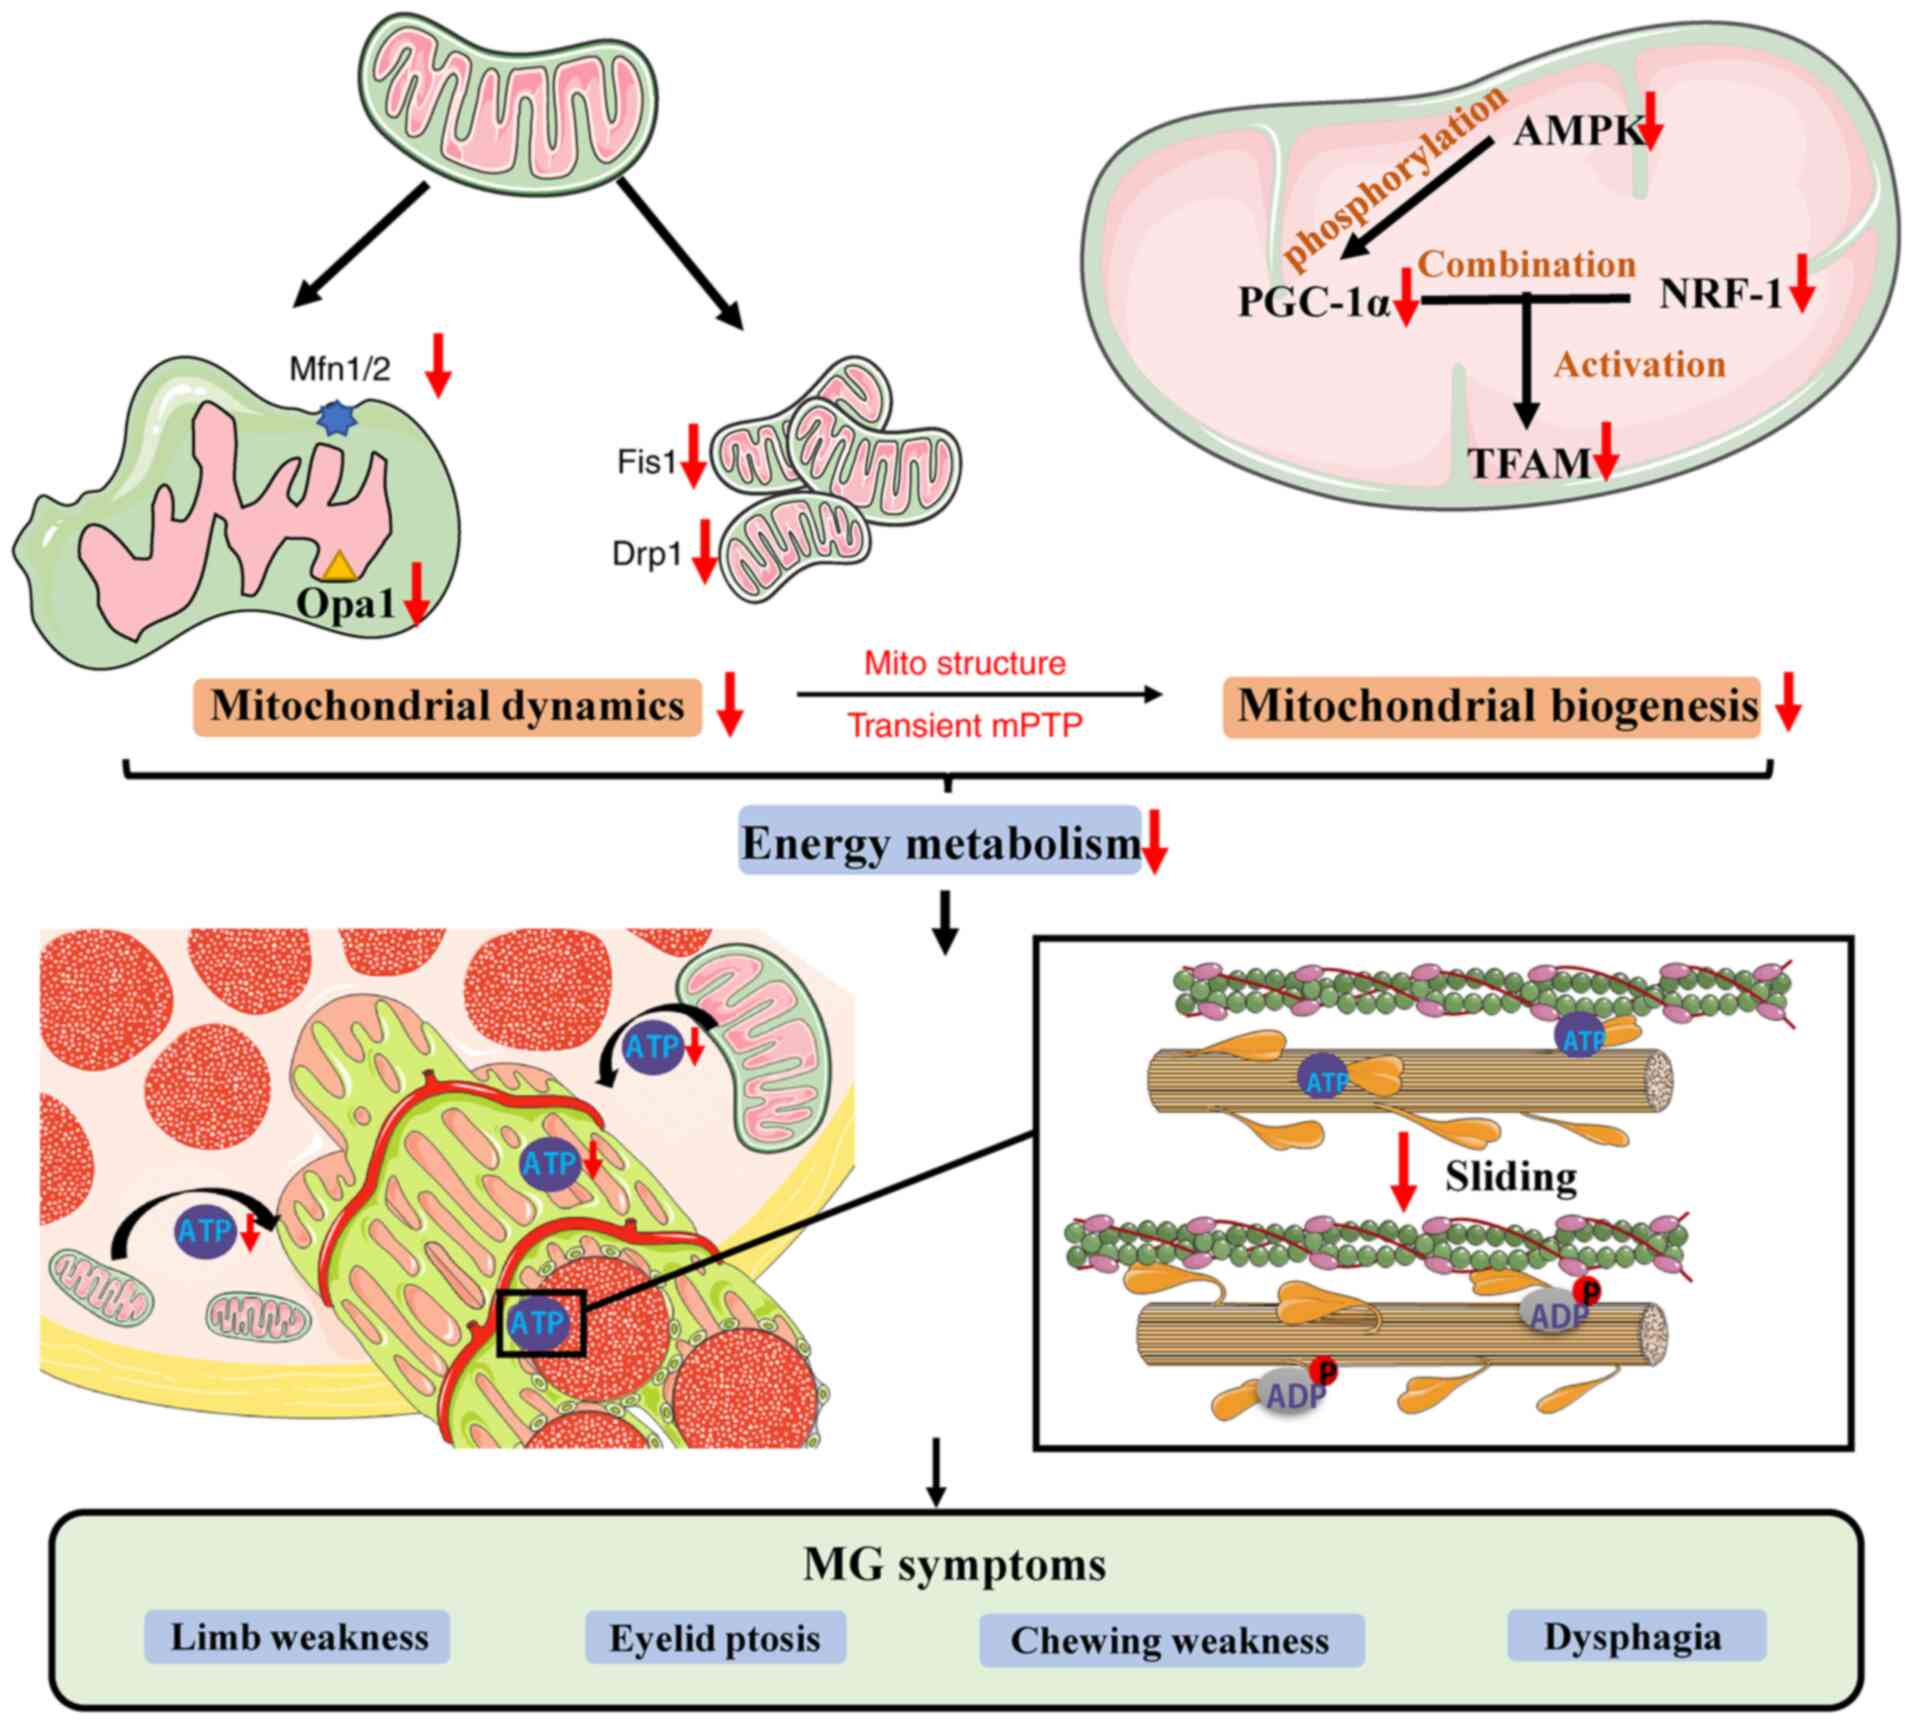 | Figure 6Schematic diagram of mitochondrial
dynamics and biogenesis associated with MG. Decreased Mfn1/2, Opa1,
Fis1 and Drp1 proteins leads to imbalance of mitochondrial fusion
and fission, affecting mitochondrial structure and regulation of
mitochondrial permeability transition pore channels. AMPK modulates
activation of PGC-1α and binding to NRF-1 to activate TFAM.
Decreased expression of these proteins decreases mitochondrial
biosynthesis, energy generation and ATP synthesis, affecting the
binding of myosin and actin and causing MG symptoms, such as limb
weakness, eyelid ptosis, chewing weakness and dysphagia. MG,
myasthenia gravis; Mfn1/2, mitofusion1/2; Opa1, optic atrophy type
1; Drp1, dynamin-related protein 1; Fis1, fission 1; AMPK,
AMP-activated protein kinase; PGC-1α, peroxisome proliferators
activated receptor γ coactivator 1α; NRF-1, nuclear respiratory
factor-1; TFAM, mitochondrial transcription factor A; mPTP,
mitochondrial permeability transition pore. |
The most common method for MG diagnosis in clinical
practice includes assessment of symptoms and signs of MG and a
positive test for specific autoantibodies (36). However, a portion of patients with
MG are not diagnosed as anti-AChR or anti-MuSK positive; thus, this
method should be complemented.
By contrast with previous studies (37,38)
on MG that have concentrated on the immune system, the present
study investigated mitochondrial dysfunction in muscles as a
potential mechanism for MG. A large number of patients were needed
to achieve reasonable results but the invasive nature of muscle
tissue sampling causes pain and imposes a psychological burden on
participants, resulting in reluctance to enroll in this type of
study. This was a limitation of the present study. However,
collecting blood samples for PBMC isolation is relatively painless,
involves a simple procedure and has high patient compliance, which
increases the feasibility of long-term research. PBMCs are used to
identify cellular dysfunction associated with the pathophysiology
of Parkinson's disease, a neurodegenerative disorder, such as
decreased proteasome activity and mitochondrial dysfunction
(39). Yalçınkaya et al
(40) reported that gene
expression analysis using PBMCs is a simple diagnostic method for
Parkinson's disease. This research provided a reference for the
present study to analyze the diagnostic value of MG by PBMCs.
Mitochondrial fission and fusion are key for
immature cell proliferation as they provide cells with an adequate
number of mature mitochondria for effective bioenergy genesis
(41). Mitochondrial fusion helps
mitochondria resist oxidative stress-induced damage (42). Studies have shown that
mitochondrial fusion and fission impairment may affect
mitochondrial function and lead to cardiomyocyte death (43,44).
In the present study, mRNA and protein levels of
fusion-associated genes Mfn1/2 and Opa1 were decreased in patients
with MG compared with control subjects. Mfn1 promotes fusion of
tethering-adjacent mitochondria in coordination with Opa1, whereas
Mfn2 acts independently. Mitochondria of cardiomyocytes in
Mfn-2-deficient mice are pleiomorphic, enlarged and exhibit
functional deterioration (15,45).
Santel et al (46) found
that the highest mRNA levels of Mfn1 and Mfn2 are present in
energy-demanding tissue, such as skeletal muscle, heart and brain,
which demonstrates the role of mitochondrial fusion in the energy
supply chain.
Fission-associated gene products include Fis1 and
Drp1. Drp1 translocates to the OMM following signaling from
cytosolic GTPase and active fission sites (45). Fis1 recruits Drp1 to the
mitochondria to regulate fission, which is associated with skeletal
muscle mass. The impairment of mitochondrial fission has been shown
to result in muscle atrophy (8,47).
These two proteins were expressed at lower levels in patients with
MG than in control subjects. However, in the present study, mRNA
expression levels of Drp1 and Fis1 were higher than expected
compared with protein levels. Fis1 was barely detected in patients
with MG, as confirmed by repeat testing. Therefore, it was
hypothesized that other factors may have influenced the translation
process to decrease protein synthesis. Untranslated regions (UTRs)
determine the fate of proteins by regulating their interactions. In
most cases, single-stranded miRNAs are not fully complementary to
the 3'-UTR of their target mRNA, thus blocking translation and
regulating gene expression. Synthetic 5'-UTR RNA structures
regulate protein translation in mammalian cells (48,49).
Circular RNAs also exhibit a potent translation regulatory function
via their sponge function (50).
These mechanisms only affect protein levels, not mRNA stability.
Further investigation is required to determine the mechanism
underlying differences in mRNA and protein expression levels.
Mitochondrial dynamics and biogenesis are
reciprocally coupled. Mitochondrial fission-associated proteins
induce opening of the mitochondrial permeability transition pore
channel, which leads to changes in mitochondrial membrane potential
and reactions in the mitochondrial respiratory chain (51), which enhance mitochondrial
biogenesis.
Mitochondrial biogenesis serves a vital role in
metabolic health and plasticity. AMPK is an energy metabolism
receptor that phosphorylates PGC-1α and activates SIRT1 by
increasing cellular NAD+ levels. Furthermore, AMPK leads
to increased expression of PGC-1α (17). SIRT1 has been shown to interact
with PGC-1α to enhance mitochondrial biogenesis (52). The overexpression of PGC-1α is an
effective therapy for age-associated muscle loss. In addition,
PGC-1α-deficient mice exhibit neurodegeneration, suggesting that
PGC-1α may be involved in the pathogenesis of neuromuscular disease
(53,54). PGC-1α interacts with NRF-1, a
member of the NRF-1 Cap'n'collar-Basic leucine zipper protein
family of nuclear transcription factors, to increase TFAM
expression and regulate mitochondrial biosynthesis. NRF-1
stimulates nuclear gene expression to promote mitochondrial
respiratory reactions. TFAM is a member of the
high-mobility-group-box domain-containing protein family that
initiates transcription of mtDNA. Conditional knockout of TFAM in
dopaminergic neurons in MitoPark mice results in decreased mtDNA
levels (55,56). Therefore, biosynthesis promotes
mitochondrial ATP synthesis and increases the number of
mitochondria to provide an energy reservoir for skeletal muscle
contraction (57,58).
Preliminary work by our group on the gastrocnemius
muscle tissue of a rat model of autoimmune MG, in which
mitochondria are vacuolated, showed that the cristae were broken,
expression levels of fusion- and fission-associated proteins were
decreased and Na+/K+-ATPase and
Ca2+/Mg2+-ATPase activity was decreased
compared with control rats (59,60).
ATPase activity was decreased to varying degrees in this rat model,
leading to a decrease in ATP synthesis and inability of muscles to
complete contraction and diastolic movement. Ke et al
(33) suggested that the
mitochondrial biogenesis signaling pathway is associated with MG,
verifying the association between MG and mitochondrial dynamics and
biogenesis.
In the present study, expression levels of
fusion-associated proteins Mfn1/2 and Opa1 and fission-associated
proteins Fis1 and Drp1 were significantly lower in patients with MG
than in control subjects. However, the mRNA expression levels of
Mfn1, Mfn2 and Opa1 decreased, while those of Fis1 and Drp1
increased in patients with MG compared with control subjects. Both
the protein and mRNA expression levels of mitochondrial
biogenesis-associated factors AMPK, PGC-1α, NRF-1 and TFAM were
decreased in PBMCs of patients with MG. Of 50 patients with MG
included in the present study, 6 patients were anti-AChR-negative.
Gene expression analysis in these patients (anti-AChR-negative)
demonstrated that mRNA expression level was consistent with the
whole sample (including anti-AChR-negative and -positive) result,
indicating that this subset of patients also have mitochondrial
energy metabolism decreased.
ROC curve analysis showed that mitochondrial
dynamics- and biogenesis-associated factors were specific and
sensitive for diagnosing MG. Excluding AMPK, AUC values of the
Mfn1/2, Opa1, Fis1, Drp1, PGC-1α, NRF-1 and TFAM were 0.6212-0.8696
(P<0.05). Furthermore, the AUC values of PGC-1α, NRF-1 and TFAM
were >0.8. A higher AUC value indicates a greater potential to
distinguish patients from controls. Thus, ROC curve analysis
indicated that these proteins may serve as promising biomarkers for
MG. However, the present study had limitations. In the absence of
clinical diagnosis, it is difficult to distinguish MG from other
types of mitochondria-associated disease based on levels of
mitochondrial indicators. In addition, the present study only
collected patients with type IIb MG and obtained AUC>0.8, but
this result is not comprehensive. The present study did not
determine the explicit mechanism that how suffering MG underlying
mitochondrial function disorder and to distinguish MG from other
types of mitochondria-associated disease. In future, the potential
diagnostic value of mitochondria-associated indicators in MG should
be further researched.
In conclusion, expression levels of mitochondrial
dynamics- and biogenesis-associated factors in PBMCs were
significantly different between patients with MG and control
subjects. These factors may serve as potential diagnostic
biomarkers for MG.
Supplementary Material
Row datas of clinical
characteristics.
mRNA expression levels in patients
with anti-AChR-negative MG and healthy controls.
The comparisons among the mRNA
expression levels between patients with MG (including 6
AChR-Ab-negative patients) and the control group.
Acknowledgements
Not applicable.
Funding
Funding: The present study was supported by National Natural
Science Foundation of China (grant no. 81473568).
Availability of data and materials
The datasets used and/or analyzed during the current
study are available from the corresponding author on reasonable
request.
Authors' contributions
YS conceived and designed the experiments. LL, DC
and HZ performed most of experiments and drafted the manuscript.
JLiang, AJ and FL performed the formal analysis and interpretation
of data. YS provided funding and gave final approval of the version
to be published. JLi, ZC, QJ and PL carried out part of the PCR
experiments and collected all clinical data. JS and WJ performed
isolation of PBMCs and revised the manuscript from a critical
perspective for important intellectual content. QL and LK performed
the statistical analysis, confirmed the authenticity of all the raw
data and gave final approval of the version to be published. JS and
WJ agreed to be accountable for all aspects of the work in ensuring
that questions related to the accuracy or integrity of any part of
the work are appropriately investigated and resolved. All authors
have read and approved the final manuscript.
Ethics approval and consent to
participate
All participants understood the experimental
procedure and provided written informed consent. Written informed
consent was obtained from parents/guardians of all participants
<18 years old. All procedures involving human subjects were
approved by the Academic Ethics Committee of The First Affiliated
Hospital of Guangzhou University of Chinese Medicine [approval no.
ZYYZCK(2018)075].
Patient consent for publication
Not applicable.
Competing interests
The authors declare that they have no competing
interests.
References
|
1
|
Binks S, Vincent A and Palace J:
Myasthenia gravis: A clinical-immunological update. J Neurol.
263:826–834. 2016.PubMed/NCBI View Article : Google Scholar
|
|
2
|
Berrih-Aknin S, Frenkian-Cuvelier M and
Eymard B: Diagnostic and clinical classification of autoimmune
myasthenia gravis. J Autoimmun. 48-49:143–148. 2014.PubMed/NCBI View Article : Google Scholar
|
|
3
|
Hehir MK and Silvestri NJ: Generalized
myasthenia gravis: Classification, clinical presentation, natural
history, and epidemiology. Neurol Clin. 36:253–260. 2018.PubMed/NCBI View Article : Google Scholar
|
|
4
|
Sieb JP: Myasthenia gravis: An update for
the clinician. Clin Exp Immunol. 175:408–418. 2014.PubMed/NCBI View Article : Google Scholar
|
|
5
|
Szczudlik P, Sobieszczuk E, Szyluk B,
Lipowska M, Kubiszewska J and Kostera-Pruszczyk A: Determinants of
quality of life in myasthenia gravis patients. Front Neurol.
11(553626)2020.PubMed/NCBI View Article : Google Scholar
|
|
6
|
Mantegazza R and Cavalcante P: Diagnosis
and treatment of myasthenia gravis. Curr Opin Rheumatol.
31:623–633. 2019.PubMed/NCBI View Article : Google Scholar
|
|
7
|
Bastian TW, von Hohenberg WC, Georgieff MK
and Lanier LM: Chronic energy depletion due to iron deficiency
impairs dendritic mitochondrial motility during hippocampal neuron
development. J Neurosci. 39:802–813. 2019.PubMed/NCBI View Article : Google Scholar
|
|
8
|
Romanello V and Sandri M: Mitochondrial
quality control and muscle mass maintenance. Front Physiol.
6(422)2016.PubMed/NCBI View Article : Google Scholar
|
|
9
|
Meyer JN, Leuthner TC and Luz AL:
Mitochondrial fusion, fission, and mitochondrial toxicity.
Toxicology. 391:42–53. 2017.PubMed/NCBI View Article : Google Scholar
|
|
10
|
Fix DK, Hardee JP, Gao S, VanderVeen BN,
Velázquez KT and Carson JA: Role of gp130 in basal and
exercise-trained skeletal muscle mitochondrial quality control. J
Appl Physiol (1985). 124:1456–1470. 2018.PubMed/NCBI View Article : Google Scholar
|
|
11
|
Forrester SJ, Preston KJ, Cooper HA, Boyer
MJ, Escoto KM, Poltronetti AJ, Elliott KJ, Kuroda R, Miyao M,
Sesaki H, et al: Mitochondrial fission mediates endothelial
inflammation. Hypertension. 76:267–276. 2020.PubMed/NCBI View Article : Google Scholar
|
|
12
|
Chiong M, Cartes-Saavedra B,
Norambuena-Soto I, Mondaca-Ruff D, Morales PE, García-Miguel M and
Mellado R: Mitochondrial metabolism and the control of vascular
smooth muscle cell proliferation. Front Cell Dev Biol.
2(72)2014.PubMed/NCBI View Article : Google Scholar
|
|
13
|
Hu L, Ding M, Tang D, Gao E, Li C, Wang K,
Qi B, Qiu J, Zhao H, Chang P, et al: Targeting mitochondrial
dynamics by regulating Mfn2 for therapeutic intervention in
diabetic cardiomyopathy. Theranostics. 9:3687–3706. 2019.PubMed/NCBI View Article : Google Scholar
|
|
14
|
Gao Q, Wang XM, Ye HW, Yu Y, Kang PF, Wang
HJ, Guan SD and Li ZH: Changes in the expression of cardiac
mitofusin-2 in different stages of diabetes in rats. Mol Med Rep.
6:811–814. 2012.PubMed/NCBI View Article : Google Scholar
|
|
15
|
Li Y and Liu X: Novel insights into the
role of mitochondrial fusion and fission in cardiomyocyte apoptosis
induced by ischemia/reperfusion. J Cell Physiol. 233:5589–5597.
2018.PubMed/NCBI View Article : Google Scholar
|
|
16
|
Zhang M, Wu J, Sun R, Tao X, Wang X, Kang
Q, Wang H, Zhang L, Liu P, Zhang J, et al: SIRT5 deficiency
suppresses mitochondrial ATP production and promotes AMPK
activation in response to energy stress. PLoS One.
14(e0211796)2019.PubMed/NCBI View Article : Google Scholar
|
|
17
|
Wen JJ, Cummins CB, Szczesny B and
Radhakrishnan RS: Cardiac dysfunction after burn injury: Role of
the AMPK-SIRT1-PGC1α-NFE2L2-ARE Pathway. J Am Coll Surg.
230:562–571. 2020.PubMed/NCBI View Article : Google Scholar
|
|
18
|
Lv J, Bhatia M and Wang X: Roles of
mitochondrial DNA in energy metabolism. Adv Exp Med Biol.
1038:71–83. 2017.PubMed/NCBI View Article : Google Scholar
|
|
19
|
Zhao Q, Tian Z, Zhou G, Niu Q, Chen J, Li
P, Dong L, Xia T, Zhang S and Wang A: SIRT1-dependent mitochondrial
biogenesis supports therapeutic effects of resveratrol against
neurodevelopment damage by fluoride. Theranostics. 10:4822–4838.
2020.PubMed/NCBI View Article : Google Scholar
|
|
20
|
Araujo BG, Souza E, Silva LF, de Barros
Torresi JL, Siena A, Valerio BCO, Brito MD and Rosenstock TR:
Decreased mitochondrial function, biogenesis, and degradation in
peripheral blood mononuclear cells from amyotrophic lateral
sclerosis patients as a potential tool for biomarker research. Mol
Neurobiol. 57:5084–5102. 2020.PubMed/NCBI View Article : Google Scholar
|
|
21
|
Santacatterina F, Chamorro M, de Arenas
CN, Navarro C, Martín MA, Cuezva JM and Sánchez-Aragó M:
Quantitative analysis of proteins of metabolism by reverse phase
protein microarrays identifies potential biomarkers of rare
neuromuscular diseases. J Transl Med. 13(65)2015.PubMed/NCBI View Article : Google Scholar
|
|
22
|
Oh KH, Sheoran S, Richmond JE and Kim H:
Alcohol induces mitochondrial fragmentation and stress responses to
maintain normal muscle function in Caenorhabditis elegans.
FASEB J. 34:8204–8216. 2020.PubMed/NCBI View Article : Google Scholar
|
|
23
|
Sligar J, Debruin DA, Saner NJ, Philp AM
and Philp A: The importance of mitochondrial quality control for
maintaining skeletal muscle function across healthspan. Am J
Physiol Cell Physiol: Feb 2, 2022 (Epub ahead of print). doi:
10.1152/ajpcell.00388.2021.
|
|
24
|
Sanders DB, Wolfe GI, Benatar M, Evoli A,
Gilhus NE, Illa I, Kuntz N, Massey JM, Melms A, Murai H, et al:
International consensus guidance for management of myasthenia
gravis: Executive summary. Neurology. 87:419–425. 2016.PubMed/NCBI View Article : Google Scholar
|
|
25
|
Livak KJ and Schmittgen TD: Analysis of
relative gene expression data using real-time quantitative PCR and
the 2(-Delta Delta C(T)) method. Methods. 25:402–408.
2001.PubMed/NCBI View Article : Google Scholar
|
|
26
|
Anil R, Kumar A, Alaparthi S, Sharma A,
Nye JL, Roy B, O'Connor KC and Nowak RJ: Exploring outcomes and
characteristics of myasthenia gravis: Rationale, aims and design of
registry-The EXPLORE-MG registry. J Neurol Sci.
414(116830)2020.PubMed/NCBI View Article : Google Scholar
|
|
27
|
Park JS, Eah KY and Park JM:
Epidemiological profile of myasthenia gravis in South Korea using
the national health insurance database. Acta Neurol Scand: Feb 9,
2022 (Epub ahead of print). doi: 10.1111/ane.13596.
|
|
28
|
Zou M, Liu Z, Zhang XS and Wang Y:
NCC-AUC: An AUC optimization method to identify multi-biomarker
panel for cancer prognosis from genomic and clinical data.
Bioinformatics. 31:3330–3338. 2015.PubMed/NCBI View Article : Google Scholar
|
|
29
|
Zhang S, Ding JH, Zhou F, Wang ZY, Zhou XQ
and Hu G: Iptakalim ameliorates MPP + -induced astrocyte
mitochondrial dysfunction by increasing mitochondrial complex
activity besides opening mitoK(ATP) channels. J Neurosci Res.
87:1230–1239. 2009.PubMed/NCBI View Article : Google Scholar
|
|
30
|
Shally A and McDonagh B: The redox
environment and mitochondrial dysfunction in age-related skeletal
muscle atrophy. Biogerontology. 21:461–473. 2020.PubMed/NCBI View Article : Google Scholar
|
|
31
|
Powers JD, Malingen SA, Regnier M and
Daniel TL: The sliding filament theory since Andrew Huxley:
Multiscale and multidisciplinary muscle research. Annu Rev Biophys.
50:373–400. 2021.PubMed/NCBI View Article : Google Scholar
|
|
32
|
Ruiter AM, Verschuuren JJGM and Tannemaat
MR: Fatigue in patients with myasthenia gravis. A systematic review
of the literature. Neuromuscul Disord. 30:631–639. 2020.PubMed/NCBI View Article : Google Scholar
|
|
33
|
Ke L, Li Q, Song J, Jiao W, Ji A, Chen T,
Pan H and Song Y: The mitochondrial biogenesis signaling pathway is
a potential therapeutic target for myasthenia gravis via energy
metabolism (Review). Exp Ther Med. 22(702)2021.PubMed/NCBI View Article : Google Scholar
|
|
34
|
Rautenbach RM, Pillay K, Murray ADN and
Heckmann JM: Extraocular muscle findings in myasthenia gravis
associated treatment-resistant ophthalmoplegia. J Neuroophthalmol.
37:414–417. 2017.PubMed/NCBI View Article : Google Scholar
|
|
35
|
Vila MC, Rayavarapu S, Hogarth MW, Van der
Meulen JH, Horn A, Defour A, Takeda S, Brown KJ, Hathout Y,
Nagaraju K and Jaiswal JK: Mitochondria mediate cell membrane
repair and contribute to Duchenne muscular dystrophy. Cell Death
Differ. 24:330–342. 2017.PubMed/NCBI View Article : Google Scholar
|
|
36
|
Gilhus NE: Myasthenia Gravis. N Engl J
Med. 375:2570–2581. 2016.PubMed/NCBI View Article : Google Scholar
|
|
37
|
Punga AR, Maddison P, Heckmann JM, Guptill
JT and Evoli A: Epidemiology, diagnostics, and biomarkers of
autoimmune neuromuscular junction disorders. Lancet Neurol.
21:176–188. 2022.PubMed/NCBI View Article : Google Scholar
|
|
38
|
Smith VM, Nguyen H, Rumsey JW, Long CJ,
Shuler ML and Hickman JJ: A Functional Human-on-a-Chip autoimmune
disease model of myasthenia gravis for development of therapeutics.
Front Cell Dev Biol. 9(745897)2021.PubMed/NCBI View Article : Google Scholar
|
|
39
|
White AJ, Wijeyekoon RS, Scott KM,
Gunawardana NP, Hayat S, Solim IH, McMahon HT, Barker RA and
Williams-Gray CH: The Peripheral Inflammatory Response to
Alpha-Synuclein and Endotoxin in Parkinson's Disease. Front Neurol.
9(946)2018.PubMed/NCBI View Article : Google Scholar
|
|
40
|
Yalçınkaya N, Haytural H, Bilgiç B,
Özdemir Ö, Hanağası H, Küçükali Cİ, Özbek Z, Akcan U, İdrisoğlu HA,
Gürvit H and Tüzün E: Expression changes of genes associated with
apoptosis and survival processes in Parkinson's disease. Neurosci
Lett. 615:72–77. 2016.PubMed/NCBI View Article : Google Scholar
|
|
41
|
Ding Q, Qi Y and Tsang SY: Mitochondrial
biogenesis, mitochondrial dynamics, and mitophagy in the maturation
of cardiomyocytes. Cells. 10(2463)2021.PubMed/NCBI View Article : Google Scholar
|
|
42
|
Ahmed ME, Selvakumar GP, Kempuraj D,
Thangavel R, Mentor S, Dubova I, Raikwar SP, Zaheer S, Iyer S and
Zaheer A: Synergy in disruption of mitochondrial dynamics by Aβ
(1-42) and glia maturation factor (GMF) in SH-SY5Y cells is
mediated through alterations in fission and fusion proteins. Mol
Neurobiol. 56:6964–6975. 2019.PubMed/NCBI View Article : Google Scholar
|
|
43
|
Gao J, Zhao L, Wang J, Zhang L, Zhou D, Qu
J, Wang H, Yin M, Hong J and Zhao W: C-Phycocyanin ameliorates
mitochondrial fission and fusion dynamics in ischemic cardiomyocyte
damage. Front Pharmacol. 10(733)2019.PubMed/NCBI View Article : Google Scholar
|
|
44
|
Zhang Q, Guo D and Wang Y, Wang X, Wang Q,
Wu Y, Li C, Wang W and Wang Y: Danqi pill protects against heart
failure post-acute myocardial infarction via HIF-1α/PGC-1α mediated
glucose metabolism pathway. Front Pharmacol. 11(458)2020.PubMed/NCBI View Article : Google Scholar
|
|
45
|
Iqbal S and Hood DA: The role of
mitochondrial fusion and fission in skeletal muscle function and
dysfunction. Front Biosci (Landmark Ed). 20:157–172.
2015.PubMed/NCBI View
Article : Google Scholar
|
|
46
|
Santel A, Frank S, Gaume B, Herrler M,
Youle RJ and Fuller MT: Mitofusin-1 protein is a generally
expressed mediator of mitochondrial fusion in mammalian cells. J
Cell Sci. 116:2763–2774. 2003.PubMed/NCBI View Article : Google Scholar
|
|
47
|
Fix DK, VanderVeen BN, Counts BR and
Carson JA: Regulation of skeletal muscle DRP-1 and FIS-1 protein
expression by IL-6 signaling. Oxid Med Cell Longev.
2019(8908457)2019.PubMed/NCBI View Article : Google Scholar
|
|
48
|
Eisenhut P, Mebrahtu A, Moradi Barzadd M,
Thalén N, Klanert G, Weinguny M, Sandegren A, Su C, Hatton D, Borth
N and Rockberg J: Systematic use of synthetic 5'-UTR RNA structures
to tune protein translation improves yield and quality of complex
proteins in mammalian cell factories. Nucleic Acids Res.
48(e119)2020.PubMed/NCBI View Article : Google Scholar
|
|
49
|
Mayr C: Regulation by 3'-Untranslated
Regions. Annu Rev Genet. 51:171–194. 2017.PubMed/NCBI View Article : Google Scholar
|
|
50
|
Prats AC, David F, Diallo LH, Roussel E,
Tatin F, Garmy-Susini B and Lacazette E: Circular RNA, the key for
translation. Int J Mol Sci. 21(8591)2020.PubMed/NCBI View Article : Google Scholar
|
|
51
|
Cortassa S, Aon MA, Winslow RL and
O'Rourke B: A mitochondrial oscillator dependent on reactive oxygen
species. Biophys J. 87:2060–2073. 2004.PubMed/NCBI View Article : Google Scholar
|
|
52
|
Reutzel M, Grewal R, Dilberger B, Silaidos
C, Joppe A and Eckert GP: Cerebral mitochondrial function and
cognitive performance during aging: A longitudinal study in NMRI
mice. Oxid Med Cell Longev. 2020(4060769)2020.PubMed/NCBI View Article : Google Scholar
|
|
53
|
Xiang Z, Valenza M, Cui L, Leoni V, Jeong
HK, Brilli E, Zhang J, Peng Q, Duan W, Reeves SA, et al:
Peroxisome-proliferator-activated receptor gamma coactivator 1 α
contributes to dysmyelination in experimental models of
Huntington's disease. J Neurosci. 31:9544–9553. 2011.PubMed/NCBI View Article : Google Scholar
|
|
54
|
Jones AW, Yao Z, Vicencio JM,
Karkucinska-Wieckowska A and Szabadkai G: PGC-1 family coactivators
and cell fate: Roles in cancer, neurodegeneration, cardiovascular
disease and retrograde mitochondria-nucleus signalling.
Mitochondrion. 12:86–99. 2012.PubMed/NCBI View Article : Google Scholar
|
|
55
|
Martín-Jiménez R, Lurette O and
Hebert-Chatelain E: Damage in mitochondrial DNA associated with
Parkinson's Disease. DNA Cell Biol. 39:1421–1430. 2020.PubMed/NCBI View Article : Google Scholar
|
|
56
|
Islam H, Bonafiglia JT, Turnbull PC,
Simpson CA, Perry CGR and Gurd BJ: The impact of acute and chronic
exercise on Nrf2 expression in relation to markers of mitochondrial
biogenesis in human skeletal muscle. Eur J Appl Physiol.
120:149–160. 2020.PubMed/NCBI View Article : Google Scholar
|
|
57
|
Piao Y, Kim HG, Oh MS and Pak YK:
Overexpression of TFAM, NRF-1 and myr-AKT protects the
MPP(+)-induced mitochondrial dysfunctions in neuronal cells.
Biochim Biophys Acta. 1820:577–585. 2012.PubMed/NCBI View Article : Google Scholar
|
|
58
|
Ramachandran B, Yu G and Gulick T: Nuclear
respiratory factor 1 controls myocyte enhancer factor 2A
transcription to provide a mechanism for coordinate expression of
respiratory chain subunits. J Biol Chem. 283:11935–11946.
2008.PubMed/NCBI View Article : Google Scholar
|
|
59
|
Song J, Lei X, Jiao W, Song Y, Chen W, Li
J and Chen Z: Effect of Qiangji Jianli decoction on mitochondrial
respiratory chain activity and expression of mitochondrial fusion
and fission proteins in myasthenia gravis rats. Sci Rep.
8(8623)2018.PubMed/NCBI View Article : Google Scholar
|
|
60
|
Jiao W, Hu F, Li J, Song J, Liang J, Li L,
Song Y, Chen Z, Li Q and Ke L: Qiangji Jianli Decoction promotes
mitochondrial biogenesis in skeletal muscle of myasthenia gravis
rats via AMPK/PGC-1α signaling pathway. Biomed Pharmacother.
129(110482)2020.PubMed/NCBI View Article : Google Scholar
|