Introduction
Hepatocellular carcinoma (HCC) is one of the most
common malignancies worldwide, accounting for 500,000–600,000
mortalities per year (1). It has
been estimated that approximately 53% of HCC cases are related to
hepatitis B virus (HBV) (2). HBV,
which belongs to the Hepadnaviridae family, causes both acute and
chronic infection of the liver. HBV is a partial double-stranded
DNA virus with a 3.2-kb genome containing four known open reading
frames, namely, S, C, P and X genes. The X gene, which encodes
hepatitis B virus X protein (HBx), is most closely associated with
HCC (3). Evidence suggests that
HBx is a multifunctional regulator that modulates the cell cycle,
genetic stability, transcription, protein degradation, signal
transduction and apoptosis by directly or indirectly interacting
with host factors (4). The protein
inhibits cell proliferation by inducing late G1 arrest and induces
apoptosis in a p53-dependent and -independent manner (5). Several transgenic mouse models reveal
that the X gene is capable of inducing HCC (6). Notably, a number of studies have
demonstrated that mutations and deletions of HBx, particularly the
COOH-terminal deletion of HBx, are frequent events in
HBV-associated HCC tissues (7). It
has been reported that mutations of the HBx gene may cause
uncontrolled growth and contribute to multistep
hepatocarcinogenesis (8).
Therefore, mutations of the HBx gene are very important in
hepatocarcinogenesis. However, the exact molecular mechanisms
involved in hepatocarcinogenesis remain unclear.
MicroRNAs (miRNAs) are a class of short (~22
nucleotides), endogenous, single-stranded noncoding RNAs. They are
responsible for the post-transcriptional expression regulation of
targeted genes. Growing evidence shows that miRNAs may play a key
role in the regulation of cellular differentiation, proliferation,
apoptosis, gene expression and cancer development (9). HCC is a complex disease involving
epigenetic and chromosomal instability, as well as expression
abnormalities of both coding and noncoding genes; the latter
include miRNAs (10). It has been
found that miR-18 and miR-224 are significantly overexpressed and
miR-195, miR-199a, miR-200a and miR-125a are underexpressed in HCC
tissues (10). Furthermore,
several miRNAs downregulated in HCC, such as miR-21, miR-221,
miR-223 and miR-224, have been identified as modulators of cell
growth, apoptosis, migration or invasion (11). miR-152 has also been found to be
downregulated in HBV-related HCC tissues (12).
In a previous study, our data showed that a mutant
of the HBx gene with a deletion from 382 to 400 bp (HBx-d382) was a
common event and potentially related to the development of HCC
(13). However, the molecular
mechanisms of HBx involved in HCC development are still not well
understood. Moreover, given the importance of miRNAs in HCC
development, we investigated whether miRNAs play a role in the
hepatocarcinogenic effect of HBx. The present study investigated
the miRNA expression profiles of the non-tumor human hepatic LO2
cells stably transfected with HBx and HBx-d382 using miRNA
microarray.
Materials and methods
Cells culture and establishment of the
stably transfected cell lines
The plasmid pcDNA3.0, recombinant plasmid
pcDNA3.0/HBx-d382 (a mutant of the HBx gene with a deletion from
382 to 400 bp) and pcDNA/HBx (the restructuring of HBx genetic
fragments originates from liver cell line HepG2.215) were all from
our laboratory and were stably established previously (13).
The hepatocyte cell line LO2 (Chinese Academy of
Science, Cell Biology of Shanghai Institute, Shanghai, China) was
cultured in RPMI-1640 medium (Gibco, Carlsbad, CA, USA) containing
100 U/ml penicillin, 100 μg/ml streptomycin and 10% fetal bovine
serum (FBS; Gibco) in a humidified atmosphere of 5% CO2
and 95% air at 37°C. We attempted to establish a stable LO2 cell
line transfected with HBx and HBx-d382. LO2 cells were transfected
with Lipofectamine 2000 (Invitrogen, Carlsbad, CA, USA) according
to the manufacturer's instructions and selected with G418
(Geneticin®; Gibco). The plasmids pcDNA3.0,
pcDNA3.0/HBx-d382 and pcDNA/HBx were used in the transfection
experiments. Empty pcDNA3.0 vector plasmid was used as a control.
The stable transfection of pcDNA3.0/HBx-d382 (termed LO2/HBx-d382),
pcDNA/HBx (termed LO2/HBx) or the empty vector (termed LO2/pcDNA)
was confirmed by reverse transcription-polymerase chain reaction
(RT-PCR) and western blot analysis. The study was approved by the
ethics committee of Xiangya Hospital, Central South University,
Changsha, China.
RT-PCR analysis
Total RNA of the LO2 cell line was extracted using
TRIzol (Invitrogen). The primers used in the PCR were as follows:
HBx, F, 5′-AAGGTACCATGGCT GCTAGGCTGTGCT-3′ and R,
5′-CTGGGCCCTTAGGCA GAGGTGAAAAAGTTG-3′ (481 or 462 bp amplified
fragment); β-actin, F, 5′-CTCCATCCTGGCCTCGCTGT-3′ and R,
5′-GCTGTCACCTTCACCGTTCC-3′ (242 bp amplified fragment). The cycling
conditions for HBx amplification were 94°C for 3 min, followed by
35 cycles of 94°C for 30 sec, 68°C for 30 sec and 72°C for 1 min,
followed by an elongation cycle of 72°C for 5 min. The resultant
PCR products were analyzed using electrophoresis on 1.5%
Tris/Borate/EDTA (TBE) agarose gel with β-actin as an internal
control.
Western blot analysis
Total protein was extracted from transfected cells
using the RIPA lysis buffer (Beyotime, Nantong, China). Equal
amounts of protein samples were separated by SDS-PAGE and
electroblotted onto PVDF membranes (Millipore, Billerica, MA, USA).
Blots were blocked with 5% skimmed milk, followed by incubation
with antibodies specific for rabbit anti-HBx (dilution, 1:1,500;
Abcam, Cambridge, UK), and mouse anti-β-actin (dilution, 1:10,000;
Sigma, St. Louis, MO, USA). Blots were then incubated with goat
anti-rabbit or anti-mouse secondary antibody conjugated to
horseradish peroxidase (dilution, 1:5,000; Jackson ImmunoResearch,
Inc., West Grove, PA, USA) and visualized by enhanced
chemiluminescence (ECL) (Amersham Biosciences, Piscataway, NJ,
USA).
miRNA isolation
Total RNA of LO2 cells transfected with wild-type
and mutant HBx as well as empty plasmid pcDNA3.0 was extracted
using TRIzol. The concentration and quality of RNA was measured by
ultraviolet (UV) absorbance at 260 and 280 nm and checked by gel
electrophoresis individually. miRNA isolation was performed from
all pooled total RNA using an miRNA isolation kit (Ambion, Austin,
TX, USA). RNA quality was measured using the Small RNA kit
(Agilent, Santa Clara, CA, USA) on the Agilent 2100 Bioanalyzer and
analyzed by capillary electrophoresis individually. The average RNA
integrity number (RIN) value of all samples was ≥6.0 and 28s/18s
>0.7, indicating high-quality RNA with minimal degradation
products.
miRNA microarray analysis
The Human miRNA Microarray version 3.0 (Agilent)
contains approximately 15,000 probes including 866 human and 89
human viral miRNAs from the Sanger database v12.0. This chip not
only has high sensitivity and specificity but can also distinguish
between mature and precursor miRNAs. Microarray analysis was
performed according to the manufacturer's instructions (Agilent).
Four clones of each cell line were analyzed with microarray
analysis. Briefly, first strand cDNA was synthesized from 200 ng
RNA, followed by cRNA amplification and labeling with Cy3 or Cy5.
Equal amounts of Cy3- or Cy5-labeled cRNA from the cells of the
LO2/HBx-d382, LO2/HBx or LO2/pcDNA3.0 fraction were mixed and
hybridized using the Agilent Human Whole Genome Oligo Microarray in
a dye swap design at 65°C overnight. On the following day, slides
were washed and signals were scanned with GenePix™ 4000B (Agilent).
There were four spot replicates for each probe on the chip.
Signal intensities from scanned images were analyzed
using Agilent Feature Extraction software version 10.5 and
GeneSpring GX. The abundance of probes in the cells of the
LO2/HBx-d382, LO2/HBx or LO2/pcDNA3.0 fraction was compared with
the abundance in the total fraction. For each probe, the signal
intensity from the cells of the LO2/HBx-d382, LO2/HBx or
LO2/pcDNA3.0 fraction was divided by the signal intensity from the
total cell lysate RNA fraction. For each dye swap, the average
LO2/HBx-d382/T, LO2/HBx/T or LO2/pcDNA3.0/T ratio was calculated.
Fluorescence intensity was normalized with the background
subtracted, and all scanned images were processed and converted
into normalized data using a quantile method. LO2/HBx-d382/T and
LO2/HBx/T of each probe were compared with each other as well as
with LO2/pcDNA3.0/T. After standardization, we output the log2
value of the primary signal. Two criteria were set to identify the
abnormal expression of miRNAs: when compared with LO2/pcDNA3.0, a
different value of each probe present in the LO2/HBx-d382 or
LO2/HBx >1 (corresponding to the ratio of the original signal is
>2) was considered to be enriched in the LO2/HBx-d382 or LO2/HBx
fraction; while a different value <-1 (corresponding to the
ratio of the original signal is <0.5) was considered to be
reduced in LO2/HBx-d382 or LO2/HBx fraction.
Real-time PCR
Total RNA of transfected cells was extracted using
TRIzol (Invitrogen) according to the manufacturer's instructions.
cDNA was synthesized with the RevertAid™ First Strand cDNA
Synthesis kit (MBI Fermentas, Inc., Burlington, ON, Canada) in a
total volume of 20 μl. The cDNA sample was analyzed by real-time
PCR using the THUNDERBIRD® SYBR qPCR mix (Toyobo, Osaka,
Japan). All the primers of miRNAs that were detected as
differentially expressed in the microarray were from a Bulge-Loop™
miRNA qPCR Primer Set (RiboBio, Guangzhou, China) including the
human U6 snRNA. The experiment consisted of two steps: i) it was
based on the stem-loop structure protruding primer reverse
transcription reaction and ii) real-time fluorescence quantitative
PCR (qPCR). The stem-loop structure of the RT-convex primers
combined with miRNA 3′ terminal end and the reverse transcriptase
leads to the reverse transcription reaction, while the specific
primers and SYBR Green fluorescent dye participating in the
quantitative PCR reaction system realizes quantitative detection of
reverse transcription products. Each cDNA sample was run on a
96-well optical plate in a total volume of 20 μl/well including 2
μl RT product, 4 μl specific primers, 4 μl sterile double-distilled
water (ddw) and 10 μl SYBR qPCR Mix. qPCR was performed on the
7500HT Real-Time PCR System (Applied Biosystems, Foster City, CA,
USA) using the following profile: 95°C for 1 min, and 40 cycles of
95°C for 15 sec and 60°C for 35 min. A dissociation step was
performed following the qPCR amplification for melting curve
analysis. All reactions were performed in triplicate. The whole
miRNA expression of LO2/HBx-d382 or LO2/HBx cells were compared to
each other as well as to LO2/pcDNA3.0 cells and normalized using U6
snRNA. Since a cycle threshold (CT) value of 35 represents single
molecule template detection, CT values >35 were considered to be
below the detection level of the assay. Therefore, only the miRNAs
with CT ≤35 were included in the analyses.
The relative amount of miRNAs studied in the samples
was determined with the 2−ΔΔCT method, where ΔΔCT =
CTtarget-CTU6)sample -
(CTtarget-CTU6)control. Briefly,
the CT values for the U6 snRNA were subtracted from CT values of
the target gene to achieve the ΔCT value. 2−ΔCT was
calculated for each sample and then each of the values was then
divided by a control sample to achieve the relative miRNA levels
(2−ΔΔCT).
Target genes selected
Target genes were selected from the following
websites: miRBase (http://microrna.sanger.ac.uk/sequences/), TargetScan
(http://www.targetscan.org/), PicTar
(http://pictar.mdc-berlin.de/) and
miRanda (http://www.microrna.org/microrna/home.do).
Results
Establishment of a stably HBx-transfected
LO2 cell line
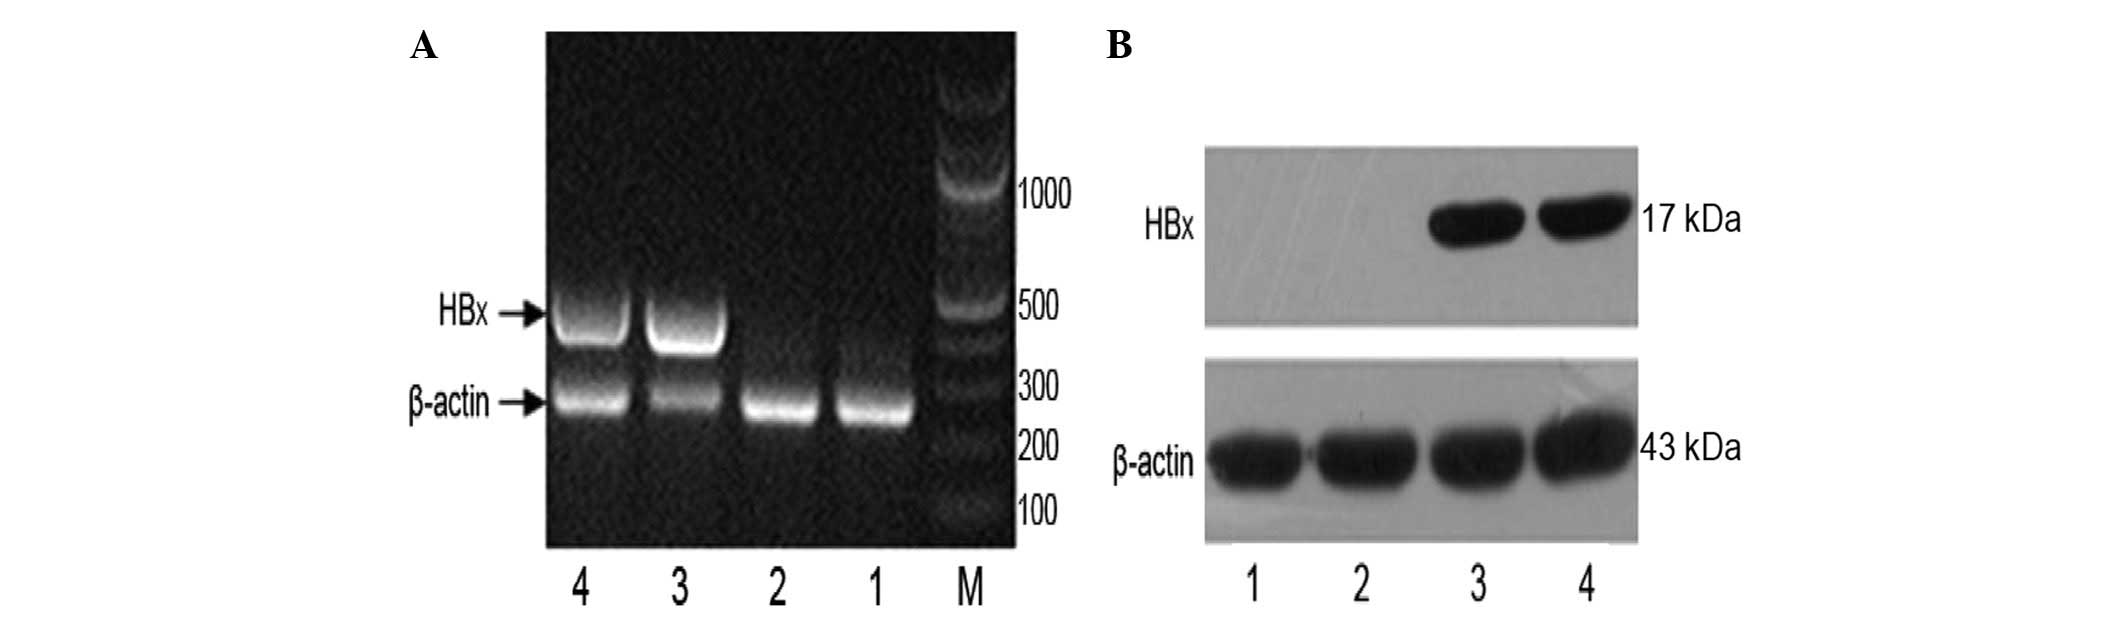
RT-PCR was used to identify the integrated HBx gene
in the cDNA of the engineered LO2 cells. β-actin was used as a
loading control (Fig. 1A). The
data showed that the HBx gene had been successfully introduced into
the host genome of LO2 cells. Western blot analysis showed that
expression of the HBx protein was detectable in LO2 cells (Fig. 1B). Our data suggest that a stably
HBx-transfected LO2 cell line was successfully established.
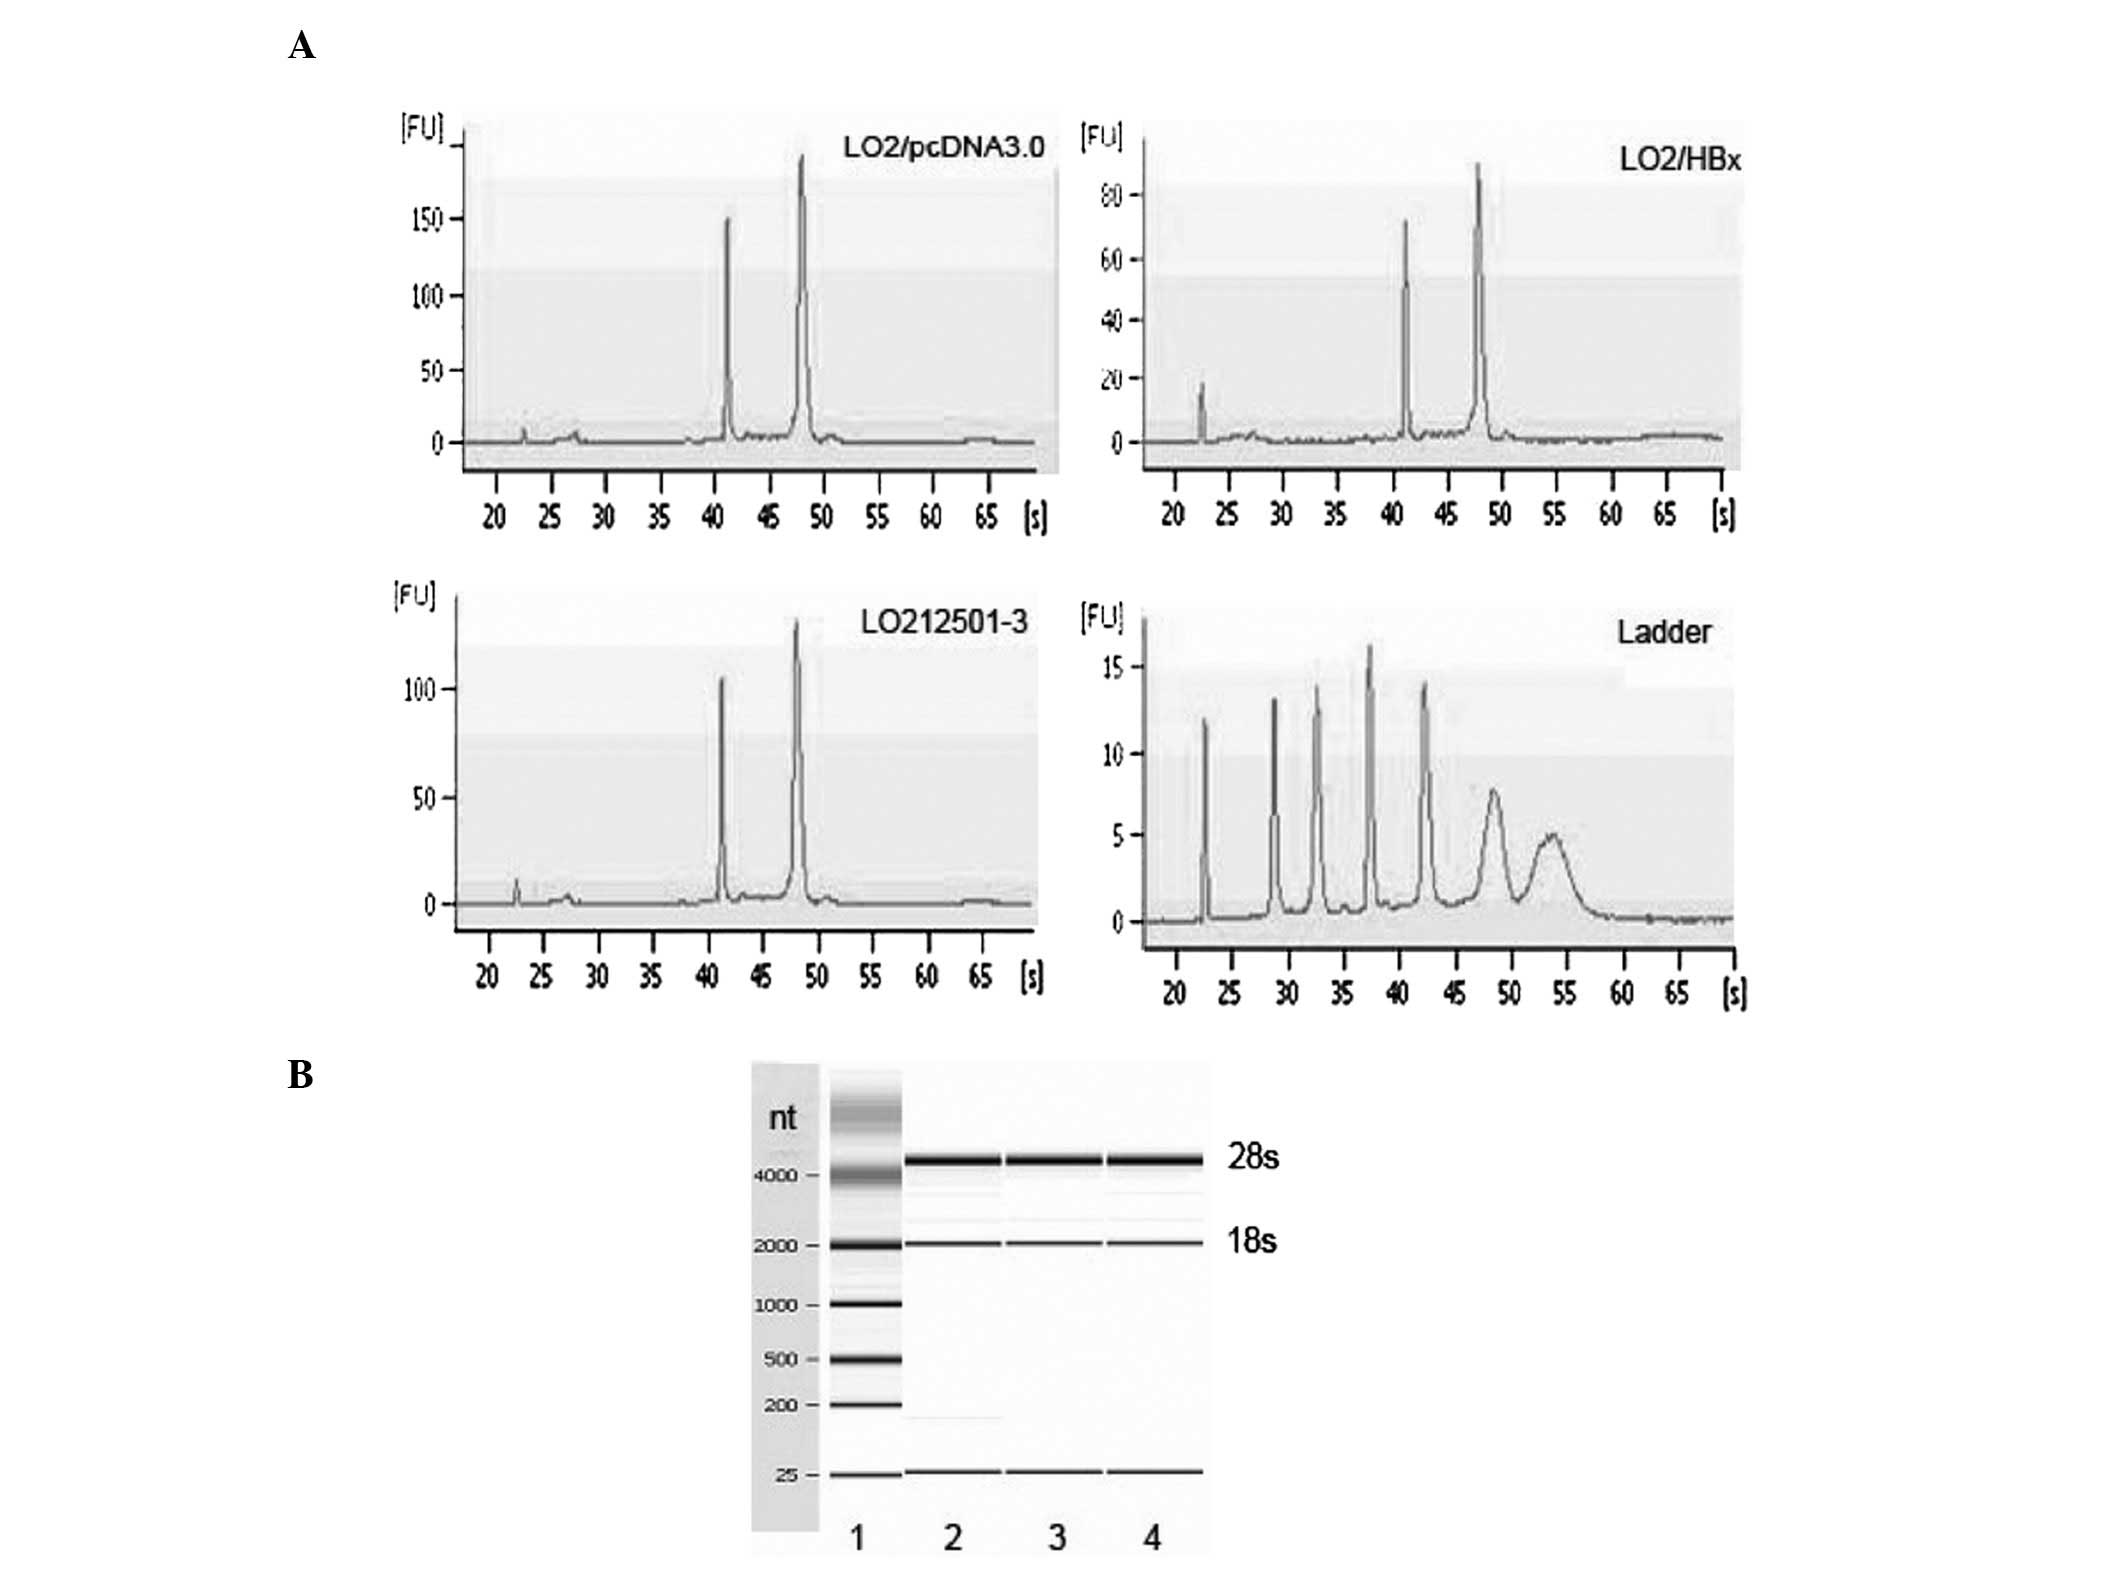
RNA quality check
The mirvana miRNA isolation kit was used to extract
and purify miRNA and the quality of RNA was analyzed using
capillary electrophoresis individually. There were 3 visible
electrophoresis strip peaks representing 5s, 18s and 28s,
respectively (Fig. 2). Our data
showed that the quality of RNA was high without degradation, and it
was not polluted by genomic DNA (Table
I).
 | Table ICorresponding absorbance at 260 and
280 nm. |
Table I
Corresponding absorbance at 260 and
280 nm.
| Cells | A260/A280 | 2100 RIN | 28s/18s |
|---|
| L02/pcDNA3.0 | 1.99 | 10 | 2.2 |
| L02/HBx | 2.11 | 10 | 2 |
| L02/HBx | 1.97 | 10 | 2.2 |
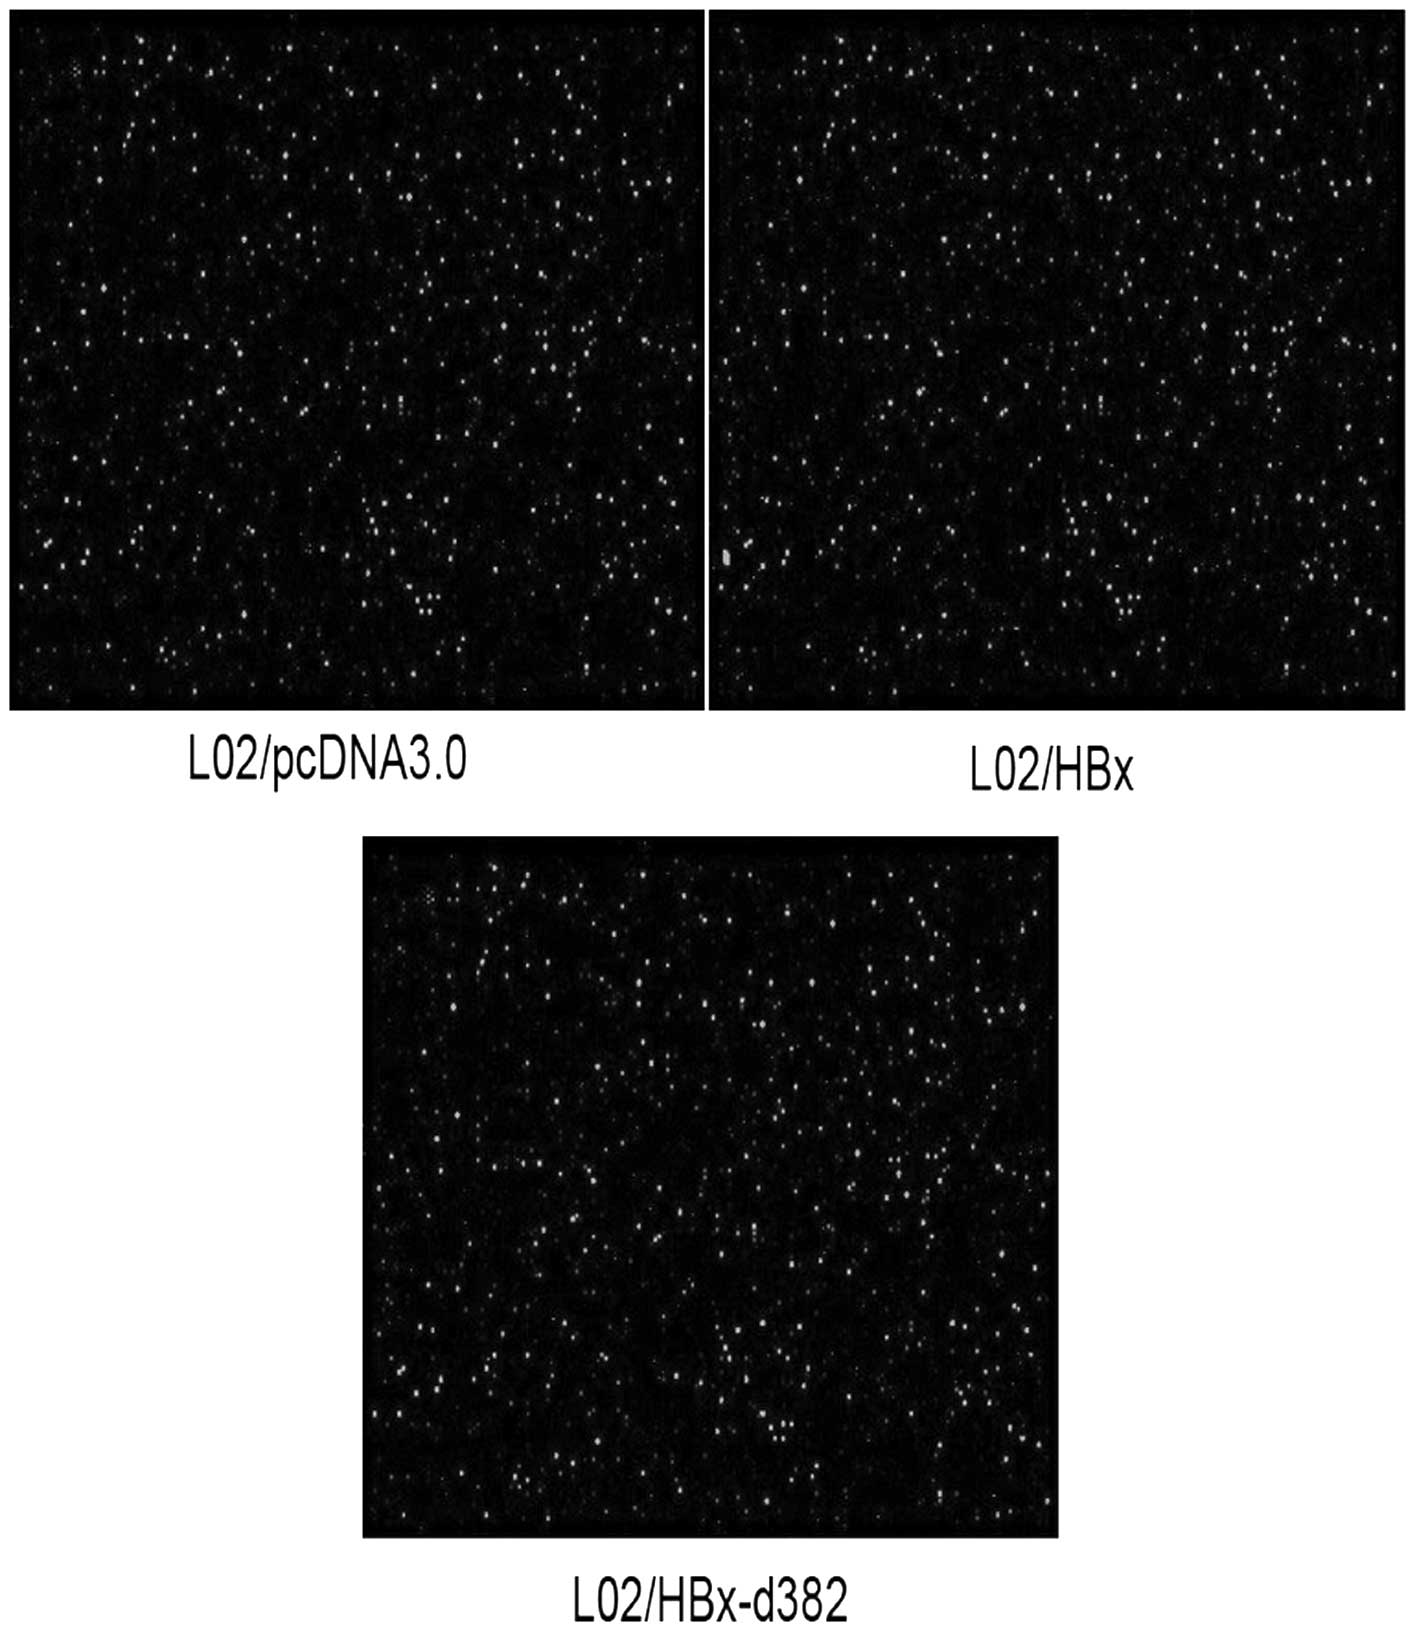
miRNA microarray scanning
Fig. 3 shows images
scanned with GenePix™ 4000B. The detection rate of all chips was
22.10±3.08%, while the coefficient of variation (CV) of one single
sample was 8.93±2.11%, which indicated that different measures of
hybridization quality and consistency were high.
miRNA microarray analysis
Eleven miRNAs were differentially expressed in
LO2/HBx-d382 compared to LO2/pcDNA3.0 cells. The normalized
hybridization signal of miRNAs identified in the microarray
analysis is listed in Table II.
The 6 upregulated miRNAs were miR-501, miR-1307, miR-1180, miR-497,
miR-1246 and miR-623. The 5 downregulated miRNAs were miR-1,
miR-338-3p, miR-551b, miR-455-3p and miR-200c.
| Table IIDifferential miRNA expression in
HBx-d382-transfected LO2 cells. |
Table II
Differential miRNA expression in
HBx-d382-transfected LO2 cells.
| miRNA name | L02/PCDNA3.0
mean | L02/HBx-d382
mean | Fluorescence
difference value (log2 value) | Up- or
downregulation in L02/HBx-d382 cells |
|---|
| hsa-miR-338-3p | 4.629886 | 1.577917 | −3.05196969 | Downregulated |
| hsa-miR-551b | 4.000756 | 1.198526 | −2.802229496 | Downregulated |
| hsa-miR-1 | 3.541191 | 1 | −2.541190817 | Downregulated |
| hsa-miR-455-3p | 5.435329 | 4.10132 | −1.334009537 | Downregulated |
| hsa-miR-200c | 3.309559 | 2.003005 | −1.306553869 | Downregulated |
| hsa-miR-501-5p | 2.094981 | 3.116949 | 1.021967456 | Upregulated |
| hsa-miR-1307 | 1.764127 | 2.865505 | 1.101377863 | Upregulated |
| hsa-miR-1180 | 1.697469 | 2.909304 | 1.211835771 | Upregulated |
| hsa-miR-497 | 1.653463 | 2.965216 | 1.31175287 | Upregulated |
| hsa-miR-1246 | 4.304869 | 5.661847 | 1.356977617 | Upregulated |
| hsa-miR-623 | 1.815217 | 3.272093 | 1.456875568 | Upregulated |
Four upregulated and 12 downregulated miRNAs were
observed in LO2/HBx compared to LO2/pcDNA3.0 cells. Normalized
hybridization signals of miRNAs identified in the microarray
analysis are listed in Table
III. miR-7, miR-1274a, miR-137 and miR-663 were upregulated in
LO2/HBx cells, while miR-338-3p, miR-24-1, miR-200c, miR-29c,
miR-744, miR-455-3p, miR-324, miR-551b, miR-340, miR-590, miR-660
and miR-193a-3p were downregulated.
| Table IIIDifferential miRNA expression in
HBx-transfected LO2 cells. |
Table III
Differential miRNA expression in
HBx-transfected LO2 cells.
| miRNA name | L02/PCDNA3.0
mean | L02/HBx mean | Fluorescence
difference value (log2 value) | Up- or
downregulation in L02/HBx cells |
|---|
| hsa-miR-338-3p | 4.629886 | 2.557788 | −2.0721 | Downregulated |
| hsa-miR-24-1 | 3.602923 | 1.588591 | −2.01433 | Downregulated |
| hsa-miR-200c | 3.309559 | 1.359513 | −1.950046 | Downregulated |
| hsa-miR-29c | 8.110281 | 6.527961 | −1.58232 | Downregulated |
| hsa-miR-744 | 3.99746 | 2.519724 | −1.47774 | Downregulated |
| hsa-miR-455-3p | 5.435329 | 4.121858 | −1.31347 | Downregulated |
| hsa-miR-324-5p | 5.94758 | 4.638507 | −1.30907 | Downregulated |
| hsa-miR-551b | 4.000756 | 2.719708 | −1.28105 | Downregulated |
| hsa-miR-340 | 3.018177 | 1.751115 | −1.26706 | Downregulated |
| hsa-miR-590-5p | 4.962567 | 3.78986 | −1.17271 | Downregulated |
| hsa-miR-660 | 4.119494 | 2.947035 | −1.17246 | Downregulated |
|
hsa-miR-193a-3p | 5.329816 | 4.214547 | −1.11527 | Downregulated |
| hsa-miR-7 | 6.283198 | 7.473472 | 1.190274 | Upregulated |
| hsa-miR-1274a | 6.674666 | 7.974562 | 1.299896 | Upregulated |
| hsa-miR-137 | 1.788507 | 3.308352 | 1.519845 | Upregulated |
| hsa-miR-663 | 1.124881 | 3.014342 | 1.889461 | Upregulated |
Eight miRNAs were differentially expressed in
LO2/HBx compared to LO2/HBx-d382 cells. Normalized hybridization
signals of miRNAs identified in the microarray analysis are listed
in Table IV. miR-551b, miR-663,
miR-7 and miR-1 were upregulated and miR-1307, miR-501-5p, miR-29c
and miR-24-1 were downregulated in LO2/HBx cells.
| Table IVEight miRNAs were differentially
expressed in LO2/HBx compared to LO2/HBx-d382 cells. |
Table IV
Eight miRNAs were differentially
expressed in LO2/HBx compared to LO2/HBx-d382 cells.
| miRNA name | L02/HBx-d382
mean | L02/HBx mean | Fluorescence
difference value (log2 value) | Up- or
downregulation in L02/HBx cells |
|---|
| hsa-miR-551b | 1.198526 | 2.719708 | 1.521182 | Upregulated |
| hsa-miR-1307 | 2.865505 | 1.072718 | −1.79279 | Downregulated |
| hsa-miR-501-5p | 3.116949 | 1.199773 | −1.91718 | Downregulated |
| hsa-miR-29c | 7.846427 | 6.527961 | −1.31847 | Downregulated |
| hsa-miR-663 | 1.415526 | 3.014342 | 1.598816 | Upregulated |
| hsa-miR-7 | 6.44578 | 7.473472 | 1.027692 | Upregulated |
| hsa-miR-24-1 | 3.565019 | 1.588591 | −1.97643 | Downregulated |
| hsa-miR-1 | 1 | 2.906131 | 1.90613 | Upregulated |
Real-time PCR analysis
The microarray data were confirmed by real-time PCR
with the 2−ΔΔCT method. The whole miRNA expression of
the HBx-expressed cell lines (LO2/HBx-d382 or LO2/HBx) were
compared to each other as well as to LO2/pcDNA3.0 cells and
normalized using U6 snRNA. The relative quantity of the control was
normalized as 1 and, therefore, 2−ΔΔCT showed the
relative miRNA levels. Our data revealed that the real-time PCR
results were consistent with the chip results (Table V).
| Table VRelative miRNA expression levels. |
Table V
Relative miRNA expression levels.
| miRNA name |
ΔCTsample |
ΔCTcontrol |
2−ΔΔCTa |
|---|
|
ΔCTsample =
(CTtarget-CTU6)LO2/HBx-d382
cells |
|
ΔCTcontrol =
(CTtarget-CTU6)LO2/pcDNA3.0
cells |
|
hsa-miR-338-3p | 10.89 | 8.079 | 0.14 |
| hsa-miR-551b | 12.83 | 10.18 | 0.16 |
| hsa-miR-1 | 13.89 | 11.69 | 0.22 |
|
hsa-miR-455-3p | 13.22 | 11.94 | 0.41 |
| hsa-miR-200c | 9.83 | 7.82 | 0.24 |
|
hsa-miR-501-5p | 10.99 | 12.14 | 2.2 |
| hsa-miR-1307 | 8.50 | 9.64 | 2.2 |
| hsa-miR-1180 | 8.64 | 9.84 | 2.3 |
| hsa-miR-497 | 13.47 | 14.92 | 2.73 |
| hsa-miR-1246 | 11.07 | 12.85 | 3.43 |
| hsa-miR-623 | 9.1 | 11.38 | 4.85 |
|
ΔCTsample =
(CTtarget-CTU6)LO2/HBx cells |
|
ΔCTcontrol =
(CTtarget-CTU6)LO2/pcDNA3.0
cells |
|
hsa-miR-338-3p | 9.87 | 7.60 | 0.21 |
| hsa-miR-24-1* | 16.71 | 15.56 | 0.45 |
| hsa-miR-200c | 10.10 | 8.78 | 0.4 |
| hsa-miR-29c | 8.43 | 6.49 | 0.26 |
| hsa-miR-744 | 12.72 | 10.91 | 0.28 |
|
hsa-miR-455-3p | 13.22 | 11.94 | 0.41 |
|
hsa-miR-324-5p | 13.83 | 11.70 | 0.23 |
| hsa-miR-551b | 11.57 | 10.43 | 0.45 |
| hsa-miR-340 | 14.98 | 13.90 | 0.47 |
|
hsa-miR-590-5p | 13.17 | 11.26 | 0.27 |
| hsa-miR-660 | 8.56 | 7.45 | 0.46 |
|
hsa-miR-193a-3p | 15.63 | 13.87 | 0.30 |
| hsa-miR-7 | 15.24 | 16.55 | 2.48 |
| hsa-miR-1274a | 8.49 | 10.15 | 3.16 |
| hsa-miR-137 | 7.13 | 8.86 | 3.32 |
| hsa-miR-663 | 11.23 | 13.69 | 5.5 |
|
ΔCTsample =
(CTtarget-CTU6)LO2/HBx cells |
|
ΔCTcontrol =
(CTtarget-CTU6)LO2/HBx-d382
cells |
| hsa-miR-551b | 11.78 | 13.10 | 2.50 |
| hsa-miR-1307 | 10.13 | 8.82 | 0.40 |
|
hsa-miR-501-5p | 11.69 | 10.41 | 0.41 |
| hsa-miR-29c | 7.97 | 6.81 | 0.45 |
| hsa-miR-663 | 11.06 | 12.95 | 3.71 |
| hsa-miR-7 | 14.96 | 16.02 | 2.08 |
| hsa-miR-24-1* | 17.00 | 15.28 | 0.30 |
| hsa-miR-1 | 12.42 | 14.06 | 3.11 |
As shown in Table
VI, the targets of miRNAs were predicted on several websites
such as miRBase (http://microrna.sanger.ac.uk/sequences/), TargetScan
(http://www.targetscan.org/), PicTar
(http://pictar.mdc-berlin.de/) and
miRanda (http://www.microrna.org/microrna/home.do).
| Table VIPredicted targets of miRNAs. |
Table VI
Predicted targets of miRNAs.
| miRNA name | Putative target
associate with HBx | Description |
|---|
| hsa-miR-338-3p | CCND (cyclin
D1) | G1/S-specific
cyclin D1 |
| hsa-miR-551b | BCL2 | Apoptosis regulator
Bcl-2 |
| hsa-miR-1 | CCND1 | |
| CCND2 | G1/S-specific
cyclin D1 |
| cdk-6 | Cell division
protein kinase 6 |
| cdk-9 | Cell division
protein kinase 9 |
| hsa-miR-200c | JUN | Transcription
factor AP-1 (activator protein 1) |
| MYC | Myc proto-oncogene
protein (c-Myc) |
| hsa-miR-501-5p | HBXIP | Hepatitis B virus
X-interacting protein |
| RSF1 | Remodeling and
spacing factor 1 (Rsf-1)
(Hepatitis B virus X-associated protein) |
| hsa-miR-497 | CCNE1 | G1/S-specific
cyclin E1 |
| BCL2 | Apoptosis regulator
Bcl-2 |
| CCND2 | G1/S-specific
cyclin D2 |
| hsa-miR-623 | GCK | Glucokinase |
| CCRK | Cell cycle-related
kinase |
| hsa-miR-24-1 | BCL2L2 | Apoptosis regulator
Bcl-W (Bcl-2-like 2 protein) |
| hsa-miR-29c | PTEN | Phosphatase and
tensin homolog deleted on chromosome 10 |
| PPP1R13B |
Apoptosis-stimulating of p53 protein
1 |
| hsa-miR-324-5p | GCK | |
| TMEM16J | Tumor proteinp 53
inducible protein 5 |
| CCND3 | G1/S-specific
cyclin D3 |
| hsa-miR-340 | CTNNB1 | Catenin β-1
(β-catenin) |
|
hsa-miR-193a-3p | RSF1 | Remodeling and
spacing factor 1 (Rsf-1) |
| PTEN | Phosphatase and
tensin homolog deleted on chromosome 10 |
| APOA2 | Apolipoprotein A-II
precursor (Apo-AII) |
| hsa-miR-7 | APOA2 | |
| TP53INP2 | Tumor protein
p53-inducible nuclear protein 2 |
| CKS2 | Cyclin-dependent
kinases regulatory subunit 2 (CKS-2) |
| hsa-miR-137 | CDK6 | Cell division
protein kinase 6 |
| CDC42 | Cell division
control protein 42 homolog precursor |
| hsa-miR-663 | CDK3 | Cell division
protein kinase 3 |
Discussion
HCC is one of the most common malignancies and most
of the cases are attributable to persistent HBV infection (14). Comparative studies of mammalian and
avian hepadnaviruses, transgenic animal studies, and cell culture
transformation studies imply that the 17.0-kDa X protein of HBV
plays an important role in HCC development by influencing
transcription, cell proliferation, apoptosis and signal
transduction (15,16). It has been reported that in tumor
tissues, the majority of HBx natural mutants have lost their
capacity for controlling cell proliferation, viability and
transformation and, therefore, may cause uncontrolled growth and
contribute to the multistep development of HCC (17). A recent study demonstrated that a
number of miRNAs have multiple functions including cell cycle
control, cancer development, diagnosis and treatment (18–21).
Given the importance of miRNAs in carcinogenesis, we hypothesized
that miRNAs may also be involved in the mechanism of wild-type or
mutant HBx in hepatocarcinogenesis.
In the present study, we established LO2 cell lines
transfected with HBx-d382 and HBx. RT-PCR and western blot analysis
showed that expression of the HBx gene was detectable in LO2 cells,
a fact suggesting that stably HBx-transfected LO2 cell lines were
successfully established. The miRNA expression profile was detected
using the Agilent miRNA microarray. The results showed that 6
miRNAs exhibited higher expression and 5 miRNAs exhibited lower
expression in LO2/HBx-d382 compared to LO2/pcDNA3.0 cells.
Meanwhile, 4 upregulated and 12 downregulated miRNAs were observed
in LO2/HBx compared to LO2/pcDNA3.0 cells. While of the
above-mentioned miRNAs, miR-551b, miR-663, miR-7 and miR-1 were
upregulated and miR-1307, miR-501-5p, miR-29c and miR-24-1 were
downregulated in LO2/HBx cells compared with LO2/HBx-d382 cells.
Microarray data were consistent with the real-time qPCR analysis.
Our data showed that the wild-type or mutant HBx had an impact on
the miRNA expression of hepatic LO2 cells.
Of the above-mentioned miRNAs, the function of some
has been revealed, while the function of others remains unknown.
For example, miR-1 regulated aspects of both pre- and post-synaptic
function at neuromuscular junctions. It regulated the muscle
transcription factor MEF-2, which results in altered pre-synaptic
acetylcholine (Ach) secretion (22). Other studies also found that miR-1
was involved in many types of cancer such as lung, colon and liver
cancer, where it was expressed at a lower level (23,24).
Datta et al(25) suggested
that ectopic expression of miR-1 in HCC cells inhibited cell
growth, reduced replication potential and clonogenic survival by
regulating Foxp1 and MET and it was suggested to be one of the
mechanisms by which DNA hypomethylating agents suppress
hepatocarcinoma cell growth. From several predicted target
websites, we found that there were many predicted targets of miR-1
and some of them were involved in cell proliferation or controlling
the cell cycle, such as cyclin D1, cyclin D2, cdk-6 and cdk-9. A
study showed that HBx induced DNA hypermethylation of the p16INK4a
promoter to repress its expression, which subsequently led to
activation of G1-CDKs, phosphorylation of pRb, activation of E2F1,
transcriptional activation of DNMT1 and finally induced development
of HCC (26). Hence, we
hypothesized that the significantly low expression of miR-1 in
LO2/HBx-d382 cells may regulate cyclin D1 and induce cell
growth.
Another widely-investigated miRNA is miR-200c. Yu
et al(27) reported that
miR-200c is an independent prognostic factor in pancreatic cancer
and its upregulation inhibits pancreatic cancer invasion. They also
found that the patients with high levels of miR-200c expression had
significantly better survival rates than those with low levels of
miR-200c expression. Several studies have shown that miR-200 family
miRNAs (miR-200a, -200b, -200c-141 and -429) prevent
epithelial-to-mesenchymal transition (EMT) by directly suppressing
the expression of ZEB1 and ZEB2, causing degradation of the mRNA,
and resulting in an upregulation of E-cadherin (28,29).
Previous studies have demonstrated that HBx regulated EMT in the
SMMC-7721 hepatoma cell line in vivo(30). Moreover, our data indicated that a
decrease of miR-200c expression was detected in both LO2/HBx-d382
and LO2/HBx cells, so we suggest that miR-200c is possibly linked
to the mechanism of HBx in EMT. It has been recently reported that
loss of miR200c expression is linked to aberrant DNA methylation
and histone modifications, while HBx regulates DNA methylation
(31). Therefore, further
investigation is required to clarify whether miR-200c plays a key
role in the upregulation of DNA methylation influenced by HBx.
miR-29c, a different isoform of miR-29, has been
reported to target the expression of TCL1, a critical oncogene in
aggressive chronic lymphocytic leukemia (CLL), a fact strongly
suggesting that miR-29 may function as a tumor suppressor in CLL
(32). A recent study showed that
miR-29 directly targeted DNA methyltransferases Dnmt3A and -3B55
and that it activated P53 by targeting P85α and CDC42 (33). Although there are insufficient data
regarding its function, miR-338-3p has been detected by using a
bead-based microarray analysis to be significantly downregulated in
HCC tissue and this has been suggested to be related to the
development of HCC (21,34). A number of miRNAs affect the growth
of cancer cells in vitro and in vivo when
overexpressed or inhibited. Therefore, cancer cell growth may be
controlled by manipulating miRNAs. For example, miR-7 and miR-137
are considered as cancer therapeutic tools (35). Silber et al(36) reported that the targeted delivery
of miR-137 to glioblastoma multiforme tumor cells, which inhibited
the proliferation of glioblastoma multiforme cells and induced
differentiation of brain tumor stem cells, may be therapeutically
effective for the treatment of this disease.
Our data showed that miRNA expression was different
between the wild-type and mutant HBx-transfected LO2 cells. For
example, miR-338-3p was detected to have a lower expression level
in LO2/HBx-d382 compared to LO2/HBx cells. On the contrary, miR-29c
and miR-24-1 were detected to have a lower expression level in
LO2/HBx compared to LO2/HBx-d382 cells. miR-1 had a low expression
level in LO2/HBx-d382 cells and no difference in LO2/HBx cells when
compared to LO2/PCDNA3.0. As mentioned above, miR-1 had several
predicted targets such as cyclin D1 and D2 which could promote cell
proliferation, a fact which may explain why mutant HBx led to
uncontrolled growth. Meanwhile, miR-551b, which demonstrated a
lower expression level in LO2/HBx-d382 compared to LO2/HBx cells,
may directly or indirectly regulate BCL2 (Table V), which is well-known as an
anti-apoptotic protein (37).
Therefore, the difference in miRNAs between the HBx-expressing cell
lines may be one of the reasons for the different functions and
biological characteristics of the wild-type and mutant HBx
transfected cells.
Due to the fact that miRNA expression may differ
from cells to tissues, and from hepatitis and cirrhosis to HCC, it
also may be dissimilar in cell lines of different types of cancer
as well as in cancer tissues resulting from different
etiopathogenesis. Therefore, not all differential expression of
miRNAs in our study could be the same as that in HCC tissue.
However, due to the stable organization that is less variable than
in tissue and unaffected by the immune system and the surrounding
environment of stroma cells, we used cell lines to study the miRNA
expression, which has certain advantages and is flexible. Our data
showed that some of the differentially expressed miRNAs in LO2
cells transfected with wild-type or mutant HBx were similar to that
in malignant tissues, suggesting that HBx may influence miRNA and,
therefore, directly or indirectly induce hepatocarcinogenesis.
Although the function of certain miRNAs found in this study has not
been described, we could not exclude their potential involvement in
oncogenesis. For example, although limited data were available
regarding the function of miR-497, it was found to possess several
predicted targets associated with HBx using public prediction
algorithms, such as BCL2 and CCND2.
In conclusion, our study showed that the X gene is
capable of influencing the miRNA expression profile in LO2 cells.
Further investigation is required to clarify the roles of the
identified miRNAs and, therefore, it may be helpful to investigate
the role of HBx in hepatocarcinogenesis as well as to clarify the
underlying molecular mechanisms involved.
Acknowledgements
This study was supported by grants from the National
Natural Science Foundation (no. 30872228), the National Key Program
in the 11th Five Year Plan of China (no. 2008ZX10002-007), the
Natural Science Foundation of Hunan (no. 10JJ5034) and Projects in
the Science and Technology Pillar Program of Hunan (no.
2010SK3093).
References
|
1
|
Farazi PA and DePinho RA: Hepatocellular
carcinoma pathogenesis: from genes to environment. Nat Rev Cancer.
6:674–687. 2006. View
Article : Google Scholar : PubMed/NCBI
|
|
2
|
Parkin DM, Bray FI and Devesa SS: Cancer
burden in the year 2000. The global picture. Eur J Cancer.
37:S4–S66. 2001.PubMed/NCBI
|
|
3
|
Wang WL, London WT, Lega L and Feitelson
MA: HBxAg in the liver from carrier patients with chronic hepatitis
and cirrhosis. Hepatology. 14:29–37. 1991. View Article : Google Scholar : PubMed/NCBI
|
|
4
|
Tang H, Oishi N, Kaneko S and Murakami S:
Molecular functions and biological roles of hepatitis B virus x
protein. Cancer Sci. 97:977–983. 2006. View Article : Google Scholar : PubMed/NCBI
|
|
5
|
Sirma H, Giannini C, Poussin K, Paterlini
P, Kremsdorf D and Bréchot C: Hepatitis B virus X mutants, present
in hepatocellular carcinoma tissue abrogate both the
antiproliferative and transactivation effects of HBx. Oncogene.
18:4848–4859. 1999. View Article : Google Scholar : PubMed/NCBI
|
|
6
|
Yu DY, Moon HB, Son JK, et al: Incidence
of hepatocellular carcinoma in transgenic mice expressing the
hepatitis B virus X-protein. J Hepatol. 31:123–132. 1999.
View Article : Google Scholar : PubMed/NCBI
|
|
7
|
Liu XH, Lin J, Zhang SH, et al:
COOH-terminal deletion of HBx gene is a frequent event in
HBV-associated hepatocellular carcinoma. World J Gastroenterol.
14:1346–1352. 2008. View Article : Google Scholar : PubMed/NCBI
|
|
8
|
Ma NF, Lau SH, Hu L, et al: COOH-terminal
truncated HBV X protein plays key role in hepatocarcinogenesis.
Clin Cancer Res. 14:5061–5068. 2008. View Article : Google Scholar : PubMed/NCBI
|
|
9
|
Bartel DP: MicroRNAs: genomics,
biogenesis, mechanism, and function. Cell. 116:281–297. 2004.
View Article : Google Scholar : PubMed/NCBI
|
|
10
|
Budhu A, Jia HL, Forgues M, et al:
Identification of metastasis-related micro-RNAs in hepatocellular
carcinoma. Hepatology. 47:897–907. 2008. View Article : Google Scholar
|
|
11
|
Meng F, Henson R, Wehbe-Janek H, Ghoshal
K, Jacob ST and Patel T: Micro-RNA-21 regulates expression of the
PTEN tumor suppressor gene in human hepatocellular cancer.
Gastroenterology. 133:647–658. 2007. View Article : Google Scholar : PubMed/NCBI
|
|
12
|
Huang J, Wang Y, Guo Y and Sun S:
Downregulated microRNA-152 induces aberrant DNA methylation in
hepatitis B virus-related hepatocellular carcinoma by targeting DNA
methyltransferase 1. Hepatology. 52:60–70. 2010. View Article : Google Scholar : PubMed/NCBI
|
|
13
|
Zhu P, Tan D, Peng Z, Liu F and Song L:
Polymorphism analyses of hepatitis B virus X gene in hepatocellular
carcinoma patients from southern China. Acta Biochim Biophys Sin
(Shanghai). 39:265–272. 2007. View Article : Google Scholar : PubMed/NCBI
|
|
14
|
Boyle P and Levin B: World Cancer Report
2008. International Agency for Research on Cancer; Lyons, France:
pp. 338–343. 2008
|
|
15
|
Andrisani OM and Barnabas S: The role of
the transcriptional involvement of HBV pX in hepatocarcinogenesis
(Review). Int J Oncol. 15:373–139. 1999.
|
|
16
|
Chen HY, Tang NH, Lin N, Chen ZX and Wang
XZ: Hepatitis B virus X protein induces apoptosis and cell cycle
deregulation through interfering with DNA repair and checkpoint
responses. Hepatol Res. 38:174–182. 2008.PubMed/NCBI
|
|
17
|
Chen S, Zhao W, Tan W, et al: Association
of TBX21 T-1993C polymorphism with viral persistence but not
disease progression in hepatitis B virus carrier. Hepatol Res.
39:716–723. 2009. View Article : Google Scholar : PubMed/NCBI
|
|
18
|
Carleton M, Cleary MA and Linsley PS:
MicroRNAs and cell cycle regulation. Cell Cycle. 6:2127–2132. 2007.
View Article : Google Scholar : PubMed/NCBI
|
|
19
|
Vebtura A and Jacka T: MicroRNAs and
cancer: short RNAs go a long way. Cell. 136:586–591. 2009.
View Article : Google Scholar : PubMed/NCBI
|
|
20
|
Masaki T: MicroRNA and hepatocellular
carcinoma. Hepatol Res. 39:751–752. 2009. View Article : Google Scholar : PubMed/NCBI
|
|
21
|
Huang XH, Wang Q, Chen JS, et al:
Bead-based microarray analysis of microRNA expression in
hepatocellular carcinoma: miR-338 is downregulated. Hepatol Res.
39:786–794. 2009. View Article : Google Scholar : PubMed/NCBI
|
|
22
|
Simon DJ, Madison JM, Conery AL, et al:
The microRNA miR-1 regulates a MEF-2 dependent retrograde signal at
neuromuscular junctions. Cell. 133:903–915. 2008. View Article : Google Scholar : PubMed/NCBI
|
|
23
|
Nasser MW, Datta J, Nuovo G, et al:
Downregulation of micro-RNA-1 (miR-1) in lung cancer. Suppression
of tumorigenic property of lung cancer cells and their
sensitization to doxorubicin-induced apoptosis by miR-1. J Biol
Chem. 283:33394–33405. 2008. View Article : Google Scholar : PubMed/NCBI
|
|
24
|
Sarver AL, French AJ, Borralho PM, et al:
Human colon cancer profiles show differential MicroRNA expression
depending on mismatch repair status and are characteristic of
undifferentiated proliferative states. BMC Cancer. 9:4012009.
View Article : Google Scholar
|
|
25
|
Datta J, Kutay H, Nasser MW, et al:
Methylation mediated silencing of Micro-RNA-1 gene and its role in
hepatocellular carcinogenesis. Cancer Res. 68:5049–5058. 2008.
View Article : Google Scholar : PubMed/NCBI
|
|
26
|
Jung JK, Arora P, Pagano JS and Jang KL:
Expression of DNA methyltransferase 1 is activated by hepatitis B
virus X protein via a regulatory circuit involving the
p16INK4a-cyclin D1-CDK4/6-pRb-E2F1 pathway. Cancer Res.
67:5771–5778. 2007. View Article : Google Scholar : PubMed/NCBI
|
|
27
|
Yu J, Ohuchida K, Mizumoto K, et al:
MicroRNA, hsa-miR-200c, is an independent prognostic factor in
pancreatic cancer and its upregulation inhibits pancreatic cancer
invasion but increases cell proliferation. Mol Cancer. 9:1692010.
View Article : Google Scholar : PubMed/NCBI
|
|
28
|
Hurteau GJ, Carlson JA, Spivack SD and
Brock GJ: Overexpression of the MicroRNA hsa-miR-200c leads to
reduced expression of transcription factor 8 and increased
expression of E-cadherin. Cancer Res. 67:7972–7976. 2007.
View Article : Google Scholar : PubMed/NCBI
|
|
29
|
Park SM, Gaur AB, Lengyel E and Peter ME:
The miR-200 family determines the epithelial phenotype of cancer
cells by targeting the E-cadherin repressors ZEB1 and ZEB2. Genes
Dev. 22:894–907. 2008. View Article : Google Scholar : PubMed/NCBI
|
|
30
|
Yang SZ, Zhang LD, Zhang Y, et al: HBx
protein induces EMT through c-Src activation in SMMC-7721 hepatoma
cell line. Biochem Biophys Res Commun. 382:555–560. 2009.
View Article : Google Scholar : PubMed/NCBI
|
|
31
|
Vrba L, Jensen TJ, Garbe JC, et al: Role
for DNA methylation in the regulation of miR-200c and miR-141
expression in normal and cancer cells. PLoS One. 5:e86972010.
View Article : Google Scholar : PubMed/NCBI
|
|
32
|
Pekarsky Y, Santanam U, Cimmino A, et al:
Tcl1 expression in chronic lymphocytic leukemia is regulated by
miR-29 and miR-181. Cancer Res. 66:11590–11593. 2006. View Article : Google Scholar : PubMed/NCBI
|
|
33
|
Fabbri M, Garzon R, Cimmino A, et al:
MicroRNA-29 family reverts aberrant methylation in lung cancer by
targeting DNA methyltransferases 3A and 3B. Proc Natl Acad Sci U S
A. 104:15805–15810. 2007. View Article : Google Scholar : PubMed/NCBI
|
|
34
|
Park SY, Lee JH, Ha M, Nam JW and Kim VN:
miR-29 miRNAs activate p53 by targeting p85 alpha and CDC42. Nat
Struct Mol Biol. 16:23–29. 2009. View Article : Google Scholar : PubMed/NCBI
|
|
35
|
Kefas B, Godlewski L, Comeau L, et al:
MicroRNA-7 inhibits the epidermal growth factor receptor and the
Akt pathway and is downregulated in glioblastoma. Cancer Res.
68:3566–3572. 2008. View Article : Google Scholar : PubMed/NCBI
|
|
36
|
Silber J, Lim DA, Petritsch C, et al:
miR-124 and miR-137 inhibit proliferation of glioblastoma
multiforme cells and induce differentiation of brain tumor stem
cells. BMC Med. 6:142008. View Article : Google Scholar : PubMed/NCBI
|
|
37
|
Takada Y, Murakami A and Aggarwal BB:
Zerumbone abolishes NF-κB and IκBα kinase activation leading to
suppression of antiapoptotic and metastatic gene expression,
upregulation of apoptosis and downregulation of invasion. Oncogene.
24:6957–6969. 2005.
|