Introduction
γ-glutamyltransferase (GGT) is mostly used in
clinical laboratories as a marker of hepatic inflammation.
Recently, increasing evidence suggests that GGT plays an important
role in the development of cardiovascular events. Longitudinal and
cross-sectional investigations have associated GGT with an increase
in all-cause mortality, as well as chronic heart diseases such as
congestive heart failure (1–5).
The Seventh Report of the Joint National Committee
on the Prevention, Detection, Evaluation and Treatment of High
Blood Pressure (JNC7) (6) defines
prehypertension as systolic blood pressure from 120–139 mm/Hg or
diastolic pressure from 80–89 mm/Hg. Compared to normotension,
prehypertension is associated with a higher risk of developing
hypertension (7). Recent studies
suggest that baseline GGT may also predict the development of
hypertension independent of traditional risk factors. However,
these conclusions are based on different study populations, designs
and sampling procedures. In addition, the intensity of the
association differs between countries and districts (8–14).
In China, hypertension is the leading preventable
risk factor for death among adults (15). The aims of this study were to
explore a more sensitive risk factor for prehypertension and
investigate a new application for GGT. Blood pressure, age, gender
and other established risk factors for hypertension were included
in analyses and classified into subgroups to observe their
interactions. We also defined the association between GGT and the
risk of prehypertension.
Materials and methods
Study population
The data were part of the Expansion Investigation of
Human Physiology Constant in China. This survey was conducted in
Harbin and Hailin of Heilongjiang Province, which is located in the
northeast of China. Subjects were selected from certain communities
using cluster random sampling. The protocol was approved by the
Institutional Review Board of the Institute of Basic Medical
Science, Chinese Academy of Medical Sciences. All subjects signed
written informed consent forms. Inclusion criteria were age between
25 and 80 years, no serious chronic diseases, and no high fever in
the past 15 days. Exclusion criteria included hypertension (blood
pressure 140/90 mm/Hg or antihypertensive treatment) at baseline
and individuals with potential liver pathology.
Measurement
A precisely designed questionnaire was used to
assess demographic data, including date of birth, gender,
ethnicity, education level, health status, and health behavior
(e.g., smoking, alcohol use and physical activity). All
participants were asked to avoid smoking and heavy physical
activity for at least 2 h before a physical examination, which
included measures of resting blood pressure, height, weight, and
waist and hip circumference. Two blood pressure measurements were
taken with a mercury sphygmomanometer after participants had rested
in a sitting position for at least 5 min. A blood sample was
obtained after fasting for 8–12 h. For other biochemical analyses,
we collected specimens in a vacuum tube with no additives. Samples
were centrifuged at 3000 × g for 10 min at room temperature. After
separation, they were measured using a chemistry analyzer (Hitachi
7020) (Hitachi, Tokyo, Japan). Reagents and calibrators were
purchased from Hitachi. As part of a chemistry profile, GGT, total
cholesterol (TC), glucose, triglycerides (TG), high density
lipoprotein cholesterol (HDL-C), and low density lipoprotein
cholesterol (LDL-C) were measured by kinetic enzyme assays.
Statistical methods
Summary statistics are expressed as numbers for
categorical data, mean ± SD for approximately continuous variables.
Comparison between groups was made using the Chi-square test for
categorical data and the Mann-Whitney U test for continuous
data.
Multivariable logistic regression analyses were
performed to calculate the odds ratios (ORs) for prehypertension
according to GGT quartile, adjusting for age, gender, smoking,
alcohol consumption, BMI and waist circumference. The P-values
quoted are two-sided, and those values with P<0.05 are regarded
as statistically significant. All statistical analysis was
performed with SPSS v.13.0 (IBM SPSS Statistics, Armonk, NY,
USA).
Results
The baseline characteristics of the study population
are summarized by blood pressure in Table I. A total of 789 males and 1416
females between the ages of 25.0 and 84.6 were included in the
study. We excluded 110 individuals with GGT values above the normal
reference range of the laboratory (GGT >67 U/l). The remaining
2,205 participants were included in this analysis. Compared with
the normotensive group, those with prehypertension tended to be
older and have higher GGT, systolic and diastolic blood pressure,
fasting blood glucose, TG and TC. Whereas no significant difference
between the two groups was found in mean values of physical
activity.
 | Table IBaseline characteristics of
participants grouped by blood pressure status. |
Table I
Baseline characteristics of
participants grouped by blood pressure status.
| Normotension
(n=1111) mean ± SD | Prehypertension
(n=1094) mean ± SD |
aP-value | bP-value
for trend |
|---|
| Age (years) | 43.3±12.2 | 51.2±13.5 | <0.0001 | <0.0001 |
| Body mass index
(kg/m2) | 22.9±2.9 | 24.3±3.0 | <0.0001 | <0.0001 |
| Waist circumference
(cm) | 77.5±8.8 | 82.8±9.1 | <0.0001 | <0.0001 |
| Hip circumference
(cm) | 93.2±6.1 | 95.3±6.5 | <0.0001 | <0.0001 |
| Systolic blood
pressure (mm/Hg) | 110.1±7.6 | 126.7±6.5 | <0.0001 | <0.0001 |
| Diastolic blood
pressure (mm/Hg) | 71.2±6.1 | 80.4±6.0 | <0.0001 | <0.0001 |
| Fasting plasma
glucose (mmol/l) | 5.4±1.0 | 5.7±1.1 | <0.0001 | <0.0001 |
| GGT (U/l) | 19.4±11.4 | 24.8±13.7 | <0.0001 | <0.0001 |
| Triglycerides
(mmol/l) | 1.3±0.9 | 1.7±1.3 | <0.0001 | <0.0001 |
| Total cholesterol
(mmol/l) | 4.5±0.9 | 4.8±0.9 | <0.0001 | <0.0001 |
| HDL (mmol/l) | 1.5±0.4 | 1.5±0.4 | <0.0001 | <0.0001 |
| LDL (mmol/l) | 2.5±0.8 | 2.7±0.8 | <0.0001 | <0.0001 |
| n | n | aP-value | bP-value for trend |
|---|
| Gender | | | <0.0001 | <0.0001 |
| Male | 298 | 491 | | |
| Female | 813 | 603 | | |
| Nationality | | | 0.006 | 0.006 |
| Chinese | 857 | 801 | | |
| Korean | 209 | 262 | | |
| Drinking
status | | | <0.0001 | <0.0001 |
|
Never-drinkers | 854 | 741 | | |
| Current
drinkers | 203 | 288 | | |
| Smoking status | | | <0.0001 | <0.0001 |
| Never-smokers | 913 | 802 | | |
| Current
smokers | 160 | 23 | | |
| Physical
exercise | | | 0.117 | 0.195 |
| Never | 248 | 283 | | |
| Occasionally | 616 | 566 | | |
| Often | 247 | 245 | | |
| Education
status | | | <0.0001 | <0.001 |
| Less than high
school | 233 | 364 | | |
| High school | 241 | 286 | | |
| More than high
school | 637 | 444 | | |
Table II shows the
distribution of the continuous variables across the quartiles of
GGT. Significant linear trends were noted across most quartiles
with correlations between most variables and GGT (P<0.01).
Notably, ORs of TG, TC, LDL-C, HDL-C were 4.12 (3.36–5.05), 2.00
(1.74–2.29), 2.15 (1.84–2.50) and 4.33 (3.17–5.93),
respectively.
| Table IIThe distribution of the continuous
variables with GGT quartile. |
Table II
The distribution of the continuous
variables with GGT quartile.
| GGT baseline
(U/l) |
|---|
|
|
|---|
| <13 (n=641) | 13–18 (n=487) | >18–28
(n=510) | >28 (n=567) |
|---|
| Age (years) | 43.8 (13.3) | 48.5 (13.4) | 49.0 (13.3) | 48.5 (13.0) |
| OR (95% CI) | reference | 1.03
(1.02–1.04)b | 1.030
(1.02–1.04)b | 1.028
(1.02–1.04)b |
| Body mass index
(kg/m2) | 22.4 (2.8) | 23.1 (2.7) | 24.1 (3.0) | 24.9 (3.1) |
| OR (95% CI) | reference | 1.10
(1.05–1.15)b | 1.24
(1.19–1.30)b | 1.355
(1.30–1.42)b |
| Waist circumference
(cm) | 75.1 (7.9) | 78.5 (8.4) | 82.1 (8.6) | 85.5 (8.8) |
| OR (95% CI) | reference | 1.05
(1.05–1.15)b | 1.11
(1.05–1.15)b | 1.16
(1.05–1.15)b |
| Hip circumference
(cm) | 92.4 (6.0) | 93.2 (5.9) | 95.2 (6.5) | 96.4 (6.3) |
| OR (95% CI) | reference | 1.02
(1.00–1.04)a | 1.08
(1.06–1.10)b | 1.11
(1.09–1.14)b |
| Systolic blood
pressure (mm/Hg) | 114.5 (11.5) | 118.2 (10.7) | 119.8 (10.0) | 121.5 (9.9) |
| OR (95% CI) | reference | 1.03
(1.05–1.15)b | 1.05
(1.05–1.15)b | 1.06
(1.05–1.15)b |
| Diastolic blood
pressure (mm/Hg) | 73.5 (8.0) | 75.3 (7.3) | 76.7 (7.0) | 77.7 (7.2) |
| OR (95% CI) | reference | 1.03
(1.02–1.05)b | 1.06
(1.04–1.08)b | 1.08
(1.06–1.10)b |
| Glucose
(mmol/l) | 5.3 (0.9) | 5.4 (0.8) | 5.6 (1.0) | 5.8 (1.4) |
| OR (95% CI) | reference | 1.35
(1.13–1.61)a | 1.62
(1.37–1.91)b | 1.86
(1.58–2.18)b |
| Triglycerides
(mmol/l) | 1.0 (0.8) | 1.3 (0.9) | 1.6 (1.2) | 1.9 (1.3) |
| OR (95% CI) | reference | 2.29
(1.84–2.84)b | 3.44
(2.81–4.22)b | 4.12
(3.36–5.05)b |
| Total cholesterol
(mmol/l) | 4.3 (0.8) | 4.6 (0.9) | 4.8 (0.9) | 4.8 (0.9) |
| OR (95% CI) | reference | 1.46
(1.27–1.68)b | 2.00
(1.74–2.30)b | 2.00
(1.74–2.29)b |
| HDL (mmol/l) | 1.6 (0.4) | 1.4 (0.4) | 1.5 (0.4) | 1.5 (0.4) |
| OR (95% CI) | reference | 1.81
(1.30–2.52)b | 2.90
(2.08–4.03)b | 4.33
(3.17–5.93)b |
| LDL (mmol/l) | 2.3 (0.8) | 2.5 (0.8) | 2.7 (0.8) | 2.8 (0.8) |
| OR (95% CI) | reference | 1.56
(1.33–1.82)b | 2.02
(1.73–2.36)b | 2.15
(1.84–2.50)b |
| GGT (U/l) | 10.4 (2.2) | 15.9 (1.4) | 22.5 (2.5) | 40.2 (10.7) |
Table III and
Fig. 1 present adjusted ORs for
prehypertension according to GGT quartiles in a series of logistic
models. Increased GGT quartiles were positively associated with
prehypertension for age, gender, and nationality-adjusted and
multivariable-adjusted models. Trends in these associations were
also statistically significant. Significant factors in Table I were included in the models. We
examined the soaring ORs of prehypertension associated with
increasing levels of serum GGT.
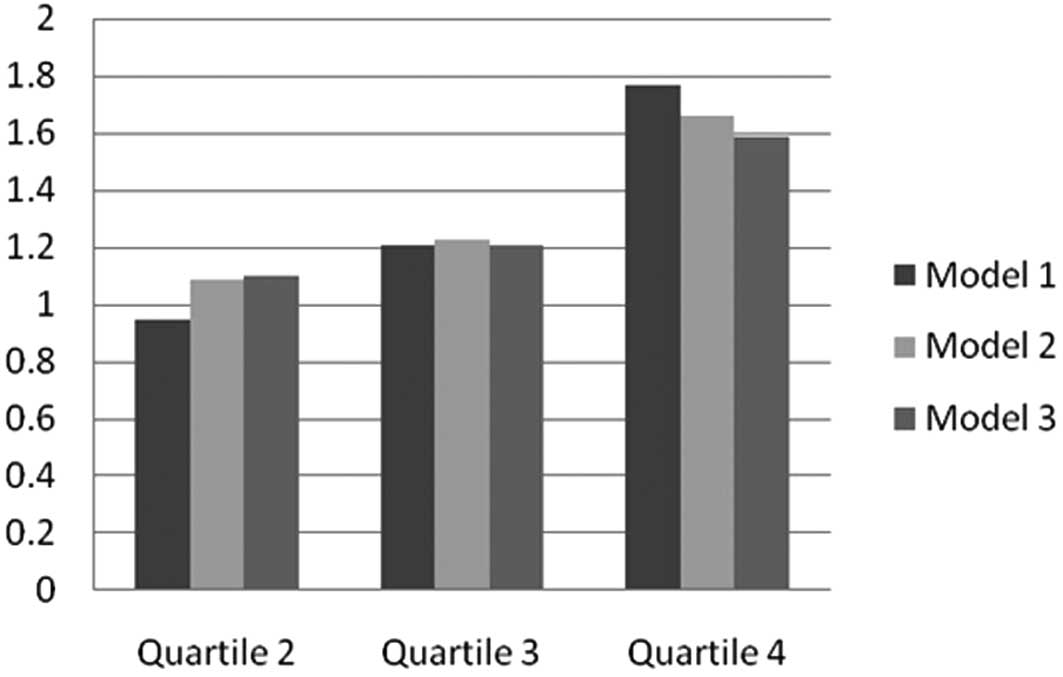 | Figure 1Adjusted ORs of prehypertension
according to GGT quartiles. Model 1, adjusted age, gender and
nationality; model 2, adjusted as above plus BMI, smoking status,
drinking status, waist circumference, hip circumference and
education status; model 3, adjusted as above plus glucose, TG, TC,
HDL-C and LDL-C. |
| Table IIIAdjusted ORs of prehypertension
according to GGT quartiles. |
Table III
Adjusted ORs of prehypertension
according to GGT quartiles.
| OR (95% CI) | |
|---|
|
| |
|---|
| GGT baseline
(U/l) | |
|---|
|
| |
|---|
| <13 | 13–18 | >18–28 | >28 | P-value for
trend |
|---|
| Model 1 | 1.0 | 0.95
(0.75–1.21) | 1.21
(0.94–1.55) | 1.77
(1.37–2.29) | <0.001 |
| Model 2 | 1.0 | 1.09
(0.83–1.44) | 1.23
(0.93–1.63) | 1.66
(1.23–2.23) | 0.007 |
| Model 3 | 1.0 | 1.10
(0.83–1.44) | 1.21
(0.89–1.58) | 1.59
(1.18–2.16) | 0.020 |
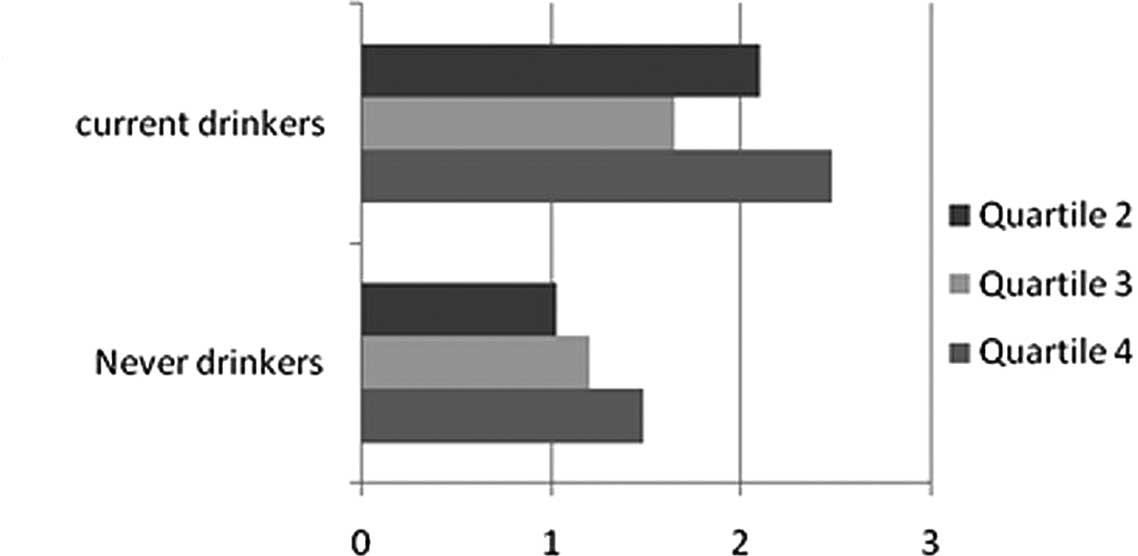
To eliminate confoundings, we stratified the
analyses according to drinking status, gender, nationality, glucose
and lipid level. Fig. 2A shows
that the risk of prehypertension increased more rapidly with
drinking status, yet there was no linear relationship across GGT
quartiles. Stratification by gender produced the same outcome
(Fig. 2B). Compared with females,
males showed a greater trend toward prehypertension (top vs. bottom
quartile OR, 2.06; 95% CI, 1.08–3.93). However, the trend was
inconsistent within quartiles in males and risk in quartile 2 was
lower than that in the other quartiles. The association between GGT
and prehypertension within subgroup of nationality was positive in
a dose-response pattern, even after full adjustment (Table IV, Fig. 2C). Adjusted ORs across quartiles of
serum GGT in those of Korean nationality were 1.41, 1.43 and 2.12
respectively. In comparison, OR of individuals of Chinese
nationality was 0.96, 1.13 and 1.40.
| Table IVAdjusted ORs of prehypertension
according to GGT quartiles by stratification for nationality,
drinking status, gender, glucose and lipid level. |
Table IV
Adjusted ORs of prehypertension
according to GGT quartiles by stratification for nationality,
drinking status, gender, glucose and lipid level.
| | OR (95% CI) | |
|---|
| |
| |
|---|
| | GGT baseline
(U/l) | |
|---|
| |
| |
|---|
| n | <13 | 13–18 | >18–28 | >28 | P-value |
|---|
| Nationality |
| Chinese | 1658 | 1.0 | 0.96
(0.70–1.33) | 1.13
(0.80–1.53) | 1.40
(0.99–1.98) | 0.141 |
| Korean | 547 | 1.0 | 1.41
(0.83–2.40) | 1.43
(0.77–2.64) | 2.12
(1.05–4.26) | 0.209 |
| Drinking
Status |
| Drinking | 610 | 1.0 | 2.10
(0.96–4.63) | 1.65
(0.76–3.59) | 2.48
(1.12–5.53) | 0.102 |
| Never
drinking | 1595 | 1.0 | 1.03
(0.76–1.38) | 1.20
(0.88–1.64) | 1.48
(1.05–2.08) | 0.115 |
| Gender |
| Male | 791 | 1.0 | 1.60
(0.81–3.17) | 1.40
(0.74–2.65) | 2.06
(1.08–3.93) | 0.088 |
| Female | 1414 | 1.0 | 1.03
(0.76–1.39) | 1.22
(0.87–1.71) | 1.38
(0.94–2.02) | 0.326 |
| Glucose |
| Normal | 1607 | 1.0 | 1.06
(0.77–1.46) | 1.13
(0.80–1.59) | 1.40
(0.96–2.04) | 0.345 |
| Prediabetes | 598 | 1.0 | 1.24
(0.69–2.23) | 1.49
(0.83–2.67) | 1.95
(1.06–3.57) | 0.163 |
| Lipid level |
| Normal | 1697 | 1.0 | 1.02
(0.76–1.38) | 1.13
(0.82–1.56) | 1.60
(1.13–2.27) | 0.035 |
| Dyslipidemia | 508 | 1.0 | 1.53
(0.74–3.17) | 1.50
(0.74–3.07) | 1.63
(0.78–3.41) | 0.599 |
We also examined the impact of glucose on the
development of prehypertension according to GGT quartiles. We
classified glucose into two groups: normal (glucose <6.0) and
prediabetic status (6.0< glucose <7.0). We found a
significant linear relationship between GGT quartiles and
prehypertension in both states. However, the association was
stronger in the prediabetic group than in the normal one, which had
an OR of 1.95 (1.06–3.57) in quartile 4 vs. an OR of 1.40
(0.96–2.04) in quartile 1 in the fully adjusted model (Table IV and Fig. 2D).
According to ‘Guide to China's Prevention and
Treatment of Adult Dyslipidemia’, we sorted out two groups, normal
level and dyslipidemia (TC >6.22 or TG >2.26 or HDL <1.55
or LDL >4.14), to highlight the relationship between the indices
of lipid metabolism, GGT and prehypertension (16). Table
IV shows that the association was significant only in the
normal group (P<0.05).
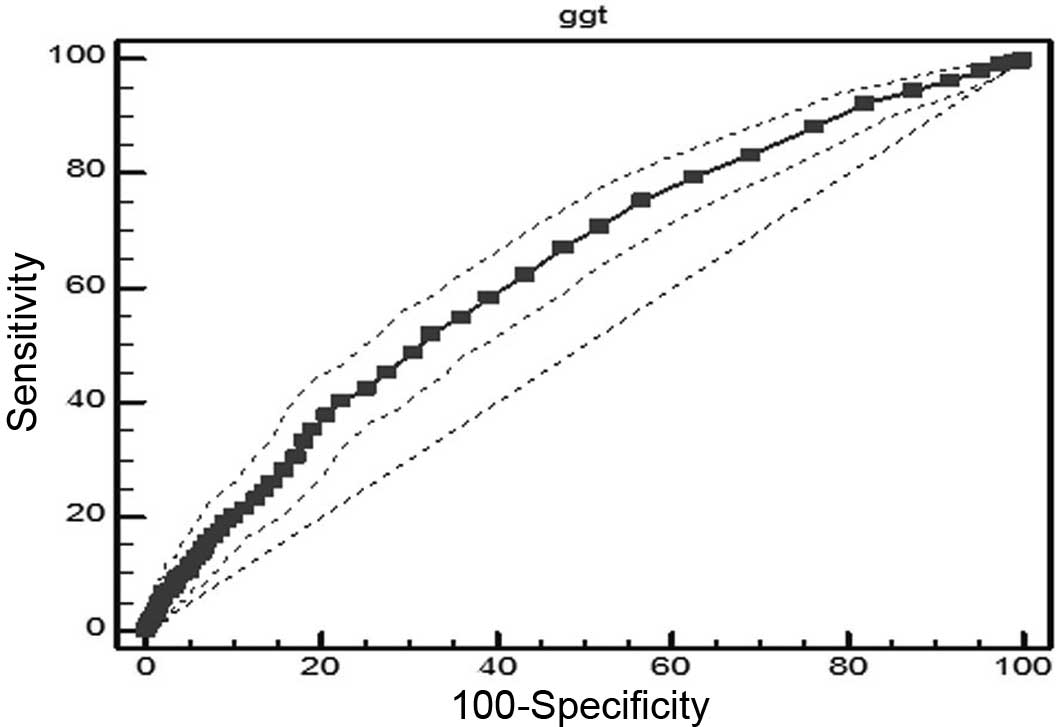
Receiver operating characteristic (ROC) analysis was
used to investigate GGT levels and other risk factors associated
with prehypertension, and to try to identify the possible dividing
line of GGT between healthy subjects and those with prehypertension
(Fig. 3). The area under the curve
(AUC) of GGT was 0.632, slightly higher than AUC of TG (0.630),
glucose (0.626), LDL (0.601), HDL (0.559) and TC (0.581). The
cutoff point of GGT was 20 IU/l, with a sensitivity of 0.52 and a
specificity of 0.67.
Discussion
Several recent studies have identified baseline GGT
as an independent biomarker for the development of cardiovascular
diseases (1–5,8–14).
In our study, we found that baseline GGT predicted prehypertension
in a dose-response pattern. Adjusted relative risks were 1.13, 1.19
and 1.53 according to quartiles of baseline serum GGT
(P<0.05).
This association was independent of the effects of
alcohol consumption and was present in both nondrinkers and
drinkers. As serum GGT is also a marker of alcohol intake, these
findings are consistent with the hypothesis of an association with
prehypertension independent of alcohol intake (2,17,18).
Our outcomes, which show a stronger association among drinkers than
nondrinkers, differ somewhat from those in other studies. However,
the drinking group did not show a linear tendency across the GGT
range. This might be due to our sample size, which precluded
meaningful comparisons between lifetime abstainers and former
drinkers.
The positive association between GGT and
prehypertension was stronger in males. However, the female group
showed a direct relation between the quartile of baseline GGT and
the risk of prehypertension. Results classified by gender have
varied among studies. In a prospective cohort study in Korea with
293 prehypertensive individuals, 5-year hypertension incidence
suggested that baseline serum GGT within the normal range strongly
predicted the future risk of hypertension, but only in females
(8). Our study also differed by
sample size and nationalities. The National Health and Nutrition
Examination Survey (NHANES) found that among 5,827 US adults,
higher serum GGT levels were associated with prehypertension
without CVD and hypertension. This association persisted in
separate analyses among males and females (19). However, NHANES did not exclude
participants with abnormal GGT (GGT >55 U/l).
We observed a dose-response relationship among Hans
and Koreans. Specifically, the association between GGT and
prehypertension was stronger in Koreans compared with Hans.
Similarly, a study showed that the adjusted relative risks of GGT
and prehypertension in Koreans were 1.0, 3.7, 3.6 and 6.0 according
to quartiles of baseline serum GGT (P<0.01) (7). Koreans appear to be at an increased
risk for developing hypertension. The reasons are yet to be
identified.
Based on our findings, participants with prediabetes
and dyslipidemia had higher ORs for prehypertension than those in
the normal group. After stratification, only the normal lipid group
showed a significant association between GGT and the risk of
prehypertension. In the separate logistic regression, the
association between GGT and indices of lipids was notable (20,21).
These outcomes suggest that in healthy subjects, GGT may give a
warning for prehypertension before the occurrence of dyslipidemia.
A British regional heart study by Wannamethee et al noted
increasing GGT levels were strongly associated with all-cause
mortality, and a strong positive correlation with body mass index,
total cholesterol and diabetes mellitus (22). A study reported by Ruttmann et
al in 2005 with the participation of 163,944 adults also
provided similar results revealing that GGT was positively
correlated with risk factors for cardiovascular disease including
body mass index, serum triglycerides, total cholesterol, systolic
and diastolic blood pressure, and glucose. Patients with higher GGT
values had a more than 1.5-fold increased risk of total mortality
from cardiovascular disease (23,24).
GGT is an enzyme that transfers γ-glutamyl
functional groups. In relation to cardiovascular disease, GGT falls
under a new classification of ‘oxidative stress’ in view of its
role in the degradation of the antioxidant glutathione.
Furthermore, GGT hydrolyzes glutathione into glutamate and a
cysteinyl-glycine dipeptide, the latter acts as a strong reducing
agent of iron, with the stepwise development of the super-oxide ion
and hydrogen peroxide. Thus, GGT is involved directly in reactive
oxygen species generation as a pro-oxidant (25). GGT could likewise be considered a
proinflammatory marker.
We also tried to find the cutoff point for GGT as a
tool to assess risk of prehypertension. ROC analysis showed an
increased risk of hypertension when GGT exceeded 20 U/l. This is
the first report to identify a parameter for discriminating healthy
subjects from those at risk of prehypertension. According to our
results, GGT was found to be a more valuable biomarker in the
diagnosis of prehypertension than glucose, TC, TG, HDL and LDL.
One limitation of our study is its cross-sectional
nature, which precludes inferences of causation. This study was
conducted in several different districts, and samples were
collected at nearly the same time. Although several studies have
confirmed that GGT displays a polymorphism (26), we did not provide detection. The
strengths of our study included its population-based nature, and
stratification and ROC analyses.
In conclusion, GGT within the normal range is
associated with prehypertension in China. Thus, GGT may be used to
assess cardiovascular risk and plan appropriate treatment. Further
study of the mechanisms of GGT as it relates to hypertension may
provide a new understanding of how cardiovascular disease
develops.
Acknowledgements
This study was supported by the Ministry of Science
and Technology of P.R. China (The Basic Performance Key Project,
no. 2006FY110300). We acknowledge the assistance of Dr Yazhuo Wang
in the manuscript preparation.
Abbreviations:
|
GGT
|
γ-glutamyltransferase
|
|
BMI
|
body mass index
|
|
TC
|
total cholesterol
|
|
TGs
|
triglycerides
|
|
HDL
|
high density lipoprotein
cholesterol
|
|
LDL
|
low density lipoprotein
cholesterol
|
References
|
1
|
DS LeeJC EvansSJ RobinsGamma glutamyl
transferase and metabolic syndrome, cardiovascular disease, and
mortality risk: the Framingham Heart StudyArterioscler Thromb Vasc
Biol27127133200710.1161/01.ATV.0000251993.20372.4017095717
|
|
2
|
DH LeeDR Jacobs JrM
GrossGamma-glutamyltransferase is a predictor of incident diabetes
and hypertension: the Coronary Artery Risk Development in Young
Adults (CARDIA) StudyClin
Chem4913581366200310.1373/49.8.135812881453
|
|
3
|
G WannametheeS EbrahimAG
ShaperGamma-glutamyltransferase: determinants and association with
mortality from ischemic heart disease and all causesAm J
Epidemiol14269970819957572939
|
|
4
|
DH LeeMD GrossDR Jacobs JrAssociation of
serum carotenoids and tocopherols with gamma-glutamyltransferase:
the Cardiovascular Risk Development in Young Adults (CARDIA)
StudyClin Chem50582588200410.1373/clinchem.2003.02885214726472
|
|
5
|
E RuttmannLJ BrantH ConcinG DiemK RappH
UlmerGamma-glutamyltransferase as a risk factor for cardiovascular
disease mortality: an epidemiological investigation in a cohort of
163, 944 Austrian
adultsCirculation11221302137200510.1161/CIRCULATIONAHA.105.552547
|
|
6
|
AV ChobanianGL BakrisHR BlackThe Seventh
Report of the Joint National Committee on Prevention, Detection,
Evaluation, and Treatment of High Blood Pressure: the JNC 7
reportJAMA28925602572200310.1001/jama.289.19.2560
|
|
7
|
RS VasanMG LarsonEP LeipWB KannelD
LevyAssessment of frequency of progression to hypertension in
non-hypertensive participants in the Framingham Heart Study: A
cohort studyLancet35816821686200110.1016/S0140-6736(01)06710-1
|
|
8
|
JH HwangJY ShinB ChunAssociation between
gamma-glutamyltransferase and hypertension incidence in rural
prehypertensive adultsJ Prev Med Public
Health431825201010.3961/jpmph.2010.43.1.1820185979
|
|
9
|
T CelikUC YukselS KilicH YamanA IyisoyH
KaraerenThe relationship of gamma-glutamyltransferase to aortic
elastic properties in young patients with prehypertensionClin Exp
Hypertens32377384201010.3109/1064196100362852821029002
|
|
10
|
S StrangesM TrevisanJM DornJ DmochowskiRP
DonahueBody fat distribution, liver enzymes, and risk of
hypertension: evidence from the Western New York
StudyHypertension4611861193200510.1161/01.HYP.0000185688.81320.4d16203871
|
|
11
|
K MiuraH NakagawaH NakamuraSerum
gamma-glutamyl transferase level in predicting hypertension among
male drinkersJ Hum Hypertens844544919947916380
|
|
12
|
AE SchutteJM van RooyenHW HuismanHS
KrugerJH de RidderFactor analysis of possible risks for
hypertension in a black South African populationJ Hum
Hypertens17339348200310.1038/sj.jhh.100155312756407
|
|
13
|
R KawamotoK KoharaY TabaraT KusunokiN
OtsukaT MikiAssociation between serum gamma-glutamyl transferase
level and prehypertension among community-dwelling menTohoku J Exp
Med216213221200810.1620/tjem.216.21318987455
|
|
14
|
KJ GreenlundJB CroftGA MensahPrevalence of
heart disease and stroke risk factors in persons with
prehypertension in the United States, 1999–2000Arch Intern
Med16421132118200415505124
|
|
15
|
XJ QinHZ ShiMajor causes of death during
the past 25 years in ChinaChin Med J
(Engl)12023172320200718167226
|
|
16
|
Joint committee for developing Chinese
guidelines on prevention and treatment of dyslipidemia in
adultsZhonghua Xin Xue Guan Bing Za Zhi35390419200717711682
|
|
17
|
Y YamadaE IkaiI TsuritaniM IshizakiR
HondaM IshidaThe relationship between serum gamma-glutamyl
transpeptidase levels and hypertension: common in drinkers and
nondrinkersHypertens
Res18295301199510.1291/hypres.18.2958747307
|
|
18
|
E IkaiR HondaY YamadaSerum gamma-glutamyl
transpeptidase level and blood pressure in nondrinkers: a possible
pathogenetic role of fatty liver in obesity-related hypertensionJ
Hum Hypertens89510019947911531
|
|
19
|
A ShankarJ LiAssociation between serum
gamma-glutamyltransferase level and prehypertension among US
adultsCirc J7115671572200710.1253/circj.71.156717895553
|
|
20
|
A PaolicchiM EmdinC
PassinoBeta-Lipoprotein- and LDL-associated serum
gamma-glutamyltransferase in patients with coronary
atherosclerosisAtherosclerosis1868085200610.1016/j.atherosclerosis.2005.07.01216112119
|
|
21
|
C ThamerO TschritterM HaapElevated serum
GGT concentrations predict reduced insulin sensitivity and
increased intrahepatic lipidsHorm Metab
Res37246251200510.1055/s-2005-86141115952086
|
|
22
|
G WannametheeS EbrahimAG
ShaperGamma-glutamyltransferase: determinants and association with
mortality from ischemic heart disease and all causesAm J
Epidemiol14269970819957572939
|
|
23
|
E RuttmannLJ BrantH
ConcinGamma-glutamyltransferase as a risk factor for cardiovascular
disease mortality: an epidemiological investigation in a cohort of
163,944 Austrian
adultsCirculation11221302137200510.1161/CIRCULATIONAHA.105.552547
|
|
24
|
P GiralV RatziuJC ChapmanLetter regarding
article by Ruttmann et al, ‘gamma-Glutamyltransferase as a
risk factor for cardiovascular disease mortality: an
epidemiological investigation in a cohort of 163,944 Austrian
adults’Circulation113e299e300200616505183
|
|
25
|
M EmdinA PompellaA
PaolicchiGamma-glutamyl-transferase, atherosclerosis, and
cardiovascular disease: triggering oxidative stress within the
plaqueCirculation11220782080200510.1161/CIRCULATIONAHA.105.571919
|
|
26
|
GA RouleauA BazanowskiEH CohenG GuellaenJF
GusellaGamma-glutamyl transferase locus (GGT) displays a PvuII
polymorphismNucleic Acids
Res1611848198810.1093/nar/16.24.118482905445
|