Introduction
The majority of meningiomas can be well
differentiated from other brain lesions using conventional magnetic
resonance imaging (MRI) techniques, as they demonstrate unique
imaging characteristics that reveal their extracranial location,
dura matter conjunction and sinus involvement (1). However, 15% of meningiomas exhibit
atypical MRI features such as cystic and necrotic areas, ring-like
enhancement and parenchymal invasion, resembling malignant brain
lesions such as gliomas or metastatic brain tumors leading to false
radiological reports and misinterpreted treatment decisions
(2,3).
According to the World Health Organization’s (WHO)
histopathologic criteria, meningiomas are separated into three
grades: typical or benign meningioma (WHO grade I), atypical
meningioma (WHO grade II) and malignant (anaplastic) meningioma
(WHO grade III). Their occurrence rates are 90.5, 7.2 and 2.4%,
respectively (4).
Thus, distinction between malignant and benign brain
tumors may determine the aggressiveness of surgical resection, and
decide whether combined radiation therapy is necessary.
Several MRI modalities have been used for meningioma
differentiation from other intracranial brain tumors and their
characterization according to the various meningioma grades.
Diffusion-weighted MRI (DWI), perfusion-weighted MRI (PWI) and
proton magnetic resonance spectroscopy (1H-MRS) provide
additional structural and metabolic information (5–7).
1H-MRS alone can reach up to 82.5% accuracy (58.7–82.1%
CI), 100% sensitivity and 91.1% specificity on predicting tumor
type (8). With the advent of 3T MR
scanners into clinical practice there has been growing interest in
analyzing brain tumor spectra, as signal to noise ratio and
spatial, temporal and spectral resolution have remarkably been
improved compared to that of lower magnetic fields. To the best of
our knowledge, to date the metabolic characteristics of meningioma
on 1.5T MR scanners have been well discussed in the literature but
not on 3T.
1H-MRS studies of meningiomas have
repeatedly revealed an increase in alanine (Ala), choline (Cho) and
glutamate-glutamine complex (Glx), and decreased N-acetylaspartate
(NAA) and creatine (Cr) (9).
However, Ala and Glx concentrations are not always easy to evaluate
during clinical practice (10).
The aforementioned results of accuracy, sensitivity and specificity
should be expected to improve when using quantitative MRS methods
allowing for the determination of metabolite concentrations rather
than using the rather specific Cho/Cr and Cho/NAA ratios as a
measure of tumor activity (11).
Lactate (Lac) and lipids (Lip) are usually taken as proof of
nonbenign tumors, indicating intratumoral hypoxia and
micronecrosis, respectively. Lipids have been positively correlated
with the grade of malignancy of gliomas and metastatic brain
tumors; nevertheless the question is whether they indicate
malignancy in meningiomas as well. Qi et al (1) have suggested lipids as a useful
marker for evaluating the histopathologic grade of intracranial
meningiomas. However, those findings are still controversial and
only a few studies have elaborately investigated the lipid peak in
the diagnosis of meningioma.
Summing up, controversy still remains, since there
are several case studies reported in the literature pointing out
the problem of differential diagnosis between meningiomas and
metastatic tumors, especially when metastatic tumors have
radiological features that strongly suggest a primary tumor.
In this study, localized 1H-MRS was
performed on untreated tumors diagnosed as meningiomas, cerebral
metastasis and high-grade gliomas. Spectral characteristics of
those tumor types were investigated according to the histological
subtypes, retrospectively. We aimed to evaluate the metabolic
features of meningiomas and especially a distinct peak at 3.8 ppm,
for their early differentiation from other brain lesions in
clinical practice and primarily verify the ability or inability of
lipids and lactate to constitute an accurate index of meningioma
malignancy.
Materials and methods
Patients
A total of 50 patients aged 16–78 years with
untreated brain tumors were enrolled in the study at our
institution, after providing written informed consent. Patients
were examined by conventional MRI including contrast enhanced
imaging and 1H-MRS before contrast administration.
Seventeen intracranial meningiomas were studied and 33 of the most
frequent intracranial tumors; high-grade glioma (n=24) and
metastases (n=9), were included in the examined brain tumors for
comparison purposes. Histologic types of all tumor lesions were
confirmed by intraoperative biopsy after obtaining 1H-MR
spectra.
MRI and 1H-MRS protocol of
brain tumors
The study was performed on a 3-Tesla MRI unit (GE,
Healthcare, Signa® HDx) applying a standardized MRI and
MRS examination patient protocol and using a birdcage and an
8-channel phased-array head coil. Before 1H-MRS was
performed, sagittal and axial T1-weighted fast spin-echo (FSE)
(TR/TE/700/9.3 m/sec) and T1-weighted fluid attenuation inversion
recovery (FLAIR) images (TR/TE/3.000/9.2 m/sec), axial T2-weighted
FSE (TR/TE/2.640/102 m/sec) and coronal T2-weighted FSE
(TR/TE/2.920/102 m/sec), T2-weighted FLAIR (TR/TE/8.500/130 m/sec),
and multiple echo recombined gradient echo (MERGE) (TR=460 m/sec)
images were obtained for each patient using a slice thickness of 5
mm with a 1-mm gap. Diffusion-weighted MRI was performed via a
single shot, spin echo, echo planar sequence with b-value of 1.000
sec/mm2.
Subsequently, 1H-MRS studies were
performed using both proton brain exam (PROBE) single voxel (SV)
and two dimensional-multivoxel (2D-Chemical Shift Imaging)
spectroscopy packages before contrast administration to avoid
signal disturbance. Data were acquired using point-resolved
spectroscopy (PRESS) pulse sequence with phase encoding gradients
in two directions, automatic and manual shimming and Gaussian water
suppression. Measurement parameters used in single voxel technique
were 1.500/35 m/sec (TR/TE), voxel size was not less than 3.375
cm3 always carefully adjusted inside the tumor and 128
signal acquisitions (Nacq), whereas, measurement parameters used in
2D-CSI were 1.000/144 m/sec (TR/TE), 16×16 phase encoding steps,
10-mm section thickness and the field of view size was adjusted to
each patient’s brain anatomy. Spectra scans for both techniques
were accomplished approximately within 4–5 min each, including the
shimming procedure.
Measured spectra for each patient consisted of
healthy and pathologic brain regions. Inside the region of tumor
tissue, obvious necrosis, cyst, hemorrhage, edema, calcification
and normal appearing brain tissue were excluded from the voxel
whenever possible, in order to avoid false lesion estimation.
For voxel positioning, T1-weighted FSE, T2-weighted
FLAIR and T2-weighted imaging sequences in sagittal, axial and
coronal planes retrospectively, were preceded.
When 1H-MRS examination was completed,
contrast enhanced, T1-weighted FSE in axial plane and 3D FSPGR
sequences were performed for every patient enrolled in the
study.
Post processing of the raw spectral data included
baseline correction, frequency inversion and phase shift.
Statistical analysis
The main metabolites identified by 1H-MRS
were NAA at 2.0 ppm, Cr at 3.0 ppm, Cho-containing compounds at 3.2
ppm, myoinositol (mI), lactate as a doublet at 1.33 ppm and
methylene groups of lipids resonating between 0.8 and 1.4 ppm
(7–10). Patients were grouped according to
tumor type (meningioma, high-grade glioma and metastasis). Data
analysis was performed using the SPSS (v13) statistical software
package. Metabolite ratios were expressed as mean ± SD. Bivariate
correlation using 1-tailed Pearson’s correlation coefficient, was
employed to explore the relationship among meningioma and the other
solid brain lesions (meningioma vs. high-grade gliomas and
meningioma vs. metastasis). A P-value <0.05 was considered to be
statistically significant.
Results
After MRI and 1H-MRS examination, before
tumor resection, 17 patients were diagnosed as having meningioma,
24 as high-grade glioma (grade III and IV) and 9 as cerebral
metastases. All lesions were verified by post operative pathologic
examination and particularly for meningiomas; 1 was diagnosed as
atypical meningioma and 16 as typical meningiomas.
Metabolic findings associated with lesion
type
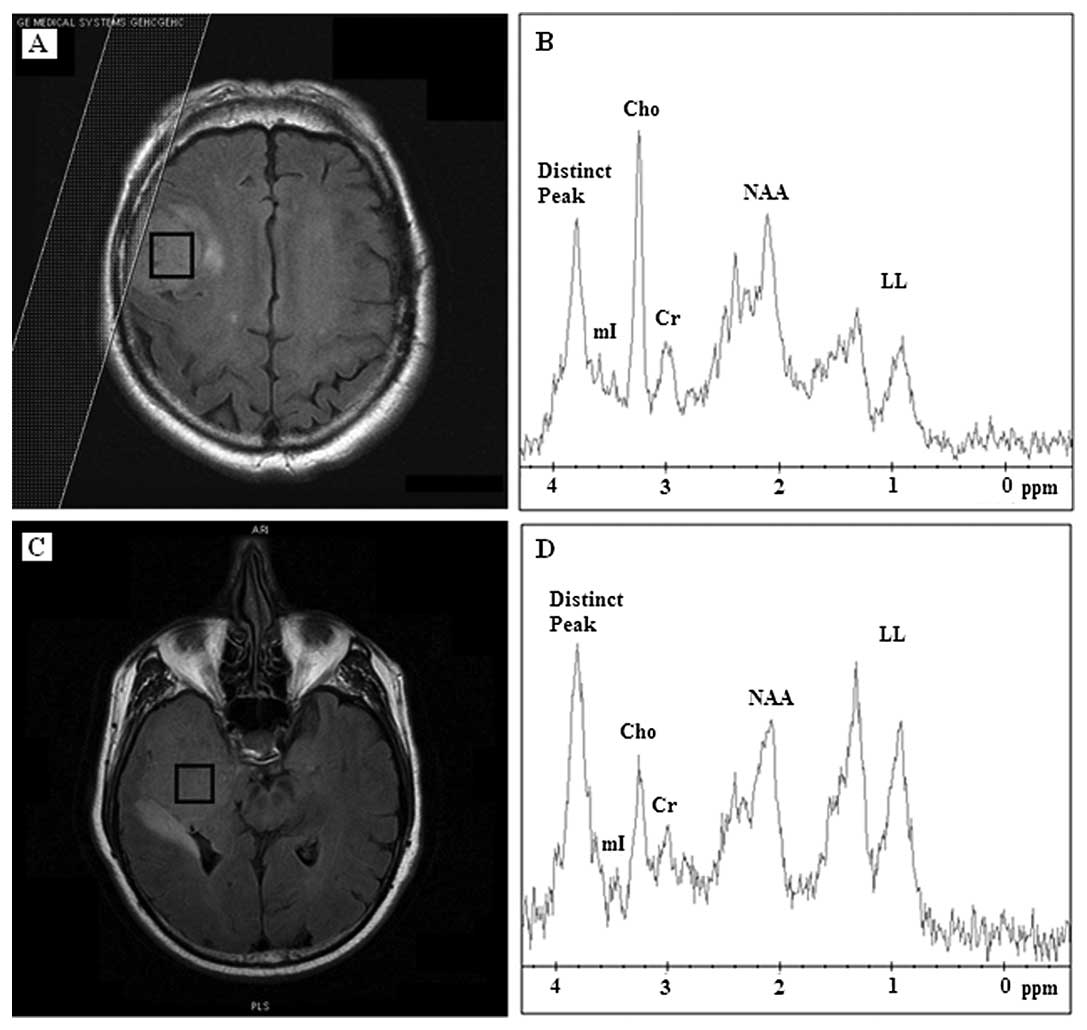
When short TE (35 m/sec) was performed, all 17
meningioma cases were characterized by increased levels of Cho and
by a distinct chemical compound resonating at 3.8 ppm (Fig. 1). Of the 17 meningiomas, 10 (59%)
revealed Cho contents and the distinct compound as the prominent
peaks. mI was absent or reduced to noise level in 10 (59%)
meningioma cases. Lipids and lactate (LL) were present in 13 (76%)
meningiomas whereas it was the dominant peak in 5 (38%) (Table I), which were classified as
atypical meningiomas before biopsy.
 | Table IMean values and standard deviation of
the tumor metabolite ratios as well as the 3.8 ppm peak, LL and Ala
findings at short TE (TE=35 m/sec) and Pearson’s correlation
results with the corresponding level of significance. |
Table I
Mean values and standard deviation of
the tumor metabolite ratios as well as the 3.8 ppm peak, LL and Ala
findings at short TE (TE=35 m/sec) and Pearson’s correlation
results with the corresponding level of significance.
| Metabolite ratios
(TE=35 m/sec) | Meningiomas (17
cases) mean ± SD | High-grade gliomas
(24 cases) mean ± SD | Solitary metastasis
(9 cases) mean ± SD | Meningioma vs.
high-grade glioma (R) | Meningioma vs.
metastasis (R) |
|---|
| NAA/Cr | 1.34±0.11 | 1.11±0.48 | 1.44±0.5 | 9.7% (0.19)a | 2.25%
(0.36)a |
| Cho/Cr | 1.19±0.73 | 1.76±0.48 | 1.46±0.58 | 14.5%
(0.03)b | 4.4%
(0.256)a |
| mI/Cr | 0.51±0.39 | 0.87±0.26 | 0.77±0.27 | 16% (0.05)b | 15% (0.15)a |
| Distinct peak | Present | Absent | Absent | 100%
(0.000)b | 100%
(0.000)b |
| at 3.8 ppm | 10/17 | 0/24 | 0/9 | | |
| LL (+) | 13/17 | 12/24 | 2/9 | | |
| LL (++) | 5/13 | 12/24 | 7/9 | | |
| LL (−) | 4/17 | - | - | | |
| Ala (+) | 4/17 | - | - | | |
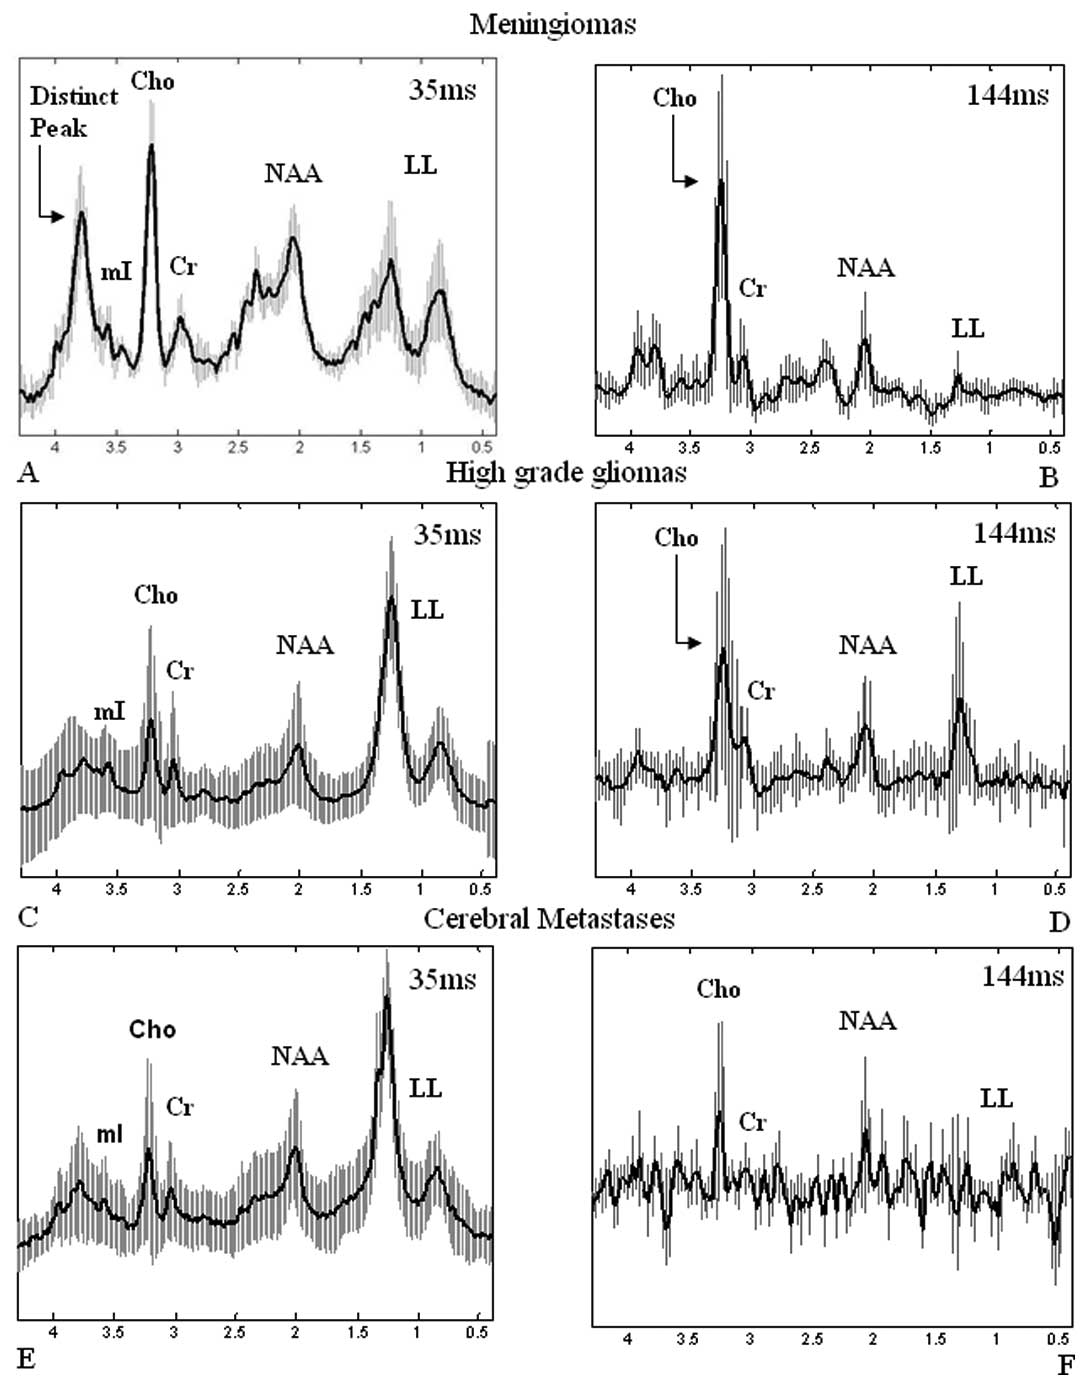
The mean spectrum at 35 m/sec from all 17
meningiomas accompanied with the standard deviation is illustrated
in Fig. 2A highlighting the
variability among meningioma spectra and the presence of the
distinct chemical compound at 3.8 ppm.
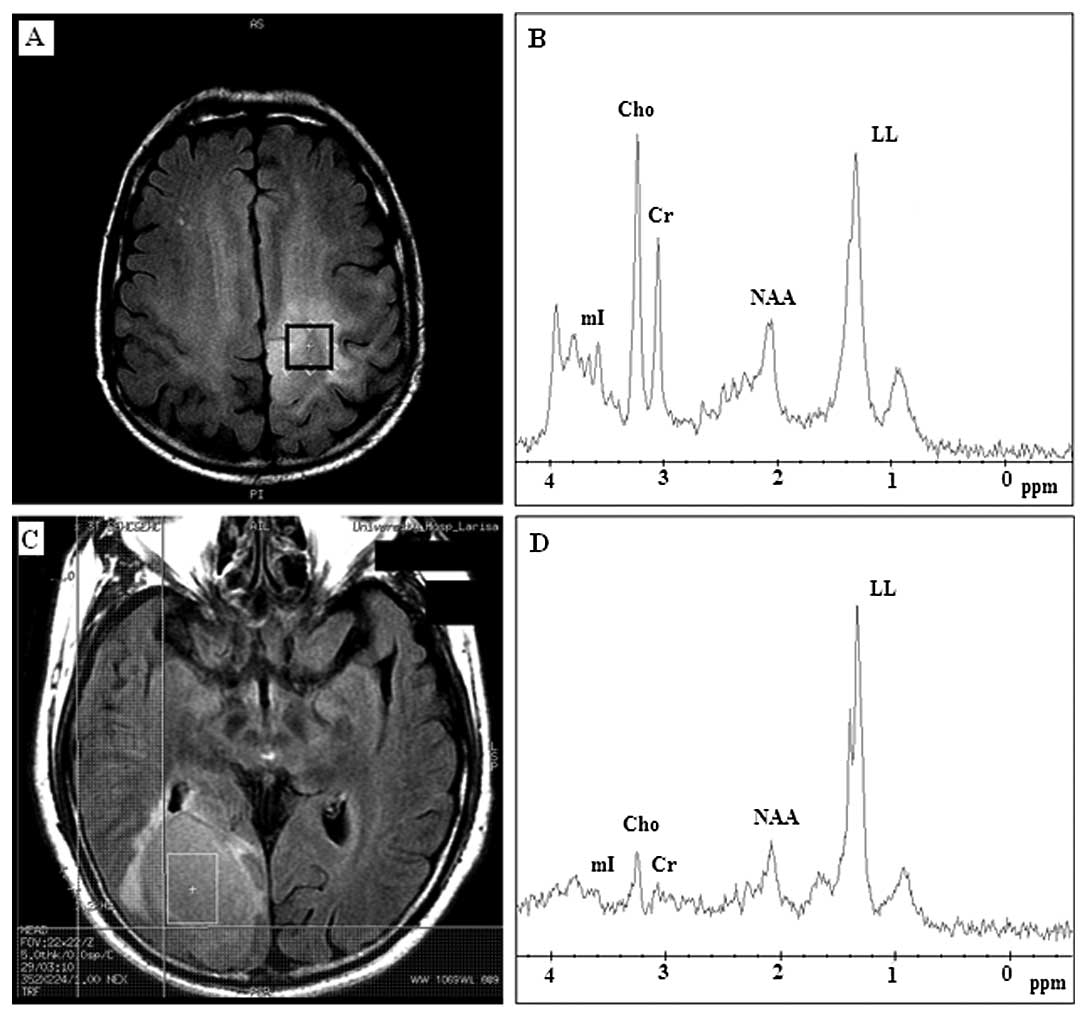
All 24 cases of high-grade gliomas (grade III and
IV) appeared with high lipid and lactate peaks and low or absent
NAA (Fig. 3B). Twelve out of
twenty-four (50%) high-grade gliomas exhibited a dominant lipid
peak, indicative of extensive necrosis, obscuring all the other
metabolite peaks, whereas the other half (50%) appeared with high
levels of Cho and lactate suggesting tissue hypoxia. mI was
observed to be increased for high-grade gliomas.
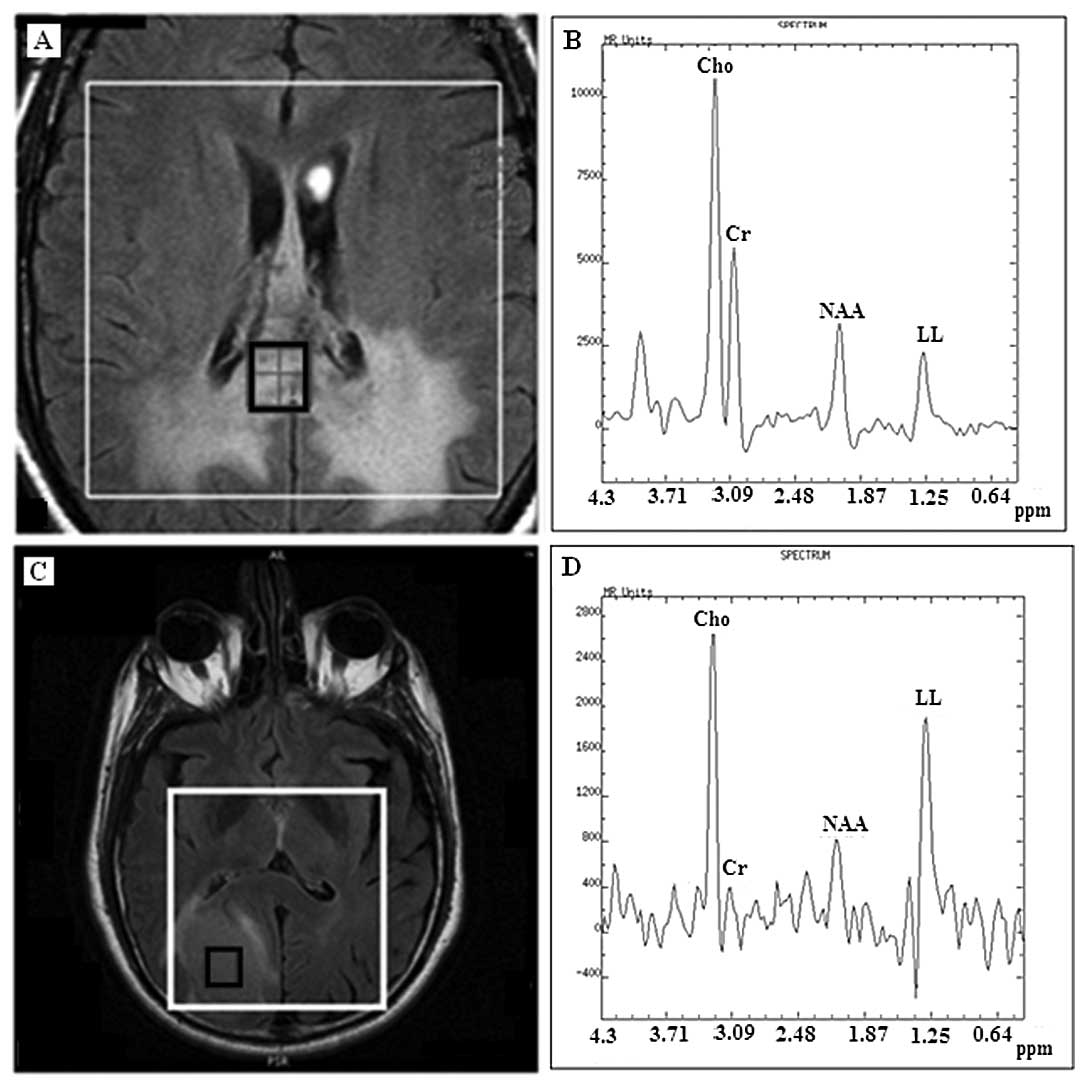
In 7 (77%) cases of metastasis, dominant lipid and
lactate peaks were detected (Fig.
3D), and in 2 cases (22%), high levels of Cho were found,
whereas NAA was only present in 2 (22%) cases. The distinct
resonant peak at 3.8 ppm observed in meningioma spectra was not
revealed in high-grade gliomas or in metastatic cerebral
tumors.
When long TE (144 m/sec) was performed, NAA and Cho
content were more accurately determined, as both chemicals have
long T2 time. Thirteen out of 17 (76%) meningiomas revealed high
concentrations of Cho-containing compounds (Fig. 4B); the LL peak was present only in
4 (23%) (Table II). NAA was
present in 14 (82%) meningioma cases. Among them only 6 cases had a
little brain substance involved in their voxels, including 2
meningiomas that invaded adjacent brain. The other 8 cases had
their voxels completely limited within the tumors (Fig. 4A). On the other hand, among the
cases that did not demonstrate NAA, 3 cases had their voxels
contaminated by a small amount of brain substance. Alanine was
observed in 4 (23%) cases of the 17 meningiomas on both short and
long TE (Tables I and II), but it was better identified at long
TE as an inverted douplet peak (Fig.
4B), however, its detection rate was low either for short or
long TE.
| Table IIMean values and standard deviation of
tumor metabolite ratios as well as the 3.8 ppm peak, LL and Ala
findings at long TE (TE=144 m/sec) and Pearson’s correlation
results with the corresponding level of significance. |
Table II
Mean values and standard deviation of
tumor metabolite ratios as well as the 3.8 ppm peak, LL and Ala
findings at long TE (TE=144 m/sec) and Pearson’s correlation
results with the corresponding level of significance.
| Metabolite ratios
(17 cases) (TE=144 m/sec) | Meningiomas (24
cases) mean ± SD | High-grade gliomas
(9 cases) mean ± SD | Solitary metastasis
high-grade glioma mean ± SD | Meningioma vs. vs.
metastasis (R) | Meningioma (R) |
|---|
| NAA/Cr | 1.21±0.86 | 1.06±0.38 | 2.7±1.26 | 1.6% (0.25)a | 34% (0.037)b |
| Cho/Cr | 4.64±2 | 2.52±0.75 | 2.37±0.62 | 39% (0.000)b | 22% (0.086)a |
| Cho/NAA | 4.46±2.2 | 2.6±1.31 | 0.81±0.23 | 21.5%
(0.004)b | 50% (0.005)b |
| Distinct peak | Absent | Absent | | | |
| at 3.8 ppm (−) | 0/17 | 0/24 | | | |
| LL (+) | 4/17 | 11/24 | | | |
| LL (−) | 13/17 | 13/24 | | | |
| Ala (+) | 4/17 | - | | | |
Increased Cho was found in 19 (79%) out of 24 cases
of high-grade gliomas (Fig. 5B)
and in 5 (55%) out of 9 cases of metastatic tumors (Fig. 5D).
Fig. 2 represents
all mean spectra with their corresponding deviations from the mean
for meningiomas, high-grade gliomas and metastases verifying the
overall metabolic findings according to tumor group and
highlighting the presence of the distinct chemical compound at 3.8
ppm for meningiomas (Fig. 2A), and
the lack of that peak at the short TE spectra in the other tumors
(Fig. 2C and E).
Metabolite ratio for the differentiation
of meningioma from other brain tumors
Additionally, Tables
I and II exhibit metabolite
ratios (mean ± SD) and the determination coefficients (R)-derived
from 1-tailed Pearson’s correlation coefficient to investigate
their ability to differentiate meningiomas from other solid brain
tumors. 1H-MRS in short TE (TE=35 m/sec) revealed a high
mean NAA/Cr ratio (1.34±0.11) for meningiomas, due to voxel
contamination with brain neurons. High-grade gliomas indicated the
highest mean Cho/Cr (1.76±0.48) and mean mI/Cr (0.87±0.26) ratios,
among meningiomas and metastases, whereas, meningiomas revealed the
lowest mI/Cr ratio (0.51±0.39) among high-grade gliomas and
metastases.
When long TE (TE=144 m/sec) was performed, mean
Cho/Cr (4.64±2) and mean Cho/NAA (4.46±2.2) ratios were higher for
meningiomas, whereas metastatic brain tumors revealed the highest
mean NAA/Cr (2.7±1.26) ratio among the other tumor types.
It was concluded that when short TE (TE=35 m/sec)
was implemented, the variability in Cho/Cr accounted for 14.5%
(P<0.03) in differentiating between meningiomas and high-grade
gliomas, whereas, NAA/Cr did not allow their significant
differentiation. Moreover, the mI/Cr ratio accounted for 16% (0.05)
in discriminating meningiomas from high-grade gliomas, while the
presence of the distinct peak at 3.8 ppm appeared to have the
highest and most statistically significant correlation in
differentiation of meningiomas from all studied brain tumors
(Table I). None of the metabolite
ratios allowed the significant differentiation between meningiomas
and cerebral metastases. However, when long TE (TE=144 m/sec) was
performed, it was observed that NAA/Cr accounted for 34%
(P<0.037) of the differentiation among meningiomas and
metastases, while Cho/Cr and Cho/NAA accounted for 39% (P<0.001)
and 21.5% (P<0.004), respectively, for
differentiating meningiomas from high-grade gliomas while Cho/NAA
accounted for 50% (P<0.005) for differentiating meningiomas from
metastases (Table II).
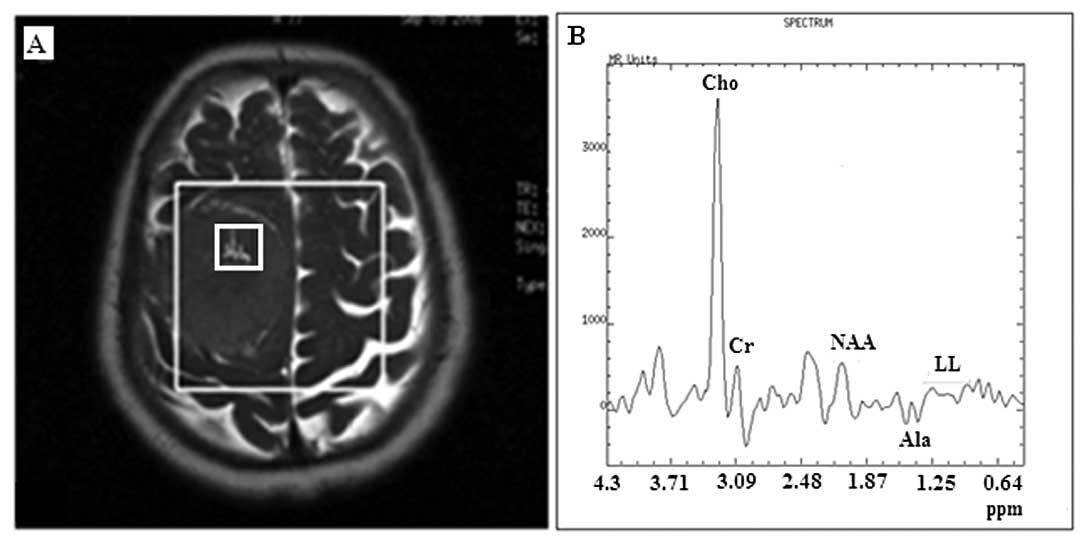
Lipids and lactate as an index of
meningioma malignancy, after tumor resection
Dominant lipid and lactate peaks were observed in 5
meningiomas (38%) which were diagnosed as atypical, before tumor
resection. All the appropriate measures were taken to avoid voxel
contamination by subcutaneous fat. More specifically, in cases
where the lesions were close to the skull; i) the voxel grid was
designed and applied on axial images that accommodated the
positioning as far as possible from the scull and ii) signal
saturation bands were carefully adjusted to annihilate voxel signal
contamination from the adjoined subcutaneous fat (Fig. 1A), due to the chemical shift effect
and the non-square nature of the voxel-selected pulses used in the
PRESS sequence. Among the aforementioned meningiomas, only one
proved to be anaplastic with observed micronecrosis. Lipids and
lactate did not reveal a statistically significant index to
differentiate typical from atypical meningiomas. Their occurrence
accounted only for 12.7% for differentiating typical from atypical
meningiomas with low level of significance. Histopathological
findings and the corresponding correlation coefficient are depicted
in Table III.
| Table IIIHistological results of the
meningiomas classified as atypical before biopsy and 1-tailed
Pearson’s correlation endpoint of lipid occurrence and meningioma
malignancy, with the corresponding level of significance. |
Table III
Histological results of the
meningiomas classified as atypical before biopsy and 1-tailed
Pearson’s correlation endpoint of lipid occurrence and meningioma
malignancy, with the corresponding level of significance.
| Lipid presence in
meningiomas (TE=35 m/sec) | Histopathologic
(WHO) | Histologic
subtype | Lipid and lactate
finding occurrence vs. meningioma malignancy (R) |
|---|
| Case 1/65/M | Typical (WHO grade
I) | Meningothelial | |
| Case 2/78/M | Typical (WHO grade
I) | Fibroblastic | |
| Case 3/67/M | Atypical (WHO grade
III) | Papillary | 12.7%
(0.357)a |
| Case 4/86/F | Typical (WHO grade
I) | Meningothelial
(microcystic) | |
| Case 5/54/M | Typical (WHO grade
I) | Fibroblastic | |
Discussion
Meningiomas are common intracranial tumors and are
generally diagnosed by their characteristic radiological imaging
appearance of solid mushroom imaging pattern, extracranial
location, dura matter conjunction and sinus involvement. They
constitute 20% of all intracranial tumors and they are classified
as typical, atypical and malignant histological variants according
to the presence of increased mitotic activity, high cellularity and
necrosis. However, 15% of meningiomas exhibit rim-like enhancement,
a prominent cystic component, hemorrhage, or even metaplasia
(2,3), posing an atypical radiological
pattern. These meningioma types mimic gliomas or cerebral
metastatic tumors with cystic or necrotic alterations. Furthermore,
the dural sign is not a specific finding for extra-axial tumors
only because it may also be observed in metastases and glial tumors
(2,10,12).
Thus, using conventional MRI techniques, some high-grade glial
tumors and metastases may pose difficulties in differentiation from
meningiomas when they are located close to leptomeninges or remote
from the intra-axial region together with the presence of dural
invasion, or have cystic or/and necrotic components, leading to
false radiological reports and treatment decision.
Several studies are dedicated to the differentiation
of meningiomas among other solid brain lesions using various MRI
techniques such as conventional MRI, DWI, PWI and MRS (2-7).
1H MRS is a non-invasive techniquie of
showing the biochemical content of living tissue, which provides
additional information regarding the metabolism of cerebral tumors
which can be useful in diagnosis, tumor extent prior to surgery or
post treatment progress evaluation.
Previously reported MRS findings of brain tumors
overall include a decrease in NAA, a marker of neuronal integrity;
an increase in Cho involved in increased cell membrane and myelin
turn over and a decrease in Cr, which provides inorganic phosphates
for adenosine triphosphate production involved in cellular
energetics and osmotic balance (7). The presence of lactate and lipid
peaks are usually consistent with the aggressive tumors, reflecting
increased anaerobic metabolism and cellular necrosis, respectively.
Elevated alanine resonances, although characteristic of
meningiomas, are not found in all meningiomas and seem to correlate
inversely with necrosis within these tumors (13).
Instead of the aforementioned metabolite
quantitation, many studies use metabolite peak area ratios to
describe changes in the metabolic profile. An advantage of ratios
is that the effects of a general reduction in the measured
metabolite concentrations due to variations in cellular density
(cause by necrosis for example) will cancel out.
In the present study, all studied 50 untreated solid
brain lesions exhibited high concentrations of Cho and lactate, and
decreased or absent amounts of NAA (Fig. 2). Lipids were present in high-grade
gliomas, metastases and meningiomas due to extensive necrosis or
fatty degeneration, in agreement with previous research (14). We sought to detect distinct
features of meningioma spectra that accurately separate them from
high-grade gliomas and solitary metastases.
NAA is the major contributor of the peak at 2.02 ppm
in normal brain as it is present within neurons and it is usually
taken as a marker of neurons.
It is generally considered that in meningiomas, by
definition NAA is not observed, since this lesion is extra-axial
and NAA is a neuron-specific marker (13). This is consistent with previous
in vitro analysis of meningioma extracts for which NAA was
not detected (15). However, in
our short TE spectra, meningiomas revealed a quite high mean NAA/Cr
ratio, which can be ascribed to the partial volume effect of the
brain. This may account for some of our cases whose voxels enclosed
adjacent healthy brain parenchyma. However, this result cannot
explain other cases whose voxels were completely located within the
tumor. On the other hand, although in certain cases, voxels were
indeed contaminated by normal brain parenchyma, NAA peaks were not
evident at all. This probably indicates that partial volume effect
may not be the only source of sufficient NAA signals. This
observation is in good agreement with Yue et al (14) who mention that a peak of NAA at
2.02 ppm of meningioma spectra collected, may also represent other
endogenous NAA compounds such as N-acetylaspartylglutamate,
N-acetylneuraminic acid and N-acetylgalactosamine of
meningiomas.
Studying the metabolic profile of different cerebral
tumors, Howe et al found that low levels of mI were
characteristic of meningiomas (10). In the present study, meningiomas
also revealed the lowest mI/Cr ratio in comparison with the other
brain lesions.
Furthermore, from our spectroscopic data analysis it
is evident that all meningiomas revealed a distinct signal at 3.8
ppm (Fig. 2), which can be
considered characteristic in differentiating them from other
cerebral lesions, obviously, due to the underlying metabolic
differences. Hence this distinct metabolic characteristic can
establish a rather specific marker in differential diagnosis of
meningiomas during clinical routines.
This chemical substance observed at 3.8 ppm in short
TE, might correspond to Glx-a peak or Glx together with glutathione
(12,14,16),
Majos et al graphically demonstrated an elevation of Glx-a
in meningiomas compared to other brain masses (16). Theoretically, if the 3.8 peak
corresponded to Glx, then there should be a correlation between the
2.35 multiplet signal and that at 3.8 ppm, an observation which was
not verified in our study. Tugnoli et al (17) elaborately identified the in
vitro metabolic patterns of 6 meningioma subjects by
implementing high resolution magic angle spinning (HR-MAS) MRS and
compared them with in vivo 1H-MRS results at 3T.
They revealed that it is possible to differentiate among different
meningioma subtyptes (fibrous, oncocytic and meningothelial) as
they exhibit different metabolic characteristics. Both in
vivo and in vitro studies showed the absence of NAA in
accordance with the extracerebral origin of meningiomas. Only
oncocytic and meningothelial exhibited a distinct peak at 3.8 ppm
which according to their ex vivo study receives contribution
from phosphoethanolamine (PE) and amino acids, such as leukine,
alanine, glutamate, glutamine, glutathione, lysine, arginine and
serine. Moreover, Tugnoli et al (17) reported that the resonances of
CH2OH in glycine are also found at 3.8 ppm, and these
data suggest the presence of oligosaccharides, probably maltotriose
and maltotetraose, which are small sugars detected very rarely by
MRS in human meningiomas. Our results in short TE MRS verify this
finding.
When long TE was performed, meningiomas revealed the
highest mean Cho/Cr ratio among all intracranial tumors and the
highest Cho/NAA due to both Cho increment and NAA reduction. Howe
et al (10) also observed
the highest Cho/Cr ratio for meningiomas (n=8), when compared with
grade II astrocytomas (n=5), AAs (n=7), GBMs (n=13) and metastases
(n=9). On the other hand, in our study, Ala was only present in
4/17 meningiomas, confirming the findings of other studies, that it
is not always detectable (4). It
has been suggested that the presence of Ala indicates that the
metabolism of meningiomas involves partial oxidation of glutamine
rather than glycolysis. Thus, the varying metabolic profiles of
meningiomas, high-grade gliomas and metastases, indicate
differences in cell type and metabolism (10). As observed in Fig. 4, a long TE allows Ala
identification, because its doublet is inverted due to the
J-coupling phase modulation, making it easier to differentiate this
resonance from lipids and other macromolecules (5).
Nevertheless a factor that may explain the variance
of Ala is the voxel size (12).
The in vitro study of Christiansen et al (18) demonstrated that metabolite signal
on 1H-MRS significantly correlated (r=0.99) with
concentration and selected voxel size (r=1). However, it is not
always easy to select a fairly big voxel as shimming worsens.
Therefore, when voxel size is limited because a meningioma is small
or heterogeneous, it is not surprising that Ala may not be
detected.
The diagnostic accuracy of NAA/Cr and Cho/Cr ratios
in differentiating meningiomas from all other solid brain lesions
was limited when short TE was used. However, the NAA/Cr ratio did
significantly distinguish meningiomas from cerebral metastases and
the Cho/Cr ratio distinguished meningiomas from high when long TE
was performed. Overall, the Cho/NAA ratio in long TE was the most
significant MRS ratio in the differentiation of meningiomas from
metastases mainly due to both Cho intense increase and NAA intense
decrease in the meningioma cases. Fountas et al (19) mentioned that the differentiation of
metastases and meningiomas is very difficult using MRS alone,
because of spectral similarities referring to the absence of NAA
and low concentrations of Cr. However, in the present study the
NAA/Cr ratio in long TE accounted for 34% (0.037) in
differentiating meningiomas from metastases.
The distinct peak of the chemical substance
resonating at 3.8 ppm accounts for 100% in discriminating
meningiomas from high-grade gliomas and metastases (Table I) in short TE. Thus, as Ala is
rarely distinguished or ambiguously determined, this peak at 3.8
ppm may play a determinant role for the recognition of
meningiomas.
Previous studies have correlated the amount of
lipids and the presence of micronecrosis and concluded that
micronecrosis was highly indicative of nonbenign meningiomas
(1,4). In the current study, however, lipids
and lactate as the dominant peaks were observed in 5 meningioma
cases but micronecrosis was only present in 1 malignant meningioma
after tumor histopathological examination. Using 1-tailed Pearson’s
correlation test, lipids and lactate did not correlated well with
meningioma malignancy (Table
III). Micronecrosis was not observed in any of the 4/5
meningiomas which demonstrated lipid resonances. Thereby, it is
suggested that there is a great possibility that lipid resonances
do not correlate with meningioma malignancy as observed in this
particular study. Other studies also have detected that lipids were
not uncommon among benign meningiomas (17), whereas micronecrosis was rare.
Thus, there may be other pathological changes responsible for
lipids in benign meningiomas and that probably is microcystic
changes or fatty degeneration (14). Lipid accumulation has been observed
in microcystic meningiomas that exhibit predominant microcystic
changes (14). On the other hand,
lipids detected in the lipomatous meningiomas should be attributed
to fatty degeneration because of intratumoral adipocyte-like cells
(14). It will be valuable though,
to investigate whether Cho levels can predict meningioma malignancy
together with lipid presence.
There are some limitations in the present study.
Firstly, in order to show intense differences in meningioma spectra
which are immediately visible during clinical routine, we focused
on a qualitative spectral evaluation and not on a quantitative
analysis. Thereby, evaluation of lipids and NAA/Cr ratio may have
contributions from signals of alanine and Glx, respectively, and
also of several macromolecules. Cr concentration levels used as
reference for ratio calculation were derived from the pathological
region. Cr levels are supposed to be stable among lesions; however,
several studies have shown that the Cr concentration tends to
decrease with tumor malignancy (1,4). As
a result, the calculated ratios of the study that highlighted NAA
decrease or Cho increment might have been overestimated. Finally,
another factor that needs to be taken into account is that newly
diagnosed meningiomas were not separated from recurrent ones, so no
metabolic differences between them were taken into account. A study
of Shimizu et al (20),
reported that new meningiomas had higher Cho/Cr ratios than did
recurrent ones.
The present results indicate the usefulness of
1H-MRS in the differentiation of meningiomas from other
solid brain tumors in terms of distinct metabolic features and
moreover, whether lipids constitute a useful index to predict
meningioma malignancy. Our results can be concluded as follows: i)
the presence of a high peak at 3.8 pmm on short TE spectra may
provide a distinct metabolic feature for the differentiation of
meningiomas among other cerebral lesions. Ala also represents a
distinct feature of the metabolic pattern of meningioma, but it
only appeared in 30–40% of cases and seems to be dependent on voxel
size and positioning. ii) Cho/Cr and Cho/NAA ratios can also be a
possible index for meningioma differentiation when long TE is
performed. Thus, acquiring both short and long TE spectra would
increase metabolic information for differential diagnosis. iii)
Lipids and lactate do not always represent an index of
micronecrosis, and therefore it cannot be taken as a proof of
meningioma malignancy. Especially when voxels are located very
close to the skull and mastoid, the spectra may be unavoidably
contaminated by lipids due to the chemical shift and the non-square
nature of the voxel-select pulses used in the PRESS sequence.
Acknowledgements
This study was supported by a Fund from the Greek
Ministry of Health (no. 4021).
References
|
1
|
ZG QiYX LiY WangLipid signal in evaluation
of intracranial meningiomasChin Med J
(Engl)12124152419200819102960
|
|
2
|
B HakyemezN YildirimC ErdoganH KocaeliE
KorfaliM ParlakMeningiomas with conventional MRI findings
resembling intraaxial tumors: can perfusion-weighted MRI be helpful
in
differentiation?Neuroradiology48695702200610.1007/s00234-006-0115-y
|
|
3
|
I HartingM HartmannMM BonsantoC SommerK
SartorCharacterization of necrotic meningioma using diffusion MRI,
perfusion MRI, and MR spectroscopy: case report and review of the
literatureNeuroradiology46189193200410.1007/s00234-003-1144-415034700
|
|
4
|
MK DemirAC IplikciogluA DincerM ArslanA
SavSingle voxel proton MR spectroscopy findings of typical and
atypical intracranial meningiomasEur J
Radiol604855200610.1016/j.ejrad.2006.06.00216844335
|
|
5
|
CG FilippiMA EdgarAM UlugJC ProwdaLA
HeierRD ZimmermanAppearance of meningiomas on diffusion-weighted
images: correlating diffusion constants with histopathologic
findingsAJNR Am J Neuroradiol226572200111158890
|
|
6
|
A NakamizoT InamuraS
YamaguchiDiffusion-weighted imaging predicts postoperative
persistence in meningioma patients with peritumoural abnormalities
on magnetic resonance imagingJ Clin
Neurosci10589593200310.1016/S0967-5868(03)00093-6
|
|
7
|
DP SoaresM LawMagnetic resonance
spectroscopy of the brain: review of metabolites and clinical
applicationsClin
Radiol641221200910.1016/j.crad.2008.07.00219070693
|
|
8
|
A ServerR JosefsenB KulleProton magnetic
resonance spectroscopy in the distinction of high-grade cerebral
gliomas from single metastatic brain tumorsActa
Radiol51316325201010.3109/02841850903482901
|
|
9
|
NA SibtainFA HoweDE SaundersThe clinical
value of proton magnetic resonance spectroscopy in adult brain
tumoursClin
Radiol62109119200710.1016/j.crad.2006.09.01217207692
|
|
10
|
FA HoweSJ BartonSA CudlipMetabolic
profiles of human brain tumors using quantitative in vivo 1H
magnetic resonance spectroscopyMagn Reson
Med49223232200310.1002/mrm.1036712541241
|
|
11
|
PE SijensResponse to article ‘Proton
magnetic resonance spectroscopy in the distinction of high-grade
cerebral gliomas from single metastatic brain tumors’Acta
Radiol513263282010
|
|
12
|
YD ChoGH ChoiSP LeeJK Kim(1)H-MRS
metabolic patterns for distinguishing between meningiomas and other
brain tumorsMagn Reson
Imaging21663672200310.1016/S0730-725X(03)00097-312915198
|
|
13
|
M CastilloL KwockClinical applications of
proton magnetic resonance spectroscopy in the evaluation of common
intracranial tumorsTop Magn Reson
Imaging10104113199910.1097/00002142-199904000-0000310551625
|
|
14
|
Q YueT IsobeY ShibataNew observations
concerning the interpretation of magnetic resonance spectroscopy of
meningiomaEur
Radiol1829012911200810.1007/s00330-008-1079-618641997
|
|
15
|
I BarbaA MorenoI Martinez-PerezMagnetic
resonance spectroscopy of brain hemangiopericytomas: high
myoinositol concentrations and discrimination from meningiomasJ
Neurosurg945560200110.3171/jns.2001.94.1.005511147898
|
|
16
|
C MajosM Julia-SapeJ AlonsoBrain tumor
classification by proton MR spectroscopy: comparison of diagnostic
accuracy at short and long TEAJNR Am J
Neuroradiol2516961704200415569733
|
|
17
|
V TugnoliL SchenettiA MucciEx vivo HR-MAS
MRS of human meningiomas: a comparison with in vivo 1H MR
spectraInt J Mol Med18859869200617016616
|
|
18
|
P ChristiansenO HenriksenM StubgaardP
GideonHB LarssonIn vivo quantification of brain metabolites by
1H-MRS using water as an internal standardMagn Reson
Imaging11107118199310.1016/0730-725X(93)90418-D8423713
|
|
19
|
KN FountasEZ KapsalakiSD GotsisIn vivo
proton magnetic resonance spectroscopy of brain tumorsStereotact
Funct Neurosurg748394200010.1159/00005646711251398
|
|
20
|
H ShimizuT KumabeT TominagaNoninvasive
evaluation of malignancy of brain tumors with proton MR
spectroscopyAJNR Am J Neuroradiol1773774719968730195
|