Introduction
Type 2 diabetes mellitus (T2DM) is a complex
polygenic disease, commonly resulting from defects in insulin
secretion and diminished sensitivity of target tissues to insulin
(1). β-cell dysfunction is a
fundamental characteristic of T2DM development, and it leads to
quantitative and qualitative abnormalities in insulin secretion,
abnormalities in the kinetics of insulin secretion and progression
of the defects with time (2).
MicroRNAs (miRNAs) are endogenous small non-coding
RNAs (~22 nucleotides), which are involved in post-transcriptional
control of gene expression (3).
They directly control the expression of a large portion of the
human genome and are involved in the regulation of major cellular
activities, including metabolism, differentiation, proliferation
and apoptosis (4,5). miRNAs have been suggested to have a
role in multiple human diseases (6) and increasing evidence has shown that
miRNAs are also involved in the pathogenesis of metabolic diseases,
including diabetes mellitus. Previous studies have revealed that
miRNAs, including miR-375, miR-9 and miR-124a,
are important regulators of specialized β-cell functions (7–10).
It has been shown that miR-375, a pancreatic islet-specific
miRNA, regulates insulin secretion through direct inhibition of
insulin exocytosis (7). High
levels of miR-375 are found in the pancreatic islet of obese
(ob/ob) mice and have been shown to regulate glucose homeostasis
(8). One study demonstrated that
upregulated pancreatic miR-375 is a useful biomarker for
pathways in the pathogenesis of T2DM associated with islet amyloid
deposition and β-cell deficit (11). These findings suggest that
miR-375 regulates the function of β cells in T2DM, but the
exact role of miRNA-375 in T2DM has yet to be
elucidated.
Previous studies have also investigated the role of
epigenetics in the pathogenesis of T2DM (12,13).
Epigenetic modifications, particularly DNA hypermethylation, have
been found to have a role in the regulation of genes important for
protection against T2DM. miR-375 is encoded in the
intergenic region and has an independent promoter containing CpG
islands, which provides a basis for the regulation of its
expression by methylation. Therefore, it was hypothesized that
aberrant methylation of the human miR-375 promoter may lead
to abnormal expression, thereby causing β-cell dysfunction, and
ultimately participate in the pathogenesis of the T2DM. This has
already been previously demonstrated in certain types of cancer
(14–16).
In China, the Kazak population has a significantly
higher proportion of overweight individuals and a higher incidence
of insulin resistance and hypertension compared with the Han
population (17). Furthermore, the
Kazak population are known to consume more meat and fewer
vegetables than the Han population. However, the prevalence of T2DM
in the Kazak population is only 3.65%, which is lower compared with
the Han population in the same region (17). This suggests that the Kazak
population may have a unique genetic background, and was the basis
for the investigations in this study. It was hypothesized that the
expression level and CpG methylation status of miR-375 may
be important in the incidence and severity of T2DM. The changes in
miR-375 expression level and the quantitative methylation
status of CpG within the miR-375 promoter were assessed to
determine whether aberrant promoter methylation of miR-375
was present in patients with T2DM. The findings may lead to the
identification of a novel biomarker for the diagnosis of T2DM.
Materials and methods
Subjects
This study was prospectively performed and approved
by the Institutional Ethics Committees of the First Affiliated
Hospital of Shihezi University School of Medicine (Shihezi,
Xinjiang, China) and conducted in accordance with the ethical
guidelines of the Declaration of Helsinki. Written informed consent
was obtained from all individuals prior to the start of the study.
Individuals of Chinese Kazak origin with T2DM (n=100) and healthy
controls with normal glucose tolerance (NGT; n=100) were recruited
from the Department of Endocrinology and Metabolism at the First
Affiliated Hospital of Shihezi University School of Medicine
between 2010 and 2011. Diagnosis of T2DM was based on the World
Health Organization criteria as fasting glucose levels ≥7 mmol/l
(126 mg/dl), 2 h oral glucose tolerance test glucose levels ≥11.1
mmol/l (200 mg/dl) or clinical diagnosis of the disease. Patients
with T2DM (54 male and 46 female; mean age, 51.33±11.75 years) were
recruited when they were hospitalized for treatment for poor
glycemic control. Individuals who came for a health checkup in the
hospital were recruited as healthy controls (44 male and 56 female;
mean age, 48.55±12.41 years). Any individuals who may have had an
infectious disease prior to or during the recruitment were excluded
from this study, as well as patients with autoimmune diseases.
Nucleic acid isolation
RNAs were isolated from peripheral plasma samples
from patients with T2DM and controls with NGT using the miRNeasy
Mini kit 50 (Qiagen, Hilden, Germany) and genomic DNA was isolated
from peripheral plasma using the DNeasy Blood and Tissue kit
(Qiagen) in accordance with the manufacturer’s instructions. The
RNA and DNA were quantified by measuring their absorption at 260 nm
(Toption Instrument Co., Ltd., Xi’an, China).
Reverse transcription and quantitative
polymerase chain reaction (qPCR)
The TaqMan® microRNA Reverse
Transcription kit (Applied Biosystems®, Foster City, CA,
USA) was used for complementary DNA synthesis. For reverse
transcription, 10 μl TaqMan Universal PCR Master Mix (Applied
Biosystems) and 5 μl total RNA were reverse transcribed at 16ºC for
30 min, 42ºC for 30 min, and 85ºC for 5 min. miR-375
expression was quantified in triplicate using qPCR using the ABI
Prism 7300 Sequence Detection System (Applied Biosystems). Taqman
primers and probes for the target gene miR-375 and the
internal control miRNA-16, which is often used as a normalization
control for microRNAs, were obtained from Applied Biosystems. PCR
was performed under the following conditions: 50ºC for 2 min then
95ºC for 10 min, followed by 40 cycles at 95ºC for 15 sec and 60ºC
for 1 min. miRNA-16 was used as an internal control to normalize
the expression level of each sample. The comparative threshold
cycle (Ct) method was used to evaluate the relative abundance of
miR-16 compared with U6 expression (fold changes relative to
miRNA-16).
Analysis of methylation
To quantify the levels of methylation of the CpG
islands in the miR-375 promoter, the high-throughput
MassARRAY platform (Sequenom Inc., San Diego, CA, USA) was used as
previously described (18).
Briefly, bisulfite-treated DNA was amplified using primers for the
miR-375 CpG island. The primers were designed using
EpiDesigner (Sequenom Inc.) and were as follows: forward
5′-aggaagagagGGGTGGAGTATTTTTGTTTGTTG-3′ and reverse
5′-cagtaatacgactcactatagggagaaggct AAAAACATAATCCAAAACATCCT AAT-3′.
The PCR products were spotted on a 384-pad SpectroCHIP (Sequenom
Inc.), followed by spectral acquisition on a MassARRAY Analyzer.
Methylation data of the individual units (1–3 CpG sites/unit) were
generated using the EpiTyper version 1.0.5 software (Sequenom
Inc.).
Statistical analysis
The differences in miR-375 CpG methylation
between patients with T2DM and controls with NGT were assessed
using the Mann-Whitney and Kruskal-Wallis tests. The distances
between CpG methylation sites to transcription start sites were
calculated using the RMySQL package and the SQL database version of
the University of California Santa Cruz (UCSC) genome browser
(http://genome.ucsc.edu/cgi-bin/hgGateway).
Two-dimensional clustering was performed with the heatmap.2
function in the gregmisc package using the R statistical
environment. Classical multidimensional scaling was performed using
the cmdscale function and visualization was conducted through the
scatter plot3d function in the gregmisc package. A Student’s
t-test, a Wilcox test or a Fisher’s exact test was utilized to
compare the qPCR results in different groups with standard function
in R statistical environment. P<0.05 was considered to indicate
a statistically significant difference.
Results
Characteristics of the subjects
A total of 100 patients with T2DM and 100
age-matched healthy controls with NGT participated in this study.
The clinical characteristics of the subjects are shown in Table I. The average age was 51.33±11.75
years for patients with T2DM and 48.55±12.41 years for controls
with NGT. As expected, the patients with T2DM had a higher body
mass index (BMI), waist-to-hip ratio (WHR), systolic blood pressure
(SBP), fasting plasma glucose (FPG), low-density lipoprotein
cholesterol (LDL-C), total cholesterol (TC) and triglyceride (TG)
and lower high-density lipoprotein cholesterol (HDL-cholesterol)
compared with controls with NGT.
 | Table ICharacteristics of the study
subjects. |
Table I
Characteristics of the study
subjects.
| NGT | T2DM | P-value |
|---|
| Gender
(male/female) | 44/56 | 54/46 | 0.159 |
| Age (years) | 48.55±12.41 | 51.33±11.75 | 0.105 |
| WHR | 0.88±0.04 | 0.92±0.05 | 0.017 |
| BMI
(kg/m2) | 24.44±4.63 | 26.30±4.08 | 0.005 |
| SBP (mmHg) | 129.90±23.72 | 141.46±17.89 | <0.001 |
| DBP (mmHg) | 83.81±13.33 | 86.18±10.88 | 0.196 |
| FPG (mmol/l) | 4.10±0.64 | 10.60±4.27 | <0.001 |
| TC (mmol/l) | 3.67±0.92 | 5.10±1.39 | <0.001 |
| TG (mmol/l) | 1.02±0.69 | 1.90±1.42 | <0.001 |
| LDL-C (mmol/l) | 1.73±0.58 | 2.86±1.03 | <0.001 |
| HDL-C (mmol/l) | 1.33±0.45 | 1.10±0.24 | <0.001 |
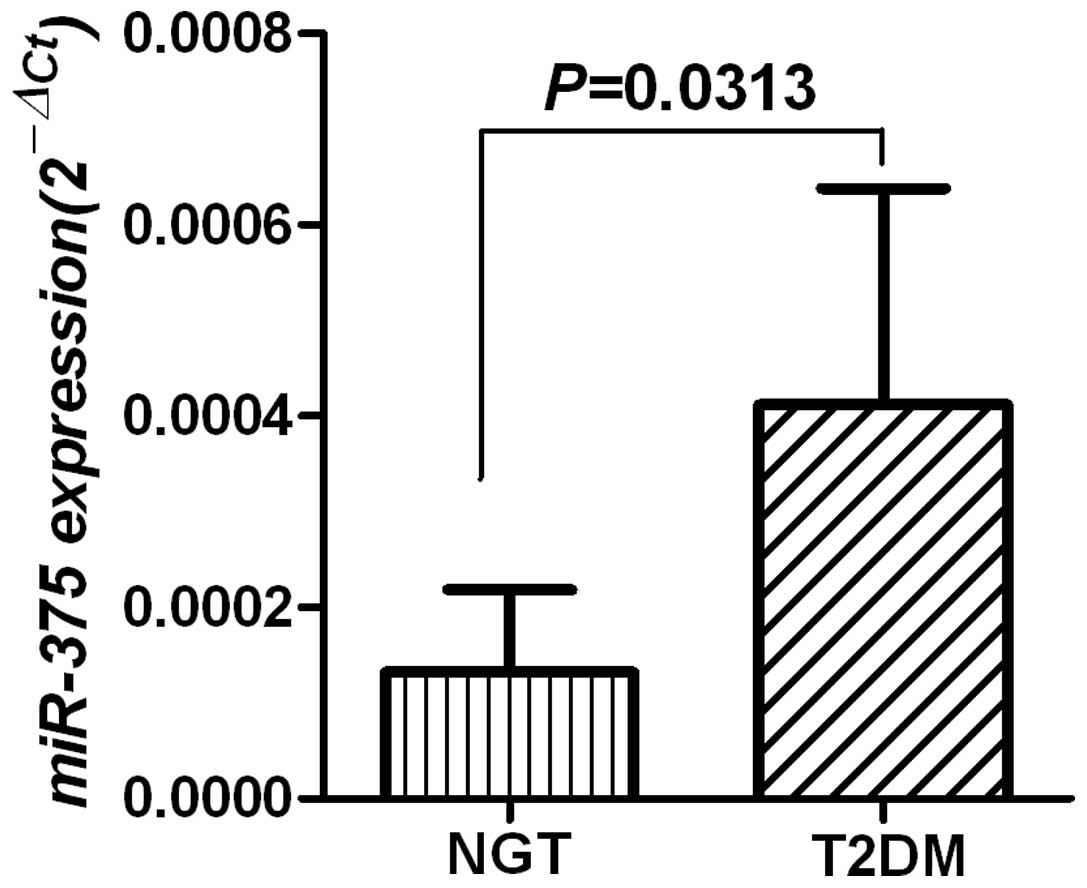
Upregulation of miR-375 expression in
patients with T2DM compared with controls with NGT
It has previously been demonstrated that
miR-375 expression is lost in different types of cancer
(15,16); therefore it was investigated in
this study whether aberrant expression of miR-375 was
present in the patients with T2DM. qPCR was performed to determine
the expression levels of miR-375 mRNA in T2DM plasma samples
and corresponding NGT samples. As shown in Fig. 1, the level of miR-375 mRNA
was significantly upregulated in T2DM samples compared with the NGT
samples (P=0.0313).
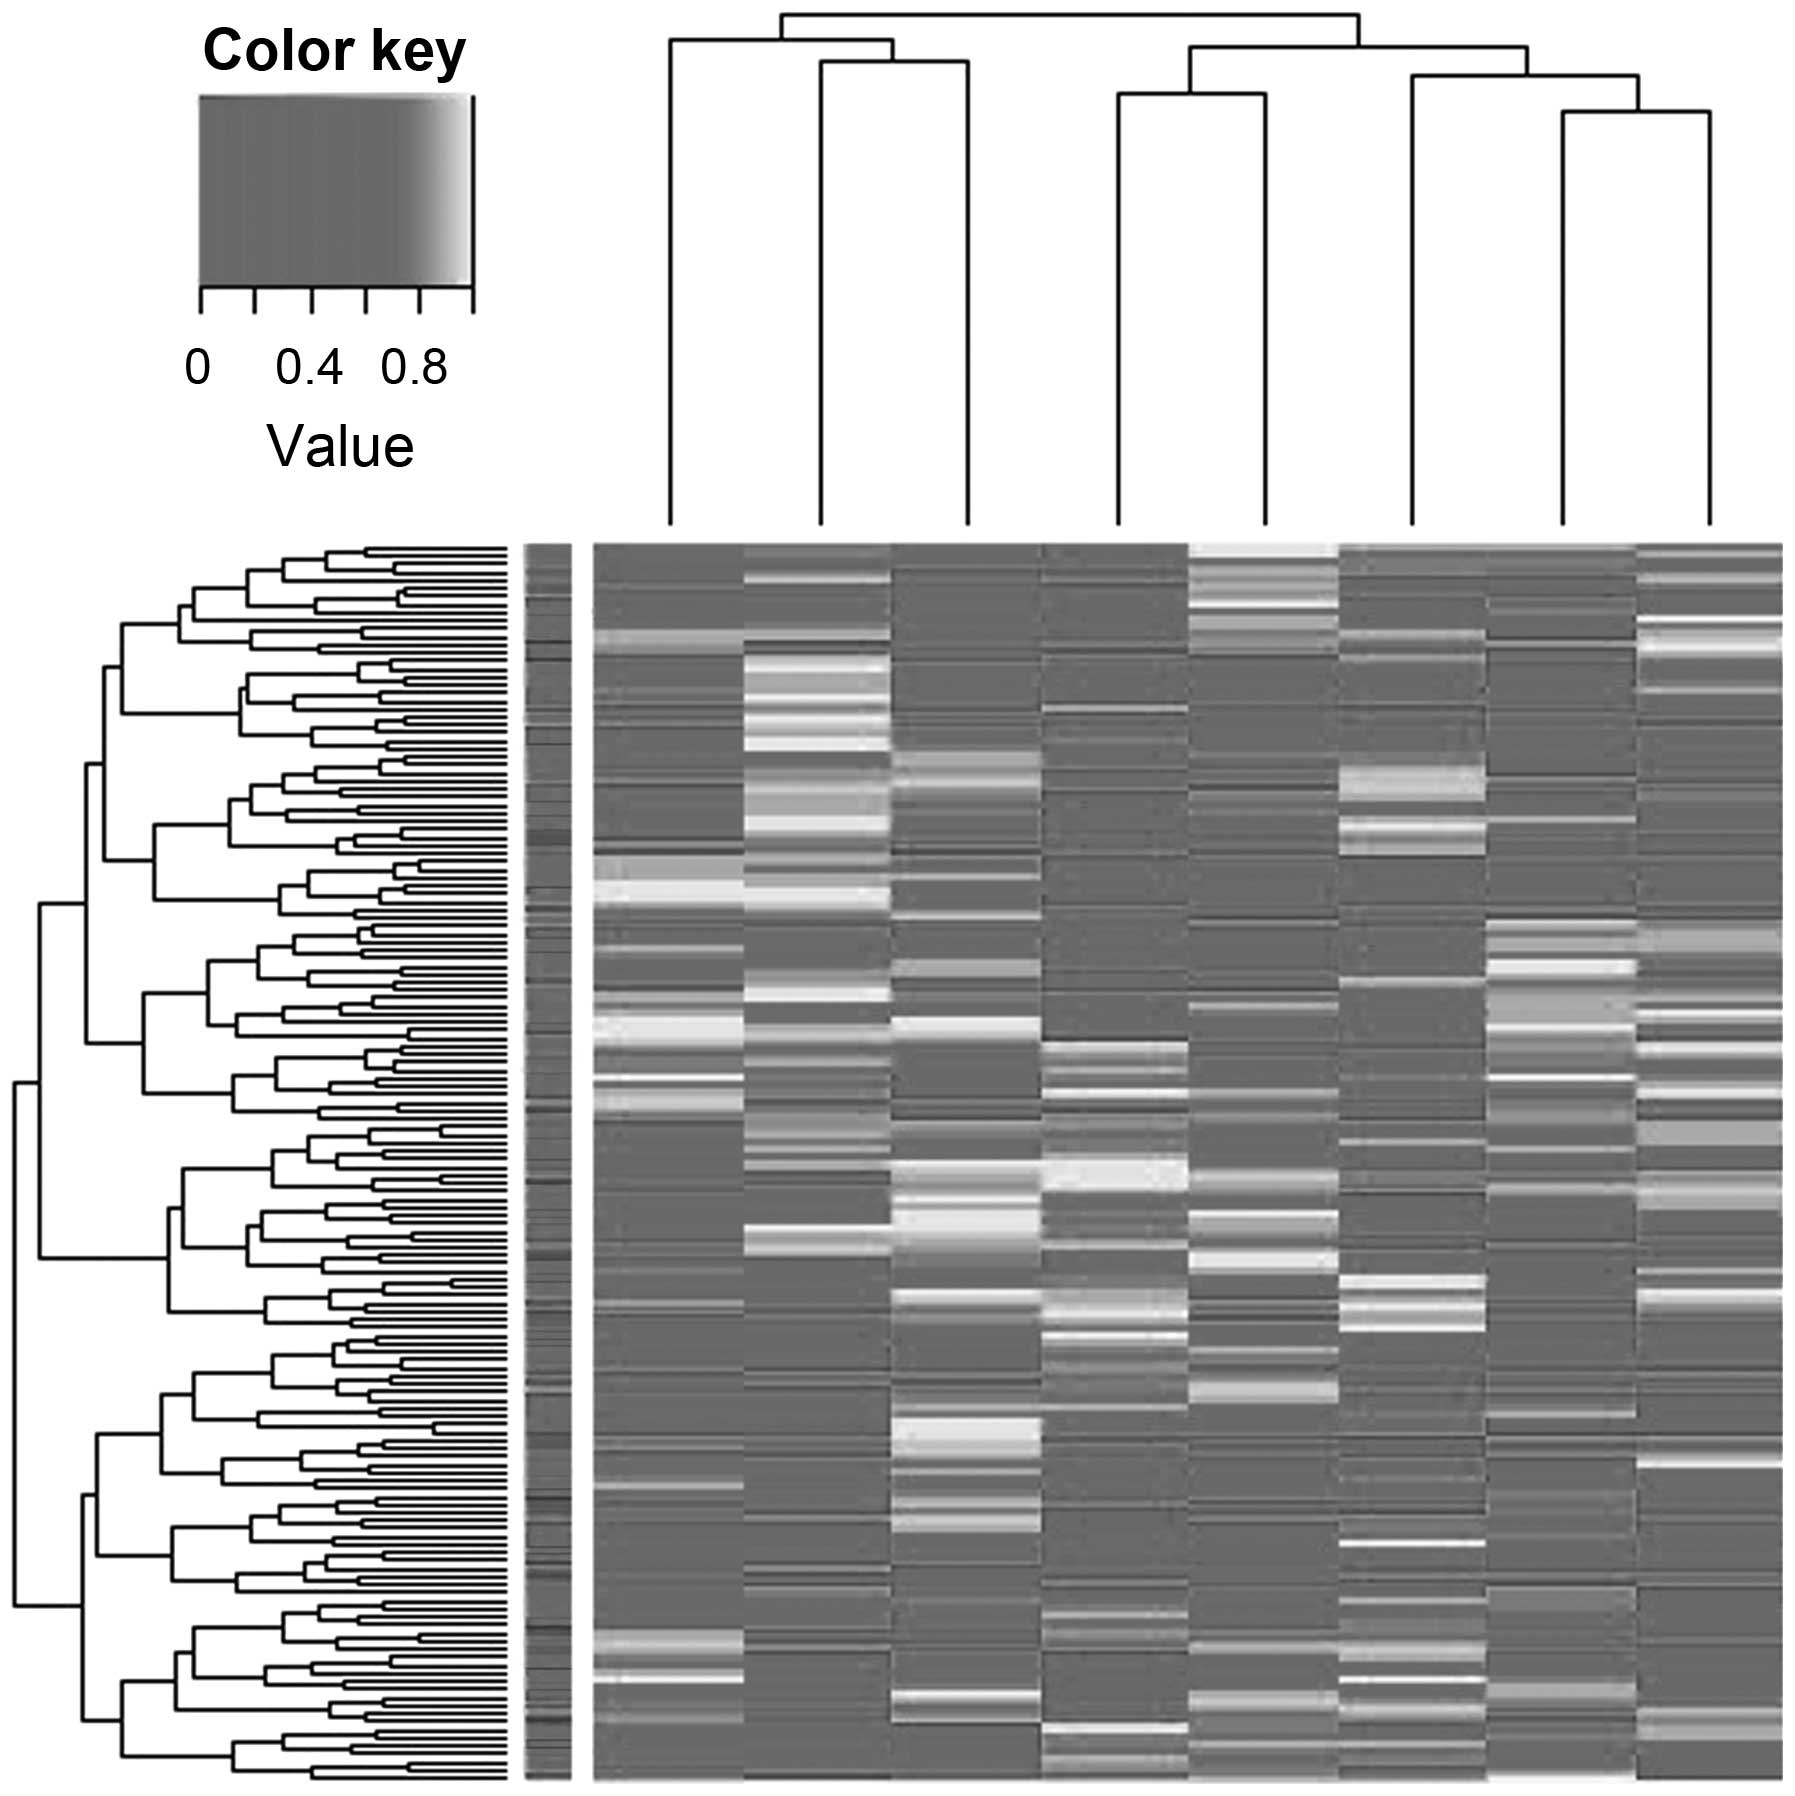
Specific CpG hypomethylation of the
miR-375 promoter may contribute to its overexpression in patients
with T2DM
In order to understand the mechanism of
miR-375 upregulation, the methylation status of the promoter
region of miR-375 was investigated. To determine whether the
methylation status was correlated with the upregulation of
miR-375, T2DM and corresponding NGT samples were analyzed
using MassARRAY EpiTyper. Hierarchical clustering identified
substantial differences in the quantitative methylation profiling
of T2DM samples compared with controls (Fig. 2).
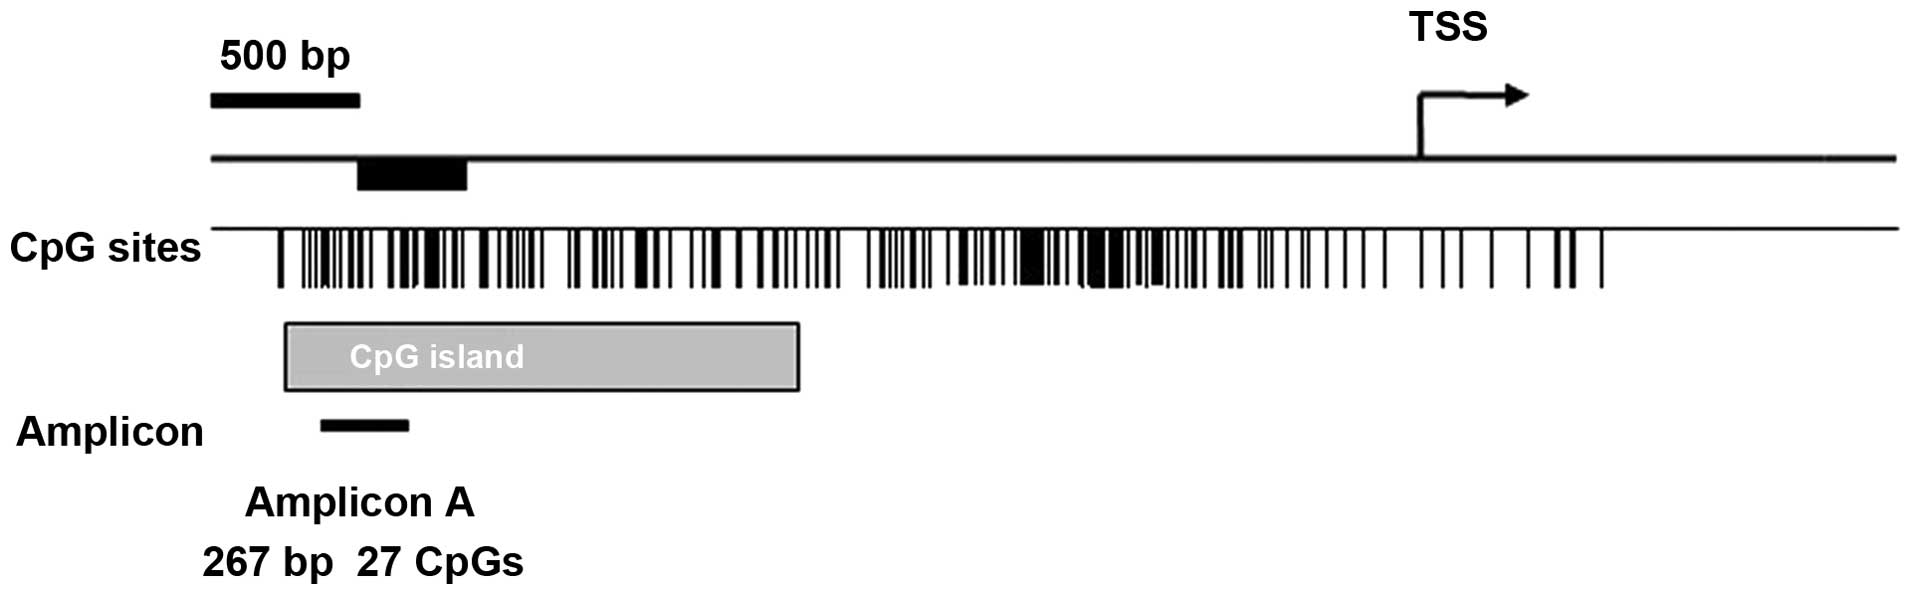
A schematic representation of the promoter region of
miR-375 according to UCSC Genome Browser’s CpG island
annotations and miRbase release 13.0 is shown in Fig. 3. Methylation was present from −990
to −1,258 bp relative to the transcription start site of
miR-375 in T2DM samples. Eight CpG units (comprising a total
of 17 CpG sites) spanning 267 bp in the specified promoter region
of miR-375 were analyzed in 100 T2DM samples and 100
controls (a total of 31,248 sites in all analyzed samples). The
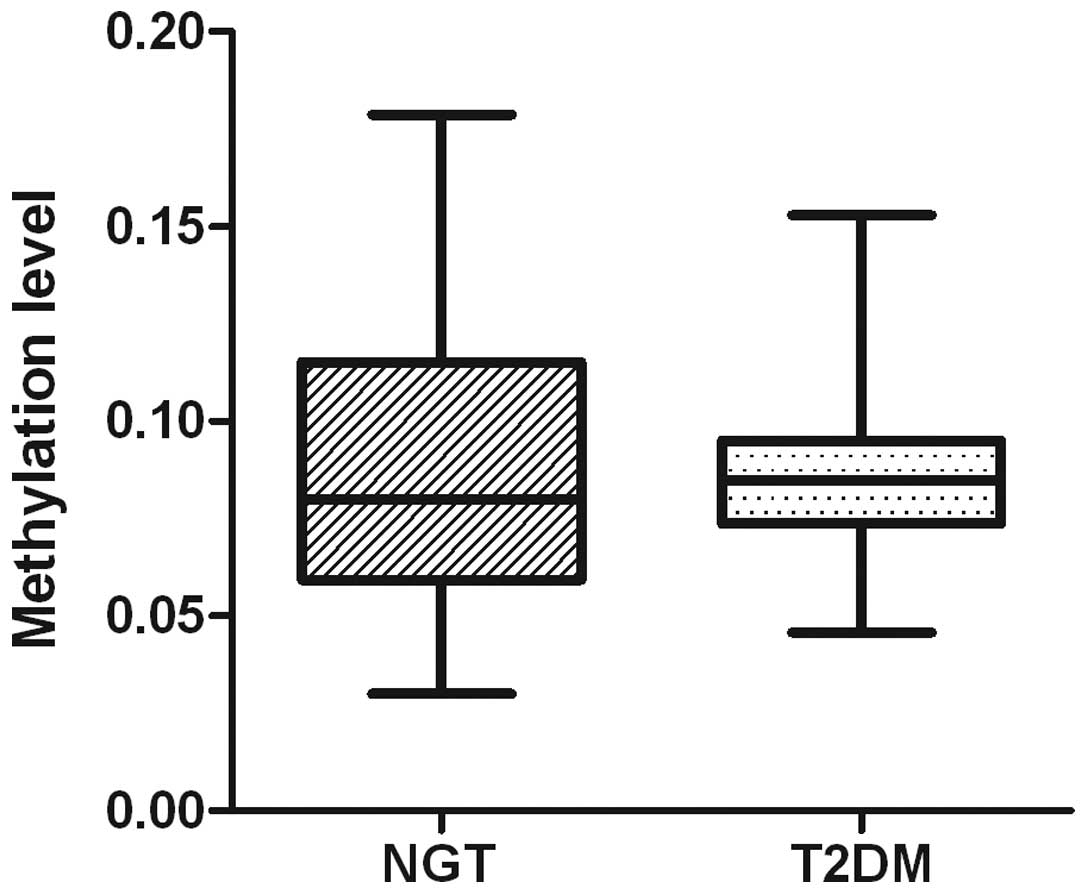
overall methylation of the miR-375 promoter was found to be
<10% for the T2DM and NGT samples; the mean levels of
miR-375 methylation, calculated from the methylation levels
of the 17 CpG residues, were 8.59% in the patients with T2DM and
8.97% in the control group with NGT (P=0.9582; Fig. 4). The levels of miR-375
promoter methylation varied between 4.6 and 15.3% in T2DM samples
and between 3.0 and 17.9% in NGT samples.
Although no differences in overall methylation
levels between control and T2DM samples were observed,
hypomethylation of specific critical CpG units was investigated to
determine whether they accounted for the increased miR-375
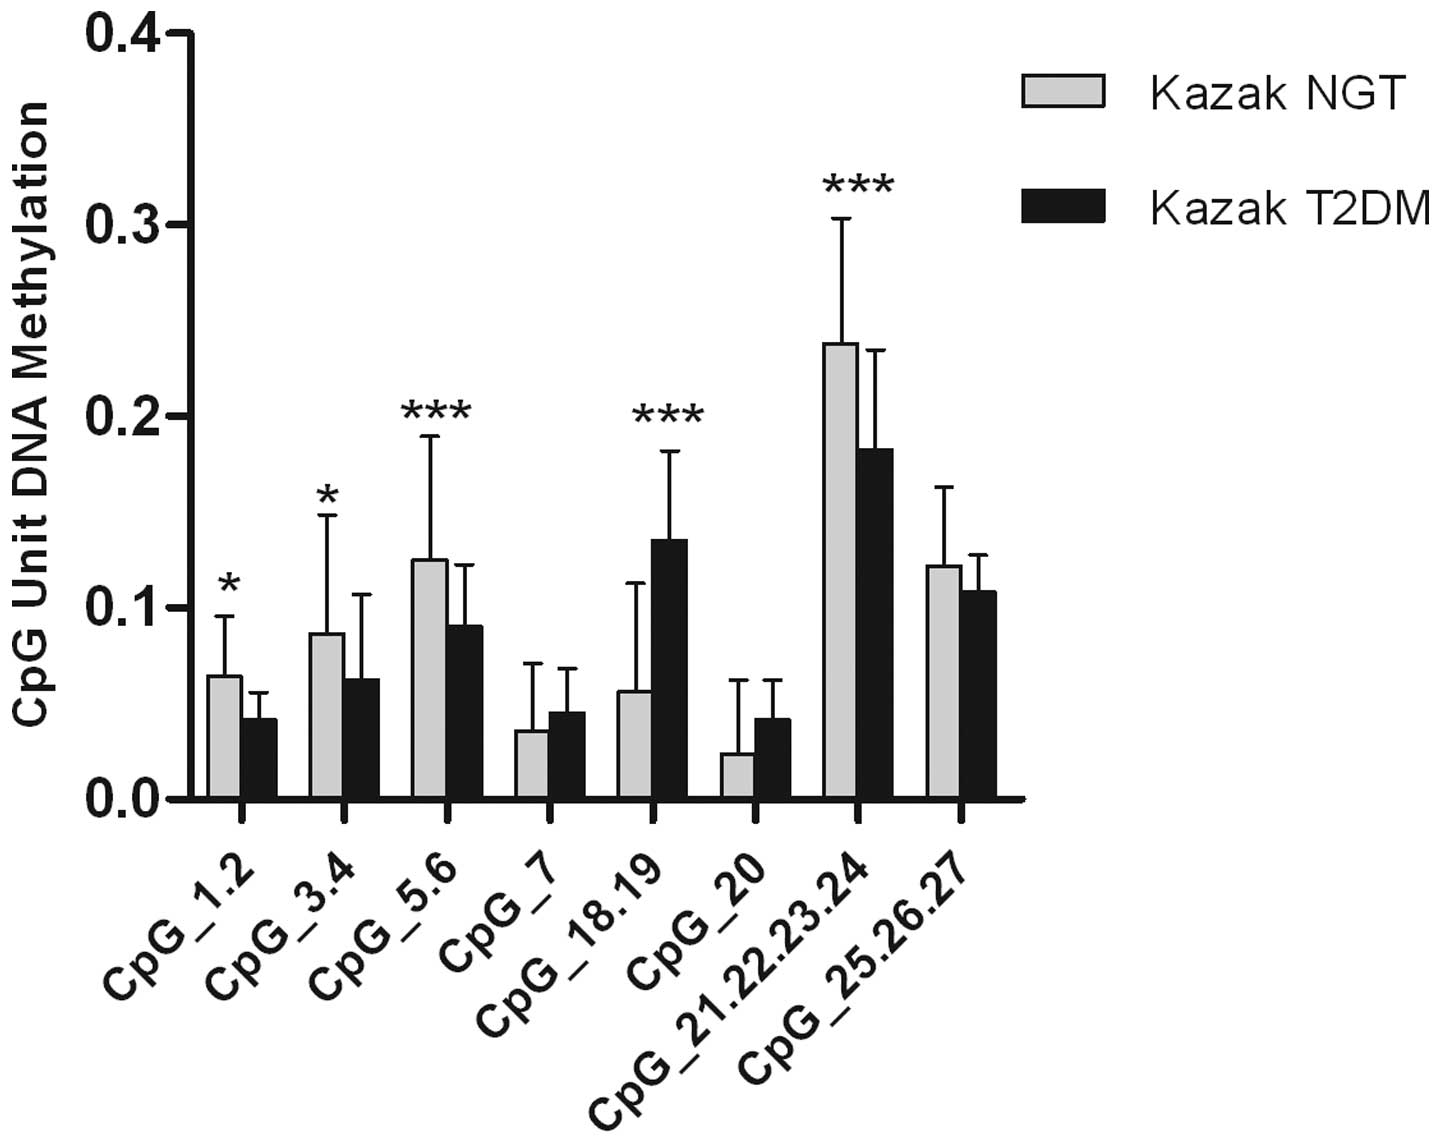
expression observed in T2DM samples. Analysis of the individual CpG
units in T2DM samples and controls using MassARRAY EpiTyper
revealed that six CpG units in this amplicon were hypomethylated,
with the exception of CpG_7 and CpG_20. In addition, significant
differences were observed in four specific CpG units, CpG_1.2,
CpG_3.4, CpG_5.6 and CpG_21.22.23.34, which were hypomethylated in
T2DM samples but not in NGT samples (Fig. 5).
Discussion
Previous studies have shown that expression levels
of miR-375 have different effects in different types of
cancer. For example, the upregulation of miR-375 stimulates
cell proliferation in breast and prostate cancer (14,19);
however, downregulation of miR-375 in gastric cancer leads
to the activation of the phosphoinositide-dependent kinase 1-Akt
(PDK1-Akt) and Janus kinase (JAK) oncogenic pathways (15,20).
In this study, the expression pattern of miR-375 was
investigated in patients with T2DM. It was found that the plasma
level of miR-375 was significantly upregulated in T2DM
samples compared with NGT samples (Fig. 1). It has previously been shown that
overexpression of miR-375 downregulates the expression of
myotrophin, a pivotal factor implicated in the regulation of a
variety of genes responsible for cellular apoptosis and
proliferation (21). Together,
these observations suggest that miR-375 is involved in the
pathogenesis of T2DM. Since plasma/serum miRNA levels are
particularly stable, and the expression level of miRNAs in the
serum is reproducible and consistent among individuals, a previous
study investigated the presence of circulating miRNAs and their
potential use as disease biomarkers (22). The results of the present study
suggest that the plasma level of miR-375 may allow patients
with T2DM to be distinguished from healthy controls, and,
therefore, miR-375 may be used as a novel biomarker for
T2DM.
Epigenetic modifications of DNA, such as
methylation, have been suggested to have a key role in T2DM disease
progression (12,13), and miRNA are epigenetically
regulated by DNA methylation (23). Several studies had revealed that
the expression of miR-375 is epigenetically regulated in
oesophageal squamous cell carcinoma, as well as gastric and breast
cancer (14–16); however, miR-375 promoter
methylation has not been directly linked to T2DM. In the present
study, it was investigated whether the upregulation of
miR-375 was mediated by epigenetic mechanisms in patients
with T2DM. Using MALDI-TOF MS, methylation patterns were evaluated
at multiple CpG sites within the promoter regions of
miR-375, and it was found that overall there was less
methylation in T2DM samples compared with NGT samples, although
this difference was not statistically significant (P>0.05)
(Fig. 4). Since there is
considerable variation between methylation levels of different CpG
units, the methylation status of specific CpG units was further
evaluated. The results revealed that there was a significant
decrease in methylation in four specific CpG units in T2DM samples
compared with NGT samples. These findings suggest that
miR-375 CpG island hypomethylation may be negatively
correlated with miR-375 expression. In addition,
hypomethylation of miR-375 may be used to predict the
progression of T2DM. miR-375 inhibits insulin secretion and
decreases the number of β cells. miR-375 may also affect
cell proliferation, differentiation and the expression of
apoptosis-associated genes so as to promote the occurrence of
apoptosis(15,16). Therefore, it was hypothesized that
hypomethylation of the miR-375 gene promoter may be involved
in the development of diabetes.
In this study, aberrant miR-375 expression
and methylation were detected in the plasma of patients with T2DM.
This has a potential clinical application for the identification of
pateints with T2DM from individuals with NGT. Despite the small
sample size, this is the first study, to the best of our knowledge,
to report an alteration in the level of miR-375 in plasma of
patients with T2DM. Clinical detection of upregulated miR-375
levels may not be limited to using plasma for T2DM diagnosis, and
it may be interesting to investigate whether miR-375 is also
present in other body fluids, for example saliva or urine, in order
to establish a general diagnostic method.
In conclusion, it was demonstrated in this study
that miR-375 expression was significantly upregulated and
hypomethylation was found in four specific CpG units of the
miR-375 promoter in patients with T2DM compared with
controls with NGT. These results suggest that DNA methylation may
have an important role in the control of T2DM. These results may
also lead to the development of miRNA-based targeted approaches for
the treatment of T2DM.
Acknowledgements
This study was supported by the National Natural
Science Foundation of China (81060065/H0711).
References
|
1
|
Butler AE, Janson J, Bonner-Weir S, Ritzel
R, Rizza RA and Butler PC: Beta-cell deficit and increased
beta-cell apoptosis in humans with type 2 diabetes. Diabetes.
52:102–110. 2003. View Article : Google Scholar : PubMed/NCBI
|
|
2
|
Guillausseau PJ, Meas T, Virally M,
Laloi-Michelin M, Médeau V and Kevorkian JP: Abnormalities in
insulin secretion in type 2 diabetes mellitus. Diabetes Metab.
34(Suppl 2): S43–S48. 2008. View Article : Google Scholar : PubMed/NCBI
|
|
3
|
Ambros V: The functions of animal
microRNAs. Nature. 431:350–355. 2004. View Article : Google Scholar : PubMed/NCBI
|
|
4
|
Bartel DP: MicroRNAs: target recognition
and regulatory functions. Cell. 136:215–233. 2009. View Article : Google Scholar : PubMed/NCBI
|
|
5
|
Uhlmann S, Zhang JD, Schwäger A,
Mannsperger H, Riazalhosseini Y, Burmester S, et al: miR-200bc/429
cluster targets PLCgamma1 and differentially regulates
proliferation and EGF-driven invasion than miR-200a/141 in breast
cancer. Oncogene. 29:4297–4306. 2010. View Article : Google Scholar : PubMed/NCBI
|
|
6
|
Chang TC and Mendell JT: microRNAs in
vertebrate physiology and human disease. Annu Rev Genomics Hum
Genet. 8:215–239. 2007. View Article : Google Scholar : PubMed/NCBI
|
|
7
|
Poy MN, Eliasson L, Krutzfeldt J, Kuwajima
S, Ma X, Macdonald PE, et al: A pancreatic islet-specific microRNA
regulates insulin secretion. Nature. 432:226–230. 2004. View Article : Google Scholar : PubMed/NCBI
|
|
8
|
Poy MN, Hausser J, Trajkovski M, Braun M,
Collins S, Rorsman P, et al: miR-375 maintains normal pancreatic
alpha- and beta-cell mass. Proc Natl Acad Sci USA. 106:5813–5818.
2009. View Article : Google Scholar : PubMed/NCBI
|
|
9
|
Baroukh N, Ravier MA, Loder MK, Hill EV,
Bounacer A, Scharfmann R, et al: MicroRNA-124a regulates Foxa2
expression and intracellular signaling in pancreatic beta-cell
lines. J Biol Chem. 282:19575–19588. 2007. View Article : Google Scholar : PubMed/NCBI
|
|
10
|
Plaisance V, Abderrahmani A, Perret-Menoud
V, Jacquemin P, Lemaigre F and Regazzi R: MicroRNA-9 controls the
expression of Granuphilin/Slp4 and the secretory response of
insulin-producing cells. J Biol Chem. 281:26932–26942. 2006.
View Article : Google Scholar : PubMed/NCBI
|
|
11
|
Zhao H, Guan J, Lee HM, Sui Y, He L, Siu
JJ, et al: Up-regulated pancreatic tissue microRNA-375 associates
with human type 2 diabetes through beta-cell deficit and islet
amyloid deposition. Pancreas. 39:843–846. 2010. View Article : Google Scholar : PubMed/NCBI
|
|
12
|
Gardner RJ, Mackay DJ, Mungall AJ,
Polychronakos C, Siebert R, Shield JP, et al: An imprinted locus
associated with transient neonatal diabetes mellitus. Hum Mol
Genet. 9:589–596. 2000. View Article : Google Scholar : PubMed/NCBI
|
|
13
|
Ling C, Del Guerra S, Lupi R, Rönn T,
Granhall C, Luthman H, et al: Epigenetic regulation of PPARGC1A in
human type 2 diabetic islets and effect on insulin secretion.
Diabetologia. 51:615–622. 2008. View Article : Google Scholar : PubMed/NCBI
|
|
14
|
de Souza Rocha Simonini P, Breiling A,
Gupta N, Malekpour M, Youns M, Omranipour R, et al: Epigenetically
deregulated microRNA-375 is involved in a positive feedback loop
with estrogen receptor alpha in breast cancer cells. Cancer Res.
70:9175–9184. 2010.PubMed/NCBI
|
|
15
|
Tsukamoto Y, Nakada C, Noguchi T, Tanigawa
M, Nguyen LT, Uchida T, et al: MicroRNA-375 is downregulated in
gastric carcinomas and regulates cell survival by targeting PDK1
and 14–3–3zeta. Cancer Res. 70:2339–2349. 2010.PubMed/NCBI
|
|
16
|
Kong KL, Kwong DL, Chan TH, Law SY, Chen
L, Li Y, et al: MicroRNA-375 inhibits tumour growth and metastasis
in oesophageal squamous cell carcinoma through repressing
insulin-like growth factor 1 receptor. Gut. 61:33–42. 2012.
View Article : Google Scholar : PubMed/NCBI
|
|
17
|
Yang YN, Xie X, Ma YT, Li XM, Fu ZY, Ma X,
et al: Type 2 diabetes in Xinjiang Uygur Autonomous Region, China.
PLoS One. 7:e352702012. View Article : Google Scholar : PubMed/NCBI
|
|
18
|
Lin HJ, Zuo T, Lin CH, Kuo CT,
Liyanarachchi S, Sun S, et al: Breast cancer-associated fibroblasts
confer AKT1-mediated epigenetic silencing of cystatin M in
epithelial cells. Cancer Res. 68:10257–10266. 2008. View Article : Google Scholar : PubMed/NCBI
|
|
19
|
Szczyrba J, Nolte E, Wach S, Kremmer E,
Stöhr R, Hartmann A, et al: Downregulation of Sec23A protein by
miRNA-375 in prostate carcinoma. Mol Cancer Res. 9:791–800. 2011.
View Article : Google Scholar : PubMed/NCBI
|
|
20
|
Ding L, Xu Y, Zhang W, Deng Y, Si M, Du Y,
Yao H, et al: MiR-375 frequently downregulated in gastric cancer
inhibits cell proliferation by targeting JAK2. Cell Res.
20:784–793. 2010. View Article : Google Scholar : PubMed/NCBI
|
|
21
|
Li Y, Xu X, Liang Y, Liu S, Xiao H, Li F,
et al: miR-375 enhances palmitate-induced lipoapoptosis in
insulin-secreting NIT-1 cells by repressing myotrophin (V1) protein
expression. Int J Clin Exp Pathol. 3:254–264. 2010.PubMed/NCBI
|
|
22
|
Mitchell PS, Parkin RK, Kroh EM, Fritz BR,
Wyman SK, Pogosova-Agadjanyan EL, et al: Circulating microRNAs as
stable blood-based markers for cancer detection. Proc Natl Acad Sci
USA. 105:10513–10518. 2008. View Article : Google Scholar : PubMed/NCBI
|
|
23
|
Weber B, Stresemann C, Brueckner B and
Lyko F: Methylation of human microRNA genes in normal and
neoplastic cells. Cell Cycle. 6:1001–1005. 2007. View Article : Google Scholar : PubMed/NCBI
|