Introduction
Endometriosis (EM) is one of the most common
gynecological diseases. It is a benign disease with malignant
invasion and metastasis, and is linked with dysmenorrhea and
infertility, with an incidence of ~5–15%. Although there has been
almost a century of investigation, the cause of EM remains unclear.
Previous studies have observed that EM may be caused by the
interaction of a multifactorial-induced polygenic disease (1). Scholars have suggested the theory of
‘eutopic endometrium determinism’, that is the ectopic implantation
of endometrial tissue depends on the differences in gene expression
of the incumbent membrane. Comprehensive proteomics with the
development of the Human Genome Project are capable of processing
the overall, dynamic, quantitative study of protein composition,
function and correlation. The application of proteomics technology
for EM is capable of generating the protein expression profile in
patients with EM and revealing the pathogenic mechanisms at the
molecular level, providing a non-invasive, more sensitive and
specific diagnostic method. The focus of proteomics is to locate
the expression of different proteins in disease conditions, which
may become important tools for clinical diagnosis, particularly for
early diagnosis. Ethnic differences exist in clinical medicine.
Drug metabolism between the various ethnic groups in China are
different. Therefore, the identification of different genes and
proteins between the uterine EM patients of the Uygur and Han
ethnicity may further guide the etiology, diagnosis and clinical
treatment of EM.
Subjects and methods
Patients
All cases of EM were confirmed by laparotomy or
laparoscopy at The First Teaching Hospital of Xinjiang Medical
University (Urumqi, China). The ectopic endometrium and eutopic
endometrium were obtained during surgery. EM lesions were obtained
by biopsy. EM cases were included according to the following
criteria: All cases had chocolate cysts of the ovaries and were
obtained from Uyghur and Han patients who were native of different
regions of the Xinjiang Uyghur Autonomous Region, were between the
age of 18 and 45 years, had a regular menstrual cycle (28–32 days),
exhibited no other endocrine, immune or metabolic diseases and did
not use hormones preoperatively for three months. All specimens of
endometrial and chocolate cysts were confirmed pathologically.
There were a total of 10 samples of EM serum and eight samples of
non-EM serum from Uygur patients, and 10 samples of EM serum and
nine samples of non-EM serum from Han patients. Written informed
consent was obtained from the patients and the study was approved
by the Ethics Committee of Xinjiang Medical University.
Methods
The method of two dimensional (2D) polyacrylamide
gel electrophoresis (PAGE) for protein expression profile analysis
is described thoroughly in ‘Proteomics’ (2). Table
I presents the reagents and the volumes used in each tube in 2D
PAGE. The methods used are described below.
 | Table IRelative absorbance in each tube at
595 nm. |
Table I
Relative absorbance in each tube at
595 nm.
| Tube number |
|---|
|
|
|---|
| Solution (μl) | 0 | 1 | 2 | 3 | 4 | 5 | 6 | 7 | 8 |
|---|
| ddH2O | 80 | 80 | 80 | 80 | 80 | 80 | 80 | 80 | 80 |
| Protein standard
solution | 0 | 1 | 2 | 3 | 4 | 5 | 6 | 8 | 10 |
| Diluent | 10 | 9 | 8 | 7 | 6 | 5 | 4 | 2 | 0 |
| 0.1 N HCl | 10 | 10 | 10 | 10 | 10 | 10 | 10 | 10 | 10 |
Removal of plasma/serum albumin and
IgG
Tris-HCl solution (10 mM; serum binding buffer, pH
7.4; Beijing Baier Tepp Biological Technology Development Co.,
Ltd., Beijing, China) was used to equilibrate the column filling,
followed by centrifugation (2,000 × g; 20 sec). Then the solution
in the column filling was removed. Dried (0.02 g) column filling
was added to the Eppendorf tube. Plasma/serum (25 μl; 1:3) was
diluted with 10 mM Tris-HCl solution (pH 7.4) and added to the
Eppendorf tube, followed by oscillation for 40 min. Following
centrifugation (2,000 × g; 20 min), the supernatant was collected.
Tris-HCl solution (pH 7.4; 10 mM) was used to equilibrate protein
A, followed by centrifugation (500 × g; 1 min). The redundant
solution was then removed. Dried protein A (0.04 g) was added to
the Eppendorf tube and the supernatant was added, followed by
oscillation for 40 min. Following centrifugation (500 × g; 5 min),
the supernatant was collected and the concentration of supernatant
was measured by 2D electrophoresis.
Determination of protein content using an
improved Bradford method
Basic principles
The protein was bound to the Coomassie brilliant
blue G-250 dye and the maximum absorption peak of the dye was
altered from 465 to 595 nm. In a linear range, the reaction
solution at 595 nm was proportional to the quantity of protein in
the reaction. The increase in absorbance at 595 nm was determined
so that the quantity of protein could be obtained.
Determination of the standard
curve
The protein standard solution and melt diluent were
removed and centrifuged at 1,200 × g for 3 min. Coomassie Brilliant
Blue G-250 working solution (Sigma-Aldrich, St. Louis, MO, USA) was
measured out, with 3.5 ml for each tube. Hydrochloric (HCl) acid
(0.1 N) and double-distilled water (ddH2O) were
prepared. The nine dry and clean test tubes were numbered and the
reagents are shown in Table I. The
test tubes were agitated at room temperature for 30 sec following
the addition of 3.5 ml Coomassie Brilliant Blue G-250 to each
tube.
Determination of sample
In a dry and clean test tube, 80 μl ddH2O
was subsequently added to the dilution buffer, which was adjusted
to the measuring range of the protein concentration of the sample
(10 μl), adding 0.1 N HCl (l0 μl), 30 sec after 3.5 ml Coomassie
Brilliant Blue G-250 was added.
Sample protein content
The protein content of the original sample (mg/ml) =
dilution factor × predicted value (μg)/10 μl.
Instructions for IPGphor isoelectric
focusing system
The strip holders with the desired length and number
were thoroughly cleaned and dried using a soft bristle toothbrush
and immobiline DryStrip rehydration solution (Xing-Yi
Biotechnologies, Inc., Taiwan, China). The swelling liquid and
sample were prepared. The strip length was determined according to
the selected sample (7 cm, ~125 μl; 13 cm, ~250 μl; 18 cm, ~340 μl;
24 cm, ~450 μl) and the extent of liquid bubble expansion was
determined. According to the sample size, the required sample
volume plus the quantity of swelling liquid were calculated and
were thoroughly mixed. The sample solution was added dropwise to
the strip holder evenly. The desired length was subsequently
removed and the pH range was determined using IPG strips (Amersham
Pharmacia Biotech Inc., Piscataway, NJ, USA), according to the
manufacturer’s instructions.
PAGE and silver staining
The polyacrylamide gel was prepared (acrylamide from
Sigma-Aldrich) and attached to the glass plate for electrophoresis.
The pre-electrophoresis was performed and the sample was added,
followed by electrophoresis at a constant power of 2.5 W for 45 min
and 15 W for 5–7 h. Following electrophoresis, the gel was removed
and subsequent to fixation, silver staining was performed for 20
min (0.625 g AgNO3; 100 μ1 37% formaldehyde), followed by water
washing and coloration.
Database retrieval
The present study was designed to determine the
isoelectric point and molecular weight of differentially expressed
proteins in order to add them to the website http://www.expasy.org. The software TagI-dent (Image
Master 4.01; Amersham Pharmacia Biotech Inc.) was used to retrieve
the Swiss-Prot database, looking for the protein matched to these
two parameters. The range for the isoelectric point varied by 0.1
and the molecular weight ranged between 0.5 and 5%.
Matrix-assisted laser
desorption/ionization time-of-flight mass spectrometer
(MALDI-TOF-MS) analysis
The candidate protein spots on the 2D
electrophoresis gel were stained and numbered. The selected spots
were cut along the edge with a razor blade and placed in a sample
tube containing 50% (by volume) acetonitrile (Sigma-Aldrich) and 25
mmol/l ammonium bicarbonate (Rianlon Chemical Experiment Plant,
Tianjin, China) solution for decoloration and were subsequently
subjected to vacuum centrifugation for desiccation. Trypsin was
prepared with 25 mmol/l ammonium bicarbonate solution to give a
final concentration of 0.01 g/l. Then 8–10 μl trypsin was added to
each sample tube and insulated at 37°C for 20 h. Trifluoroacetic
acid (120 μl of 5% by mass) was added to each sample (Promega
Corporation, Madison, WI, USA) and was subsequently incubated at
40°C for 1 h, and the supernatant was aspirated. To this, 2.5%
trifluoroacetic acid and 120 μl of 50% acetonitrile solution were
added and subsequently incubated at 30°C for 1 h. The supernatants
were combined, freeze-dried and dissolved with 10 μl of 0.5%
trifluoroacetic acid. Of this, 1 μl was mixed with a saturated
α-cyano-4-hydroxy cinnamic acid (Promega Corporation) solution of
trifluoroacetic acid and 50% acetonitrile, which was dried at room
temperature. The peptide mass fingerprint was obtained from reflex
tests using a mass spectrometer with a laser wavelength of 337
nm.
Results
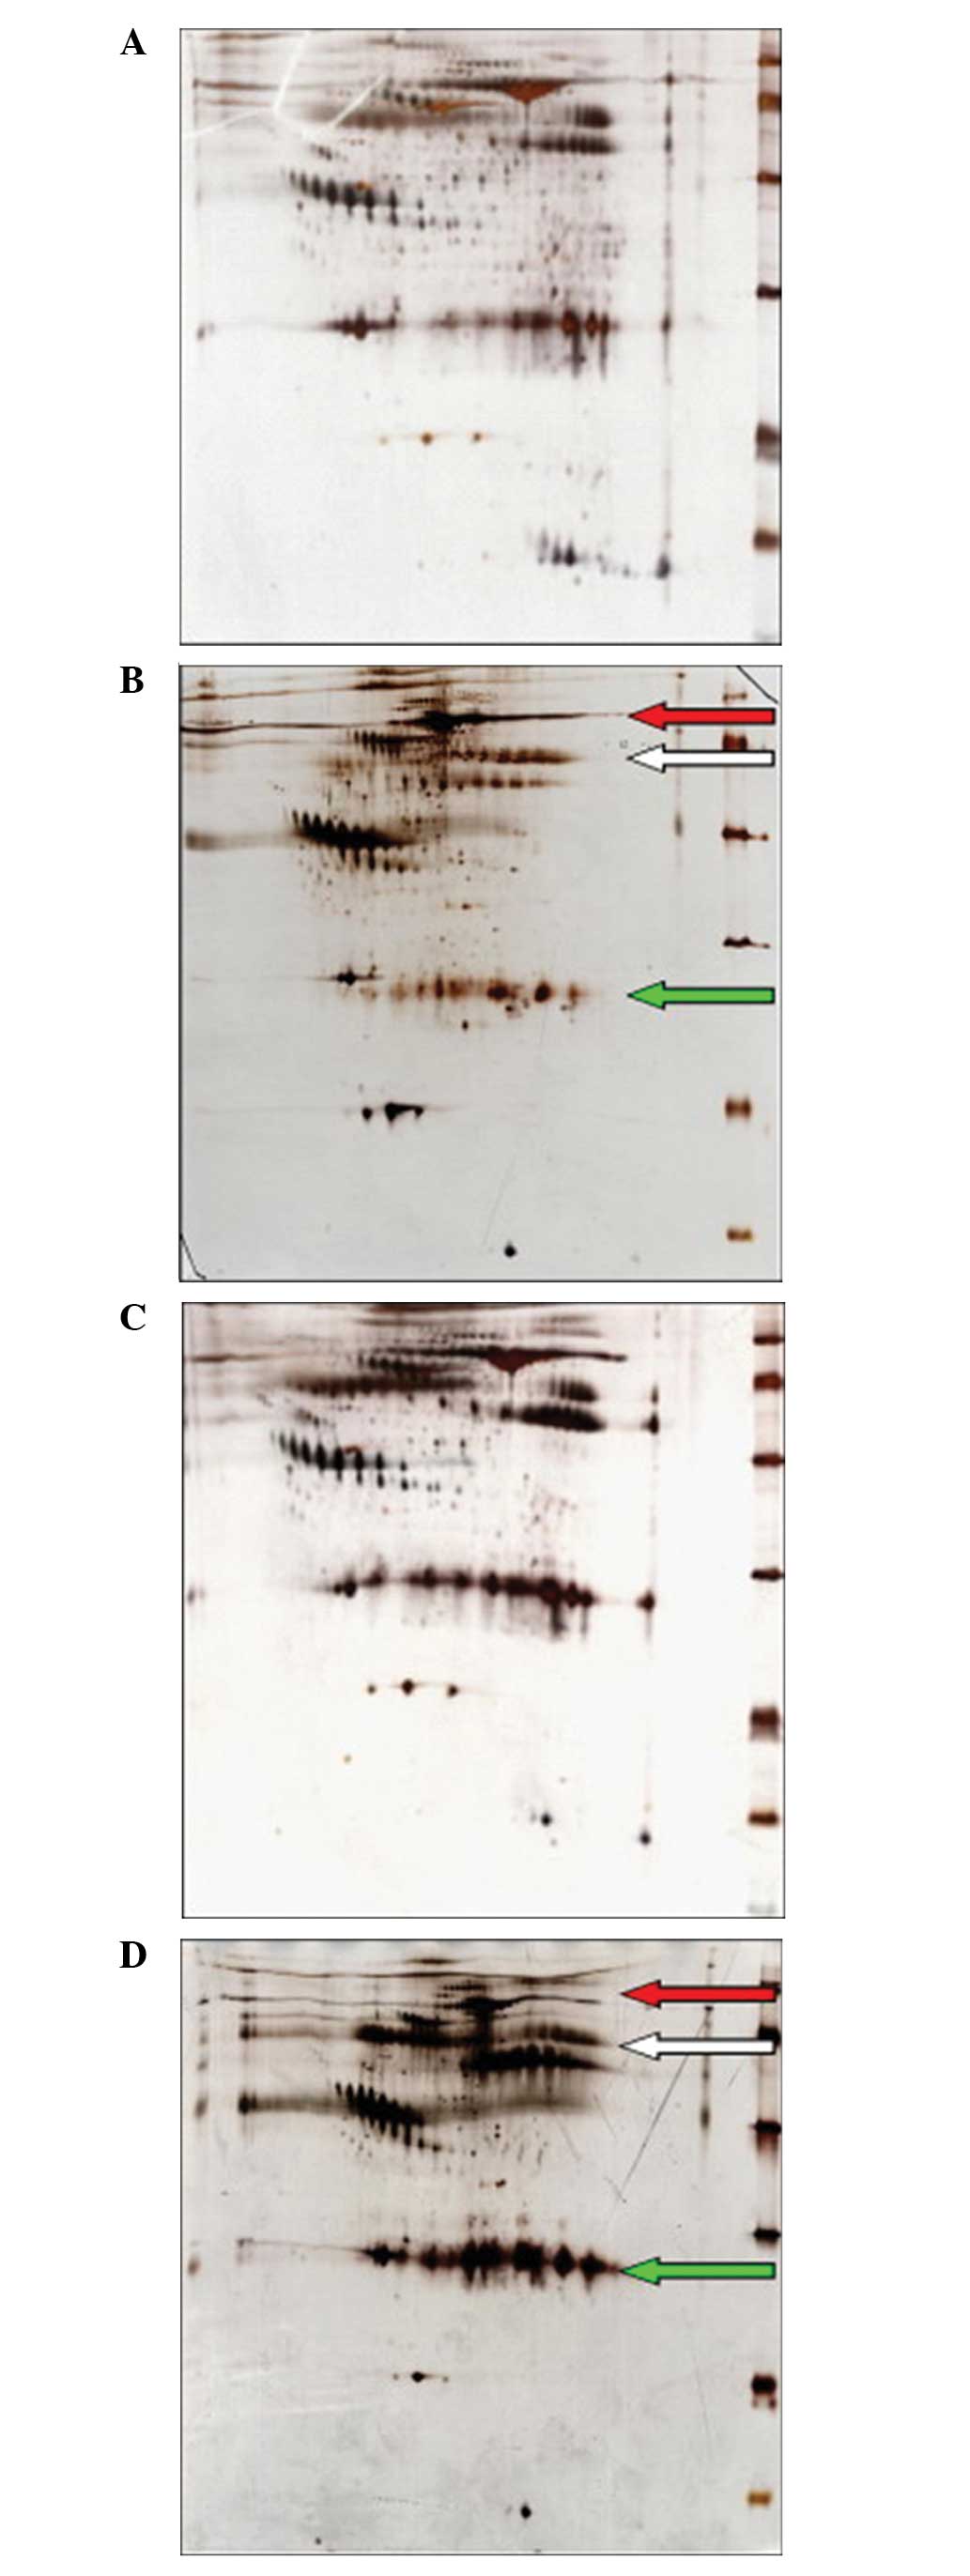
Protein pattern analysis by 2D gel
electrophoresis
The samples from the Uyghur and Han Chinese patients
were assessed three times. The results demonstrated that three
profiles in the dimensional electrophoresis were particularly
similar in each group. The average number of protein spots was
965±52 and 1024±72, respectively. The protein glue diagrams for
Uyghur EM patients and the control group are shown in Fig. 1A and B. The protein glue diagrams
for the Han EM patients and the control group are shown in Fig. 1C and D. Phoretix 2D software was
applied to analyze the differentially expressed protein. The
proteins with expression levels that were more than three times
higher than that of the control group and were observed in at least
two pairs of samples with the same change, were considered to be
the different protein spots.
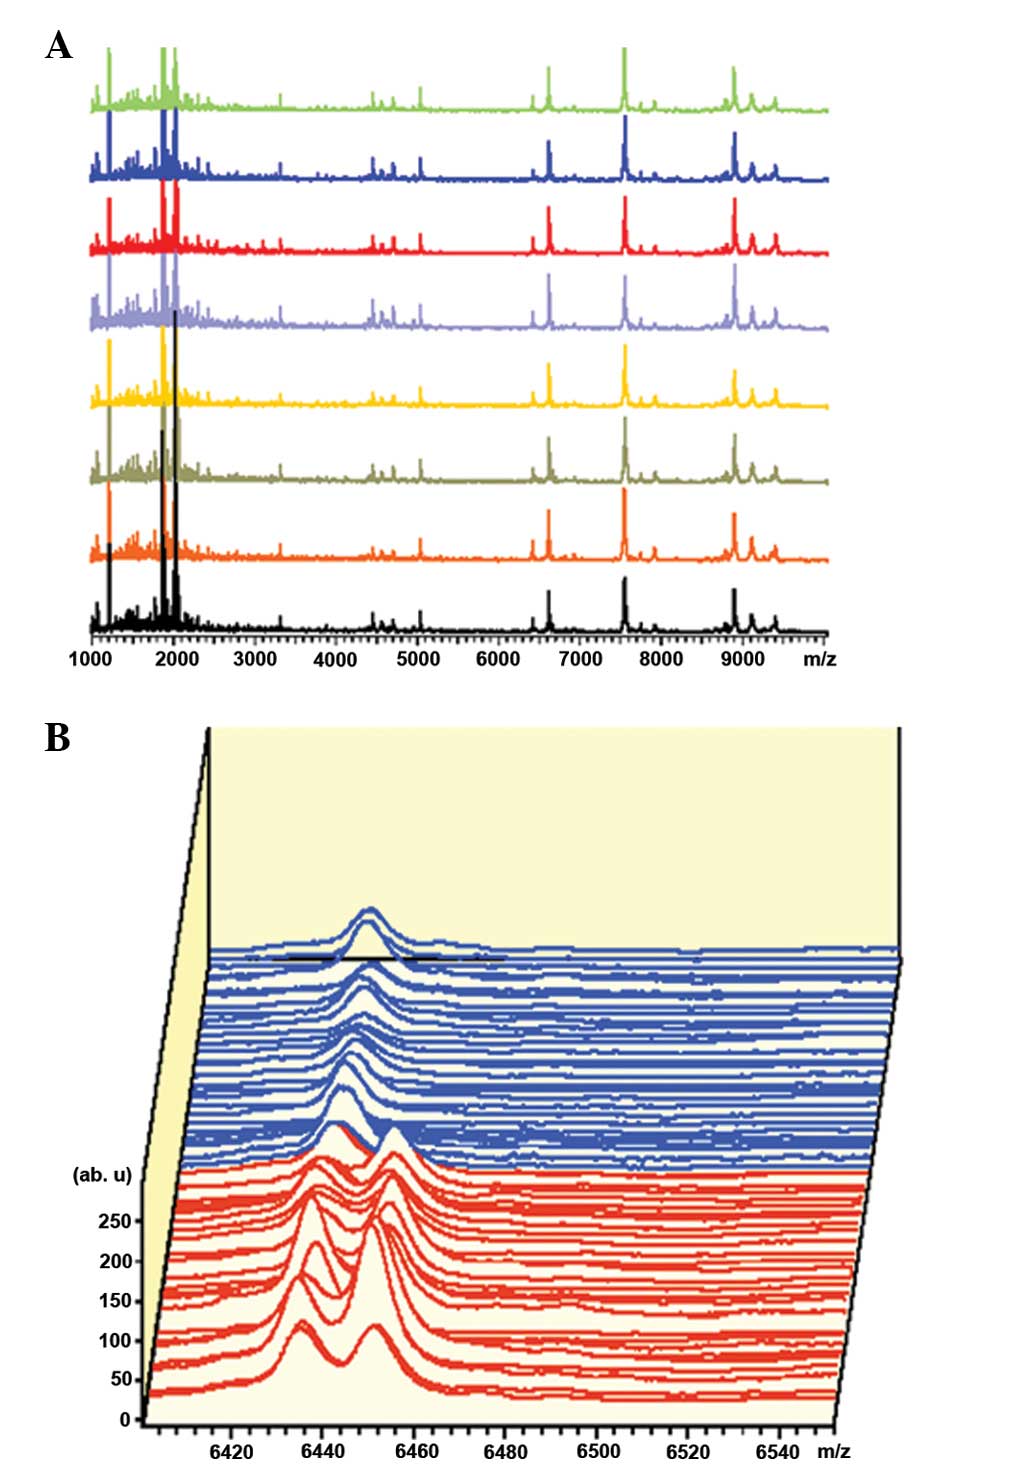
Determination of differentially expressed
proteins through database retrieval
In the Uygur group, there were eight differentially
expressed protein spots in the serum, while there was no expression
in the normal controls (Table
II). The distribution of the peak values of the differential
proteins are shown in Fig. 2A. In
the Han group, there were 13 differentially expressed protein spots
in the serum, with no expression in normal controls (Table III). The distribution of the peak
values of differential proteins is shown in Fig. 2B.
| Table IIProteins specifically expressed in
Uyghur patients. |
Table II
Proteins specifically expressed in
Uyghur patients.
| Site | Name and description
of protein |
|---|
| 55 | gi|40040316, (1)
actin-like-7-α, (2) γ-aminobutyric-acid receptor π subunit |
| 123 | gi|56202824, (1)
14-3-3 protein ς, (2) hepatoma-derived growth factor |
| 20 | gi|21040255, splicing
factor, arginine/serine-rich 12 (Homo sapiens) |
| 34 | gi|7650400,
immunoglobulin heavy chain variable region (Homo
sapiens) |
| 51 | gi|33188435, deleted
in liver cancer 1 isoform 3 (Homo sapiens) |
| 48 | gi|825615,
α2-macroglobulin (Homo sapiens) |
| 57 | gi|89037979,
predicted: hypothetical protein XP_938584 (Homo
sapiens) |
| 169 | gi|3023686,
excitatory amino acid transporter 5 (retinal glutamate
transporter) |
| Table IIIProteins specifically expressed in Han
patients. |
Table III
Proteins specifically expressed in Han
patients.
| Site | Name and description
of protein |
|---|
| 62 | 55 for gi|21439292,
Unnamed protein product [Homo sapiens] |
| 108 | 95 for gi|40354192,
Keratin 10 [Homo sapiens] |
| 84 | 25 for gi|52840231,
MHC class II antigen [Homo sapiens] |
| 83 | 49 for gi|89027466,
Predicted - similar to Eukaryotic translation initiation factor 3
subunit 2 (eIF3 p36) |
| 27 | 74 for gi|24659602,
Keratin 16 [Homo sapiens] |
| 26 | 41 for gi|70798083,
Immunoglobulin heavy chain variable region [Homo
sapiens] |
| 25 | 50 for gi|83405621,
Unknown (protein for IMAGE: 5585236) [Homo sapiens] |
| 64 | 48 for gi|21439292,
Unnamed protein product [Homo sapiens] |
| 151 | 50 for gi|23272803,
MGC40042 protein [Homo sapiens] |
| 137 | 321 for Mixture 1,
gi|1147569 + gi|401079 semenogelin I [Homo sapiens] and
SPIN-2 |
| 8 | 52 for gi|39645832,
C14orf10 protein [Homo sapiens] |
| 7 | 49 for gi|40538736,
RAN binding protein 10 [Homo sapiens] |
| 6 | 59 for gi|57164405,
TPR domain, ankyrin-repeat and coiled-coil containing 2 [Homo
sapiens] |
Discussion
The alteration in protein structure or quantity may
lead to the occurrence of EM (2).
By comparing proteins in samples of disease and normal tissue,
different proteins may be identified, and those that correspond to
the specific disease may be used as markers of the disease or a
target-molecule for a drug. Due to individual differences in
steroid hormones and the menstrual cycle, the single protein or
small group of protein is particularly difficult to conclusively
confirm. Previously, Rout et al (3) applied SDS-PAGE technology to compare
the serum and peritoneal fluid between EM patients and a control
group, to obtain evidence of the impact of reproductive ability in
EM patients and the autoimmune system. The results demonstrated
that there was no significant difference in the protein spectrum in
the serum and peritoneal fluid between the two groups. However, in
18 of 20 patients with secretion of peritoneal fluid, the authors
identified a protein that had not been described previously
(molecular weight: 70,000 kDa), which did not appear in the
proliferative phase samples. Numerous animal models have been used
in EM-related research, including baboons, rhesus monkeys, rats and
mice. However, certain species do not have a menstrual cycle and
only primates suffer from EM in the wild. Newman et al
(4) applied the animal model of
surgery-induced EM in rats and observed that ectopically implanted
endometrium and eutopic endometrium may produce different proteins
according to the SDS-PAGE method. These two proteins were termed
ENDO-1 (molecular weight range, 40–50 kDa; isoelectric point,
4.0–5.2) and ENDO-2 (molecular weight range, 28–32 kDa; isoelectric
point, 7.5–9.0). Certain studies have demonstrated that the
haptoglobin from EM lesions may combine with macrophages, thereby
reducing its adhesion ability. Therefore, this may account for the
pathogenesis of EM (5–7). In the serum and peritoneal fluid of
EM patients, the concentration of tissue inhibitor of
matrixmetallopeptidase inhibitor 1 (TIMP-1) was significantly lower
than that observed in the controls. Therefore, the abnormal
expression of TIMP-1 may contribute to the incidence of EM and may
be a potential marker for the diagnosis of the disease. Nisolle
et al (7) obtained the
peritoneal fluid from infertile women who had no EM and normal
controls in order to process the proteomic analysis with 2-DE
technology and observed that the ENDO-1 protein existed in the
peritoneal fluid of all patients. The molecular weight of ENDO-1 in
rats was 40–50 kDa, while the molecular weight of human ENDO-1 was
32–40 kDa. No significant difference in the protein profiles was
identified at different stages in the menstrual cycle according to
data analysis. The range of ENDO-1 protein spot numbers was between
5 and 12. When compared with the number of infertile women who had
no EM (average no. 8) and the normal controls (average no. 7), the
spot number of the EM patients (average no. 11) was higher. Wherein
there was a protein with an isoelectric point of 5.8, and a
molecular weight of 32 kDa (termed EPF-32), which was elevated in
the peritoneal fluid in 18 of the 19 EM patients, two of the seven
patients in the infertility group and none of the patients in the
control group. In the present study, the ENDO-2-like protein was
not observed in the peritoneal fluid and whether EPF-32 is a
diagnostic marker for EM was not verified. Küster et al
(8) conducted a study of 24 female
patients, who were divided into four groups: The mild EM group, the
severe EM group, the simple infertility group and the normal
control group; with six cases per group. The peritoneal fluid was
analyzed with 2-DE proteome technology. The results revealed that
the type and quantity of the proteins had significant differences.
Demir et al (9) used the
proteome analysis of peritoneal mesothelial cells during the human
countercurrent blood induced transformation of epithelial cells to
interstitial cells. It has been observed that countercurrent
menstrual blood is capable of inducing the transformation of
peritoneal mesothelial epithelial cells into mesenchymal cells,
which may lead to cell contraction and the exposure of the
extracellular matrix. Endometrial tissue initially adhered to the
extracellular matrix and subsequently adhered to the entire
peritoneal cavity. The present study was designed to apply the
radioisotope tracer and proteomics technology (2-DE and
MALDI-TOF-MS) to detect the changes in protein expression and the
phosphorylation of intermediate skin cells during the process of
endometrial transformation. In total, 324 protein spots were
detected and analyzed, 73 of which were identified, including 35
proteins with expression changes associated with the cytoskeleton
signal transduction, the redox state and ATP generation, and four
proteins with abnormal phosphorylation, including integrin-1 (actin
junction protein and the substrate of tyrosine kinase receptor),
tropomyosin-α (regulator of actin stability and cell morphology),
elongation factor-1δ and the β-chain of ATP synthase.
The spot no. 108 in Han uterine EM serum was type I
cytoskeletal protein keratin 10, which is capable of reducing the
phosphorylation capacity of cells, thus affecting signaling, which
may in turn impact cell proliferation. Miettinen et al
(10) revealed that the expression
of keratin increased in the hemangioma tissues. In keratin
gene-transgenic mice, the epithelial cells in the pancreas may
exhibit atypical hyperplasia, which is related to cancer.
Biological pathway analysis identified that cytoskeletal remodeling
via keratin intermediate filaments, processing of cystic fibrosis
trans-membrane receptor, the glucocorticoid receptor subunit α and
heat shock factor 1 were all significantly over-represented
features in EM patients. Spot no. 137 was spindle-like protein 2
(SPIN2), which was located in the nucleus and may promote cell
proliferation and increase the ratio of cells in the G2/M phase
cells. Consequently, it may be a tumor formation-related oncogene.
Spot no. 84 was the major histocompatibility complex (MHC II
antigens), which has a regulatory role in the immune system and
translocates to the cell surface subsequent to binding to an
antigen. It has been hypothesized that certain defects in MHC II
class proteins cause mammals to be susceptible to diabetes. Gao
et al (11) revealed that
the MHC-I antigen on endometrial stromal cells may inhibit the
toxicity of natural killer (NK) and NK-like T cells, while the
level of MHC-I antigen may be adjusted. Cody et al (12) reported that ectopic endometrial
tissue may express the MHC II antigen, thus presenting
auto-antigens to the T and B cells and inducing endometrial
antibodies. These autoantigens are primarily small endometrial
proteins with molecular weights of 26, 34 and 42 kDa. The antigens
combined with antibodies and were deposited in the uterus and
ectopic lesions. The compound may activate the complement system
and destroy the structure of the endometrium. Under the electron
microscope, uterine cells exhibited a hypoplastic state,
endometrial glands and basement membrane cells appeared to undergo
mitosis, cell basal membranes had vacuoles, the ratio of ciliated
and non-ciliated tissue decreased and the endometrium appeared to
have inadequate secretion, which was not conducive to embryo
implantation, resulting in infertility or recurrent miscarriage
(13). Fainaru et al
(14) observed that MHC II are
capable of supporting angiogenesis and promoting the growth of EM
lesions. Protein spot no. 83 was similar to that of eukaryotic
initiation factor (EIF)-3. The protein spot with the same
difference as spot no. 26 (immunoglobulin heavy chain variable
region) was not reported to correlate with endometrial EM;
therefore, further investigation is required.
Spot no. 55 in Uyghur uterine EM serum was similar
to the actin-like-7-α and γ-aminobutyric-acid receptor subunit. The
former is a cytoskeletal protein involved in cell division,
movement and signaling, and the latter may adjust the transmission
of signals between nerve cells and inhibit neurons. It has been
reported (15) that the π subunits
of the γ-aminobutyric acid receptor are more abundant in the womb
and may alter the sensitivity of the receptor to endogenous steroid
hormones. Sadeghi et al (16) observed that HOXA10 was capable of
regulating the expression of the endometrial GABAA receptor and EM.
Its isoelectric point and molecular weight were particularly
similar to those of cyclin A1. Cyclin A1 is involved in the
regulation of G1/S and G2/M phase conversion and therefore
correlates closely with DNA replication and cell division. Spot no.
123 was similar to that of hepatocyte-derived growth factor (HDGF)
and the 14-3-3 protein family members. HDGF is one of the members
of growth factors, with a function of promoting growth of liver
cells, fibroblasts, smooth muscle cells and endothelial cells. The
expression of HDGF in numerous cancer patients is significantly
greater than that in healthy controls, indicating that HDGF
correlates with tumor cell growth and angiogenesis. The 14-3-3
protein is widely distributed in eukaryotic cells and through
binding to effector molecules it induces their phosphorylation,
which is important in cellular signal transduction. In the
diagnosis of cortex striatum spinal degeneration and subacute
spongiform encephalopathy, the 14-3-3 protein is likely to be an
important element. Ametzazurra et al (17) observed that the differential
expression of the 14-3-3 protein in signal transduction may be a
marker for EM. Zhang et al (18) demonstrated that the 14-3-3 protein
was lost in Han normal endometrial cells. Certain findings are
similar to those of differentially expressed proteins in Xinjiang
Uygur EM patients.
The results of the study by Zhang et al
(18) demonstrated that EM may be
a class of multifactorial diseases, similar to diabetes, asthma and
cancer. The preliminary view is that EM exhibits ethnic differences
in protein expression. However, the specific mechanisms for these
proteins during the pathogenesis of EM remains unclear and requires
further investigation. The identified proteins are expected to
become specific molecular markers and next step is to apply these
to develop a non-traumatic EM diagnostic test. This diagnostic test
should have ideal sensitivity, specificity, with a satisfactory
positive and negative prediction value and be cheap and simple to
obtain. Furthermore, according to the study of tumor-directed
therapy, nonspecific tumor antigens and antibody heterogeneity
markedly impact the development of orientated therapy. Therefore,
initially markers for EM must be located prior to creating an
EM-orientated treatment. With the progression and development of
proteomics research, numerous techniques may be applied to
investigate EM. The expression profiling of screened related
proteins with high throughput, sensitivity and accuracy is of great
significance in order to verify the molecular mechanisms underlying
the occurrence and development of EM, and to identify early
diagnostic markers and therapeutic targets.
References
|
1
|
Valle RF and Sciarra JJ: Endometriosis:
treatment strategies. Ann NY Acad Sci. 997:229–239. 2003.
View Article : Google Scholar : PubMed/NCBI
|
|
2
|
Dunn SR and Pennington MJ: Proteomics:
From Protein Sequence to Function. BIOS Scientific Publishers;
Oxford, UK: pp. 122–134. 2001
|
|
3
|
Rout MP, Aitchison JD, Suprapto A,
Hjertaas K, Zhao Y and Chait BT: The yeast nuclear pore complex:
composition, architecture, and transport mechanism. J Cell Biol.
148:635–651. 2000. View Article : Google Scholar : PubMed/NCBI
|
|
4
|
Newman JR, Wolf E and Kim PS: A
computationally directed screen identifying interacting coiled
coils from Saccharomyces cerevisiae. Proc Natl Acad Sci USA.
97:13203–13208. 2000. View Article : Google Scholar : PubMed/NCBI
|
|
5
|
Wall DB, Kachman MT, Gong SS, Parus SJ,
Long MW and Lubman DM: Isoelectric focusing nonporous silica
reversed-phase high-performance liquid chromatography/electrospray
ionization time-of-flight mass spectrometry: a three-dimensional
liquid-phase protein separation method as applied to the human
erythroleukemia cell-line. Rapid Commun Mass Spectrom.
15:1649–1661. 2001.
|
|
6
|
Wang H and Hanash S: Multi-dimensional
liquid phase based separations in proteomics. J Chromatogr B Analyt
Technol Biomed Life Sci. 787:11–18. 2003. View Article : Google Scholar : PubMed/NCBI
|
|
7
|
Nisolle M, Casanas-Roux F and Donnez J:
Immunohistochemical analysis of proliferative activity and steroid
receptor expression in peritoneal and ovarian endometriosis. Fertil
Steril. 68:912–919. 1997. View Article : Google Scholar : PubMed/NCBI
|
|
8
|
Küster B, Mortensen P, Andersen JS and
Mann M: Mass spectrometry allows direct indetification of protein
in large genomes. Protemics. 1:641–650. 2001.
|
|
9
|
Demir AY, Groothuis PG, Nap AW, Punyadeera
C, de Goeij AF, Evers JL and Dunselman GA: Menstrual effluent
induces epithelial-mesenchymal transitions in mesothelial cells.
Hum Reprod. 19:21–29. 2004. View Article : Google Scholar : PubMed/NCBI
|
|
10
|
Miettinen M and Fetsch JF: Distribution of
keratins in normal endothelial cells and a spectrum of vascular
tumors: implications in tumor diagnosis. Hum Pathol. 31:1062–1067.
2000. View Article : Google Scholar : PubMed/NCBI
|
|
11
|
Gao YH, Qi NL, Zhang P, et al: A novel
human gene spindlin 1, encoding a protein localized in the cell
nucleus and inducing NIH3T3 cell’s transformation. Prog Nat Sci.
14:1058–1062. 2004.(In Chinese).
|
|
12
|
Cody CW, Prasher DC, Westler WM,
Prendergast FG and Ward WW: Chemical structure of the hexapeptide
chromophore of the Aequorea green-fluorescent protein.
Biochemistry. 32:1212–1218. 1993. View Article : Google Scholar : PubMed/NCBI
|
|
13
|
Clup P, Nüsslein-Volhard C and Hopkins N:
High-frequency germ-line transmission of plasmid DNA sequences
injected into fertilized zebrafish eggs. Proc Natl Acad Sci USA.
88:7953–7957. 1991. View Article : Google Scholar : PubMed/NCBI
|
|
14
|
Fainaru O, Adini A, Benny O, et al:
Dendritic cells support angiogenesis and promote lesion growth in a
murine model of endometriosis. FASEB J. 22:522–529. 2008.
View Article : Google Scholar : PubMed/NCBI
|
|
15
|
Braun DP, Ding J, Shen J, Rana N,
Fernandez B and Dmowski WP: Relationship between apoptosis and the
number of macrophages in eutopic endometrium from women with and
without endometriosis. Fertil Steril. 78:830–835. 2002. View Article : Google Scholar : PubMed/NCBI
|
|
16
|
Sadeghi H and Taylor HS: HOXA10 regulates
endometrial GABAA π receptor expression and membrane translocation.
Am J Physiol Endocrinol Metab. 298:E889–E893. 2010.PubMed/NCBI
|
|
17
|
Ametzazurra A, Matorras R, García-Velasco
JA, et al: Endometrial fluid is a specific and non-invasive
biological sample for protein biomarker identification in
endometriosis. Hum Reprod. 24:954–965. 2009. View Article : Google Scholar : PubMed/NCBI
|
|
18
|
Zhang H, Niu Y, Feng J, Guo H, Ye X and
Cui H: Use of proteomic analysis of endometriosis to identify
different protein expression in patients with endometriosis versus
normal controls. Fertil Steril. 86:274–282. 2006. View Article : Google Scholar : PubMed/NCBI
|