Introduction
Human renal cell carcinoma (RCC) is the most common
and lethal type of malignant kidney tumor. Clear-cell renal cell
carcinoma is the most common type of RCC, constituting 85% of cases
(1). At the localized stage, RCC
is considered resectable; however, 30% patients with limited
disease at surgery experience metastasis within three years
(2). Once RCC metastasizes, the
prognosis is poor (3). Therapeutic
options for advanced RCC are limited since RCC is resistant to
conventional chemotherapy (4,5).
Novel treatment options include immunotherapy (6), monoclonal antibody treatment
(7), targeted treatment (8) and inhibition of signal transductions
(9). Recently, molecular markers
have been evaluated in terms of their prognostic predictive ability
and potential as therapeutic targets for RCC (10,11);
however, the molecular mechanisms underlying RCC progression and
development remain unclear.
The dynamic structure of the cell membrane is
important in a number of biological processes, such as cell growth,
cell migration, cell survival and metastasis. Glycolipoprotein
microdomains, or lipid rafts, serve as physical platforms for
various molecules to coordinate a variety of signal-transduction
pathways (12–14). As lipid rafts have been reported to
be involved in the initiation and development of numerous types of
cancer (15,16), lipid rafts may be novel therapeutic
targets against malignant tumors (17,18).
The flotillin protein family (also known as the
reggie family) contains two homologous isoforms, FLOT1 and FLOT2,
which are essential markers of lipid rafts (19–21).
FLOT1 and FLOT2 interact to form a complex that is important in
biological processes, such as membrane receptor signaling, membrane
trafficking, cell motility and adhesion (22). FLOT1 and FLOT2 also activate signal
transductions by binding with membrane-resident receptor kinases.
Insulin stimulation may enhance FLOT1-Cbl-Cbl-associated protein
complex formation, which generates a signal that is important for
the uptake of glucose in adipocytes (23).
Increased Fyn kinase activation has been reported to
result in flotillin translocation from the plasma membrane to
intracellular organelles and thus involvement in tyrosine
kinase-regulated endocytosis (24). In addition to FLOT1 and FLOT2
functions in cellular and organelle membranes, flotillins are also
involved in tumorigenesis and the progression of different types of
human tumor (25,26). Overexpression of FLOT1 increases
the activity of the Aurora B kinase and results in incorrect
attachment of microtubules to kinetochores, which suggests that
FLOT1 is associated with genomic instability (27). Furthermore, FLOT1 expression has
been observed to be upregulated in cancer types originating in
epithelial cells, such as colorectal and esophageal squamous cell
cancer (28,29). In another study, overexpression of
FLOT1 was reported to enhance the proliferation of PC-3 prostate
cancer cells (30). All findings
suggest that FLOT1 may be critical in the progression of malignant
tumors. In the present study, the expression levels of FLOT1 and
its effect on the proliferative ability of human RCC cells were
investigated.
Materials and methods
Patients and tissue samples
This study was approved by the ethics committee of
the First Affiliated Hospital of Chinese PLA General Hospital
(Beijing, China). A total of 182 patients who had undergone radical
surgical treatment for RCC at the Department of Urology, First
Affiliated Hospital of Chinese PLA General Hospital were recruited
between 1998 and 2003. All patients were informed of the content
and agreed to join in the present study. All tumors were determined
to be conventional clear-cell RCC by experienced pathologists who
were blinded to the patient data. Tumor characteristics and stage
were classified using the tumor-node-metastasis (TNM)
classification system, and the nuclear grade was assessed according
to the Fuhrman tumor grading system (31,32).
The RCC samples and corresponding normal healthy renal tissue
samples, located as far as possible from the tumor site, were
surgically removed, fixed in formalin, dehydrated and
paraffin-embedded. All samples were frozen in liquid nitrogen
immediately following surgical resection and maintained at −90°C
for protein and RNA extraction. Postoperative patients with RCC
underwent routine checkups and follow-ups at the outpatient clinic
in our hospital for 10 years. Blood biochemistry tests,
ultrasonography, magnetic resonance imaging or computed tomography
were performed during the follow up.
Cell culture
Four RCC cell lines, ACHN, Caki-1, NC 65 and A498
cells, were obtained from the American Type Culture Collection
(Rockville, MD, USA) and cultured in complete medium consisting of
RPMI-1640 medium (Gibco, Bio-Cult Diagnostics Limited, Glasgow,
UK), 2 mM L-glutamine, 25 mM HEPES, 10% heat-inactivated fetal
bovine serum, 100 units/ml penicillin, 100 μg/ml streptomycin and
1% nonessential amino acids purchased from Invitrogen Life
Technologies (Carlsbad, CA, USA). All cell lines were maintained as
monolayers in a 10-cm plastic dish and incubated in a humidified
atmosphere containing 5% CO2 at 37°C.
RCC xenograft
BALB/C nude mice, aged 3 or 4 weeks, were purchased
from CAMS Laboratories (Beijing, China) and randomly divided into
control and FLOT1 vector groups containing 15 mice each. A total of
2×10⁷ RCC cells was injected into the back of each
mouse. All mice were observed and tumor volumes were recorded once
a week. After five weeks, all mice were sacrificed by decapitation
under deep anesthesia and the final volume of each tumor was
measured.
WST-1 assay
Exponentially growing RCC cells were harvested,
seeded in a 96-well microtiter plate (Corning Inc., Corning, NY,
USA) and placed in an incubator. At 24, 48 and 72 h, 10 μl WST-1
(Roche Diagnostics GmbH, Penzberg, Germany) was added to each well
and the incubation was continued for an additional 2 h. The
absorbance, reflected in the cell count in each well, was measured
with a microculture plate reader (Immunoreader; Japan Intermed Co.
Ltd., Tokyo, Japan) at 450 nm.
Immunohistochemistry
Paraffin sections (5 μm) were deparaffinized in
xylene and rehydrated using graded alcohol. Endogenous peroxidase
activity was inhibited with administration of 0.3% hydrogen
peroxide for 15 min. The sections were blocked with 20% normal
rabbit serum (Sigma, St. Louis, MO, USA) for 30 min prior to 1-h
incubation with primary FLOT1 rabbit monoclonal antibody (Cell
Signaling Technology, Inc., Danvers, MA, USA). The slides were
washed twice in Tris-buffered saline and incubated with
biotinylated rabbit anti-rabbit antibody (Dako, Glostrup, Denmark).
Detection of the antibody reaction was performed using a standard
streptavidin-biotin complex (Sigma). The immunohistochemistry
results were obtained using a light microscope (Olympus BH2;
Olympus, Tokyo, Japan) and FLOT1 immunostaining was conducted to
semiquantitatively evaluate the slides for intensity (−, negative;
+, weak; ++, moderate and +++, strong staining).
Reverse transcription (RT) and
RT-quantitative polymerase chain reaction (RT-qPCR)
mRNA was isolated from normal and RCC tissue using
the QuickPrep mRNA purification kit (GE Healthcare, Little
Chalfont, UK) according to the manufacturer’s instructions. A
first-strand cDNA synthesis kit (Amersham Biosciences, Amersham,
UK) was used for reverse transcription. The PCR conditions were
determined according to the manufacturer’s instructions and the PCR
product was confirmed using agarose gel electrophoresis. qPCR was
conducted with the LC FastStart DNA Master SYBR Green I (Roche
Applied Science, Penzberg, Germany) and the products were
quantified with a LightCycler (Roche Applied Science). The primers
used were as follows: forward: 5′-CCCATCTCAGTCACTGGCATT-3′ and
reverse: 5′-CCGCCAACATCTCCTTGTTC-3′ for FLOT1; and forward:
5′-ATCAAGAAGGTGGTGAAGCAGG-3′ and reverse: 5′-GTGGAGGAGTGGGTGTCGC-3′
for GAPDH.
Western blotting
The protein was extracted and protein concentration
assessed according to the manufacturer’s instructions, and SDS
polyacrylamide gel electrophoresis was performed. FLOT1 antibody
(dilution 1:1,000) and secondary HRP conjugated antibody (dilution
1:2,000) were was purchased from Cell Signaling Technology, Inc..
Anti-β-actin monoclonal antibody (Abcam, Cambridge, UK) served as a
loading control. The immune complexes were examined using
electrochemiluminescence (Amersham, Aylesbury, UK).
Small interfering (si)RNA and
transfection
siRNA oligonucleotide sequences were designed with
siDirect software (University of Tokyo, Tokyo, Japan). RCC cells
were seeded in plastic culture dishes in complete medium without
antibiotics until 40 to 50% confluence was achieved. The cells were
then transfected with siRNA oligonucleotides using Lipofectamine
2000 (Invitrogen Life Technologies). After 48 h incubation, gene
expression was confirmed with western blotting. The coding sequence
of human FLOT1 was cloned using RT-PCR with HK-2 normal kidney cell
line (purchased from ATCC, Manassas, VA, USA) cDNA as a substrate,
and the products were subcloned into pcDEF3, a mammalian expression
vector (Invitrogen Life Technologies). The RCC cell lines were
stably transfected with Lipofectamine 2000. Using this expression
vector, which contained full-length FLOT1 cDNA, monoclonal
antibodies were selected using G418 aminoglycoside antibiotics
(Calbiochem, Bad Soden, Germany) and gene expression was confirmed
by western blotting.
Statistical analysis
SPSS version 13.0 (SPSS, Inc., Chicago, IL, USA) was
used to perform statistical calculations. All experiments were
performed in triplicate and the results expressed as the mean ±
standard deviation. Statistical significance was determined using
Student’s t-test, and the χ2 test was used to evaluate
the association between FLOT1 expression levels and
clinicopathological parameters. Survival curves were plotted using
Kaplan-Meier analysis. P≤0.05 was considered to indicate a
statistically significant difference.
Results
Patient characteristics
Subjects comprised 99 male and 83 female patients,
aged 42–86 years (mean age, 64 years). The RCC tumor sizes were
between 2 and 13 cm (average, 4.5 cm). A total of 98 patients had
stage I cancer, 47 had stage II, 23 had stage III and 14 had stage
IV. With regards to Fuhrman tumor grade, 97 patients had grade 1,
60 had grade 2 and 25 had grade 3. The presenting symptoms included
flank pain (21 patients), hematuria (19 patients) and detection of
a palpable mass (15 patients).
Malignancy was an incidental finding on routine
examination in 98 patients. Laboratory examination at diagnosis
revealed an elevated sedimentation rate in 32 patients, while
anemia, thrombocytopenia and erythrocytosis were each identified in
two patients. A total of 37 patients suffered from one or more
comorbidities, including diabetes mellitus, urolithiasis, angina
pectoris and valvular heart disease. Five patients had previously
been treated with a radical nephrectomy on the other side and 12
patients exhibited metastatic disease at diagnosis.
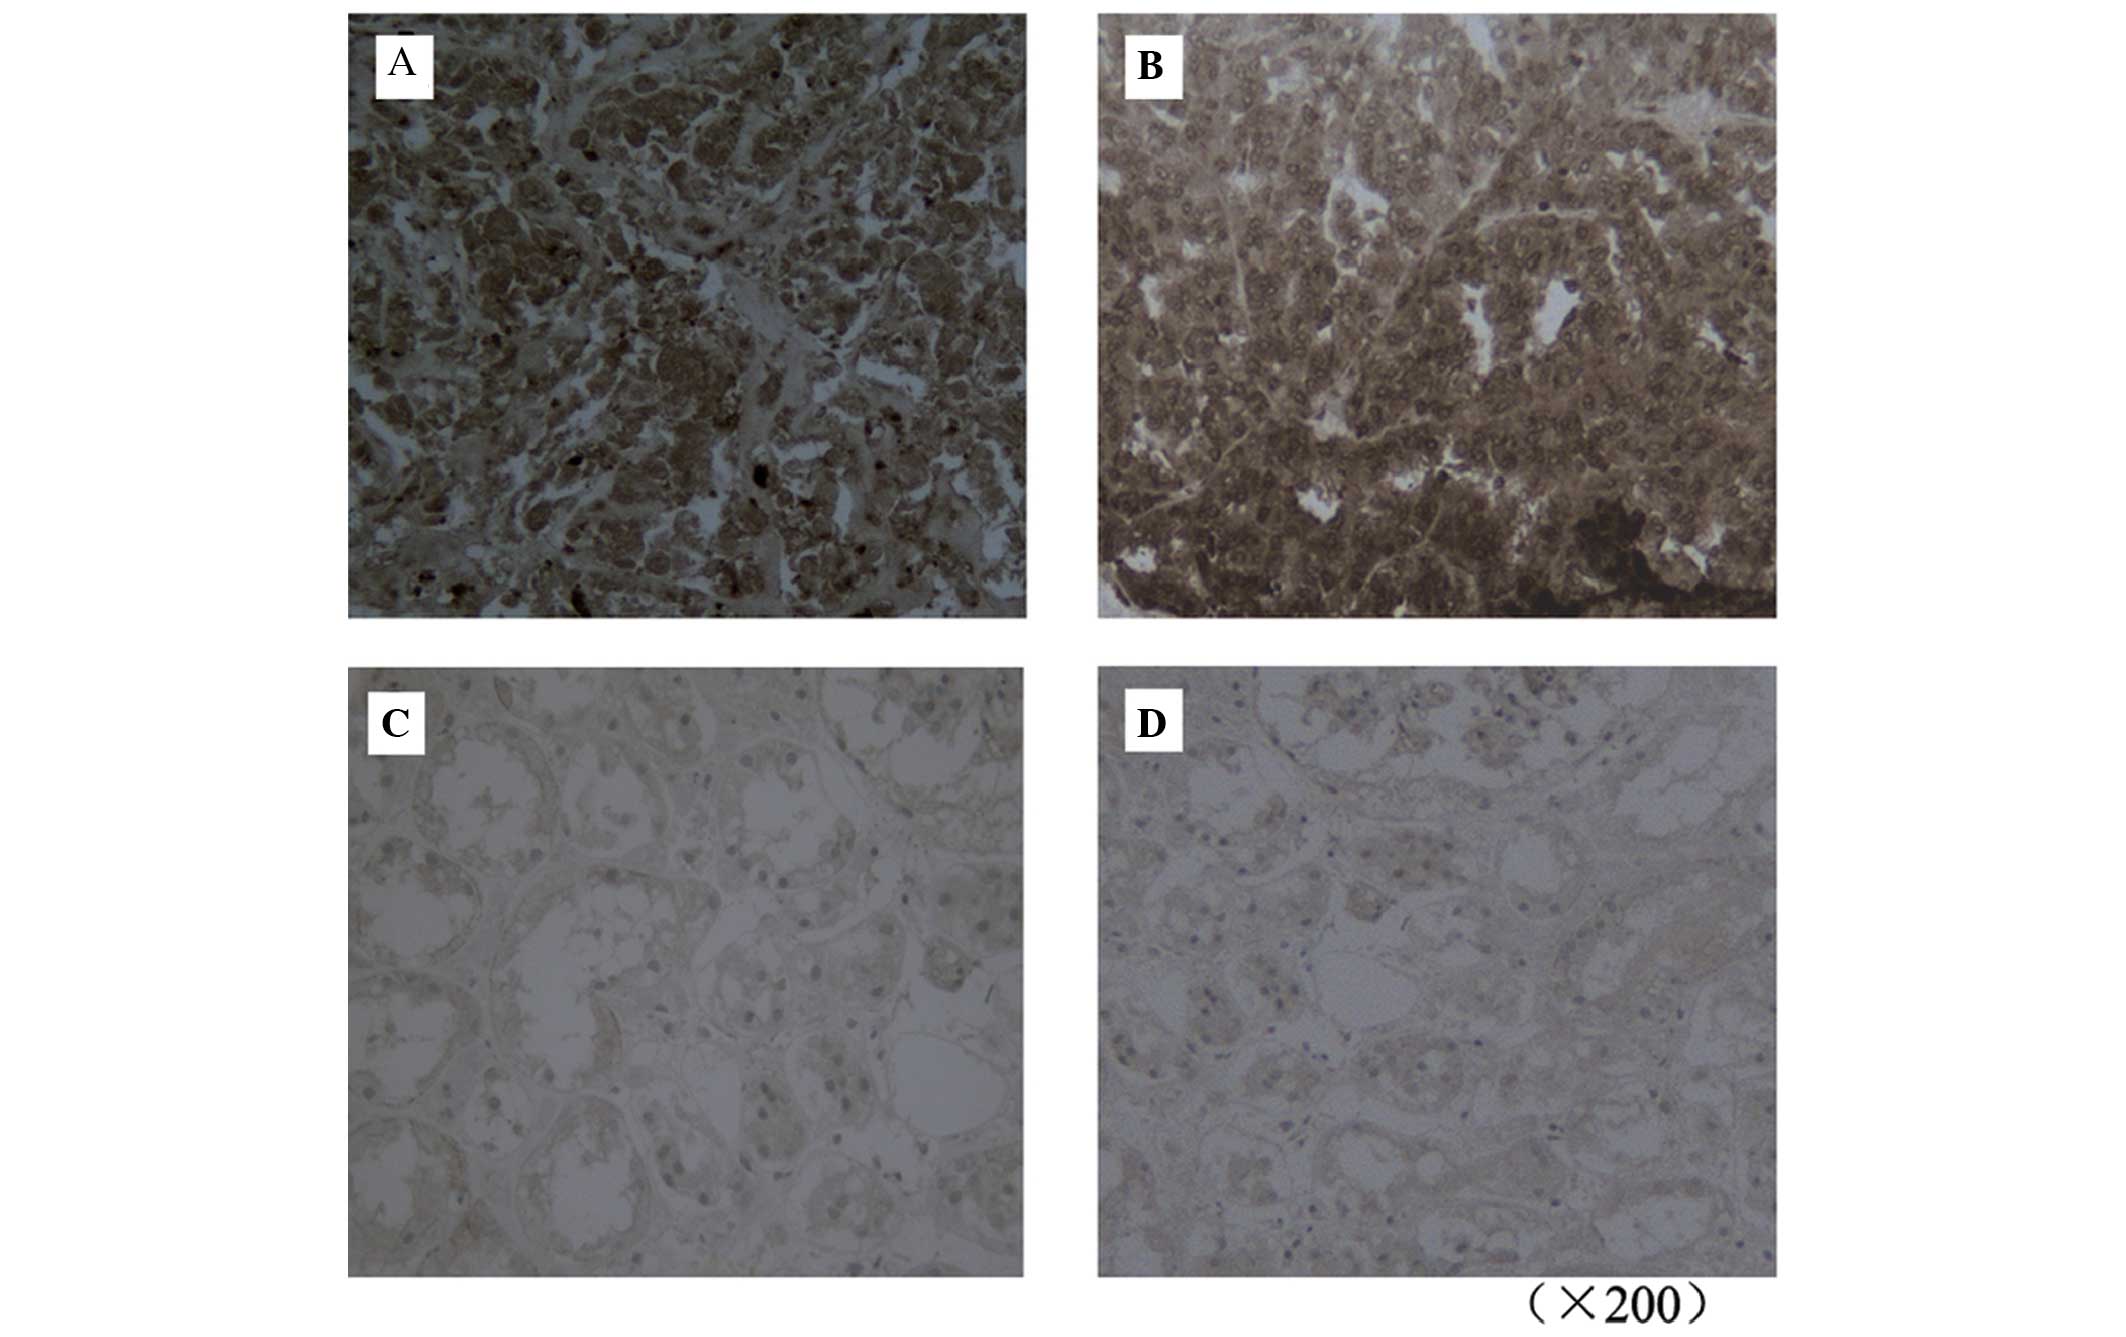
FLOT1 protein expression levels in
RCC
FLOT1 protein expression levels in human RCC and
normal healthy renal tissue were determined using
immunohistochemistry. FLOT1 expression was upregulated in RCC
tissue compared with in the corresponding normal renal tissue
(Fig. 1). FLOT1 expression was
observed in 163 of 182 RCC tumors (89.6%) but in only 29 of 182
(15.9%) normal renal tissue samples. χ2 analysis
revealed significant associations between increased FLOT1 protein
expression levels and advanced tumor stage, high histological grade
and large tumor size (all P<0.05). However, no significant
differences were detected between gender and age variables and
FLOT1 protein expression levels (Table
I). The results from this sample analysis suggest that FLOT1 is
involved in tumorigenesis and RCC progression.
 | Table ICharacteristics of patients with renal
cell carcinoma and FLOT1 expression levels detected using reverse
transcription-quantitative polymerase chain reaction and
immunohistochemistry. |
Table I
Characteristics of patients with renal
cell carcinoma and FLOT1 expression levels detected using reverse
transcription-quantitative polymerase chain reaction and
immunohistochemistry.
| | | | FLOT1 protein | |
|---|
| | | |
| |
|---|
| Variable | n | FLOT1 mRNA (mean ±
SD) | P-value | − | + | ++ | +++ | P-value |
|---|
| Renal cell
carcinoma | 182 | 1.53±0.26 | | 19 | 84 | 48 | 31 | |
| Healthy kidney | 182 | 0.41±0.12 | <0.05 | 153 | 21 | 8 | 0 | <0.05 |
| Gender |
| Male | 99 | 1.51±0.28 | | 11 | 46 | 26 | 16 | |
| Female | 83 | 1.55±0.24 | >0.05 | 8 | 38 | 22 | 15 | >0.05 |
| Age (years) |
| <60 | 101 | 1.53±0.22 | | 10 | 46 | 28 | 17 | |
| ≥60 | 81 | 1.52±0.26 | >0.05 | 9 | 38 | 20 | 14 | >0.05 |
| Tumor size (cm) |
| ≤7 | 98 | 1.02±0.29 | | 15 | 69 | 9 | 5 | |
| >7 | 84 | 2.12±0.35 | <0.05 | 4 | 15 | 39 | 26 | <0.05 |
| Histologic grade
(G) |
| G1 | 97 | 0.81±0.18 | | 15 | 65 | 14 | 3 | |
| G2 | 60 | 1.71±0.27 | | 4 | 19 | 31 | 6 | |
| G3 | 25 | 3.92±0.36 | <0.05 | 0 | 0 | 3 | 22 | <0.05 |
| Tumor stage |
| I | 98 | 1.02±0.29 | | 17 | 69 | 9 | 3 | |
| II | 47 | 1.53±0.25 | | 2 | 15 | 26 | 4 | |
| III | 23 | 2.49±0.38 | | 0 | 0 | 11 | 12 | |
| IV | 14 | 3.54±0.42 | <0.05 | 0 | 0 | 2 | 12 | <0.05 |
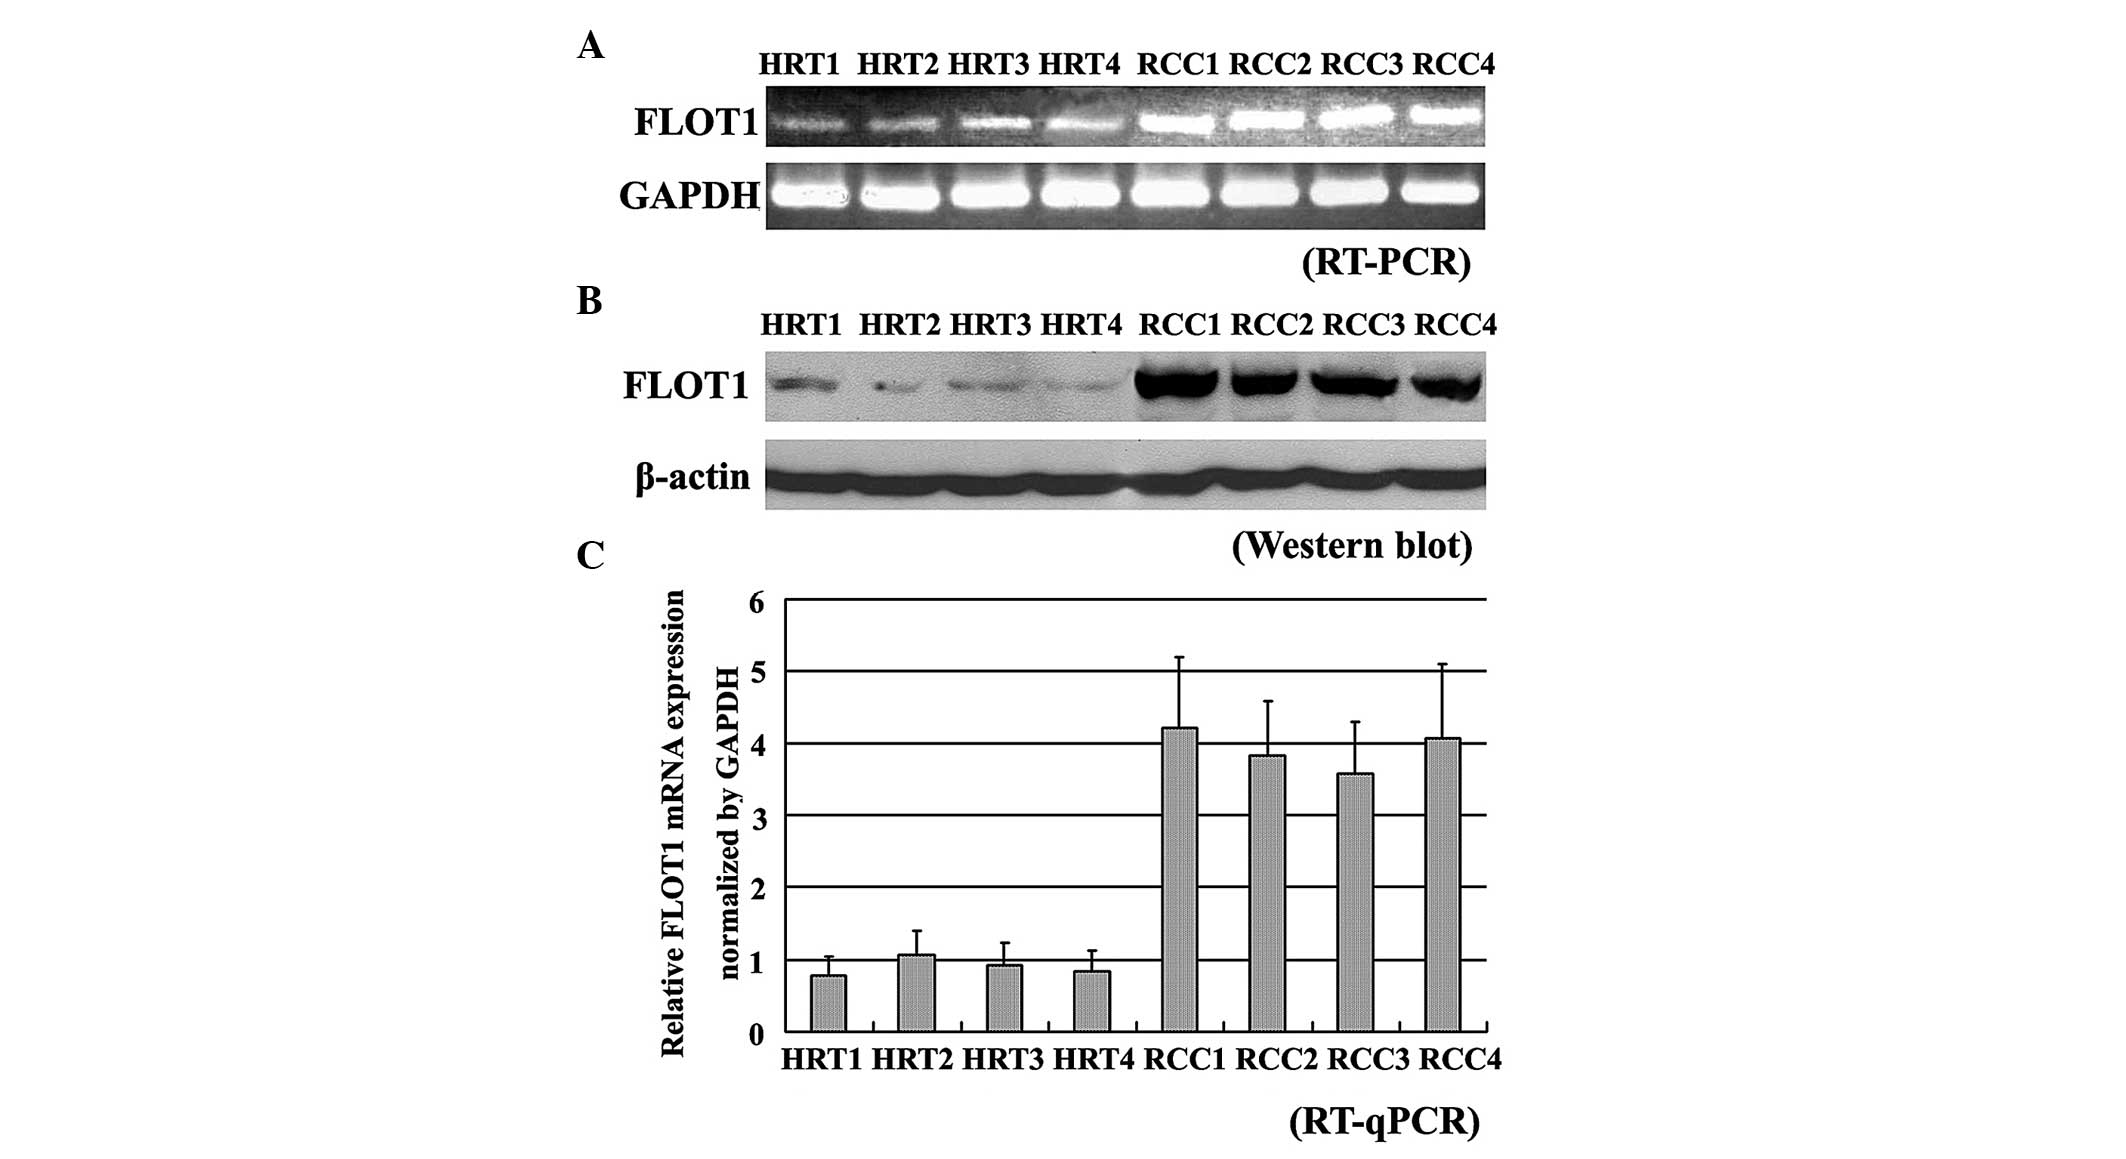
FLOT1 expression levels analyzed by
RT-qPCR and western blotting
To confirm the results demonstrating upregulated
FLOT1 expression in RCC through immunohistochemical analysis,
RT-qPCR and western blotting were used to measure FLOT1 expression
levels in human RCC and normal healthy renal tissue. The levels of
FLOT1 expression were determined relative to an internal control.
The results indicated that FLOT1 expression was upregulated to a
significantly greater extent in RCC than in the corresponding
normal renal tissue (P=0.001) and that FLOT1 expression levels were
similar to those detected using immunohistochemistry in all
samples. The results of four pairs of samples are shown in Fig. 2.
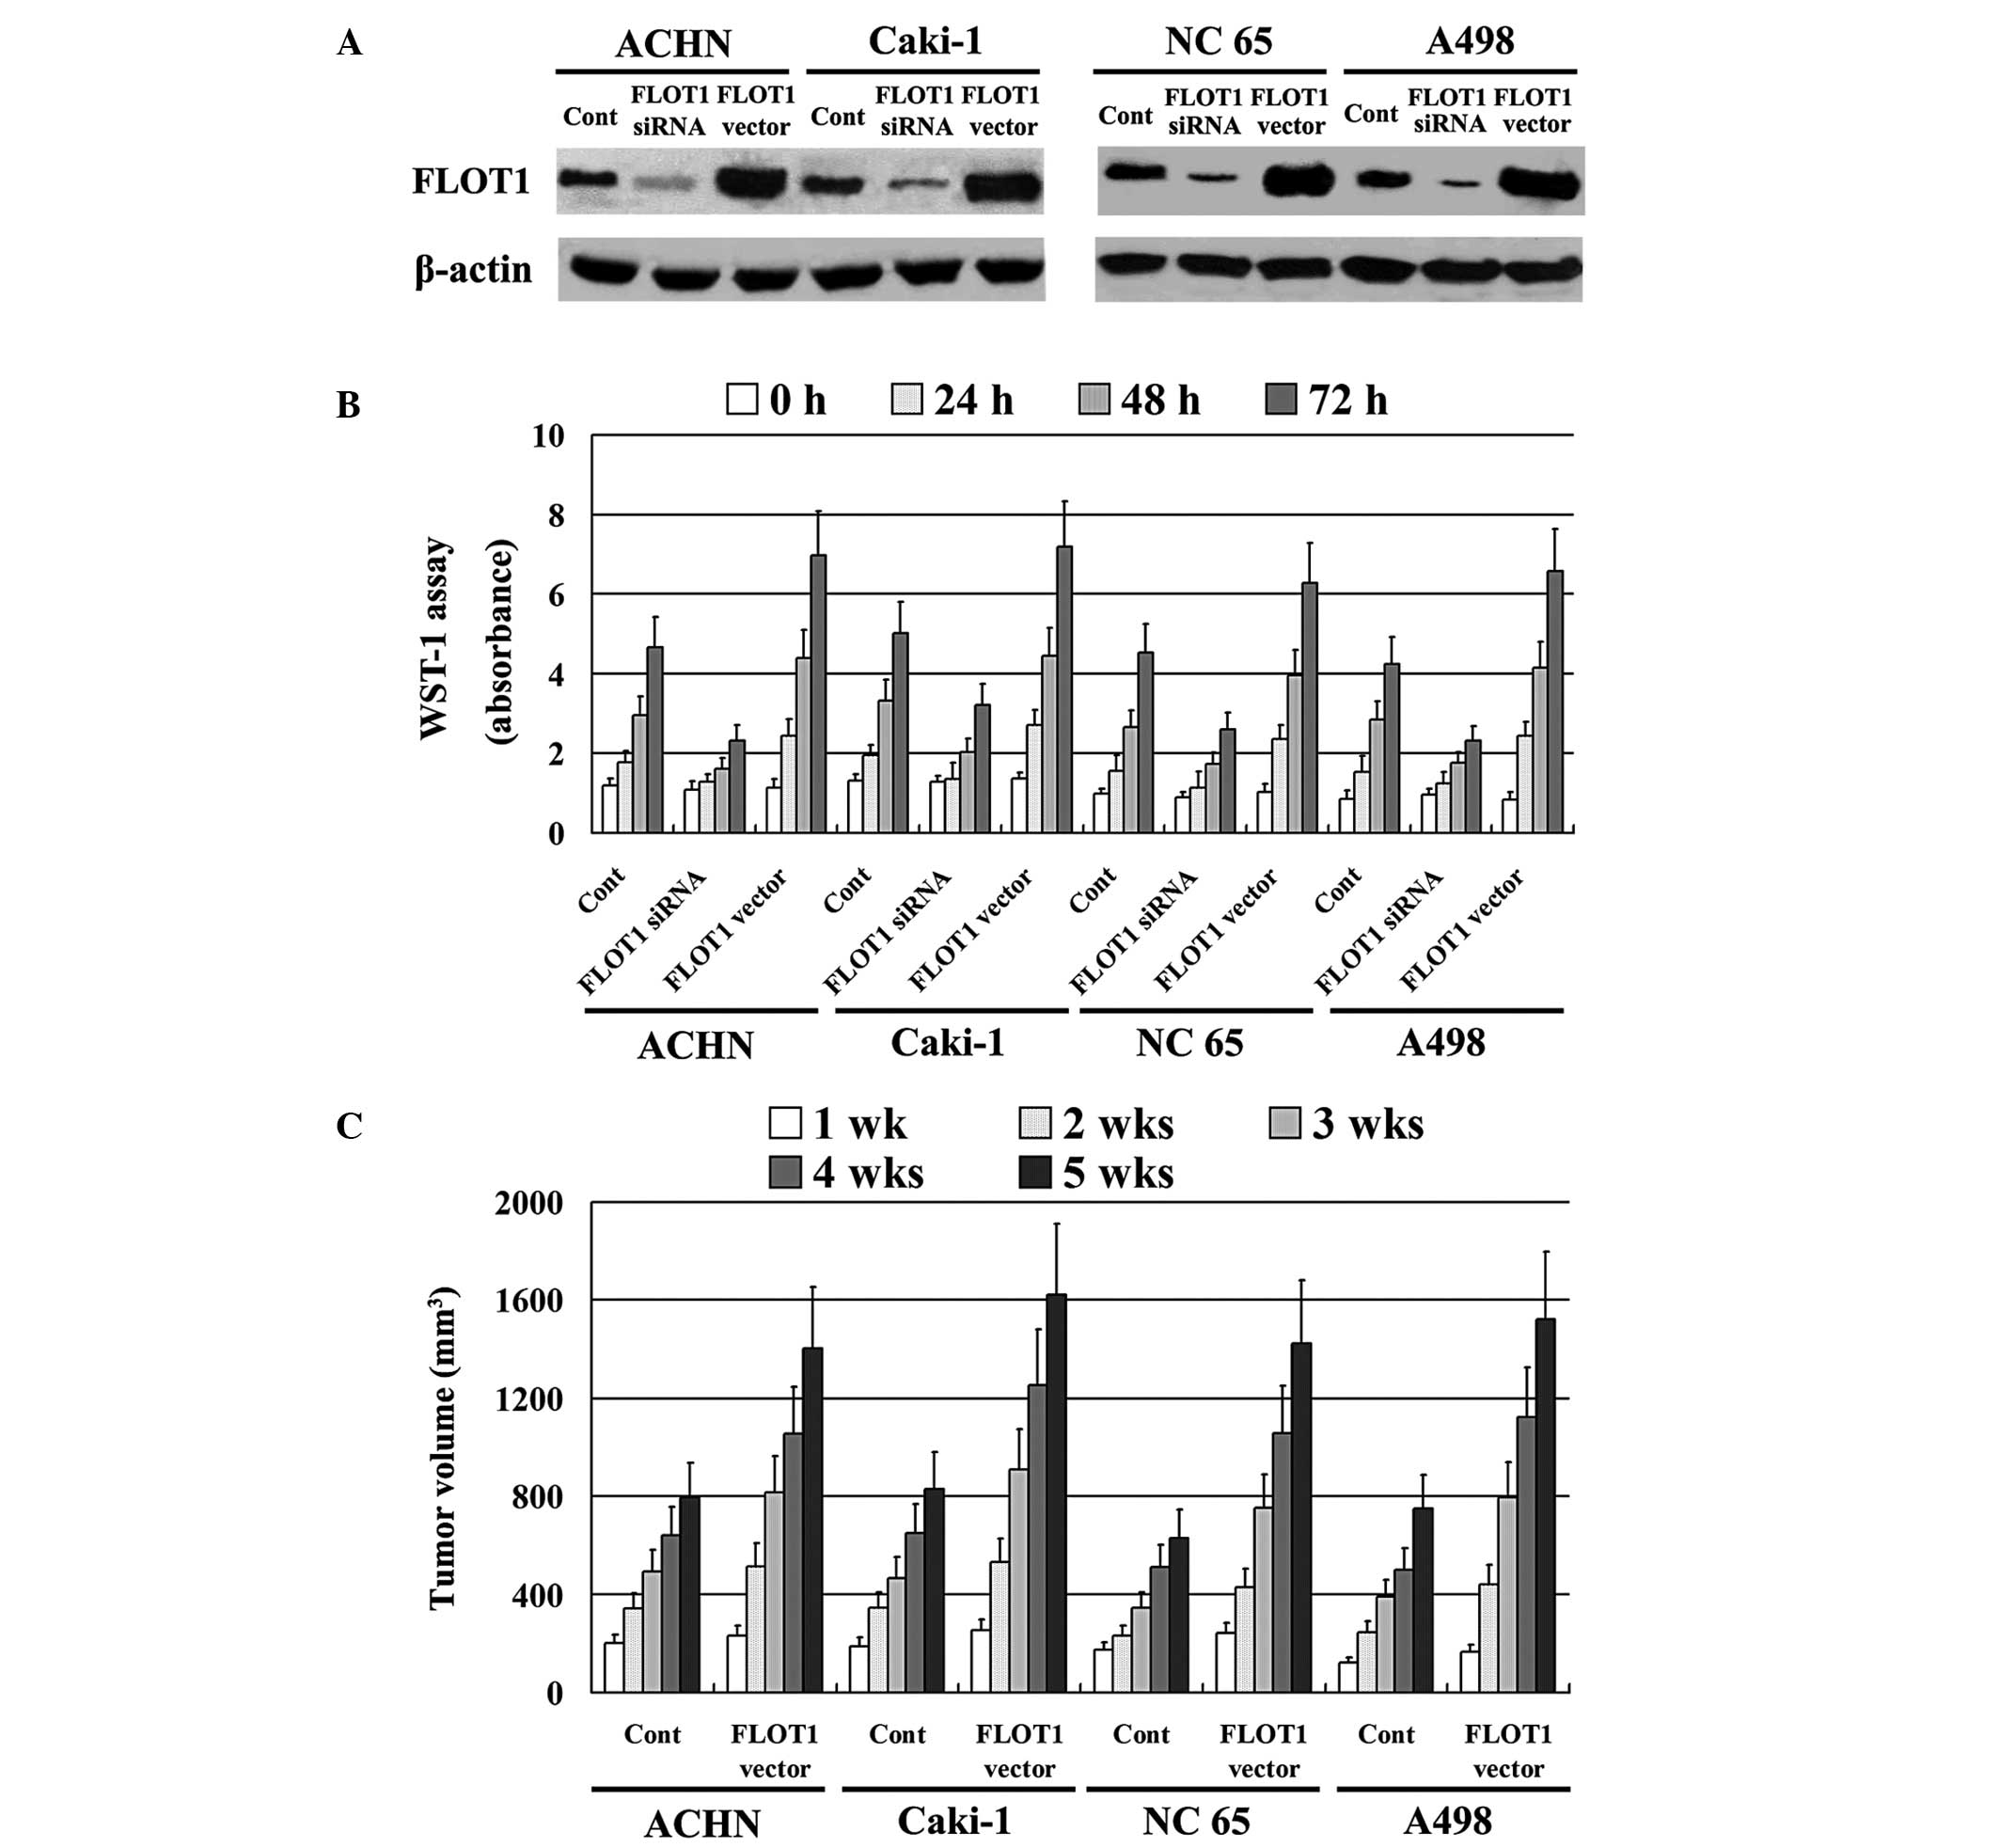
Effect of FLOT1 on RCC cell
proliferation
An expression vector containing full-length FLOT1
cDNA was stably transfected into ACHN, Caki-1, NC 65 and A498 cell
lines, and siRNA was used to inhibit FLOT1 expression. All
transfections were confirmed by western blotting. FLOT1 expression
was significantly downregulated by siRNA and upregulated by the
FLOT1 vector insertion (Fig. 3A).
The effect of FLOT1 on RCC cell proliferative ability in
vitro was analyzed using a WST-1 assay, which revealed that RCC
cells expressing high levels of FLOT1 exhibited significantly
higher proliferative ability than control cells (P=0.001). By
contrast, RCC cells with low FLOT1 expression levels, due to siRNA
administration, exhibited lower proliferative ability (P=0.002;
Fig. 3B). Similar results were
observed in vivo in the xenograft experiment with BALB/C
nude mice (P=0.001; Fig. 3C).
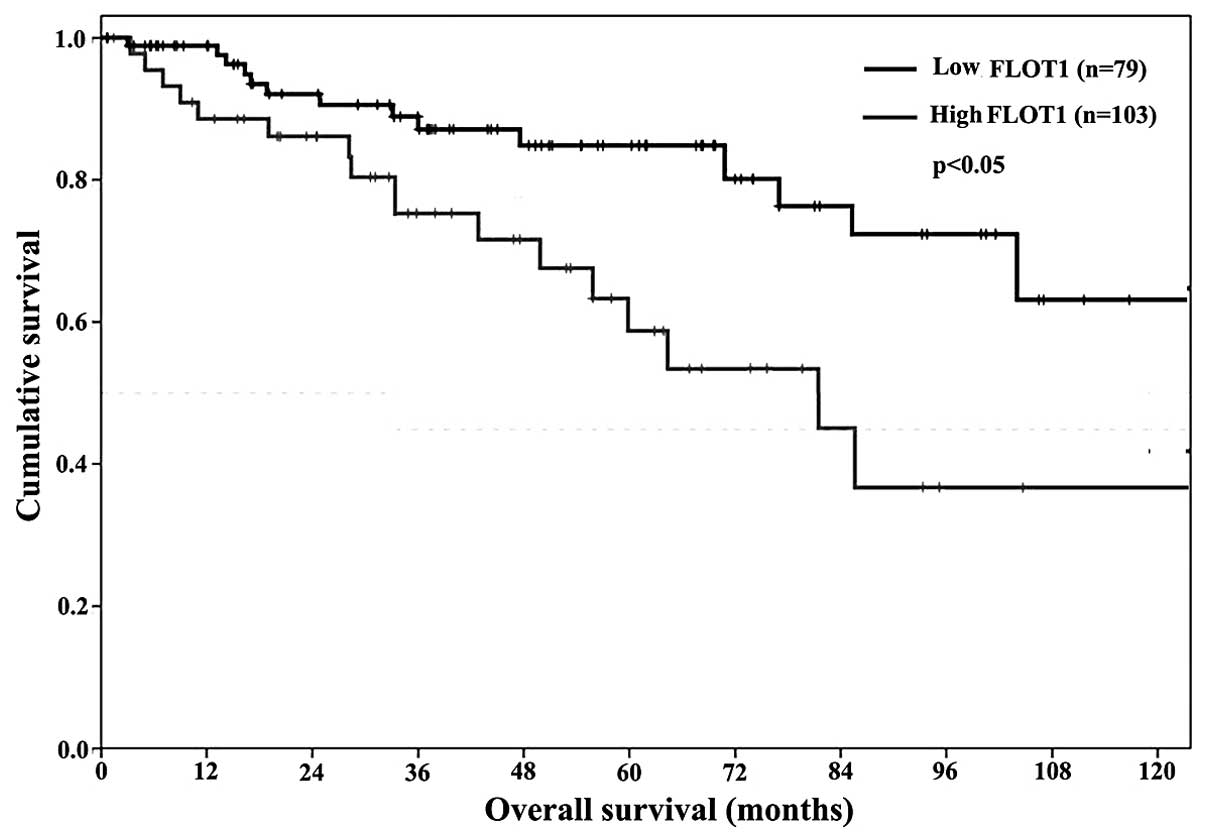
Prognostic significance of FLOT1
expression levels
As FLOT1 expression levels, and RCC stage and grade
were correlated, the possibilities for FLOT1 as a prognostic marker
in human RCC were investigated. Kaplan-Meier analysis was used to
calculate the association between the FLOT1 expression levels
detected by immunohistochemistry (classified as low, − or +; or
high, ++ or +++) and patient survival times. A total of nine
patients succumbed to myocardial infarction and five patients
succumbed to disseminated malignant disease. The average survival
time was significantly greater in the group with low FLOT1
expression levels compared with the group with high FLOT1
expression levels (P<0.05; Fig.
4). After 10 years follow-up, 51 of 79 (64.6%) patients with
low FLOT1 expression levels were alive and disease-free, compared
with 35 of 103 (34%) patients with high FLOT1 expression levels.
Therefore, FLOT1 expression levels were an independent prognostic
marker.
Discussion
In recent years, FLOT1 has received considerable
attention regarding its involvement in tumorigenesis; FLOT1
expression has been observed in different types of human tumor. The
present study found that FLOT1 expression was increased in patients
with RCC compared with normal individuals. Pathological analysis
revealed that FLOT1 was expressed in 163 out of 182 RCC patients
(89.6%) compared with 29 out of 182 (15.9%) in the controls. This
result was further confirmed using RT-PCR, western blot analysis
and RT-qPCR. These results demonstrated a correlation between FLOT1
expression and RCC. One study demonstrated that FLOT1 expression
levels are associated with aggressive hepatocellular carcinoma and
may be used as a prognostic marker in patients with this disease
(33). Another study indicated
that FLOT1 regulates ErbB2 activation in breast cancer (34) and that silencing FLOT1 expression
significantly suppresses the proliferation of breast cancer cells
in vitro and in vivo (35). A further study suggested that FLOT1
enhanced cell proliferation and invasive ability by activating the
nuclear factor-κB signaling pathway in esophageal squamous cell
carcinoma cells (25). In the
present study, statistical analysis of the data demonstrated a high
degree of association between increased FLOT1 expression and
advanced tumor stage, high histological grade and large tumor size.
Using FLOT1 siRNA transfection it was also demonstrated that the
absence of FLOT1 in renal carcinoma cell lines led to a significant
decrease in cell proliferation compared with cells transfected with
the FLOT1 vector. These results demonstrated that FLOT1 expression
may be essential in tumor growth and progression. Thus, high FLOT1
expression levels may be considered a valuable marker for
prediction of poor prognosis of patients with esophageal squamous
cell carcinoma and breast cancer (33). A Kaplan-Meier analysis of our data
on the correlation between FLOT1 expression and long term survival
revealed that patients with low FLOT1 expression had a higher
disease free survival rate, 51 out of 79 (64.6%) patients after 10
years, compared with 35 of 103 (34%) patients with high FLOT1
expression. This demonstrated that FLOT1 expression could be an
independent prognostic marker. These findings suggest that FLOT1
exhibits an oncogenic role in human tumors, including in PC-3
prostate cancer (30). prostate
cancer. However, to the best of our knowledge, this is the first
study regarding FLOT1 expression levels in human RCC.
In the present study, RCC patients with high levels
of FLOT1 expression were found to have poor survival times, thus
FLOT1 may be a useful prognostic marker and valuable in follow-up
monitoring of patients with RCC. Furthermore, silencing FLOT1
expression may prove to be a novel treatment strategy in the
future. An investigation into the detailed molecular mechanisms of
FLOT1 in clear-cell RCC is indicated.
References
|
1
|
Deng FM and Melamed J: Histologic variants
of renal cell carcinoma: does tumor type influence outcome? Urol
Clin North Am. 39:119–132. 2012. View Article : Google Scholar : PubMed/NCBI
|
|
2
|
Athar U and Gentile TC: Treatment options
for metastatic renal cell carcinoma: a review. Can J Urol.
15:3954–3966. 2008.PubMed/NCBI
|
|
3
|
Jemal A, Siegel R, Ward E, et al: Cancer
statistics, 2006. CA Cancer J Clin. 56:106–130. 2006. View Article : Google Scholar
|
|
4
|
Yu DS, Chang SY and Ma CP: The expression
of MDR-1-related gp-170 and its correlation with anthracycline
resistance in renal cell carcinoma cell lines and
multidrug-resistant sublines. Br J Urol. 82:544–547. 1998.
View Article : Google Scholar : PubMed/NCBI
|
|
5
|
Hartmann JT and Bokemeyer C: Chemotherapy
for renal cell carcinoma. Anticancer Res. 19:1541–1543.
1999.PubMed/NCBI
|
|
6
|
Coppin C: Immunotherapy for renal cell
cancer in the era of targeted therapy. Expert Rev Anticancer Ther.
8:907–919. 2008. View Article : Google Scholar : PubMed/NCBI
|
|
7
|
Dalle S, Thieblemont C, Thomas L and
Dumontet C: Monoclonal antibodies in clinical oncology. Anticancer
Agents Med Chem. 8:523–532. 2008. View Article : Google Scholar
|
|
8
|
Sciarra A, Gentile V, Salciccia S,
Alfarone A and Di Silverio F: New anti-angiogenic targeted therapy
in advanced renal cell carcinoma (RCC): current status and future
prospects. Rev Recent Clin Trials. 3:97–103. 2008. View Article : Google Scholar : PubMed/NCBI
|
|
9
|
Simpson D and Curran MP: Temsirolimus: in
advanced renal cell carcinoma. Drugs. 68:631–638. 2008. View Article : Google Scholar : PubMed/NCBI
|
|
10
|
Lam JS, Pantuck AJ, Belldegrun AS and
Figlin RA: Protein expression profiles in renal cell carcinoma:
staging, prognosis, and patient selection for clinical trials. Clin
Cancer Res. 13:703s–708s. 2007. View Article : Google Scholar : PubMed/NCBI
|
|
11
|
Netto GJ and Cheng L: Emerging critical
role of molecular testing in diagnostic genitourinary pathology.
Arch Pathol Lab Med. 136:372–390. 2012. View Article : Google Scholar : PubMed/NCBI
|
|
12
|
Lingwood D and Simons K: Lipid rafts as a
membrane-organizing principle. Science. 327:46–50. 2010. View Article : Google Scholar : PubMed/NCBI
|
|
13
|
Jacobson K, Mouritsen OG and Anderson RG:
Lipid rafts: at a crossroad between cell biology and physics. Nat
Cell Biol. 9:7–14. 2007. View Article : Google Scholar : PubMed/NCBI
|
|
14
|
Simons K and Toomre D: Lipid rafts and
signal transduction. Nat Rev Mol Cell Biol. 1:31–39. 2000.
View Article : Google Scholar
|
|
15
|
Patra SK: Dissecting lipid raft
facilitated cell signaling pathways in cancer. Biochim Biophys
Acta. 1785:182–206. 2008.PubMed/NCBI
|
|
16
|
Patra SK and Bettuzzi S: Epigenetic
DNA-methylation regulation of genes coding for lipid
raft-associated components: a role for raft proteins in cell
transformation and cancer progression (review). Oncol Rep.
17:1279–1290. 2007.PubMed/NCBI
|
|
17
|
Mollinedo F, de la Iglesia-Vicente J,
Gajate C, et al: Lipid raft-targeted therapy in multiple myeloma.
Oncogene. 29:3748–3757. 2010. View Article : Google Scholar : PubMed/NCBI
|
|
18
|
Hitosugi T, Sato M, Sasaki K and Umezawa
Y: Lipid raft specific knockdown of SRC family kinase activity
inhibits cell adhesion and cell cycle progression of breast cancer
cells. Cancer Res. 67:8139–8148. 2007. View Article : Google Scholar : PubMed/NCBI
|
|
19
|
Lang DM, Lommel S, Jung M, et al:
Identification of reggie-1 and reggie-2 as
plasmamembrane-associated proteins which cocluster with activated
GPI-anchored cell adhesion molecules in non-caveolar micropatches
in neurons. J Neurobiol. 37:502–523. 1998. View Article : Google Scholar
|
|
20
|
Stuermer CA, Lang DM, Kirsch F, et al:
Glycosylphosphatidyl inositol-anchored proteins and fyn kinase
assemble in noncaveolar plasma membrane microdomains defined by
reggie-1 and -2. Mol Biol Cell. 12:3031–3045. 2001. View Article : Google Scholar
|
|
21
|
Schulte T, Paschke KA, Laessing U,
Lottspeich F and Stuermer CA: Reggie-1 and reggie-2, two cell
surface proteins expressed by retinal ganglion cells during axon
regeneration. Development. 124:577–587. 1997.PubMed/NCBI
|
|
22
|
Banning A, Tomasovic A and Tikkanen R:
Functional aspects of membrane association of reggie/flotillin
proteins. Curr Protein Pept Sci. 12:725–735. 2011. View Article : Google Scholar : PubMed/NCBI
|
|
23
|
Baumann CA, Ribon V, Kanzaki M, et al: CAP
defines a second signaling pathway required for insulin-stimulated
glucose transport. Nature. 407:202–207. 2000. View Article : Google Scholar : PubMed/NCBI
|
|
24
|
Riento K, Frick M, Schafer I and Nichols
BJ: Endocytosis of flotillin-1 and flotillin-2 is regulated by Fyn
kinase. J Cell Sci. 122:912–918. 2009. View Article : Google Scholar : PubMed/NCBI
|
|
25
|
Song L, Gong H, Lin C, et al: Flotillin-1
promotes tumor necrosis factor-alpha receptor signaling and
activation of NF-kappaB in esophageal squamous cell carcinoma
cells. Gastroenterology. 143:995–1005. 2012. View Article : Google Scholar : PubMed/NCBI
|
|
26
|
Hazarika P, McCarty MF, Prieto VG, et al:
Up-regulation of Flotillin-2 is associated with melanoma
progression and modulates expression of the thrombin receptor
protease activated receptor 1. Cancer Res. 64:7361–7369. 2004.
View Article : Google Scholar : PubMed/NCBI
|
|
27
|
Santamaría A, Castellanos E, Gómez V, et
al: PTOV1 enables the nuclear translocation and mitogenic activity
of flotillin-1, a major protein of lipid rafts. Mol Cell Biol.
25:1900–1911. 2005.PubMed/NCBI
|
|
28
|
Thorn CC, Freeman TC, Scott N, Guillou PJ
and Jayne DG: Laser microdissection expression profiling of
marginal edges of colorectal tumours reveals evidence of increased
lactate metabolism in the aggressive phenotype. Gut. 58:404–412.
2009. View Article : Google Scholar
|
|
29
|
Lin C, Wu Z, Lin X, et al: Knockdown of
FLOT1 impairs cell proliferation and tumorigenicity in breast
cancer through upregulation of FOXO3a. Clin Cancer Res.
17:3089–3099. 2011. View Article : Google Scholar : PubMed/NCBI
|
|
30
|
Gómez V, Sesé M, Santamaría A, et al:
Regulation of aurora B kinase by the lipid raft protein
flotillin-1. J Biol Chem. 285:20683–20690. 2010.PubMed/NCBI
|
|
31
|
Fuhrman SA, Lasky LC and Limas C:
Prognostic significance of morphologic parameters in renal cell
carcinoma. Am J Surg Pathol. 6:655–663. 1982. View Article : Google Scholar : PubMed/NCBI
|
|
32
|
Delahunt B, Sika-Paotonu D, Bethwaite PB,
William Jordan T, Magi-Galluzzi C, Zhou M, Samaratunga H and
Srigley JR: Grading of clear cell renal cell carcinoma should be
based on nucleolar prominence. Am J Surg Pathol. 35:1134–1139.
2011. View Article : Google Scholar : PubMed/NCBI
|
|
33
|
Zhang SH, Wang CJ, Shi L, et al: High
expression of FLOT1 is associated with progression and poor
prognosis in hepatocellular carcinoma. PLoS ONE. 8:e647092013.
View Article : Google Scholar : PubMed/NCBI
|
|
34
|
Pust S, Klokk TI, Musa N, et al:
Flotillins as regulators of ErbB2 levels in breast cancer.
Oncogene. 32:3443–3451. 2013. View Article : Google Scholar : PubMed/NCBI
|
|
35
|
Lin C, Wu Z, Lin X, et al: Knockdown of
FLOT1 impairs cell proliferation and tumorigenicity in breast
cancer through upregulation of FOXO3a. Clin Cancer Res.
17:3089–3099. 2011. View Article : Google Scholar : PubMed/NCBI
|