Introduction
Mammalian spermatogenesis is a complex and highly
ordered process, in which a diploid progenitor germ cell transforms
to highly specialised spermatozoa. This process involves successive
mitotic, meiotic and post-meiotic phases. Once meiosis is
completed, haploid germ cells termed ‘round spermatids’ are
produced; these spermatids subsequently undergo a series of
differentiation steps collectively known as ‘spermiogenesis’. In
spermiogenesis, round spermatids develop a distinct head, midpiece
and tail region; round spermatids also undergo chromatin
remodelling, develop an acrosome and become almost completely
devoid of cytoplasm. These changes lead to the formation of
slender, elongated, mature spermatids, which are released into the
lumen of the seminiferous tubule during spermiation (1).
Round haploid spermatids initiate spermiogenesis;
successful spermiogenesis is necessary for fertilization, and
alterations of this process constitute an important cause of male
infertility. This process requires a precise and well coordinated
system that regulates the constantly changing patterns of gene and
protein expression (2). Therefore,
the identification of proteins present in the spermatids can not
only provide insights into the molecular basis of spemiogenesis,
but also facilitate the identification of cell-specific targets for
the diagnosis or induction of male infertility.
Numerous genes involved in spermatogenesis have been
identified by differential display (3), serial analysis of gene expression
(SAGE) (4) and microarray methods
(5). Nevertheless, these methods
do not provide pivotal information on the post-transcriptional
control of gene expression, changes in protein expression levels
and/or protein modifications. In this context, proteomics research
has emerged and enhanced our knowledge on cell behavior at the
system level, by revealing global patterns of protein content,
modification and activity during development (6). Experiments have also been conducted
to initiate differential protein expression profiling studies
and/or systematic analyses of testicular proteomes in entire organs
or isolated spermatogenic cells from various species. Several
groups have focused on sperm proteomes, and identified numerous
proteins that characterise sperm cells in different mammals
(7–11). Although proteomic analyses of the
sperm and of different developmental stages of the testis have been
performed in different mammalian species, the protein expression
profiles of spermiogenesis, particularly of round spermatids,
remain unclear.
Mass spectrometry (MS)-based proteomics technology
is a powerful tool for large-scale protein identification and
quantification (12). Previous
proteomic studies have used techniques such as two-dimensional
(2-D) polyacrylamide gel electrophoresis (PAGE) and 1-D PAGE of the
extracted protein mixture prior to liquid chromatography (LC)-MS/MS
identification. Although these techniques require the reduction of
sample complexity prior to LC-MS/MS analysis, proteins present in
small amounts may not be detectable on the gel, thereby limiting
the capacity of MS to identify a number of protein components. A
number of quantitative proteomic methods have been developed,
including stable isotope labeling and label-free methods (11). The latter is applicable in complex
biological systems; in addition, this technique has a number of
advantages, such as faster, cleaner and simpler results (13,14).
Numerous researchers have employed label-free shotgun proteomic
techniques (15–17).
Animal models are commonly used to study the
molecular regulation of spermatogenesis. Numerous murine models
have been established and applied to study the genes that are up-
or downregulated in spermatogenesis. Biologically, meiosis and
spermiogenesis are quite similar processes between humans and
rodents. In the current study, label-free quantitative shotgun
proteomics and mass spectrometry were combined to investigate the
protein content of the round spermatids of mice, in order to
provide new insights into the molecular regulation of
spermiogenesis.
Materials and methods
Sample preparation
Round spermatids were isolated according to a
previously described method (18)
with slight modifications. In the first wave of mouse
spermatogenesis, different spermatogenic cells were found at
specific time points (days 6, 9, 14, 21, 35 and 60 postpartum).
Based on the majority of germ cell types, male mice of different
ages are commonly used to isolate differently developed stages of
spermatogenic cell types. In this study, ten 35-day old male Balb/c
mice were used to isolate round spermatids. The mice were
anesthetized with CO2 and sacrificed by cervical
dislocation. The testes were then removed and decapsulated. The
tubulous tissue was cut into small pieces and incubated in 5 ml of
phosphate-buffered saline (PBS) containing 0.5 mg/ml of collagenase
(Sigma-Aldrich, St. Louis, MO, USA) with continuous agitation at
33°C for 15 min. The dispersed seminiferous cords and cells were
allowed to sediment for 5 min and the supernatant was decanted. The
pellet was resuspended in 5 ml of PBS containing 0.5 mg/ml of
trypsin (Sigma-Aldrich) and 1 μg/ml of DNase (Promega, Madison, WI,
USA), and incubated under the same conditions for 15 min. The
tissue was dissociated to disperse seminiferous cells by gently
pipetting with a Pasteur pipette; the cell suspension was then
centrifuged at 80 × g for 10 min. The pellet was washed twice with
PBS, filtered using a filter cloth (200 mesh) and resuspended in 20
ml of PBS solution containing 0.5% bovine serum albumin (BSA).
A total of 108 cells were bottom-loaded
in a cell separator apparatus with a 12.5 cm diameter (TH-300A;
Shanghai Huxi Analysis Instrument Factory Co., Ltd., Shanghai,
China) and then incubated in a 2–4% BSA linear gradient in
RPMI-1640 medium (Gibco, Grand Island, NY, USA). After 3 h of
velocity sedimentation at unit gravity, the cell fractions (10
ml/fraction) were collected from the bottom of the separator
apparatus at a rate of 5 ml/min. The cell types, in terms of
diameter and morphological characteristics, as well as the purity
of each fraction, were assessed under a light microscope (BX43;
Olympus Co., Tokyo, Japan). Only fractions with the expected cell
type were pooled together. The average purity of round spermatids
was 95%.
Protein extraction
Cells were washed twice with PBS and then lysed by
sonication on ice in a buffer containing 7 M urea, 2 M thiourea, 4%
CHAPS, 65 mM DTT and 0.2% Biolyte (Bio-Rad, Richmond, CA, USA).
Following sonication, the lysates were centrifuged (10,000 × g, 1 h
at 4°C), and the supernatants were collected. The protein
concentration of each supernatant was assayed using a standard
Bradford protein assay kit (Bio-Rad). Approximately 100 μg of the
protein sample was reduced using 10 mM DTT at 37°C for 2.5 h, and
alkylated with 50 mM iodoacetamide (both from Sigma-Aldrich) at
room temperature for 40 min. The sample was then diluted in a
solution of 50 mM NH4HCO3 (Sigma-Aldrich).
The protein mixture was digested by incubating in grade-modified
trypsin (Promega) at a 1:50 enzyme:protein ratio, at 37°C for 20 h.
The tryptic peptide mixture was lyophilized and stored at −80°C
until use.
Immunofluorescent detection
Cells were attached to poly-L-lysine coated
microscopy coverslips and were fixed with 2% formaldehyde in
microtubule-stabilizing buffer (50 mmol/l PIPES, 5 mmol/l EGTA and
5 mmol/l MgSO4) for 1 h. Coverslips were rinsed in PBS
and permeabilized for 1 h in 1% Triton X-100 in PBS. Nonspecific
antibody binding was prevented by incubation for 1 h in 10% normal
goat serum. Microtubules were labeled with anti-α-tubulin
monoclonal (Sigma-Aldrich). Primary antibodies were detected using
FITC-conjugated rabbit anti-mouse immunoglobulin (Jackson
ImmunoResearch Inc., West Grove, PA, USA). DNA was detected by
labeling with DAPI. The coverslips were mounted in a drop of
VectaShield mounting medium (Vector Laboratories Inc, Burlingame,
CA, USA). Coverslips were examined using BX43 Epifluorescence
microscope (Olympus Co.).
Automated 2D-nano-LC-ESI-MS/MS peptide
analysis
The extracted peptides were desalted using 1.3 ml
C18 solid-phase extraction column (Sep-Pak® Cartridge;
Waters Corp., Milford, MA, USA). The peptides were dried using a
vacuum centrifuge and were resuspended in loading buffer containing
5 mM ammonium formate (NH4FA) and 5% acetonitrile at pH
3.0, Next, peptides were separated and analyzed by 2D strong
cation-exchange (SCX)/reversed-phase (RP) nano-scale LC/MS. The
experiments were performed on a Nano Aquity UPLC system (Waters
Corp.) connected to an LTQ Orbitrap XL mass spectrometer (Thermo
Electron Corp., Bremen, Germany) equipped with an online
nano-electrospray ion source (Bruker, Auburn, CA, USA).
A 180 μm × 2.4 cm SCX column (Waters Corp), which
was packed with 5 μm of polysulfoethyl aspartamide (PolyLC Inc.,
Columbia, MD, USA) was used for the first dimension. To recover
hydrophobic peptides retained on the SCX column after a
conventional salt step gradient, an RP step gradient from 5 to 50%
acetonitrile (ACN) was applied to the SCX column. A 15-μl plug was
performed at each step of the gradient. The SCX column was cleaned
once using 1 M NH4FA. The plugs were then loaded onto
the SCX column with loading buffer, at a flow rate of 15 μl/min for
6 min. A peptide sample (15 μl) was loaded onto the SCX column
prior to injection of the gradient plugs. The eluted peptides were
then captured using a trap column (Waters Corp.), and salts were
diverted to waste. The trap column (2 cm × 180 μm) was packed with
a 5 μm Symmetry® C18 column (Waters Corp.). The RP
analytical column (15 cm × 100 μm) was packed with a 1.7 μm bridged
ethyl hybrid (BEH) C18 particle (Waters Corp.) and then used for
protein separation at the second dimension.
The peptides on the RP analytical column were eluted
with a three-step linear gradient, balancing with the 95% A buffer
10 min, then starting from 5 to 40% B in 40 min (A, water with 0.1%
formic acid; B, ACN with 0.1% formic acid) and increased up to 80%
B in 3 min. Afterwards, this solution was reduced to 5% B for 2
min. The column was left to re-equilibrate for 15 min. The column
flow rate was maintained at 500 nl/min and the column temperature
was maintained at 35°C. Eluted peptides were ionized at 1.9 kV and
the ions were analyzed by an LTQ Orbitrap XL Mass spectrometer
(Thermo Fisher Scientific Inc., Marietta, OH, USA).
The LTQ Orbitrap XL mass spectrometer was operated
in a data-dependent mode to switch automatically between MS and
MS/MS acquisition. Survey full-scan MS spectra with two microscans
(300–1800 m/z) were acquired in the Obitrap with a mass resolution
of 60,000 at 400 m/z. Ten sequential LTQ-MS/MS scans were then
conducted. Dynamic exclusion was used with two repeat counts, 10
sec repeat duration and 90 sec exclusion duration. For MS/MS,
precursor ions were activated using a 35% normalized collision
energy at the default activation q-value of 0.25.
Peptide sequencing data analysis
The acquired MS/MS spectra were searched against the
IPI mouse.v3.68 fasta-formatted protein database using the SEQUEST
v.28 (revision 12) software (Thermo Electron Corp.). To reduce
identification of false positives, we appended to the database its
decoy version containing the reverse sequences. The search
parameters were the following: partial trypsin (KR) cleavage with
two missed cleavages; the variable modification was oxidation (M);
peptide mass tolerance, 50 ppm; and fragment ion tolerance, 1 Da.
The open-source Trans Proteomic Pipeline software (revision 4.0;
Institute of Systems Biology, Seattle, WA, USA) was then used to
identify proteins based on the corresponding peptide sequences and
a ≥95% confidence threshold. The peptides results were filtered by
Peptide Prophet (19) with a
p-value >0.95 and a Protein Prophet (20) probability of 0.95 was used for the
protein identification results.
Bioinformatic analyses
The predicted cellular localization of the proteins
identified in the round spermatids was retrieved based on the
information available at the Gene Ontology (GO)project website
(http://www.geneontology.org/).
Functional classification of the proteins was based on biological
process and molecular function GO terms. Assignment of the proteins
to signaling pathways was based on information available at the
Kyoto Encyclopedia of Genes and Genomes (KEGG) (http://www.genome.jp/kegg/pathway.html)
and the BioCarta (http://www.biocarta.com/genes/index.asp) databases.
Enrichment analysis for these categorizations was performed with
tools available at DAVID Bioinformatics Resources (http://david.abcc.ncifcrf.gov/); DAVID is a
web-based application that enables visualization, discovery and
analysis of molecular interactions and associations with disease
for a given list of genes or proteins.
Results
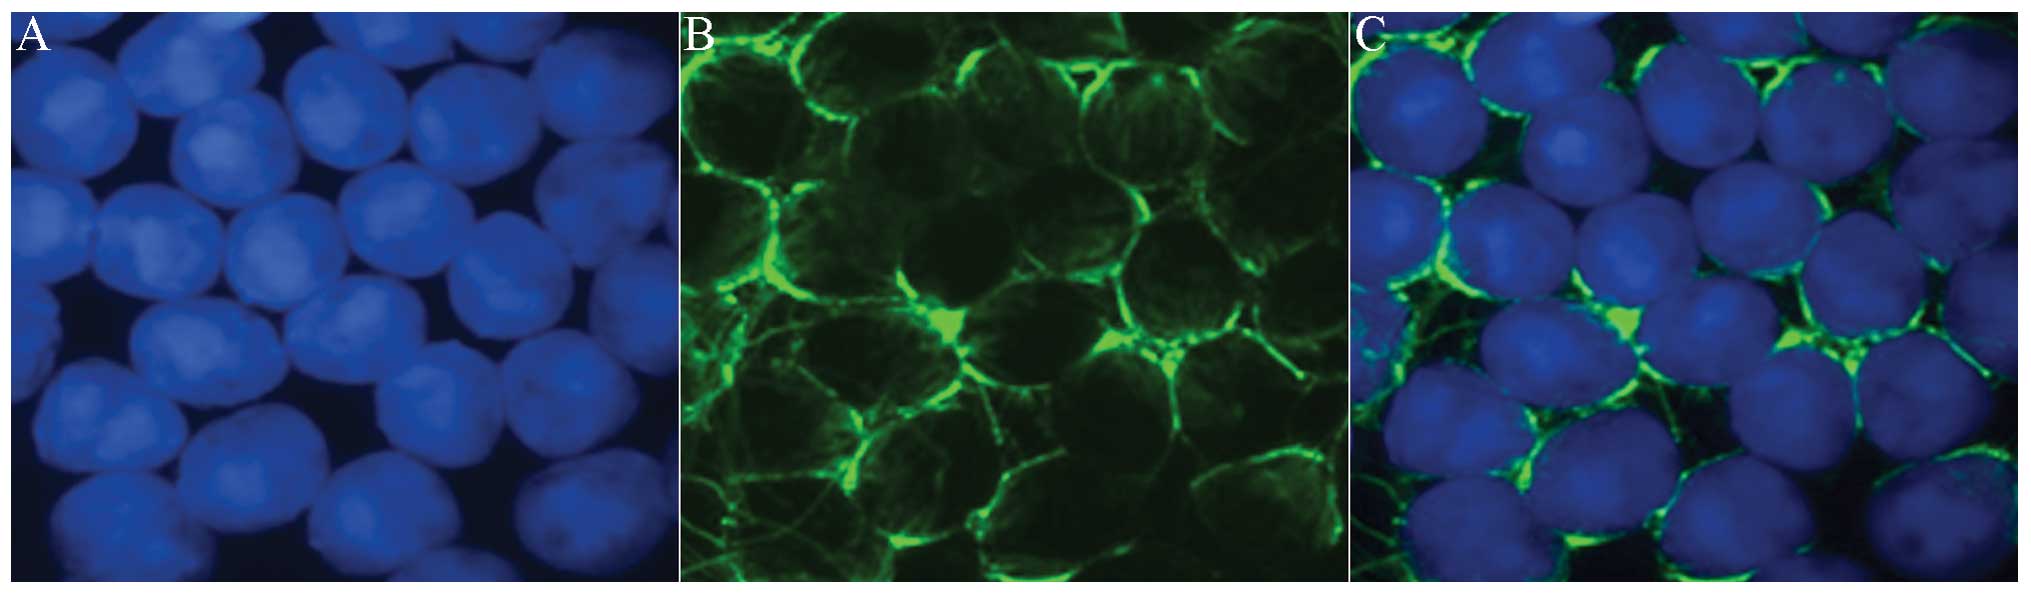
Identification of proteins in round
spermatids by shotgun proteomics
Following isolation of murine testicular cells by a
gradient method, the purity of the sorted round spermatids was
assessed by immunofluorescent staining using the anti-α-tubulin
antibody. α-tubulin is the main component of manchette, which is a
spermatid-specific microtubular structure. The purity of the sorted
round spermatids was >95%, as assessed by counting 500 sorted
cells under the microscope (Fig.
1).
We employed a label-free shotgun proteomic technique
to identify proteins, gain insights into the protein expression
profile of round spermatids, and investigate the relevant molecular
mechanisms. The reproducibility of the method was evaluated, with a
reliability coefficient of 95% estimated from independent
experiments. We found that the peptide spectral intensity is higher
than the spectral counts in the quantification of proteomic
analysis. The average peptide spectral intensity was used as a
standard for the relative quantification of proteins. A total of
2,331 proteins were identified by using the sequenced peptides as
queries in searches against the IPI mouse database. Repeating the
search against the related decoy database with the same parameters
yielded a low (1%) false discovery rate (FDR) at the peptide level,
indicating that our approach has high specificity.
Enriched pathways and functional
categories
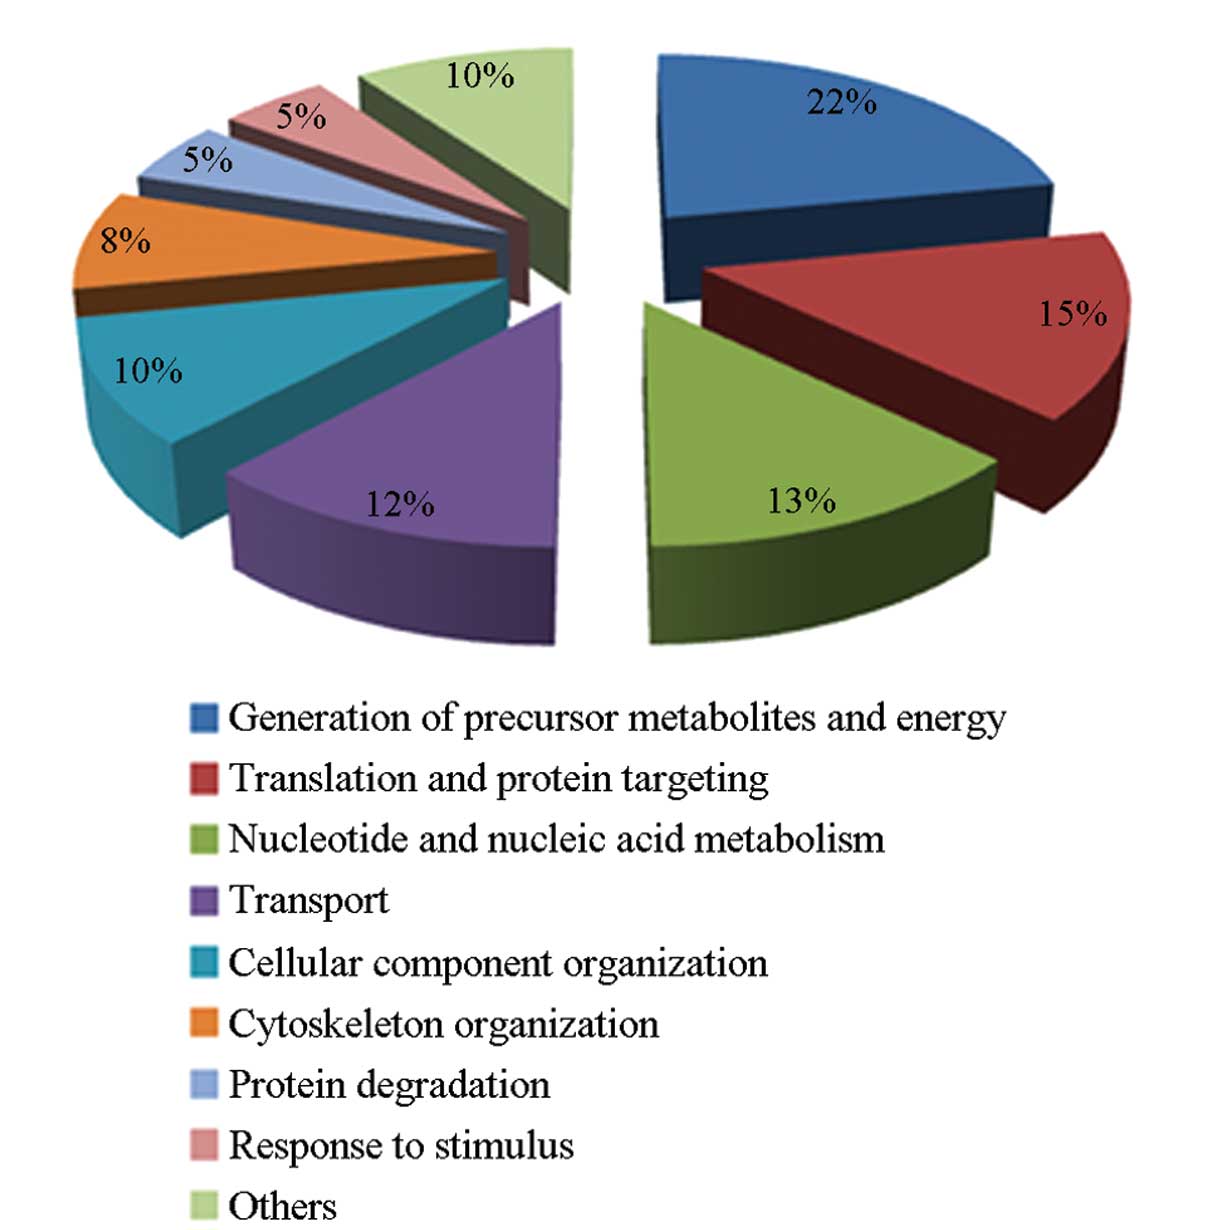
Among the 2,331 identified proteins, 2,287 were
found to correspond to unique genes. To characterize these
proteins, we initially categorized them based on biological process
terms of GO and conducted an enrichment analysis. The most
significant categories are shown in Table I. These processes include the
generation of precursor metabolites and energy (504), translation
and protein targeting (343), nucleotide and nucleic acid metabolism
(298), transport (275) and cellular component organization (289).
Some of the identified proteins were associated with cytoskeleton
organization (183), protein degradation (116) or response to
stimulus (115). Approximately 164 proteins with unknown functions
were also identified in the proteome of round spermatids. The full
classification of the unknown-function proteins with regards to the
biological processes they are associated with is demonstrated in a
pie chart in Fig. 2.
 | Table IEnriched biological processes in the
proteome of round spermatids based on Gene Ontology (GO) terms. |
Table I
Enriched biological processes in the
proteome of round spermatids based on Gene Ontology (GO) terms.
| GO id. | Description | Count | % | Q<0.01 |
|---|
| GO:0055114 | Oxidation
reduction | 234 | 10.3356890460 | 4.40E-58 |
| GO:0008104 | Protein
localization | 198 | 8.7455830389 | 1.24E-50 |
| GO:0045184 | Establishment of
protein localization | 180 | 7.9505300353 | 4.11E-33 |
| GO:0015031 | Protein
transport | 179 | 7.9063604240 | 9.98E-31 |
| GO:0006091 | Generation of
precursor metabolites and energy | 142 | 6.2720848057 | 2.54E-24 |
| GO:0046907 | Intracellular
transport | 135 | 5.9628975265 | 2.68E-24 |
| GO:0006412 | Translation | 126 | 5.5653710247 | 2.77E-24 |
| GO:0042592 | Homeostatic
process | 114 | 5.0353356890 | 5.88E-24 |
| GO:0016192 | Vesicle-mediated
transport | 105 | 4.6378091873 | 1.32E-23 |
| GO:0007155 | Cell adhesion | 100 | 4.4169611307 | 1.30E-21 |
| GO:0022610 | Biological
adhesion | 100 | 4.4169611307 | 2.13E-21 |
| GO:0034613 | Cellular protein
localization | 97 | 4.2844522968 | 7.58E-20 |
| GO:0070727 | Cellular
macromolecule localization | 97 | 4.2844522968 | 5.06E-19 |
| GO:0006886 | Intracellular
protein transport | 93 | 4.1077738516 | 1.53E-18 |
| GO:0006396 | RNA processing | 90 | 3.9752650177 | 2.20E-18 |
| GO:0044271 | Nitrogen compound
biosynthetic process | 88 | 3.8869257951 | 2.54E-18 |
| GO:0016071 | mRNA metabolic
process | 84 | 3.7102473498 | 5.99E-18 |
| GO:0055085 | Transmembrane
transport | 83 | 3.6660777385 | 1.56E-17 |
| GO:0019725 | Cellular
homeostasis | 81 | 3.5777385159 | 5.15E-17 |
| GO:0043933 | Macromolecular
complex subunit organization | 78 | 3.4452296820 | 5.78E-17 |
| GO:0006397 | mRNA
processing | 77 | 3.4010600707 | 7.10E-16 |
| GO:0065003 | Macromolecular
complex assembly | 76 | 3.3568904594 | 1.18E-15 |
| GO:0051186 | Cofactor metabolic
process | 73 | 3.2243816254 | 1.27E-15 |
| GO:0007010 | Cytoskeleton
organization | 71 | 3.1360424028 | 5.24E-15 |
| GO:0022900 | Electron transport
chain | 67 | 2.9593639576 | 8.39E-15 |
| GO:0008380 | RNA splicing | 67 | 2.9593639576 | 1.13E-14 |
| GO:0005996 | Monosaccharide
metabolic process | 64 | 2.8268551237 | 1.89E-14 |
| GO:0006732 | Coenzyme metabolic
process | 60 | 2.6501766784 | 1.89E-14 |
| GO:0019318 | Hexose metabolic
process | 60 | 2.6501766784 | 1.97E-14 |
| GO:0006163 | Purine nucleotide
metabolic process | 59 | 2.6060070671 | 1.97E-14 |
| GO:0034654 | Nucleobase,
nucleoside, nucleotide and nucleic acid biosynthetic process | 59 | 2.6060070671 | 2.69E-14 |
| GO:0034404 | Nucleobase,
nucleoside and nucleotide biosynthetic process | 59 | 2.6060070671 | 3.59E-14 |
| GO:0034621 | Cellular
macromolecular complex subunit organization | 59 | 2.6060070671 | 5.07E-14 |
| GO:0009165 | Nucleotide
biosynthetic process | 58 | 2.5618374558 | 5.92E-14 |
| GO:0016044 | Membrane
organization | 58 | 2.5618374558 | 9.05E-14 |
| GO:0048878 | Chemical
homeostasis | 58 | 2.5618374558 | 1.13E-13 |
| GO:0006631 | Fatty acid
metabolic process | 57 | 2.5176678445 | 1.46E-13 |
| GO:0034622 | Cellular
macromolecular complex assembly | 57 | 2.5176678445 | 1.48E-13 |
| GO:0009259 | Ribonucleotide
metabolic process | 56 | 2.4734982332 | 1.53E-13 |
| GO:0009611 | Response to
wounding | 56 | 2.4734982332 | 1.89E-13 |
| GO:0009150 | Purine
ribonucleotide metabolic process | 55 | 2.4293286219 | 4.22E-13 |
| GO:0032989 | Cellular component
morphogenesis | 55 | 2.4293286219 | 4.40E-13 |
| GO:0006006 | Glucose metabolic
process | 54 | 2.3851590106 | 5.52E-13 |
| GO:0030030 | Cell projection
organization | 54 | 2.3851590106 | 6.21E-13 |
| GO:0015980 | Energy derivation
by oxidation of organic compounds | 53 | 2.3409893993 | 7.03E-13 |
| GO:0006164 | Purine nucleotide
biosynthetic process | 53 | 2.3409893993 | 1.41E-12 |
| GO:0007264 | Small GTPase
mediated signal transduction | 53 | 2.3409893993 | 1.62E-12 |
| GO:0030029 | Actin
filament-based process | 52 | 2.2968197880 | 1.65E-12 |
| GO:0009260 | Ribonucleotide
biosynthetic process | 51 | 2.2526501767 | 2.84E-12 |
| GO:0006457 | Protein
folding | 51 | 2.2526501767 | 4.68E-12 |
| GO:0008610 | Lipid biosynthetic
process | 51 | 2.2526501767 | 5.69E-12 |
| GO:0050801 | Ion
homeostasis | 51 | 2.2526501767 | 5.93E-12 |
| GO:0009152 | Purine
ribonucleotide biosynthetic process | 50 | 2.2084805654 | 6.56E-12 |
| GO:0030036 | Actin cytoskeleton
organization | 50 | 2.2084805654 | 7.59E-12 |
| GO:0009141 | Nucleoside
triphosphate metabolic process | 49 | 2.1643109541 | 8.27E-12 |
| GO:0009144 | Purine nucleoside
triphosphate metabolic process | 48 | 2.1201413428 | 8.27E-12 |
| GO:0009205 | Purine
ribonucleoside triphosphate metabolic process | 47 | 2.0759717314 | 9.26E-12 |
| GO:0009199 | Ribonucleoside
triphosphate metabolic process | 47 | 2.0759717314 | 1.50E-11 |
| GO:0006461 | Protein complex
assembly | 47 | 2.0759717314 | 1.50E-11 |
| GO:0070271 | Protein complex
biogenesis | 47 | 2.0759717314 | 1.50E-11 |
| GO:0006873 | Cellular ion
homeostasis | 47 | 2.0759717314 | 2.68E-11 |
| GO:0055082 | Cellular chemical
homeostasis | 47 | 2.0759717314 | 4.71E-11 |
| GO:0032268 | Regulation of
cellular protein metabolic process | 46 | 2.0318021201 | 2.46E-10 |
| GO:0008283 | Cell
proliferation | 45 | 1.9876325088 | 2.89E-10 |
| GO:0009145 | Purine nucleoside
triphosphate biosynthetic process | 44 | 1.9434628975 | 4.24E-10 |
| GO:0009142 | Nucleoside
triphosphate biosynthetic process | 44 | 1.9434628975 | 9.73E-10 |
| GO:0009206 | Purine
ribonucleoside triphosphate biosynthetic process | 43 | 1.8992932862 | 1.48E-09 |
| GO:0009201 | Ribonucleoside
triphosphate biosynthetic process | 43 | 1.8992932862 | 1.48E-09 |
| GO:0045333 | Cellular
respiration | 42 | 1.8551236749 | 1.53E-09 |
| GO:0046034 | ATP metabolic
process | 42 | 1.8551236749 | 2.38E-09 |
| GO:0033043 | Regulation of
organelle organization | 42 | 1.8551236749 | 2.96E-09 |
| GO:0006605 | Protein
targeting | 41 | 1.8109540636 | 5.08E-09 |
| GO:0032535 | Regulation of
cellular component size | 41 | 1.8109540636 | 8.13E-09 |
| GO:0006119 | Oxidative
phosphorylation | 39 | 1.7226148410 | 9.12E-09 |
| GO:0043062 | Extracellular
structure organization | 39 | 1.7226148410 | 1.14E-08 |
| GO:0016052 | Carbohydrate
catabolic process | 38 | 1.6784452297 | 1.16E-08 |
| GO:0006754 | ATP biosynthetic
process | 38 | 1.6784452297 | 1.21E-08 |
| GO:0006575 | Cellular amino acid
derivative metabolic process | 38 | 1.6784452297 | 1.63E-08 |
| GO:0019226 | Transmission of
nerve impulse | 38 | 1.6784452297 | 3.36E-08 |
| GO:0007017 | Microtubule-based
process | 37 | 1.6342756184 | 3.37E-08 |
| GO:0009719 | Response to
endogenous stimulus | 36 | 1.5901060071 | 4.09E-08 |
| GO:0051493 | Regulation of
cytoskeleton organization | 35 | 1.5459363958 | 6.21E-08 |
| GO:0046164 | Alcohol catabolic
process | 34 | 1.5017667845 | 8.50E-08 |
| GO:0016053 | Organic acid
biosynthetic process | 34 | 1.5017667845 | 1.21E-07 |
| GO:0046394 | Carboxylic acid
biosynthetic process | 34 | 1.5017667845 | 1.21E-07 |
| GO:0010324 | Membrane
invagination | 34 | 1.5017667845 | 1.42E-07 |
| GO:0006897 | Endocytosis | 34 | 1.5017667845 | 1.81E-07 |
| GO:0009725 | Response to hormone
stimulus | 33 | 1.4575971731 | 1.85E-07 |
| GO:0007517 | Muscle organ
development | 33 | 1.4575971731 | 3.23E-07 |
| GO:0055080 | Cation
homeostasis | 33 | 1.4575971731 | 4.24E-07 |
| GO:0044275 | Cellular
carbohydrate catabolic process | 32 | 1.4134275618 | 7.66E-07 |
| GO:0008202 | Steroid metabolic
process | 32 | 1.4134275618 | 1.18E-06 |
| GO:0007268 | Synaptic
transmission | 32 | 1.4134275618 | 1.27E-06 |
| GO:0046395 | Carboxylic acid
catabolic process | 30 | 1.3250883392 | 1.31E-06 |
| GO:0016054 | Organic acid
catabolic process | 30 | 1.3250883392 | 1.31E-06 |
| GO:0044087 | Regulation of
cellular component biogenesis | 30 | 1.3250883392 | 1.49E-06 |
| GO:0006979 | Response to
oxidative stress | 29 | 1.2809187279 | 1.49E-06 |
| GO:0033365 | Protein
localization in organelle | 29 | 1.2809187279 | 1.50E-06 |
| GO:0030198 | Extracellular
matrix organization | 29 | 1.2809187279 | 1.50E-06 |
| GO:0043623 | Cellular protein
complex assembly | 29 | 1.2809187279 | 1.50E-06 |
| GO:0055066 | Di-, trivalent
inorganic cation homeostasis | 29 | 1.2809187279 | 1.65E-06 |
| GO:0015992 | Proton
transport | 28 | 1.2367491166 | 2.14E-06 |
| GO:0019320 | Hexose catabolic
process | 28 | 1.2367491166 | 2.24E-06 |
| GO:0006007 | Glucose catabolic
process | 28 | 1.2367491166 | 2.36E-06 |
| GO:0006818 | Hydrogen
transport | 28 | 1.2367491166 | 2.42E-06 |
| GO:0046365 | Monosaccharide
catabolic process | 28 | 1.2367491166 | 3.04E-06 |
| GO:0032956 | Regulation of actin
cytoskeleton organization | 28 | 1.2367491166 | 3.40E-06 |
| GO:0032970 | Regulation of actin
filament-based process | 28 | 1.2367491166 | 3.88E-06 |
| GO:0045454 | Cell redox
homeostasis | 28 | 1.2367491166 | 4.20E-06 |
| GO:0006913 | Nucleocytoplasmic
transport | 28 | 1.2367491166 | 4.55E-06 |
| GO:0051169 | Nuclear
transport | 28 | 1.2367491166 | 6.02E-06 |
| GO:0051130 | Positive regulation
of cellular component organization | 28 | 1.2367491166 | 6.58E-06 |
| GO:0016042 | Lipid catabolic
process | 28 | 1.2367491166 | 7.04E-06 |
| GO:0010608 |
Post-transcriptional regulation of gene
expression | 28 | 1.2367491166 | 8.39E-06 |
| GO:0030003 | Cellular cation
homeostasis | 28 | 1.2367491166 | 9.47E-06 |
| GO:0015674 | Di-, trivalent
inorganic cation transport | 28 | 1.2367491166 | 1.03E-05 |
| GO:0010035 | Response to
inorganic substance | 27 | 1.1925795053 | 1.42E-05 |
| GO:0006790 | Sulfur metabolic
process | 27 | 1.1925795053 | 1.43E-05 |
| GO:0006333 | Chromatin assembly
or disassembly | 27 | 1.1925795053 | 2.23E-05 |
| GO:0015986 | ATP synthesis
coupled proton transport | 26 | 1.1484098940 | 2.39E-05 |
| GO:0015985 | Energy coupled
proton transport, down electrochemical gradient | 26 | 1.1484098940 | 2.64E-05 |
| GO:0034220 | Ion transmembrane
transport | 26 | 1.1484098940 | 2.89E-05 |
| GO:0008064 | Regulation of actin
polymerization or depolymerization | 26 | 1.1484098940 | 4.22E-05 |
| GO:0030832 | Regulation of actin
filament length | 26 | 1.1484098940 | 4.27E-05 |
| GO:0043254 | Regulation of
protein complex assembly | 26 | 1.1484098940 | 5.34E-05 |
| GO:0051129 | Negative regulation
of cellular component organization | 26 | 1.1484098940 | 5.34E-05 |
| GO:0042692 | Muscle cell
differentiation | 26 | 1.1484098940 | 5.49E-05 |
| GO:0060537 | Muscle tissue
development | 26 | 1.1484098940 | 6.85E-05 |
| GO:0006511 | Ubiquitin-dependent
protein catabolic process | 26 | 1.1484098940 | 7.99E-05 |
| GO:0006518 | Peptide metabolic
process | 25 | 1.1042402827 | 8.11E-05 |
| GO:0032271 | Regulation of
protein polymerization | 25 | 1.1042402827 | 8.43E-05 |
| GO:0014706 | Striated muscle
tissue development | 25 | 1.1042402827 | 1.02E-04 |
| GO:0051050 | Positive regulation
of transport | 25 | 1.1042402827 | 1.25E-04 |
| GO:0030005 | Cellular di-,
tri-valent inorganic cation homeostasis | 25 | 1.1042402827 | 1.79E-04 |
| GO:0006323 | DNA packaging | 24 | 1.0600706714 | 1.90E-04 |
| GO:0042060 | Wound healing | 24 | 1.0600706714 | 1.91E-04 |
| GO:0006084 | Acetyl-CoA
metabolic process | 23 | 1.0159010601 | 2.00E-04 |
| GO:0006096 | Glycolysis | 23 | 1.0159010601 | 2.24E-04 |
| GO:0030833 | Regulation of actin
filament polymerization | 23 | 1.0159010601 | 2.66E-04 |
| GO:0006399 | tRNA metabolic
process | 23 | 1.0159010601 | 2.72E-04 |
| GO:0051187 | Cofactor catabolic
process | 22 | 0.9717314487 | 2.96E-04 |
| GO:0043244 | Regulation of
protein complex disassembly | 22 | 0.9717314487 | 3.73E-04 |
| GO:0031589 | Cell-substrate
adhesion | 22 | 0.9717314487 | 4.24E-04 |
| GO:0051146 | Striated muscle
cell differentiation | 22 | 0.9717314487 | 4.24E-04 |
| GO:0051188 | Cofactor
biosynthetic process | 22 | 0.9717314487 | 4.87E-04 |
| GO:0007018 | Microtubule-based
movement | 22 | 0.9717314487 | 4.87E-04 |
| GO:0022904 | Respiratory
electron transport chain | 21 | 0.9275618374 | 4.87E-04 |
| GO:0009109 | Coenzyme catabolic
process | 21 | 0.9275618374 | 5.98E-04 |
| GO:0015931 | Nucleobase,
nucleoside, nucleotide and nucleic acid transport | 21 | 0.9275618374 | 6.05E-04 |
| GO:0031497 | Chromatin
assembly | 21 | 0.9275618374 | 6.14E-04 |
| GO:0065004 | Protein-DNA complex
assembly | 21 | 0.9275618374 | 6.22E-04 |
| GO:0017038 | Protein import | 21 | 0.9275618374 | 6.40E-04 |
| GO:0050878 | Regulation of body
fluid levels | 21 | 0.9275618374 | 6.65E-04 |
| GO:0005976 | Polysaccharide
metabolic process | 21 | 0.9275618374 | 6.65E-04 |
| GO:0009060 | Aerobic
respiration | 20 | 0.8833922261 | 6.65E-04 |
| GO:0006418 | tRNA aminoacylation
for protein translation | 20 | 0.8833922261 | 8.53E-04 |
| GO:0043039 | tRNA
aminoacylation | 20 | 0.8833922261 | 8.84E-04 |
| GO:0043038 | Amino acid
activation | 20 | 0.8833922261 | 9.32E-04 |
| GO:0007160 | Cell-matrix
adhesion | 20 | 0.8833922261 | 9.32E-04 |
| GO:0007015 | Actin filament
organization | 20 | 0.8833922261 | 1.02E-03 |
| GO:0010639 | Negative regulation
of organelle organization | 20 | 0.8833922261 | 1.13E-03 |
| GO:0050657 | Nucleic acid
transport | 20 | 0.8833922261 | 1.13E-03 |
| GO:0051236 | Establishment of
RNA localization | 20 | 0.8833922261 | 1.22E-03 |
| GO:0050658 | RNA transport | 20 | 0.8833922261 | 1.23E-03 |
| GO:0006403 | RNA
localization | 20 | 0.8833922261 | 1.32E-03 |
| GO:0006334 | Nucleosome
assembly | 20 | 0.8833922261 | 1.42E-03 |
| GO:0034728 | Nucleosome
organization | 20 | 0.8833922261 | 1.45E-03 |
| GO:0006099 | Tricarboxylic acid
cycle | 19 | 0.8392226148 | 1.46E-03 |
| GO:0046356 | Acetyl-CoA
catabolic process | 19 | 0.8392226148 | 1.47E-03 |
| GO:0009064 | Glutamine family
amino acid metabolic process | 19 | 0.8392226148 | 1.47E-03 |
| GO:0051494 | Negative regulation
of cytoskeleton organization | 19 | 0.8392226148 | 1.71E-03 |
| GO:0019748 | Secondary metabolic
process | 19 | 0.8392226148 | 1.84E-03 |
| GO:0030031 | Cell projection
assembly | 19 | 0.8392226148 | 2.06E-03 |
| GO:0007599 | Hemostasis | 19 | 0.8392226148 | 2.06E-03 |
| GO:0016125 | Sterol metabolic
process | 19 | 0.8392226148 | 2.06E-03 |
| GO:0006417 | Regulation of
translation | 19 | 0.8392226148 | 2.06E-03 |
| GO:0043242 | Negative regulation
of protein complex disassembly | 18 | 0.7950530035 | 2.06E-03 |
| GO:0006800 | Oxygen and reactive
oxygen species metabolic process | 18 | 0.7950530035 | 2.16E-03 |
| GO:0048193 | Golgi vesicle
transport | 18 | 0.7950530035 | 2.26E-03 |
| GO:0051028 | mRNA transport | 18 | 0.7950530035 | 2.33E-03 |
| GO:0008203 | Cholesterol
metabolic process | 18 | 0.7950530035 | 2.34E-03 |
| GO:0007596 | Blood
coagulation | 18 | 0.7950530035 | 2.44E-03 |
| GO:0050817 | Coagulation | 18 | 0.7950530035 | 2.73E-03 |
| GO:0002526 | Acute inflammatory
response | 18 | 0.7950530035 | 2.78E-03 |
| GO:0042493 | Response to
drug | 18 | 0.7950530035 | 2.84E-03 |
| GO:0006749 | Glutathione
metabolic process | 17 | 0.7508833922 | 2.86E-03 |
| GO:0030834 | Regulation of actin
filament depolymerization | 17 | 0.7508833922 | 2.86E-03 |
| GO:0044242 | Cellular lipid
catabolic process | 17 | 0.7508833922 | 3.04E-03 |
| GO:0051170 | Nuclear import | 17 | 0.7508833922 | 3.19E-03 |
| GO:0055001 | Muscle cell
development | 17 | 0.7508833922 | 3.26E-03 |
| GO:0009310 | Amine catabolic
process | 17 | 0.7508833922 | 3.28E-03 |
| GO:0009309 | Amine biosynthetic
process | 17 | 0.7508833922 | 3.34E-03 |
| GO:0051248 | Negative regulation
of protein metabolic process | 17 | 0.7508833922 | 3.34E-03 |
| GO:0006633 | Fatty acid
biosynthetic process | 17 | 0.7508833922 | 3.34E-03 |
| GO:0060627 | Regulation of
vesicle-mediated transport | 17 | 0.7508833922 | 3.77E-03 |
| GO:0009791 | Post-embryonic
development | 17 | 0.7508833922 | 3.99E-03 |
| GO:0018130 | Heterocycle
biosynthetic process | 16 | 0.7067137809 | 4.28E-03 |
| GO:0055002 | Striated muscle
cell development | 16 | 0.7067137809 | 4.35E-03 |
| GO:0034504 | Protein
localization in nucleus | 16 | 0.7067137809 | 4.53E-03 |
| GO:0032269 | Negative regulation
of cellular protein metabolic process | 16 | 0.7067137809 | 5.12E-03 |
| GO:0002449 | Lymphocyte mediated
immunity | 16 | 0.7067137809 | 5.13E-03 |
| GO:0030835 | Negative regulation
of actin filament depolymerization | 15 | 0.6625441696 | 5.13E-03 |
| GO:0032272 | Negative regulation
of protein polymerization | 15 | 0.6625441696 | 5.25E-03 |
| GO:0031333 | Negative regulation
of protein complex assembly | 15 | 0.6625441696 | 5.46E-03 |
| GO:0000302 | Response to
reactive oxygen species | 15 | 0.6625441696 | 5.56E-03 |
| GO:0051258 | Protein
polymerization | 15 | 0.6625441696 | 5.56E-03 |
| GO:0009063 | Cellular amino acid
catabolic process | 15 | 0.6625441696 | 5.56E-03 |
| GO:0006606 | Protein import into
nucleus | 15 | 0.6625441696 | 6.69E-03 |
| GO:0070482 | Response to oxygen
levels | 15 | 0.6625441696 | 6.69E-03 |
| GO:0006694 | Steroid
biosynthetic process | 15 | 0.6625441696 | 6.69E-03 |
| GO:0042773 | ATP synthesis
coupled electron transport | 14 | 0.6183745583 | 6.74E-03 |
| GO:0051693 | Actin filament
capping | 14 | 0.6183745583 | 7.11E-03 |
| GO:0042743 | Hydrogen peroxide
metabolic process | 14 | 0.6183745583 | 7.27E-039 |
| GO:0034599 | Cellular response
to oxidative stress | 14 | 0.6183745583 | 7.31E-03 |
| GO:0042542 | Response to
hydrogen peroxide | 14 | 0.6183745583 | 8.12E-03 |
| GO:0030837 | Negative regulation
of actin filament polymerization | 14 | 0.6183745583 | 8.13E-03 |
| GO:0034330 | Cell junction
organization | 14 | 0.6183745583 | 8.55E-03 |
| GO:0006413 | Translational
initiation | 14 | 0.6183745583 | 8.62E-03 |
| GO:0008652 | Cellular amino acid
biosynthetic process | 14 | 0.6183745583 | 8.74E-03 |
| GO:0006997 | Nucleus
organization | 14 | 0.6183745583 | 9.32E-03 |
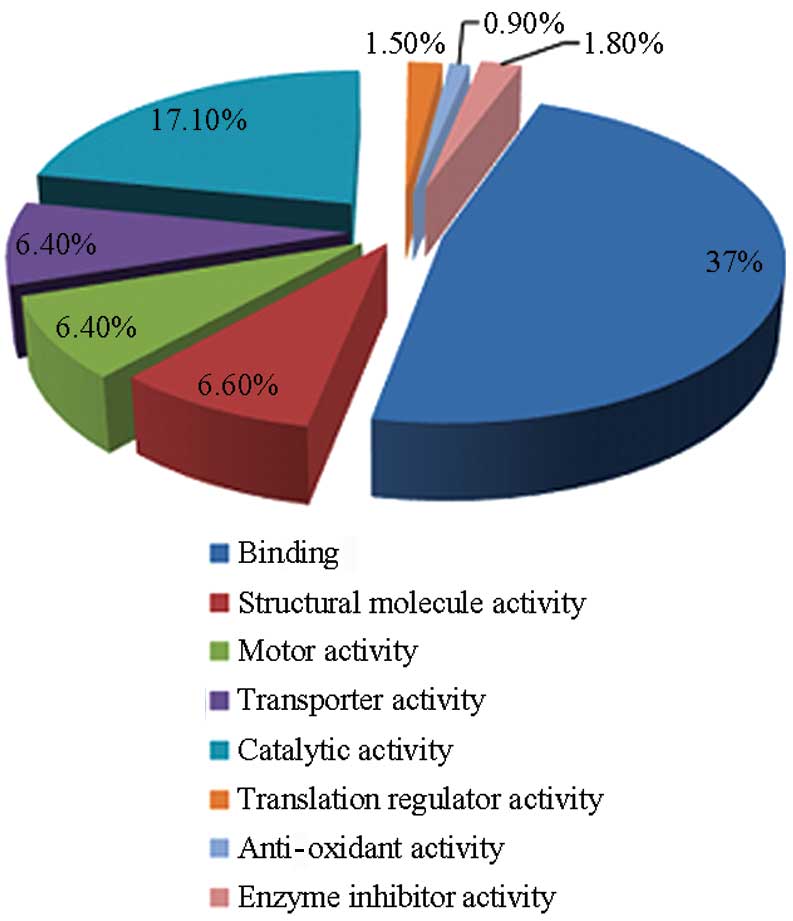
Furthermore, the predicted molecular function and
subcellular localization of the identified proteins was retrieved
from GO and enrichment analysis was performed with DAVID tools. A
total of 1,818 identified proteins were classified into 9 groups
according to their molecular function: binding (866); catalytic
activity (400); structural molecule activity (155); motor activity
(150); translation regulator activity (35); anti-oxidant activity (19); and enzyme inhibitor activity (43).
The full classification of 1,818 proteins is shown in a pie chart
in Fig. 3.
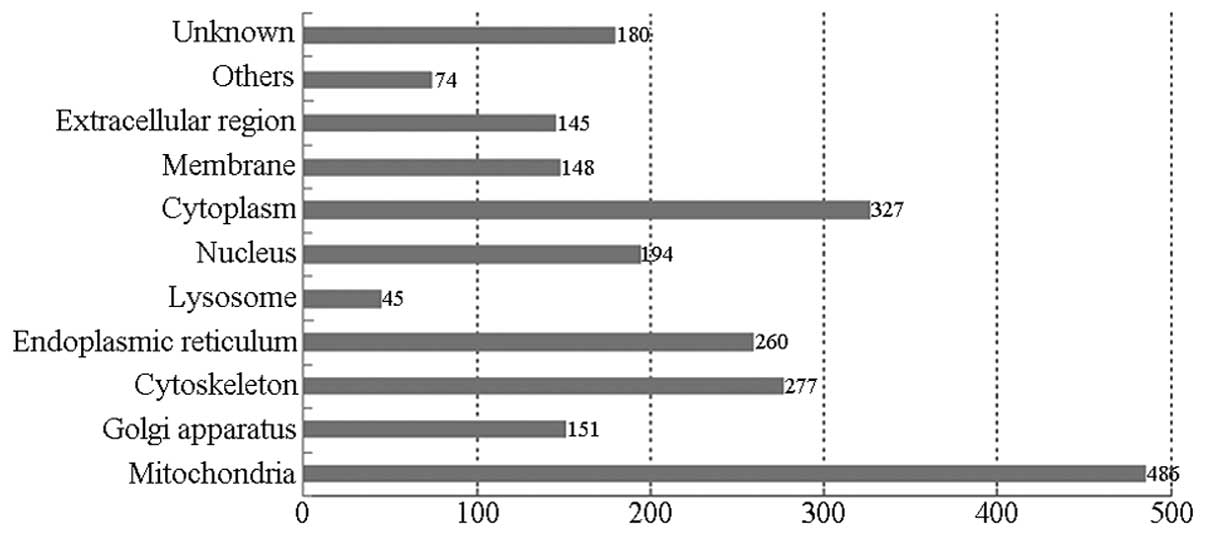
Fig. 4 shows the
classification of the proteins identified in this study according
to their predicted subcellular localization. If an individual
protein was predicted to localize in more than one cellular
compartment, all localizations were counted non-exclusively. The
largest proportion of the identified proteins was associated with
the mitochondrion (486), followed by the following cell
parts/organelles: cytoplasm (327); cytoskeleton (227); endoplasmic
reticulum (260); nucleus (194); Golgi apparatus (151); membrane
(148); and lysosome (45).
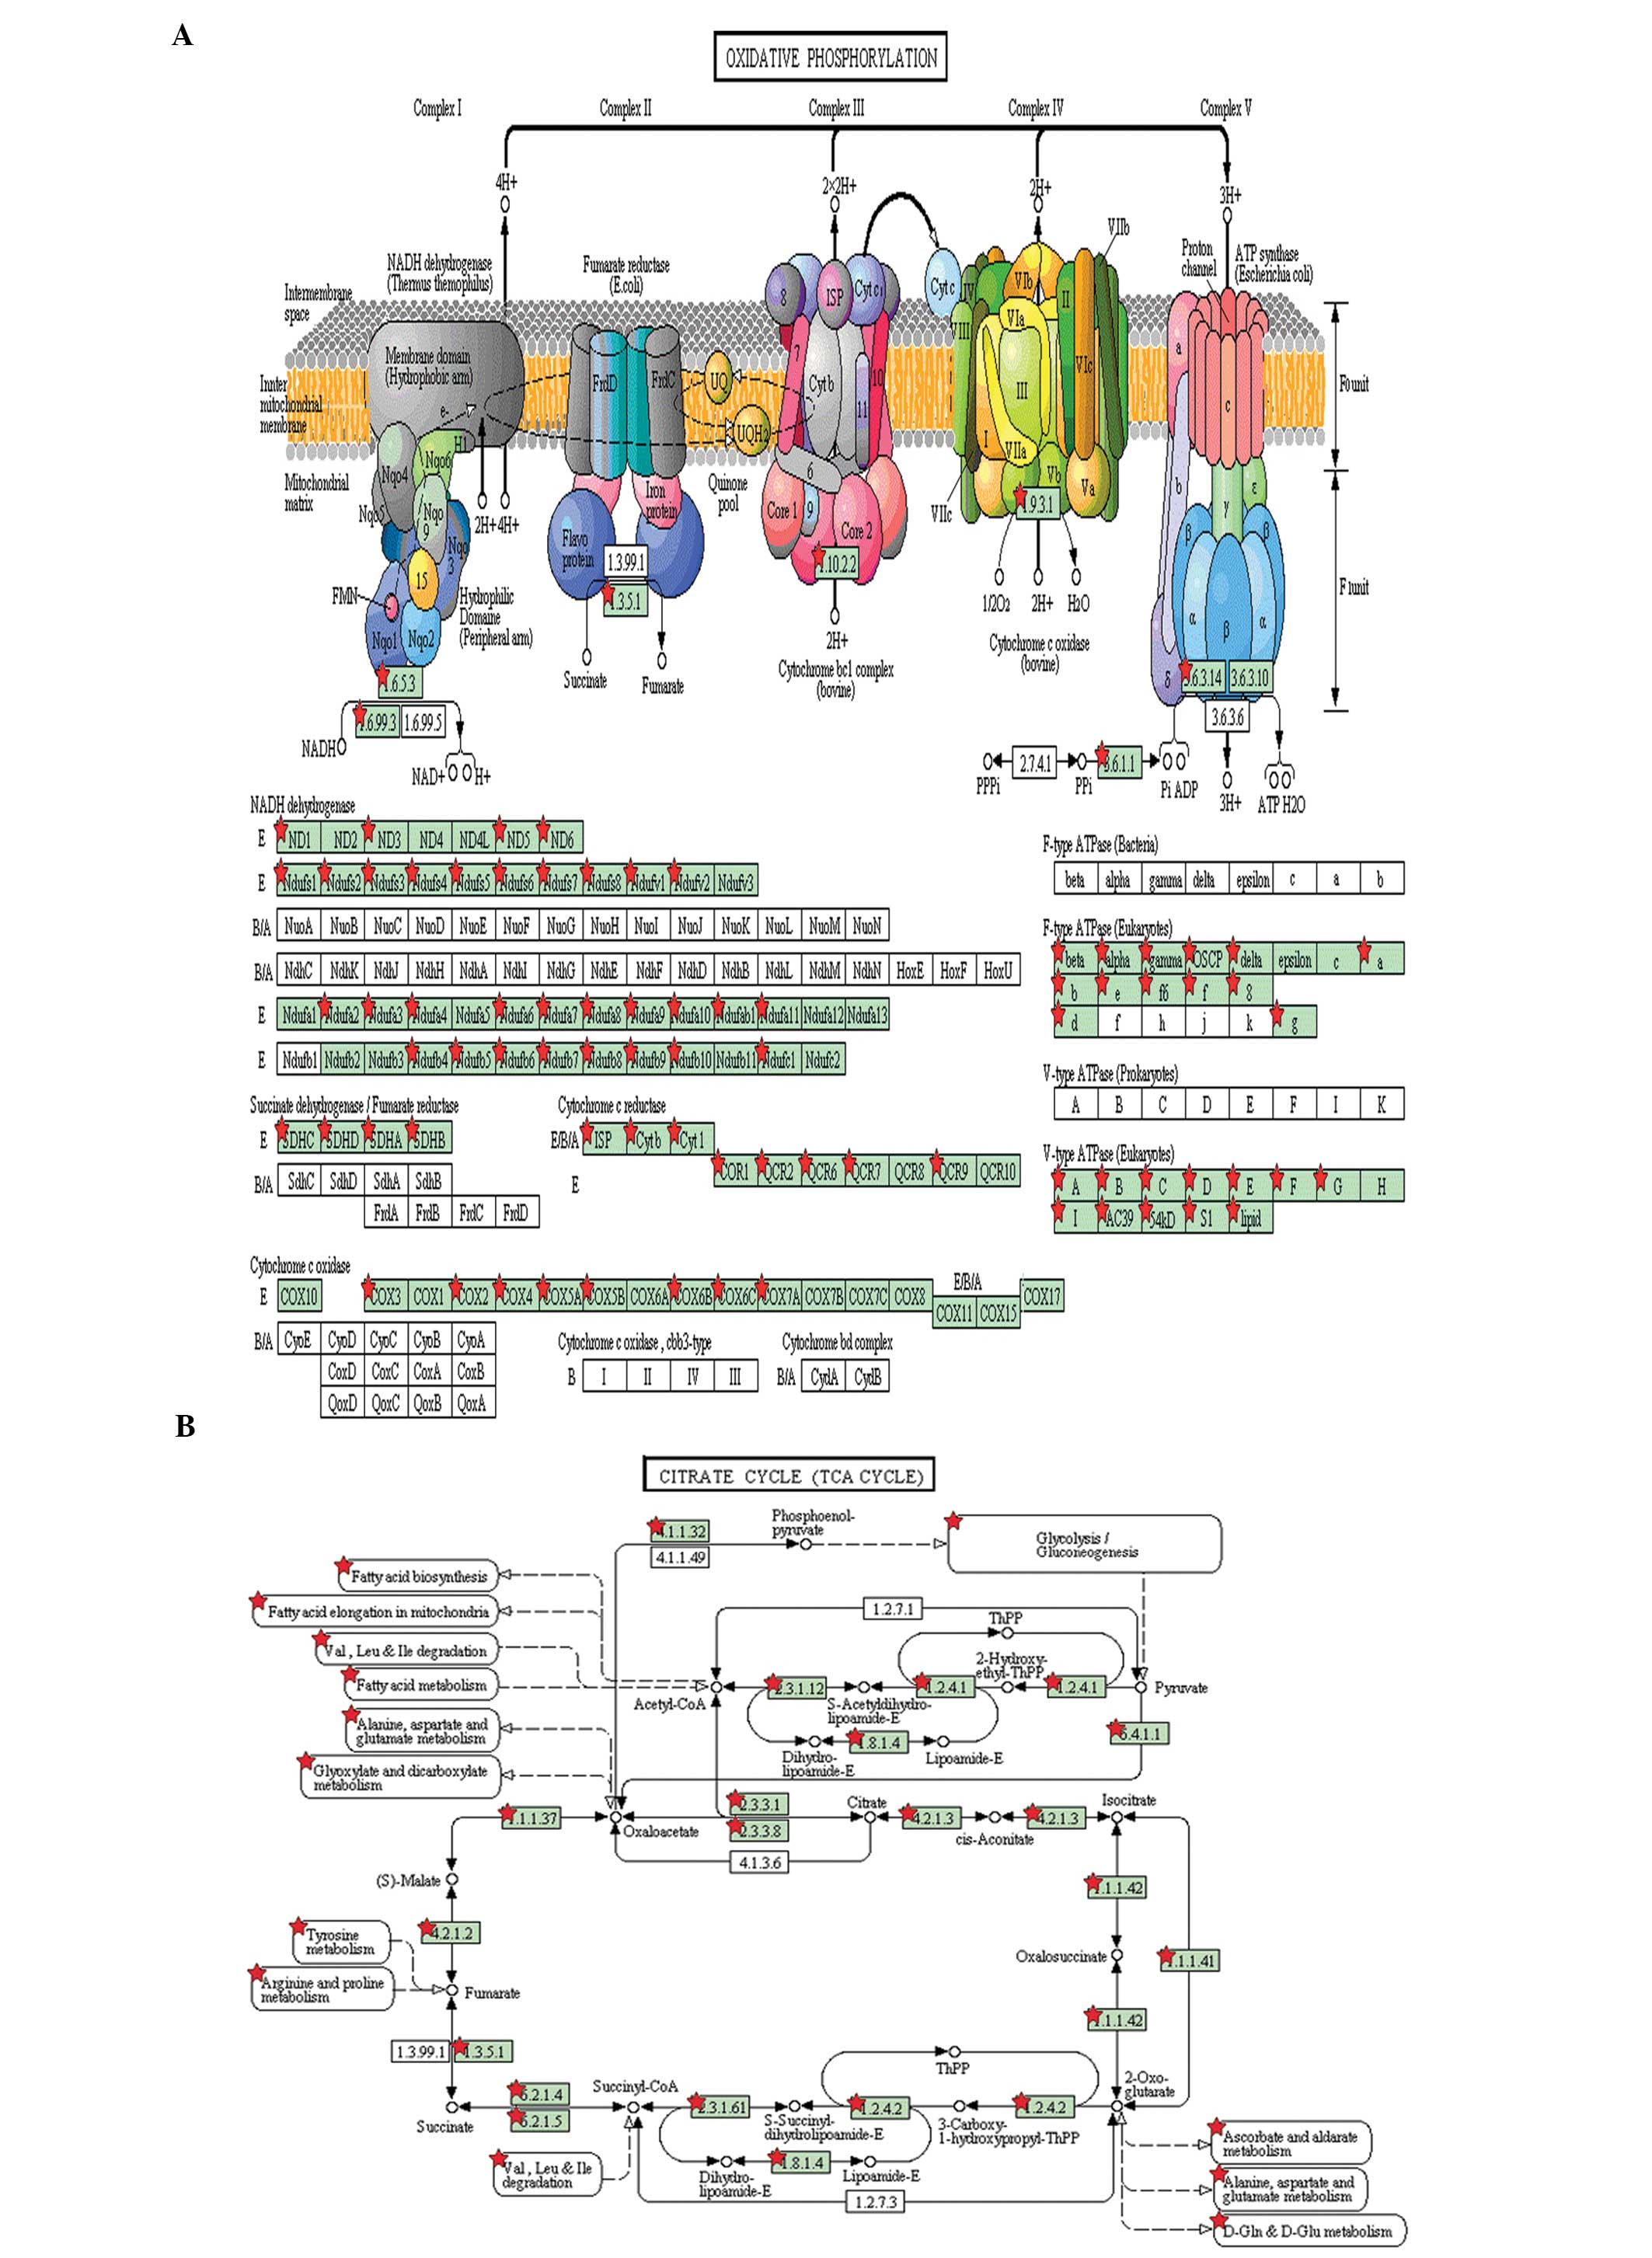
To investigate the pathways governing the behavior
of round spermatids, we further classified the proteins based on
KEGG pathway terms. As expected, an important proportion of the
identified proteins (370) were involved in metabolic pathways.
Among these proteins, 81 were involved in the oxidative
phosphorylation pathway (Fig. 5A)
that supports spermatid maturation, and 34 were related to the
fatty acid metabolism pathway. This pathway provides the necessary
energy for spermatid maturation. In addition, 27 proteins were
bound to the citric acid (TCA) cycle (Fig. 5B) and 92 proteins were involved in
sugar metabolism pathways, such as glycolysis, gluconeogenesis,
pyruvate metabolism, starch and sucrose metabolism and the pentose
phosphate pathway (data not shown).
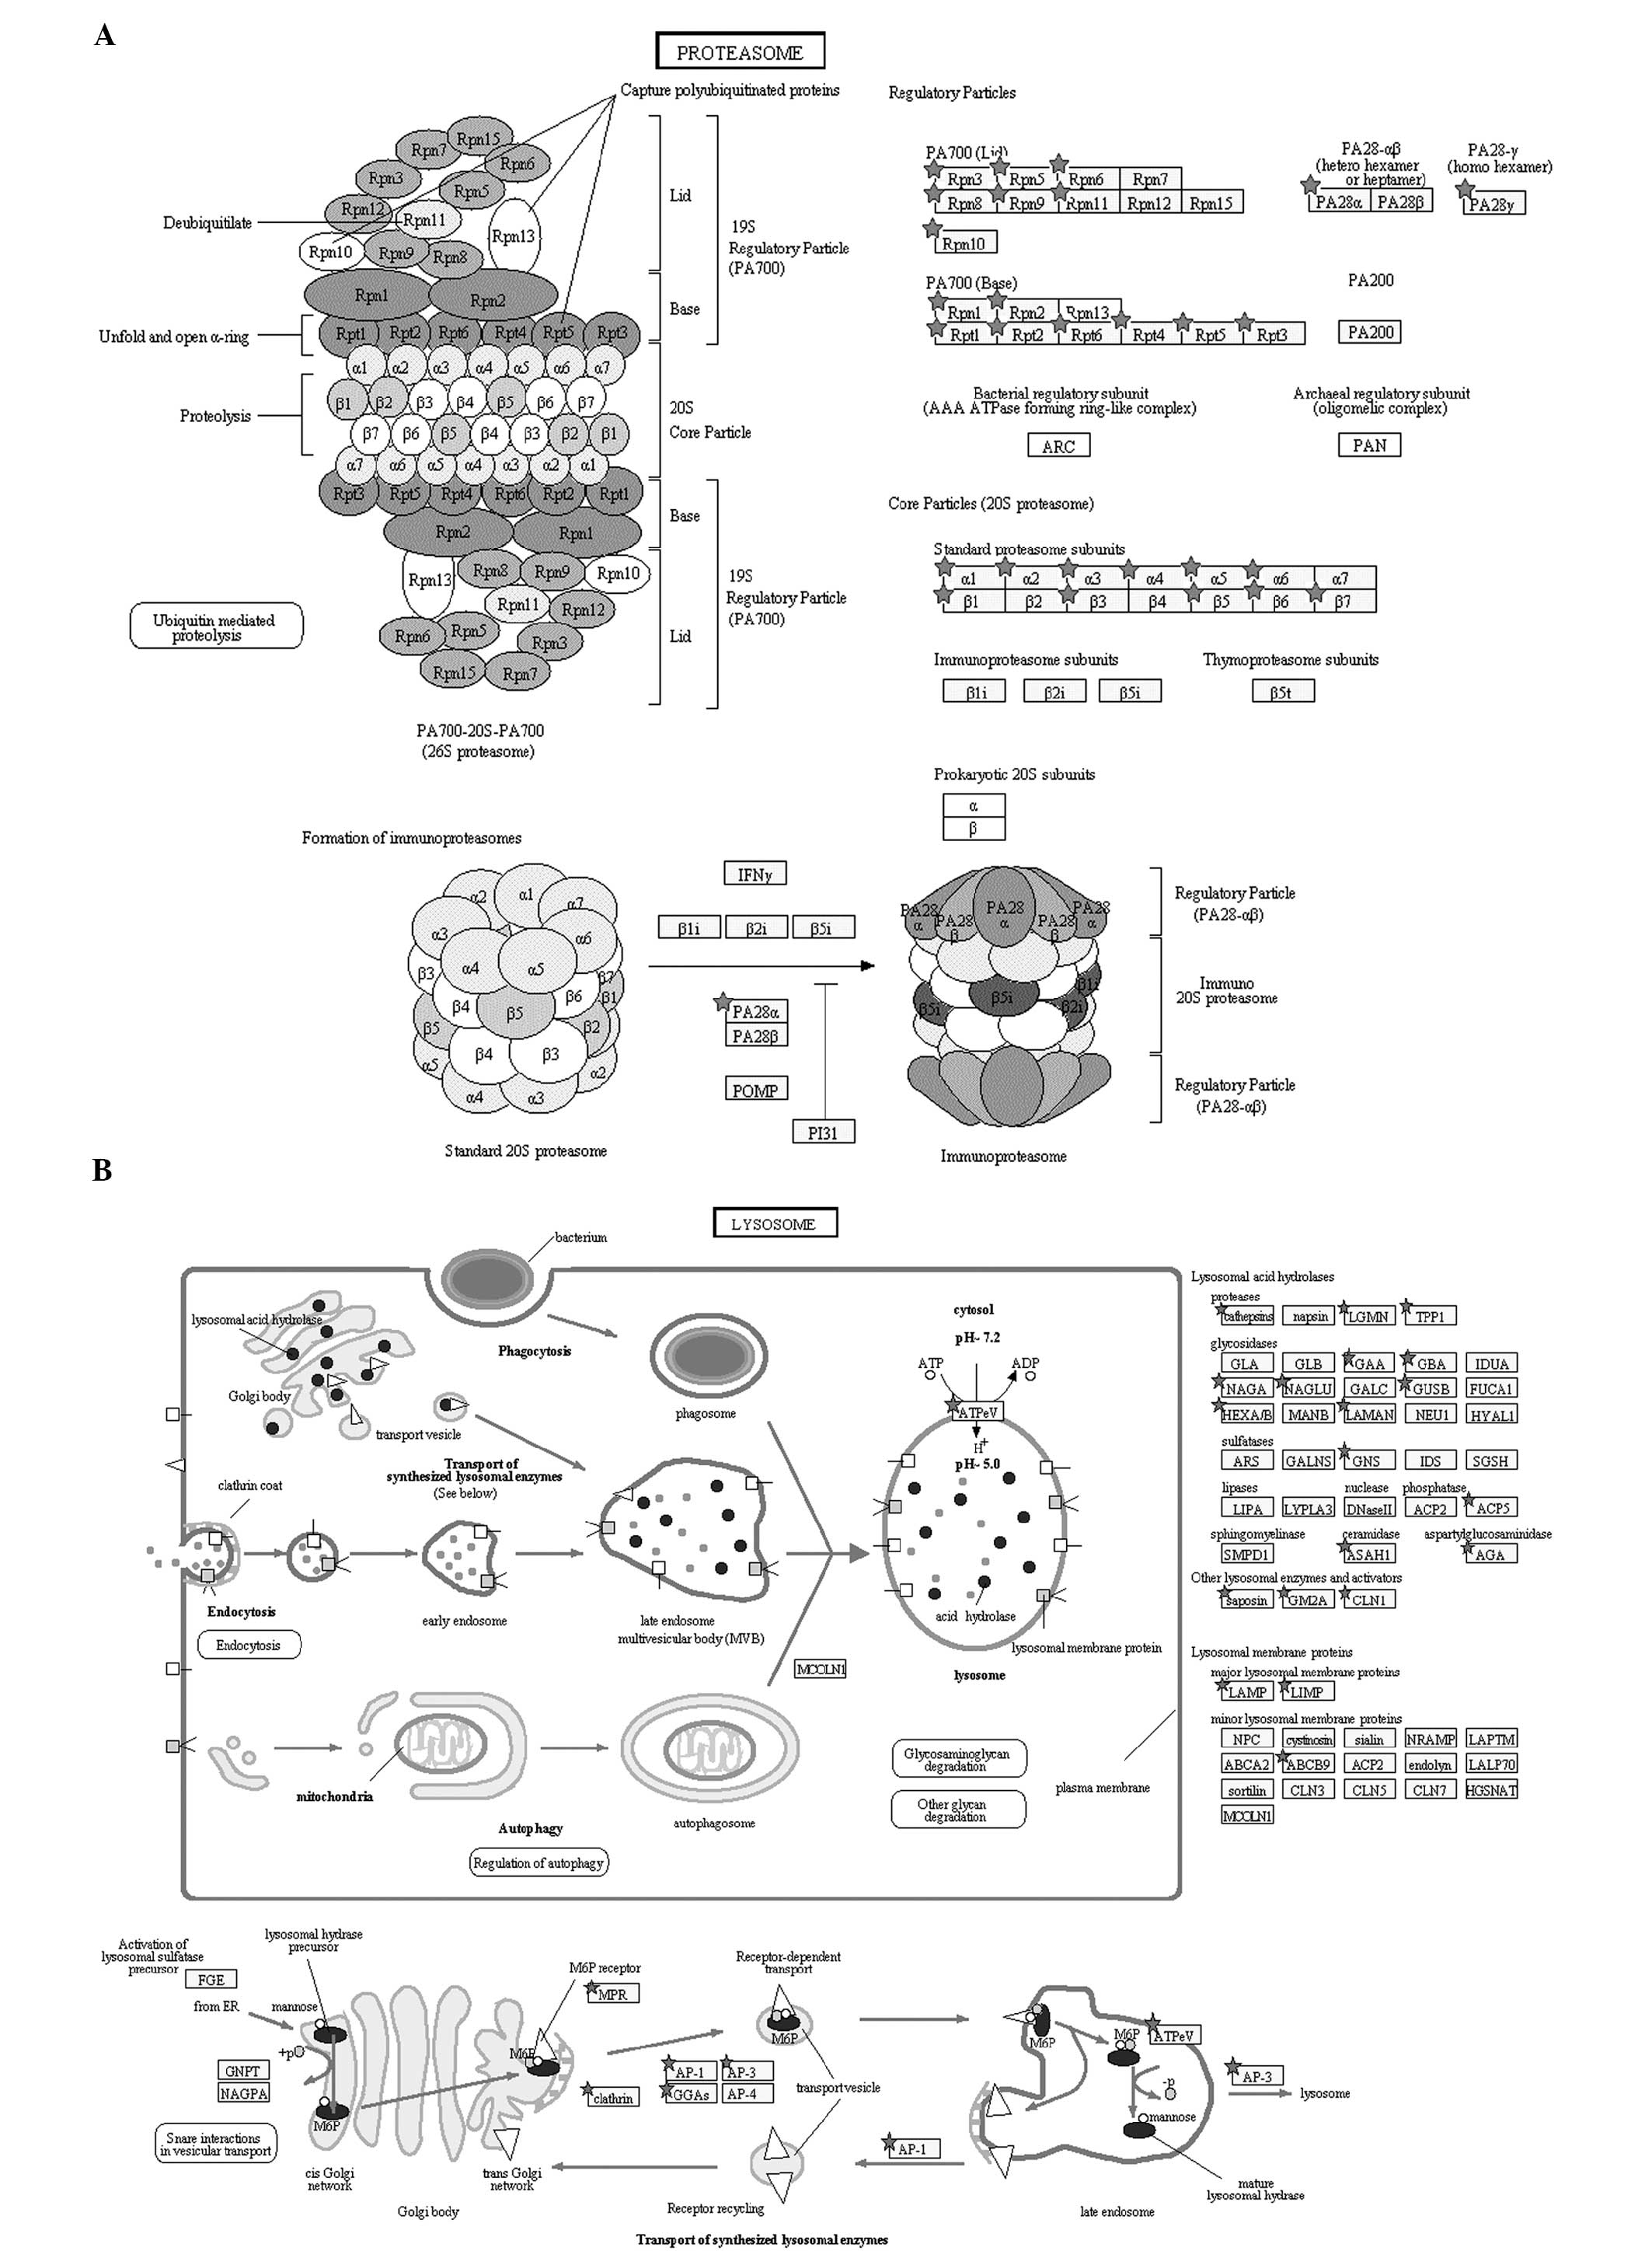
In addition to the proteins involved in metabolism,
a large group of proteins essential for translation were identified
in round spermatids. A total of 68 proteins were annotated as parts
of the ribosomal pathway, and 17 proteins as related to
aminoacyl-tRNA biosynthesis. Numerous proteins were also involved
in protein degradation. We found that the round spermatid proteome
contained 28 proteins in the proteasome pathway and 40 proteins in
the lysosome pathway (Fig. 6A and
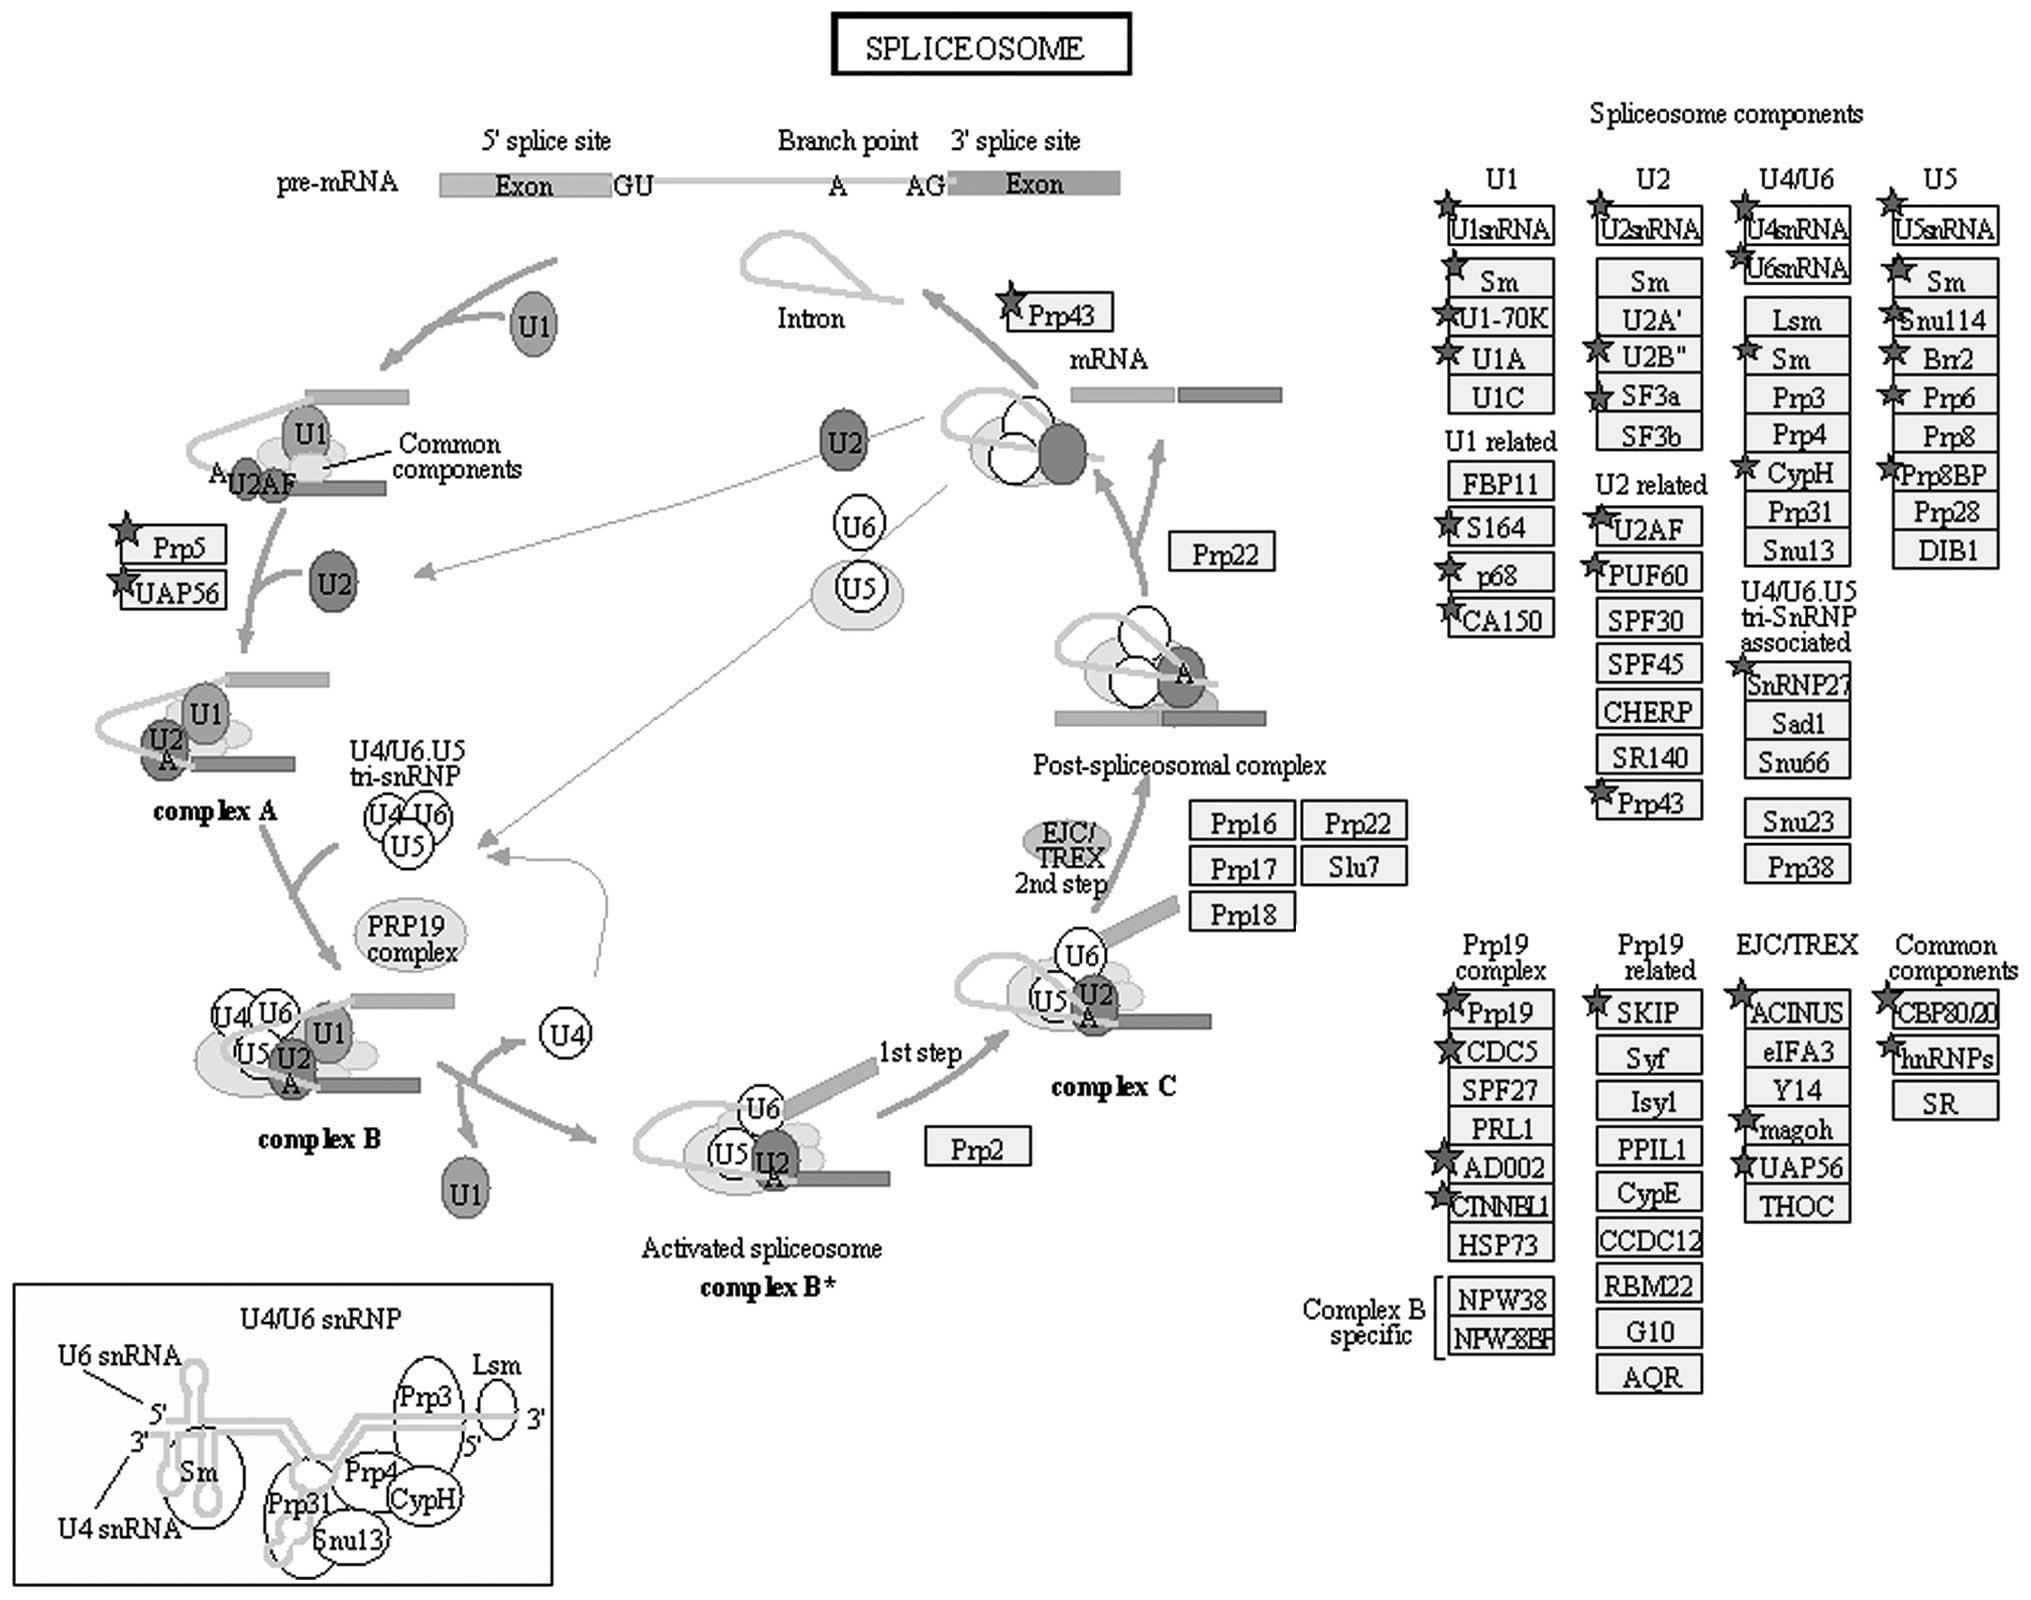
B). Pathway annotation of the haploid proteome by the Pathway
Studio software (http://www.elsevier.com/online-tools/pathway-studio/pathway-studio-web)
revealed that 60 proteins are components of the spliceosome
pathway, in which heterogeneous nuclear RNA (hnRNA) is converted to
mRNA (Fig. 7).
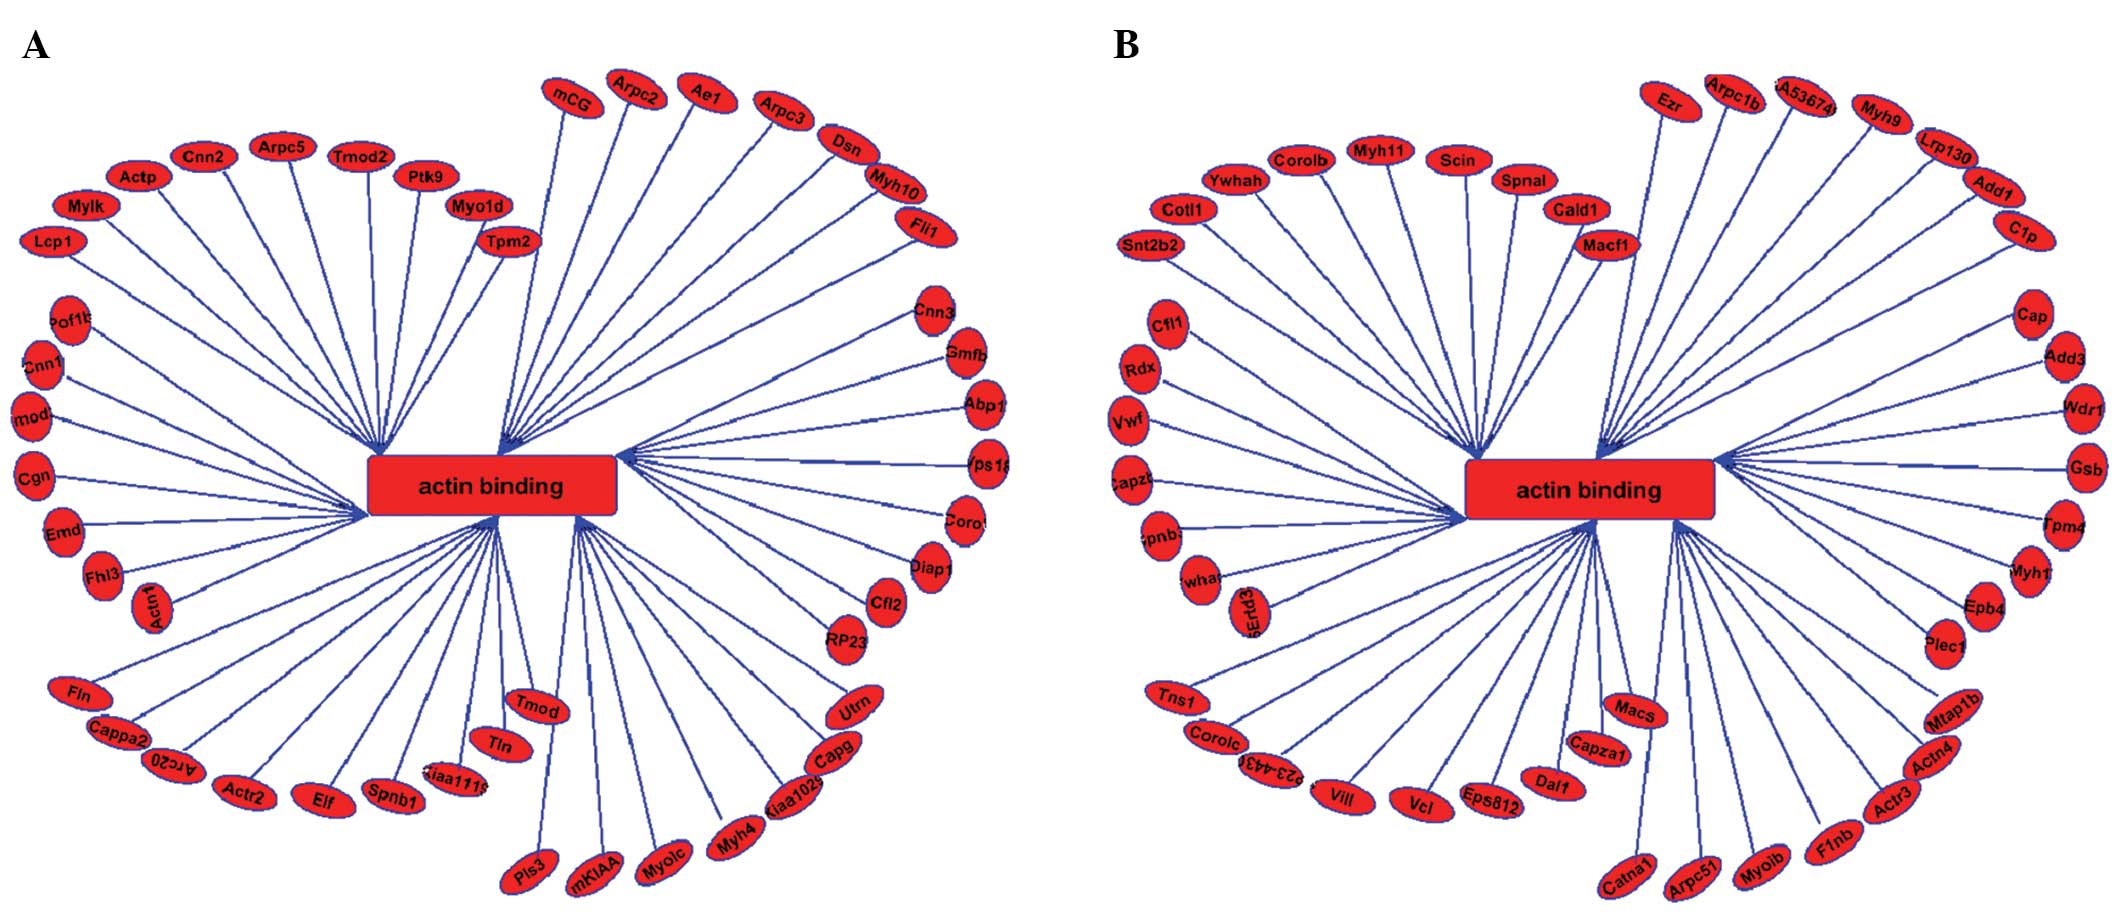
Numerous actin and actin-binding proteins
participate in the formation of sperm. LC-MS/MS analysis performed
in this study identified ~94 actin-binding proteins, involved in
the regulation of the actin cytoskeleton KEGG pathway in round
spermatids of mice (Fig. 8A and
B).
A total of 25 proteins involved in gap junctions, 44
proteins in tight junctions and 26 proteins in adherens junctions
were also detected. Seven proteins involved in the
nucleocytoplasmic transport pathway (Fig. 9) and nine proteins related to the
caspase cascade of the apoptotic signaling pathway were also
identified. Full results from the pathway analysis are shown in
Table II.
| Table IIPathway analysis in the round
spermatid proteome using the Kyoto Encyclopedia of Genes and
Genomes (KEGG) and the BioCarta Pathway databases. |
Table II
Pathway analysis in the round
spermatid proteome using the Kyoto Encyclopedia of Genes and
Genomes (KEGG) and the BioCarta Pathway databases.
| Source | Term | Count | % | P | Qa |
|---|
| KEGG | Ribosome | 68 | 3.0 | 6.5E-32 | 1.2E-29 |
| KEGG | Oxidative
phosphorylation | 81 | 3.6 | 3.2E-28 | 2.9E-26 |
| KEGG | Parkinson’s
disease | 73 | 3.2 | 6.9E-21 | 4.2E-19 |
| KEGG | Alzheimer’s
disease | 85 | 3.8 | 2.1E-18 | 9.6E-17 |
| KEGG | Valine, leucine and
isoleucine degradation | 36 | 1.6 | 1.9E-17 | 7.0E-16 |
| KEGG | Huntington’s
disease | 83 | 3.7 | 4.8E-17 | 1.5E-15 |
| KEGG | Fatty acid
metabolism | 34 | 1.5 | 1.1E-15 | 2.9E-14 |
| KEGG | Citrate (TCA)
cycle | 27 | 1.2 | 4.2E-15 | 9.8E-14 |
| KEGG | Spliceosome | 60 | 2.7 | 6.8E-14 | 1.4E-12 |
| KEGG |
Glycolysis/Gluconeogenesis | 38 | 1.7 | 2.3E-11 | 4.3E-10 |
| KEGG | Propanoate
metabolism | 23 | 1.0 | 7.5E-11 | 1.3E-9 |
| KEGG | Glutathione
metabolism | 30 | 1.3 | 1.6E-9 | 2.5E-8 |
| KEGG | Proteasome | 28 | 1.2 | 2.4E-9 | 3.5E-8 |
| KEGG | Pyruvate
metabolism | 25 | 1.1 | 1.1E-8 | 1.5E-7 |
| KEGG | Focal adhesion | 66 | 2.9 | 5.7E-7 | 7.0E-6 |
| KEGG | Butanoate
metabolism | 21 | 0.9 | 1.1E-6 | 1.3E-5 |
| KEGG | ECM-receptor
interaction | 35 | 1.5 | 1.3E-6 | 1.4E-5 |
| KEGG | Drug
metabolism | 31 | 1.4 | 9.6E-6 | 9.9E-5 |
| KEGG | PPAR signaling
pathway | 32 | 1.4 | 1.1E-5 | 1.1E-4 |
| KEGG | Arginine/proline
metabolism | 24 | 1.1 | 2.2E-5 | 2.1E-4 |
| KEGG | Tight junction | 44 | 1.9 | 1.0E-4 | 9.2E-4 |
| KEGG | Lysosome | 40 | 1.8 | 1.1E-4 | 9.2E-4 |
| KEGG | Metabolism of
xenobiotics by cytochrome P450 | 26 | 1.1 | 1.5E-4 | 1.2E-3 |
| KEGG | β-alanine
metabolism | 13 | 0.6 | 1.5E-4 | 1.2E-3 |
| KEGG | Tryptophan
metabolism | 18 | 0.8 | 3.5E-4 | 2.6E-3 |
| KEGG | Alanine, aspartate
and glutamate metabolism | 15 | 0.7 | 3.7E-4 | 2.6E-3 |
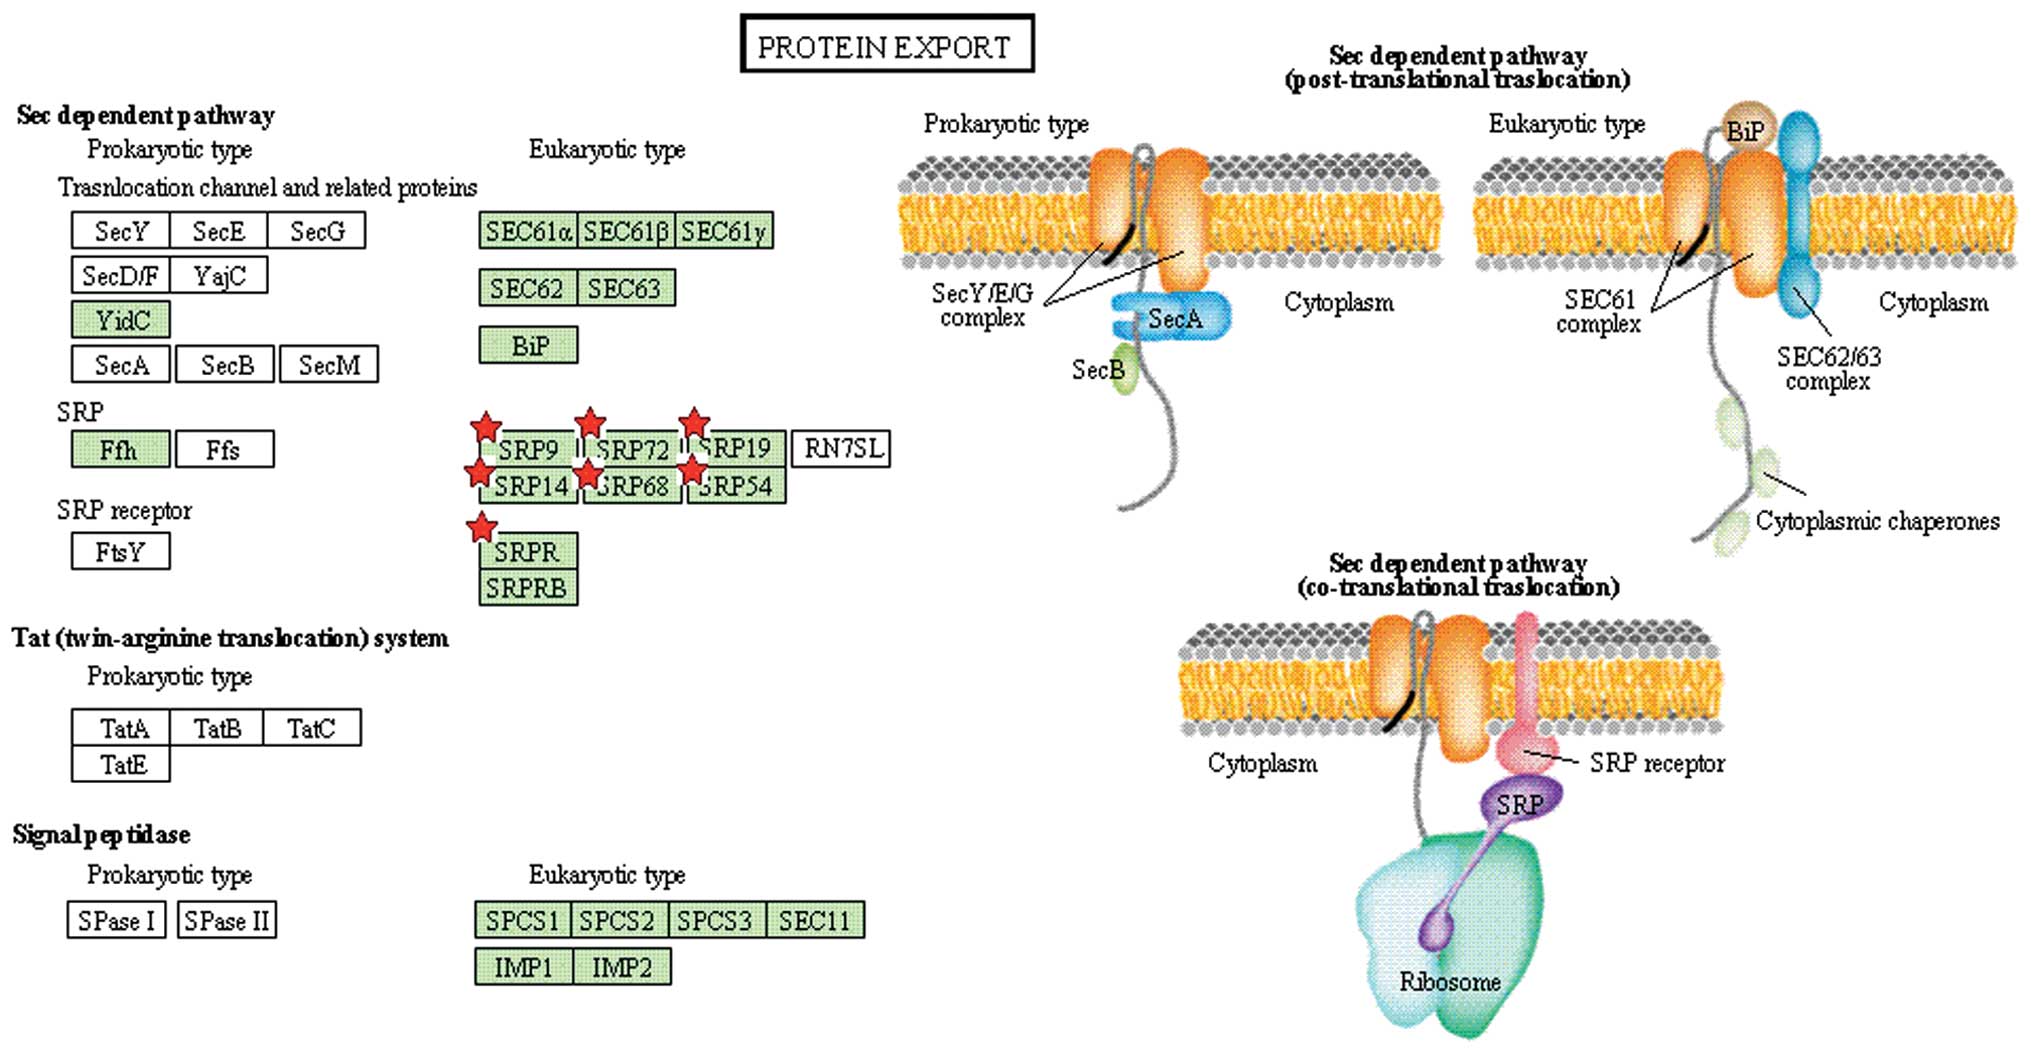
| KEGG | Protein export | 7 | 0.3 | 7.7E-4 | 5.3E-3 |
| KEGG | Fatty acid
elongation in mitochondria | 7 | 0.3 | 7.7E-4 | 5.3E-3 |
| KEGG | Starch and sucrose
metabolism | 16 | 0.7 | 1.0E-3 | 6.6E-3 |
| KEGG | Pentose phosphate
pathway | 13 | 0.6 | 1.1E-3 | 6.9E-3 |
| KEGG | Leukocyte
transendothelial migration | 37 | 1.6 | 1.1E-3 | 6.8E-3 |
| KEGG | Cardiac muscle
contraction | 27 | 1.2 | 1.1E-3 | 6.7E-3 |
| KEGG | Valine, leucine and
isoleucine biosynthesis | 8 | 0.4 | 1.2E-3 | 6.8E-3 |
| KEGG | Porphyrin and
chlorophyll metabolism | 14 | 0.6 | 1.4E-3 | 7.9E-3 |
| KEGG | Adherens
junction | 26 | 1.1 | 1.7E-3 | 9.3E-3 |
| KEGG | Aminoacyl-tRNA
biosynthesis | 17 | 0.8 | 2.1E-3 | 1.1E-2 |
| KEGG | Galactose
metabolism | 12 | 0.5 | 5.8E-3 | 2.9E-2 |
| KEGG | Regulation of actin
cytoskeleton | 56 | 2.5 | 6.2E-3 | 3.0E-2 |
| KEGG | Pentose and
glucuronate interconversions | 9 | 0.4 | 6.5E-3 | 3.1E-2 |
| KEGG | Arrhythmogenic
right ventricular cardiomyopathy | 24 | 1.1 | 6.9E-3 | 3.2E-2 |
| KEGG | Amino sugar and
nucleotide sugar metabolism | 16 | 0.7 | 9.6E-3 | 4.4E-2 |
| KEGG | Limonene and pinene
degradation | 8 | 0.4 | 1.2E-2 | 5.1E-2 |
| KEGG | Ascorbate and
aldarate metabolism | 8 | 0.4 | 1.2E-2 | 5.1E-2 |
| KEGG | Phenylalanine
metabolism | 10 | 0.4 | 1.2E-2 | 5.1E-2 |
| KEGG | Long-term
potentiation | 22 | 1.0 | 1.2E-2 | 5.2E-2 |
| KEGG | Fc γ R-mediated
phagocytosis | 28 | 1.2 | 1.7E-2 | 6.8E-2 |
| KEGG | Glyoxylate and
dicarboxylate metabolism | 8 | 0.4 | 1.7E-2 | 6.9E-2 |
| KEGG | Tyrosine
metabolism | 14 | 0.6 | 1.9E-2 | 7.3E-2 |
| KEGG | Gap junction | 25 | 1.1 | 2.0E-2 | 7.5E-2 |
| KEGG | Synthesis and
degradation of ketone bodies | 6 | 0.3 | 2.3E-2 | 8.7E-2 |
| KEGG | Lysine
degradation | 14 | 0.6 | 2.8E-2 | 1.0E-1 |
| KEGG | N-glycan
biosynthesis | 15 | 0.7 | 3.3E-2 | 1.2E-1 |
| KEGG | Prion diseases | 12 | 0.5 | 4.5E-2 | 1.5E-1 |
| KEGG | Long-term
depression | 20 | 0.9 | 6.0E-2 | 2.0E-1 |
| KEGG | Fructose and
mannose metabolism | 12 | 0.5 | 6.5E-2 | 2.1E-1 |
| KEGG | Oocyte meiosis | 29 | 1.3 | 6.7E-2 | 2.1E-1 |
| KEGG | Renin-angiotensin
system | 7 | 0.3 | 9.7E-2 | 2.9E-1 |
| BioCarta | Shuttle for
transfer of acetyl groups from mitochondria to the cytosol | 8 | 0.4 | 7.9E-5 | 1.7E-2 |
| BioCarta | uCalpain and
friends in cell spread | 8 | 0.4 | 3.7E-3 | 3.3E-1 |
| BioCarta | ERAD pathway | 9 | 0.4 | 6.6E-3 | 3.8E-1 |
| BioCarta | AKAP95 role in
mitosis and chromosome dynamics | 6 | 0.3 | 1.9E-2 | 6.4E-1 |
| BioCarta | Agrin in
postsynaptic differentiation | 11 | 0.5 | 2.2E-2 | 6.1E-1 |
| BioCarta | Cycling of Ran in
nucleocytoplasmic transport | 4 | 0.2 | 2.7E-2 | 6.2E-1 |
| BioCarta | Protein kinase A at
the centrosome | 7 | 0.3 | 2.9E-2 | 6.0E-1 |
| BioCarta | Caspase cascade in
apoptosis | 9 | 0.4 | 4.1E-2 | 6.8E-1 |
| BioCarta | Endocytotic role of
NDK, phosphins and dynamin | 5 | 0.2 | 5.5E-2 | 7.4E-1 |
| BioCarta | Role of β-arrestins
in the activation and targeting of MAP kinases | 7 | 0.3 | 6.0E-2 | 7.3E-1 |
| BioCarta | How progesterone
initiates the oocyte maturation | 8 | 0.4 | 8.5E-2 | 8.2E-1 |
| BioCarta | Role of Ran in
mitotic spindle regulation | 5 | 0.2 | 8.5E-2 | 7.9E-1 |
| BioCarta | ChREBP regulation
by carbohydrates and cAMP | 5 | 0.2 | 8.5E-2 | 7.9E-1 |
| BioCarta | CFTR and b2AR
pathway | 5 | 0.2 | 8.5E-2 | 7.9E-1 |
| BioCarta | Rho-selective
guanine exchange factor AKAP13 mediates stress fiber formation | 4 | 0.2 | 9.8E-2 | 8.2E-1 |
Discussion
The proteome of a cell or an organelle provides
information regarding the ensemble of proteins expressed in that
particular cell or organelle, and the modification of proteins
under specific physiological conditions and time points (21). Label-free proteomics is a rapidly
growing MS-based quantitative proteomic workflow, since it does not
require chemical labeling; quantification is thus unaffected by
labelling efficiencies (22). In
order to fully characterise spermiogenesis, and in particular the
biological characteristics of round spermatids, we obtained, using
a label-free proteomic approach, the full proteome of 2,331
proteins of round spermatids of mice; among these proteins, 2,287
mapped to unique genes.
Spermatogenesis is a complex and highly ordered
process, which begins with the differentiation of spermatogonial
stem cells and ends with the formation of mature sperm. In haploid
germ cell differentiation (or spermiogenesis), round spermatids
undergo marked morphological changes. The nucleus becomes more
compact, the mitochondria are rearranged, the flagellum develops
and an acrosome is formed (23).
In the present study, β-1-globin, β-2-globin and histone H4 were
found to be expressed in round spermatids (data not shown). These
proteins are constituents of the chromatin structure and
participate in gene regulation (24).
Energy metabolism is a key process for the
development of round spermatids. Round spermatids require ATP, most
probably to sustain morphological changes, as well as active
protein degradation and synthesis. In round spermatids, lactate and
pyruvate are the preferred substrates for the generation of energy;
the use of glucose is limited (25). In our study, 504 proteins were
identified as involved in the generation of precursor metabolites
and energy (Table I). The TCA
cycle is the main energy resource of round spermatids, although
glycolytic and pentose phosphate pathways also contribute to energy
production in the spermatids (26). Citrate synthase, isocitrate
dehydrogenase and α-oxoglutarate dehydrogenase are expressed in
round spermatids (Table I and
Fig. 5B). L-lactate dehydrogenase,
pyruvate kinase and pyruvate dehydrogenase, which are involved in
the glycolytic pathway, are also expressed in round spermatids.
Pyruvate kinase is fully activated in round spermatids when glucose
is metabolized by the glycolytic pathway (27). A total of 81 proteins were
identified as involved in the oxidative phosphorylation pathway in
round spermatids (Fig. 5A); these
proteins may be involved in the formation and in reactions
occurring in the acrosome, which require energy provided by
oxidative phosphorylation (25).
At the stage of development of round spermatids,
numerous proteins and organelles are degraded; the
ubiquitin-proteasome and the lysosome pathways are important,
particularly in facilitating the formation of condensed sperms. In
the present study, 28 proteins were found as involved in the
proteasome pathway and 40 proteins in the lysosome pathway
(Fig. 6A and B).
Post-translational protein modification by ubiquitination is a
signal for lysosomal or proteasomal proteolysis. UBA6 is an
E1-activating enzyme, which can activate ubiquitin and FAT10
(28,29). UBA6 uses a specific E2 enzyme,
namely, Use1, which cooperates with E3 enzymes to ubiquitylate a
unique subset of protein substrates (30). CUL4 is an E3 ubiquitin ligase; in
the absence of a functional CUL4 gene, a decreased number of
spermatozoa, reduced sperm motility and defective acrosome
formation are observed (31). The
ubiquitination of proteins can be regulated and reversed by
deubiquitinating enzymes. Ubiquitin C-terminal hydrolases (UCHs)
are responsible for the removal of polyubiquitin chains during
substrate priming for proteasomal proteolysis. UCHL1 and UCHL3,
which were identified in round spermatids in our study, are
involved in sperm acrosomal formation and function; these enzymes
are known to be important for fertilization (32,33).
Transcription during spermatogenesis begins in
almost-round spermatids; these transcripts are then translated
during spermatid elongation and acrosome formation (34,35).
In our study, 60 proteins were annotated as parts of the
spliceosome pathway, in which hnRNA is converted to mRNA and
translated to proteins (Fig. 7).
Following protein synthesis, some proteins are translocated between
the nuclear and cytoplasmic compartments to allow the essential
cellular responses to extracellular and intracellular signals. In
our study, seven proteins, such as SRP19 and SRP72, were identified
as involved in protein transport and regulation of signal
transduction (36,37).
Acrosome formation and spermatid nuclear shaping are
two major processes of spermiogenesis. Actin and actin-binding
proteins are implicated in various aspects, including acrosome
formation and nuclear shaping of the spermatids during
spermiogenesis. Actin is also involved in germ cell movement,
protein transport and nuclear modifications. Numerous actin-binding
proteins are found in actin-rich sites, and these proteins bind to
actin filaments and modulate their corresponding properties and
functions. Myosin, an actin-dependent molecular motor, is involved
in a number of important functions in spermiogenesis, such as
acrosome biogenesis, vesicle transport, gene transcription and
nuclear shaping (38,39). In the current study, ~94 proteins
were predicted to be involved in the regulation of the actin
cytoskeleton in the round spermatids of mice (Fig. 8).
Numerous studies have focused on the proteomic
analysis of spermatogenesis. Nevertheless, current knowledge on the
proteome of round spermatids is limited, and the detailed protein
patterns of round spermatids remain unknown. Thus, large-scale
proteomic approaches such as the one employed in the present study,
can provide a rich resource in the study of spermiogenesis, and
enrich our knowledge on the biological functions of round
spermatids.
In conclusion, this study is the first, to the best
of our knowledge, to conduct a proteomic analysis of round
spermatids. Round spermatids are formed in a specific phase of
spermatogenesis. We performed label-free quantification analysis
and identified 2,287 unique proteins, which are involved in energy
metabolism, transcription, protein synthesis and degradation, and
nucleocytoplasmic transport. These biological processes facilitate
the morphological changes to which round spermatids are subjected.
The proteome analysis performed in the current study provided a
comprehensive characterization of the protein expression profiles
of round spermatids. Therefore, the present study is expected to
enhance our understanding of the molecular basis of
spermatogenesis.
Acknowledgements
This study was supported by the Scientific Research
Foundation for Returned Scholars of Shanxi Province (2011-043,
2010-677).
References
|
1
|
Blanco-Rodriguez J and Martinez-Garcia C:
Spontaneous germ cell death in the testis of the adult rat takes
the form of apoptosis: re-evaluation of cell types that exhibit the
ability to die during spermatogenesis. Cell Prolif. 29:13–31. 1996.
View Article : Google Scholar
|
|
2
|
Jan SZ, Hamer G, Repping S, de Rooij DG,
van Pelt AM and Vormer TL: Molecular control of rodent
spermatogenesis. Biochim Biophys Acta. 1822.1838–1850.
2012.PubMed/NCBI
|
|
3
|
Anway MD, Li Y, Ravindranath N, Dym M and
Griswold MD: Expression of testicular germ cell genes identified by
differential display analysis. J Androl. 24:173–184.
2003.PubMed/NCBI
|
|
4
|
O’Shaughnessy PJ, Fleming L, Baker PJ,
Jackson G and Johnston H: Identification of developmentally
regulated genes in the somatic cells of the mouse testis using
serial analysis of gene expression. Biol Reprod. 69:797–808.
2003.
|
|
5
|
Schlecht U, Demougin P, Koch R, et al:
Expression profiling of mammalian male meiosis and gametogenesis
identifies novel candidate genes for roles in the regulation of
fertility. Mol Biol Cell. 15:1031–1043. 2004. View Article : Google Scholar : PubMed/NCBI
|
|
6
|
Kovac JR, Pastuszak AW and Lamb DJ: The
use of genomics, proteomics, and metabolomics in identifying
biomarkers of male infertility. Fertil Steril. 99:998–1007. 2013.
View Article : Google Scholar : PubMed/NCBI
|
|
7
|
Baker MA, Hetherington L, Reeves GM and
Aitken RJ: The mouse sperm proteome characterized via IPG strip
prefractionation and LC-MS/MS identification. Proteomics.
8:1720–1730. 2008. View Article : Google Scholar
|
|
8
|
Baker MA, Reeves G, Hetherington L and
Aitken RJ: Analysis of proteomic changes associated with sperm
capacitation through the combined use of IPG-strip
pre-fractionation followed by RP chromatography LC-MS/MS analysis.
Proteomics. 10:482–495. 2010. View Article : Google Scholar : PubMed/NCBI
|
|
9
|
Oliva R and Castillo J: Proteomics and the
genetics of sperm chromatin condensation. Asian J Androl. 13:24–30.
2011. View Article : Google Scholar : PubMed/NCBI
|
|
10
|
Paz M, Morin M and Del Mazo J: Proteome
profile changes during mouse testis development. Comp Biochem
Physiol Part D Genomics Proteomics. 1:404–415. 2006. View Article : Google Scholar : PubMed/NCBI
|
|
11
|
Xun Z, Kaufman TC and Clemmer DE: Stable
isotope labeling and label-free proteomics of Drosophila
parkin null mutants. J Proteome Res. 8:4500–4510. 2009.
View Article : Google Scholar : PubMed/NCBI
|
|
12
|
Cravatt BF, Simon GM and Yates JR III: The
biological impact of mass-spectrometry-based proteomics. Nature.
450:991–1000. 2007. View Article : Google Scholar : PubMed/NCBI
|
|
13
|
Bauer KM, Lambert PA and Hummon AB:
Comparative label-free LC-MS/MS analysis of colorectal
adenocarcinoma and metastatic cells treated with 5-fluorouracil.
Proteomics. 12:1928–1937. 2012. View Article : Google Scholar : PubMed/NCBI
|
|
14
|
Zhu W, Smith JW and Huang CM: Mass
spectrometry-based label-free quantitative proteomics. J Biomed
Biotechnol. 2010:8405182010.PubMed/NCBI
|
|
15
|
Clough T, Thaminy S, Ragg S, Aebersold R
and Vitek O: Statistical protein quantification and significance
analysis in label-free LC-MS experiments with complex designs. BMC
Bioinformatics. 13:S62012. View Article : Google Scholar : PubMed/NCBI
|
|
16
|
Merl J, Ueffing M, Hauck SM and von Toerne
C: Direct comparison of MS-based label-free and SILAC quantitative
proteome profiling strategies in primary retinal Muller cells.
Proteomics. 12:1902–1911. 2012. View Article : Google Scholar : PubMed/NCBI
|
|
17
|
Niehl A, Zhang ZJ, Kuiper M, Peck SC and
Heinlein M: Label-free quantitative proteomic analysis of systemic
responses to local wounding and virus infection in Arabidopsis
thaliana. J Proteome Res. 12:2491–2503. 2013. View Article : Google Scholar : PubMed/NCBI
|
|
18
|
Bellve AR, Cavicchia JC, Millette CF,
O’Brien DA, Bhatnagar YM and Dym M: Spermatogenic cells of the
prepuberal mouse. Isolation and morphological characterization. J
Cell Biol. 74:68–85. 1977. View Article : Google Scholar : PubMed/NCBI
|
|
19
|
Keller A, Nesvizhskii AI, Kolker E and
Aebersold R: Empirical statistical model to estimate the accuracy
of peptide identifications made by MS/MS and database search. Anal
Chem. 74:5383–5392. 2002. View Article : Google Scholar
|
|
20
|
Nesvizhskii AI, Keller A, Kolker E and
Aebersold R: A statistical model for identifying proteins by tandem
mass spectrometry. Anal Chem. 75:4646–4658. 2003. View Article : Google Scholar : PubMed/NCBI
|
|
21
|
Wilkins MR, Sanchez JC, Gooley AA, et al:
Progress with proteome projects: why all proteins expressed by a
genome should be identified and how to do it. Biotechnol Genet Eng
Rev. 13:19–50. 1996. View Article : Google Scholar : PubMed/NCBI
|
|
22
|
Wright PC, Noirel J, Ow SY and Fazeli A: A
review of current proteomics technologies with a survey on their
widespread use in reproductive biology investigations.
Theriogenology. 77:738–765. 2012. View Article : Google Scholar
|
|
23
|
Macleod G and Varmuza S: The application
of proteomic approaches to the study of mammalian spermatogenesis
and sperm function. FEBS J. 280:5635–5651. 2013. View Article : Google Scholar : PubMed/NCBI
|
|
24
|
Gardiner-Garden M, Ballesteros M, Gordon M
and Tam PP: Histone- and protamine-DNA association: conservation of
different patterns within the beta-globin domain in human sperm.
Mol Cell Biol. 18:3350–3356. 1998.PubMed/NCBI
|
|
25
|
Miki K: Energy metabolism and sperm
function. Soc Reprod Fertil Suppl. 65:309–325. 2007.PubMed/NCBI
|
|
26
|
Bajpai M, Gupta G and Setty BS: Changes in
carbohydrate metabolism of testicular germ cells during meiosis in
the rat. Eur J Endocrinol. 138:322–327. 1998. View Article : Google Scholar : PubMed/NCBI
|
|
27
|
Nakamura M, Okinaga S and Arai K:
Metabolism of round spermatids: kinetic properties of pyruvate
kinase. Andrologia. 19:91–96. 1987. View Article : Google Scholar : PubMed/NCBI
|
|
28
|
Groettrup M, Pelzer C, Schmidtke G and
Hofmann K: Activating the ubiquitin family: UBA6 challenges the
field. Trends Biochem Sci. 33:230–237. 2008. View Article : Google Scholar : PubMed/NCBI
|
|
29
|
Pelzer C and Groettrup M: FAT10: Activated
by UBA6 and functioning in protein degradation. Subcell Biochem.
54:238–246. 2010. View Article : Google Scholar : PubMed/NCBI
|
|
30
|
Jin J, Li X, Gygi SP and Harper JW: Dual
E1 activation systems for ubiquitin differentially regulate E2
enzyme charging. Nature. 447:1135–1138. 2007. View Article : Google Scholar : PubMed/NCBI
|
|
31
|
Kopanja D, Roy N, Stoyanova T, et al:
Cul4A is essential for spermatogenesis and male fertility. Dev
Biol. 352:278–287. 2011. View Article : Google Scholar : PubMed/NCBI
|
|
32
|
Yi YJ, Manandhar G, Sutovsky M, et al:
Ubiquitin C-terminal hydrolase-activity is involved in sperm
acrosomal function and anti-polyspermy defense during porcine
fertilization. Biol Reprod. 77:780–793. 2007. View Article : Google Scholar
|
|
33
|
Mtango NR, Sutovsky M, Susor A, Zhong Z,
Latham KE and Sutovsky P: Essential role of maternal UCHL1 and
UCHL3 in fertilization and preimplantation embryo development. J
Cell Physiol. 227:1592–1603. 2012. View Article : Google Scholar : PubMed/NCBI
|
|
34
|
Tanaka H and Baba T: Gene expression in
spermiogenesis. Cell Mol Life Sci. 62:344–354. 2005. View Article : Google Scholar
|
|
35
|
Ito C, Yamatoya K, Yoshida K, et al:
Integration of the mouse sperm fertilization-related protein
equatorin into the acrosome during spermatogenesis as revealed by
super-resolution and immunoelectron microscopy. Cell Tissue Res.
352:739–750. 2013. View Article : Google Scholar
|
|
36
|
Dean KA, von Ahsen O, Gorlich D and Fried
HM: Signal recognition particle protein 19 is imported into the
nucleus by importin 8 (RanBP8) and transportin. J Cell Sci.
114:3479–3485. 2001.PubMed/NCBI
|
|
37
|
van Nues RW, Leung E, McDonald JC,
Dantuluru I and Brown JD: Roles for Srp72p in assembly, nuclear
export and function of the signal recognition particle. RNA Biol.
5:73–83. 2008.PubMed/NCBI
|
|
38
|
Sperry AO: The dynamic cytoskeleton of the
developing male germ cell. Biol Cell. 104:297–305. 2012. View Article : Google Scholar : PubMed/NCBI
|
|
39
|
Sun X, Kovacs T, Hu YJ and Yang WX: The
role of actin and myosin during spermatogenesis. Mol Biol Rep.
38:3993–4001. 2011. View Article : Google Scholar : PubMed/NCBI
|