Introduction
Thyroid cancer is the most common type of malignancy
in the head and neck. It can be divided into four pathological
types: Papillary thyroid carcinoma (PTC), follicular carcinoma,
medullary carcinoma and undifferentiated carcinoma. PTC is the most
common of these and accounts for ~80% of cases (1). The incidence of PTC in the USA has
increased in recent years (2).
Nevertheless, the prognosis for PTC is good and overall survival is
~90% (3).
Alterations in the RET/PTC-RAS-BRAF signaling
pathway are characteristic of PTC (4,5).
Activating BRAF and ret/PTC1 mutations may be an important step in
the development of this disease (6–10).
The etiology of PTC remains poorly understood. Therefore the
identification of diagnostic and prognostic biomarkers is required.
The detection of thyroid nodules is facilitated by high-resolution
sonography. However, the detection of the nodules as either benign
or malignant using fine-needle aspiration biopsy, real-time
sonographic elastography, ultrasound elastography or Micro-Pure
imaging, is problematic (11).
Microarray technology may be an effective tool for
investigating the underlying regulatory network involved in PTC
(12–15). In addition, He et al
(16) have elucidated the role of
microRNAs in the predisposition to, and development of PTC. Despite
this, a greater understanding of PTC is required in order to
improve clinical diagnosis and treatment, for example by
identifying early biomarkers.
In the present study, gene expression profiles of
thyroid tissue from patients with PTC were compared with those from
healthy controls, in order to identify differentially expressed
genes (DEGs). The regulatory associations for the DEGs were
retrieved and potential key genes were identified. Pathway
enrichment and biological process analyses were conducted to
investigate the roles of these genes in the development of PTC.
Materials and methods
Microarray data
Microarray data set, GSE3678, consisting of 14
thyroid tissue samples, was downloaded from Gene Expression Omnibus
(GEO) database (http://www.ncbi.nlm.nih.gov/geo/). This included seven
thyroid tissue samples from patients with PTC and seven from
healthy people. Raw data were obtained from Affymetrix Human Genome
U133 Plus 2.0 Array (Affymetrix, Inc., Santa Clara, CA, USA).
Screening of DEGs
Raw data were processed using software package
GEOquery in R and differential expression analysis was conducted
using limma (17) in R. The
Beyer-Hardwick (BH) method was adopted for multiple corrections
(18) in order to identify DEGs
between the disease and the control groups. A fold change (FC) of
>2 (| logFC |> 2) and P<0.05 were set as the cutoff
values.
Establishment of a gene regulatory
network
Gene regulation analysis was conducted using
TRANSFAC® and TRED (19). A total of 5,558 regulatory
associations were identified in TRANSFAC and TRED and extracted to
a single database. The 171 DEGs were entered into this database in
order to set up a regulatory network, and the corresponding
schematic diagram of 104 DEGs was generated using Cytoscape version
2.8 (20).
Pathway enrichment analysis, biological
process analysis and gene ontology (GO) annotation
Pathway enrichment analysis and biological process
analysis with GO annotation were conducted for genes included in
the regulatory network, using the Database for Annotation,
Visualization and Integrated Discovery (DAVID) online tool
(21) in order to determine their
involvement in the development of PTC.
Results
DEGs
Differential expression analysis identified 171
genes as DEGs.
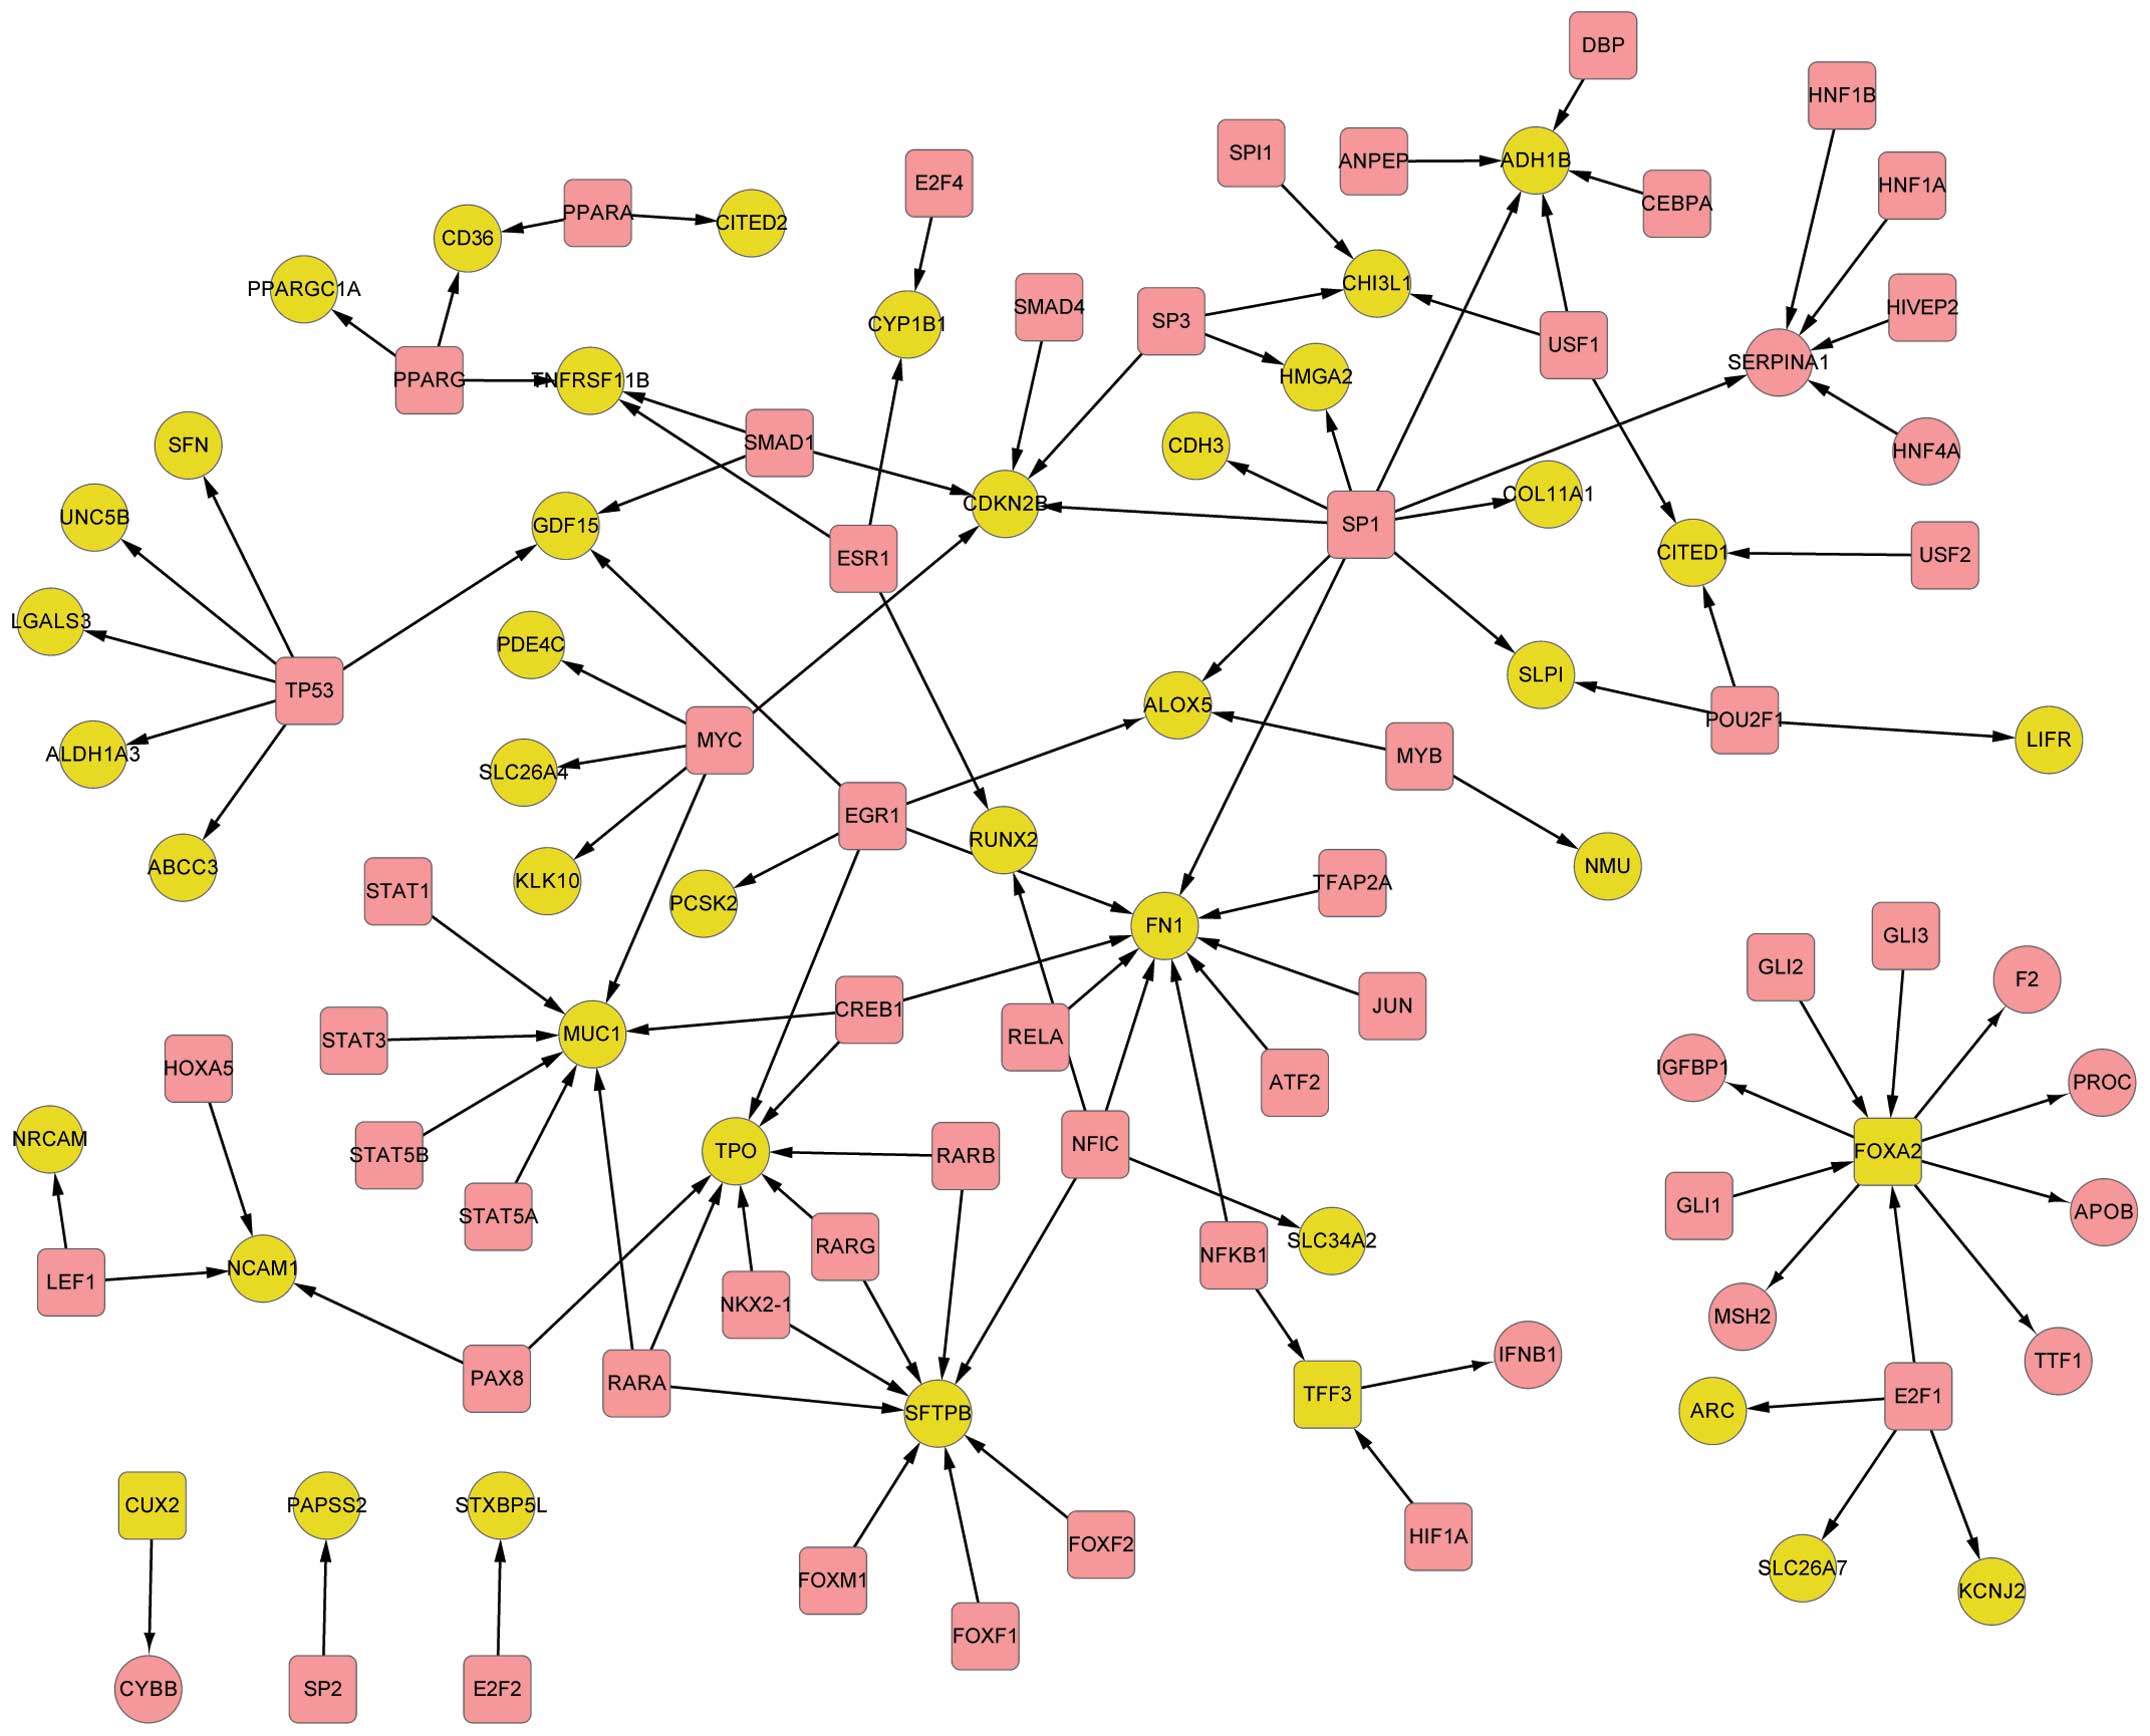
Gene regulatory network
The regulatory associations for the 171 DEGs were
identified from the pre-established database. In total, 111
associations between transcription factors (TFs) and target genes
among 104 DEGs were determined by the comparison between 5,558
regulatory associations and 171 DEGs, using TRANSFAC and TRED
(Fig. 1).
Among the 104 DEGs, three TFs were identified:
Trefoil factor 3 (TFF3), cut-like homeobox 2 (CUX2) and forkhead
box protein A2 (FOXA2). The target genes of these DEGs are listed
in Table I.
 | Table IDifferentially expressed transcription
factors and their target genes. |
Table I
Differentially expressed transcription
factors and their target genes.
| TF gene | Target gene |
|---|
| TFF3 | IFNB1 |
| CUX2 | CYBB |
| FOXA2 | APOB |
| FOXA2 | F2 |
| FOXA2 | IGFBP1 |
| FOXA2 | PROC |
| FOXA2 | TTF1 |
| FOXA2 | MSH2 |
Pathway enrichment analysis, biological
process analysis and GO annotation
Pathway enrichment analysis was conducted for the
104 DEGs. It identified six pathways (Table II); the most significant of these
was in cancer. These results suggest that certain DEGs participate
in pathways involved in PTC.
| Table IIKyoto Encyclopedia of Genes and
Genomes pathway enrichment analysis results for the 104 DEGs. |
Table II
Kyoto Encyclopedia of Genes and
Genomes pathway enrichment analysis results for the 104 DEGs.
| Term ID | Pathway name | Count | P-value | FDR |
|---|
| hsa05200 | Pathways in
cancer | 26 | 4.72E-15 | 5.04E-12 |
| hsa05221 | Acute myeloid
leukemia | 10 | 1.62E-08 | 1.71E-05 |
| hsa05220 | Chronic myeloid
leukemia | 9 | 2.12E-06 | 0.002235 |
| hsa05222 | Small cell lung
cancer | 9 | 5.04E-06 | 0.005318 |
| hsa05212 | Pancreatic
cancer | 8 | 1.80E-05 | 0.019025 |
| hsa05216 | Thyroid cancer | 5 | 3.34E-04 | 0.351572 |
Biological process analysis was also conducted for
the 104 DEGs. Certain DEGs were associated with the positive
regulation of gene expression, gene transcription and metabolic
processes (Table III).
| Table IIIGO biological process analysis
results for the 104 DEGs. |
Table III
GO biological process analysis
results for the 104 DEGs.
| GO Term | Description | Count | P-value | FDR |
|---|
| GO:0010628 | Positive regulation
of gene expression | 43 | 1.43E-31 | 2.40E-28 |
| GO:0045944 | Positive regulation
of transcription from RNA polymerase II promoter | 37 | 2.78E-31 | 4.67E-28 |
| GO:0045893 | Positive regulation
of transcription, DNA-dependent | 40 | 3.57E-31 | 6.00E-28 |
| GO:0051254 | Positive regulation
of RNA metabolic process | 40 | 4.92E-31 | 8.27E-28 |
| GO:0045941 | Positive regulation
of transcription | 42 | 7.54E-31 | 1.27E-27 |
| GO:0010557 | Positive regulation
of macromolecule biosynthetic process | 43 | 1.77E-29 | 2.98E-26 |
| GO:0045935 | Positive regulation
of nucleobase, nucleoside, nucleotide and nucleic acid metabolic
process | 42 | 4.21E-29 | 7.07E-26 |
| GO:0051173 | Positive regulation
of nitrogen compound metabolic process | 42 | 1.46E-28 | 2.46E-25 |
| GO:0009891 | Positive regulation
of biosynthetic process | 43 | 2.06E-28 | 3.46E-25 |
| GO:0006357 | Regulation of
transcription from RNA polymerase II promoter | 43 | 1.25E-27 | 2.10E-24 |
Discussion
In the present study, microarray data for thyroid
tissue samples from PTC patients and from healthy controls were
compared. A total of 171 DEGs were identified in these samples.
Gene regulation analysis revealed 111 associations among 104 of
these DEGs. Three differentially expressed TFs were identified:
TFF3, CUX2 and FOXA2. Pathway enrichment and biological process
analyses were conducted for the 104 DEGs in order to investigate
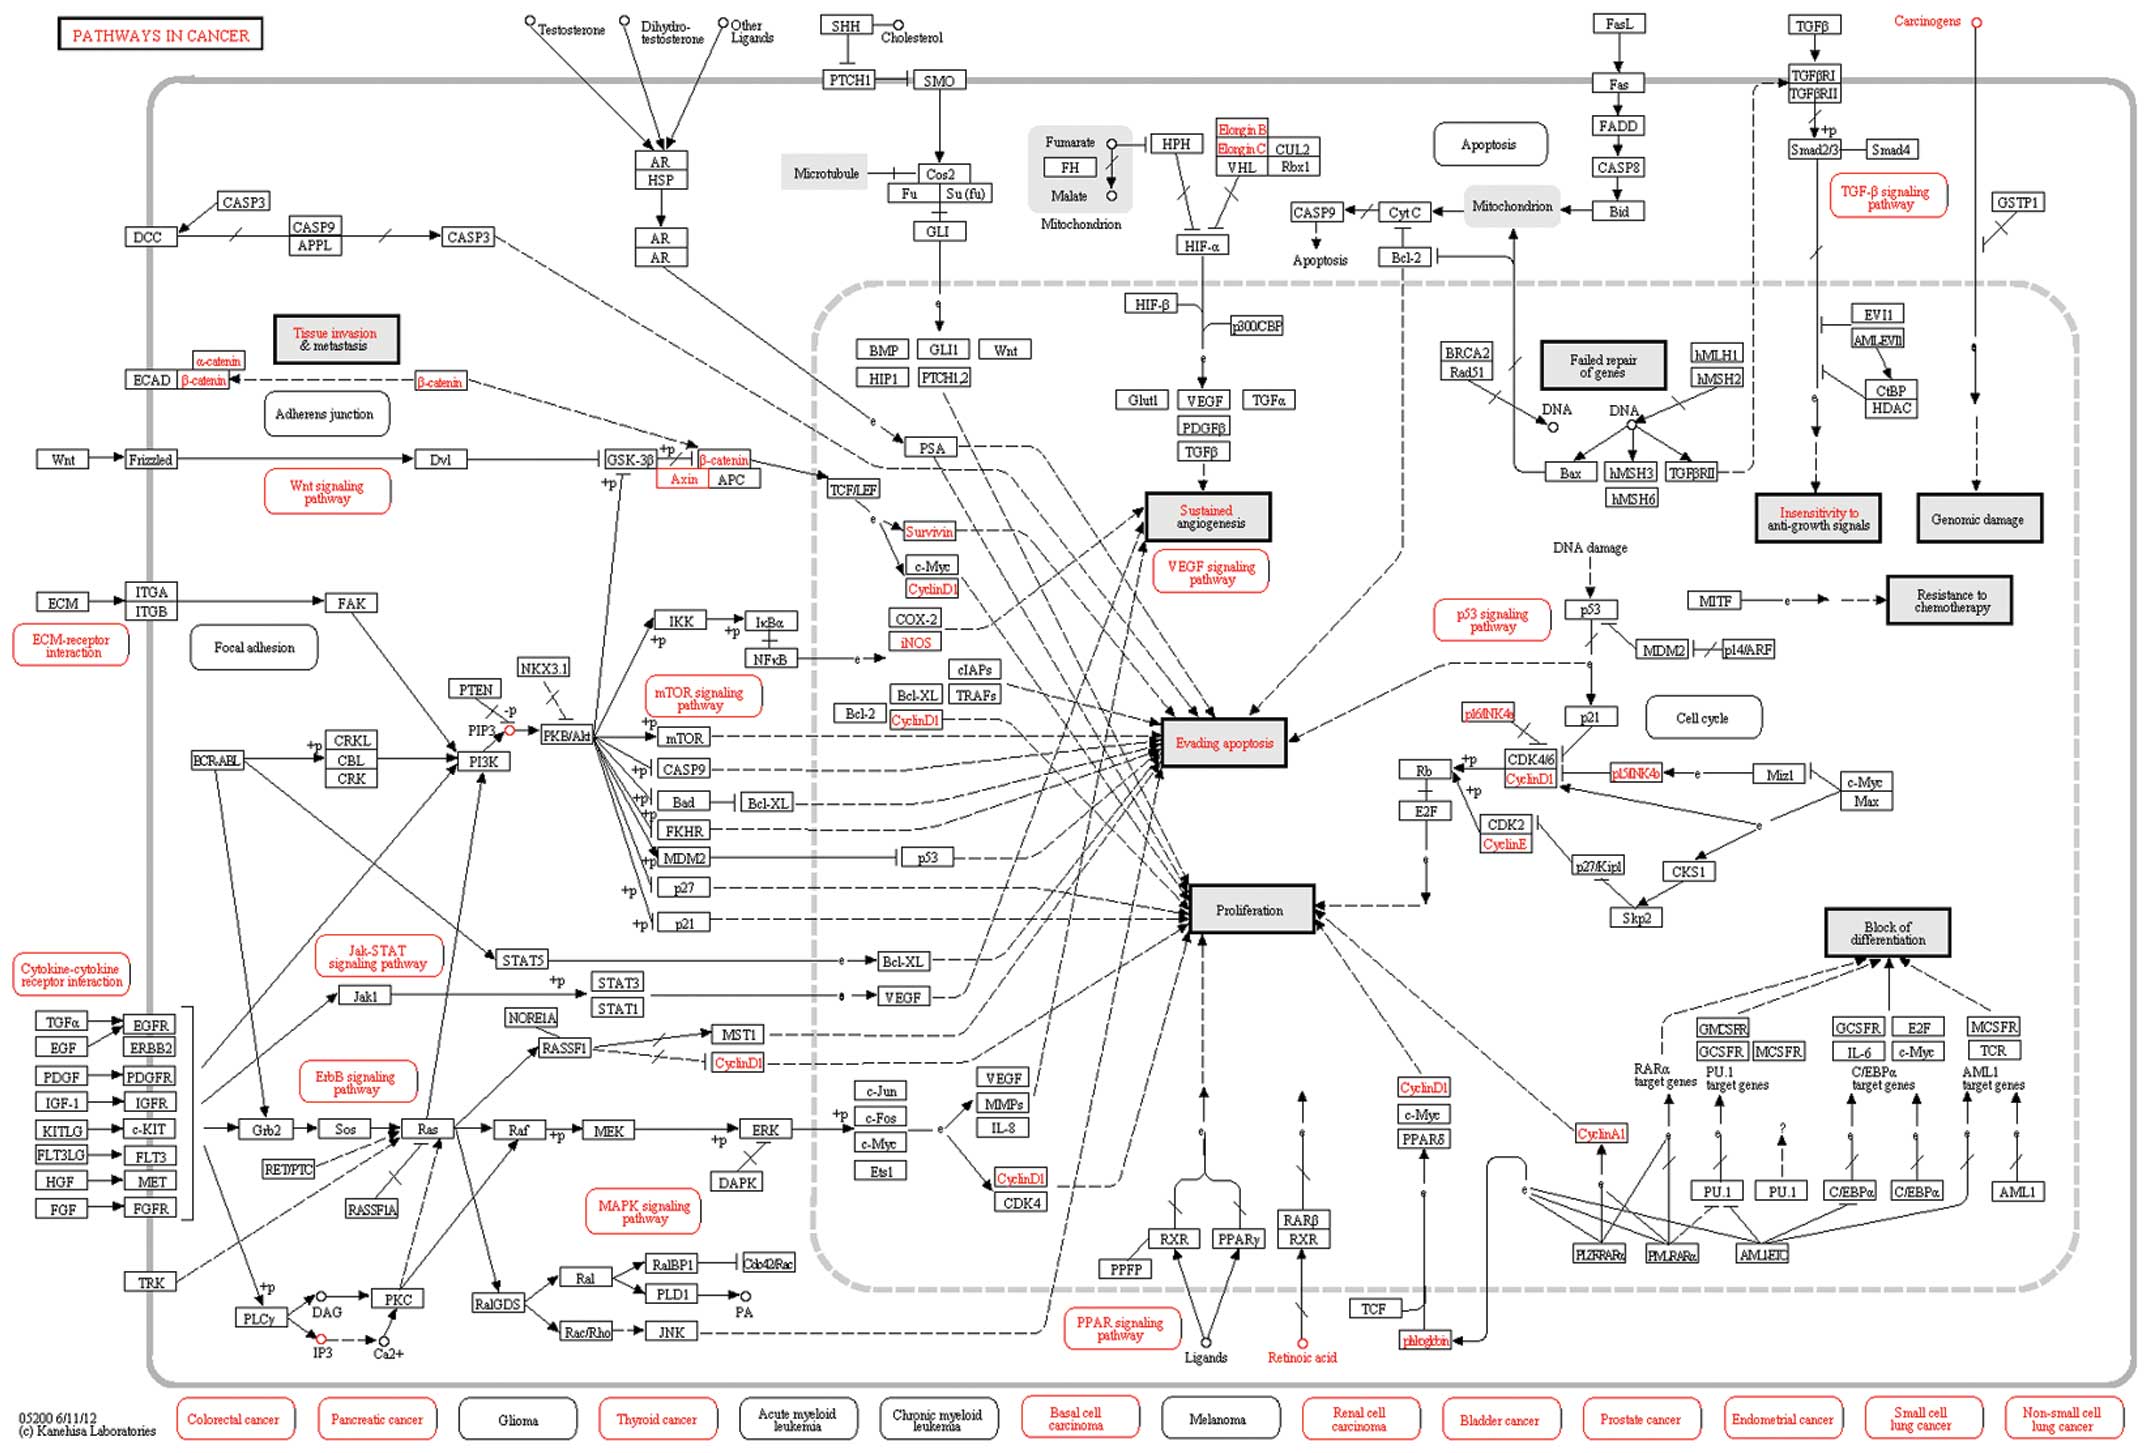
their involvement in the development of PTC. Pathway enrichment
analysis indicated that these genes are associated with colorectal,
pancreatic, thyroid and lung cancers, and leukemia (Fig. 2). Biological process analysis
suggested that these genes exhibit corresponding functions through
positive regulation of gene expression, transcription and metabolic
processes.
Underexpression of TFF3 in PTC has been confirmed by
previous studies (22,23) and it is proposed as a biomarker at
the RNA level (24,25). Its target gene is interferon β 1
(Table I), which exhibits
anticancer activity (26). CUX2
(Table I) contains three CUT
domains, which are three internal CUT repeats, and a homeodomain,
which are DNA-binding motifs. CUX2 is important in the negative
regulation of transcription and has been linked to tumor
progression (27). FOXA2 is a
member of the forkhead box-O family (Table I), which is involved in the
regulation of a series of cellular events, such as differentiation,
DNA repair, cell cycle arrest and apoptosis (28,29).
It is a potential oncogene in anaplastic thyroid carcinoma
(30). Kim et al (31) confirmed the decreased expression of
FOXA2 in PTC cells using reverse transcription-quantitative
polymerase chain reaction. Akagi et al (32) also found a reduced expression of
FOXA2 in PTC cells compared with that in healthy thyroid cells. The
enforced expression of a range of genes, including FOXA2, inhibits
PTC cell growth (32).
Furthermore, Akagi et al (32) reported that the CpG island in the
promoter region of FOXA2 was aberrantly methylated and that
treatment with 5-aza-2-deoxycytidine induced the expression of
FOXA2 in PTC cells. Insulin-like growth factor binding protein 1
(IGFBP1) is a target gene of FOXA2 (Table I). Yashiro et al (33) demonstrated that IGFBP1 activity is
significantly higher in cells from patients with PTC, therefore it
may be involved in PTC cell growth regulation.
Pathway enrichment analysis indicated that the top
pathway that the DEGs were found to be associated with was pathways
in cancer, involving 26 DEGs. Fibronectin 1 is a glycoprotein
present in a dimeric or multimeric form, which is present at the
cell surface and in the extracellular matrix. It is involved in
cell adhesion and migration, and is therefore a potential drug
target with which to treat cancer, by blocking the processes
involved in metastasis (34). Its
overexpression in PTC at the mRNA level has been demonstrated by
Takano et al (35).
Cyclin-dependent kinase inhibitor 2B forms a complex with
cyclin-dependent kinase 4 or cyclin-dependent kinase 6, and
functions as a cell growth regulator (36). Arnaldi et al (37) revealed that it is underexpressed in
malignant thyroid tissue. Peroxisome proliferator-activated
receptor γ 1 (PPARG1) fuses with paired box 8 and has been
confirmed as an oncogene in human thyroid carcinoma (38). In the present study, peroxisome
proliferator-activated receptor γ coactivator 1-α, a target gene of
PPARG1, was found to be differentially expressed, which was in
accordance with the findings of Antico Arciuch et al
(39).
Biological process analysis suggested that the DEGs
identified in the present study were linked to gene expression,
gene transcription, and the positive regulation of RNA and nitrogen
compound metabolic processes (Table
III). Therefore, a variety of regulatory mechanisms were
involved in the development of PTC. Cbp/p300-interacting
transactivator, with Glu/Asp-rich carboxy-terminal domain 1
(CITED1) and CITED2 were transcriptional coactivators and were
identified as DEGs. Prasad et al (14) indicated that CITED1 was upregulated
in PTC cells compared with cells from healthy thyroids. Therefore
it may serve as a diagnostic marker for PTC.
In conclusion, 171 DEGs in PTC were identified and
the molecular mechanisms of 104 DEGs were investigated following
the creation of a regulatory network. Three TFs associated with PTC
were identified. Pathway enrichment and biological process analyses
of the genes in the network confirmed their involvement in the
development of PTC. The results of the present study were
beneficial for future research into the genes and regulatory
mechanisms associated with the pathogenesis of PTC.
Acknowledgements
This study was supported by a grant from Capital
Clinical Feature Application Research (Z141107002514102).
References
|
1
|
Kitamura Y, Minobe K, Nakata T, et al:
Ret/PTC3 is the most frequent form of gene rearrangement in
papillary thyroid carcinomas in Japan. J Hum Genet. 44:96–102.
1999. View Article : Google Scholar : PubMed/NCBI
|
|
2
|
Jemal A, Tiwari RC, Murray T, et al:
Cancer statistics, 2004. CA Cancer J Clin. 54:8–29. 2004.
View Article : Google Scholar : PubMed/NCBI
|
|
3
|
Lang BH, Chow SM, Lo CY, et al: Staging
systems for papillary thyroid carcinoma: a study of 2 tertiary
referral centers. Ann Surg. 246:114–121. 2007. View Article : Google Scholar : PubMed/NCBI
|
|
4
|
Kimura ET, Nikiforova MN, Zhu Z, Knauf JA,
Nikiforov YE and Fagin JA: High prevalence of BRAF mutations in
thyroid cancer: genetic evidence for constitutive activation of the
RET/PTC-RAS-BRAF signaling pathway in papillary thyroid carcinoma.
Cancer Res. 63:1454–1457. 2003.PubMed/NCBI
|
|
5
|
Melillo RM, Castellone MD, Guarino V, et
al: The RET/PTC-RAS-BRAF linear signaling cascade mediates the
motile and mitogenic phenotype of thyroid cancer cells. J Clin
Invest. 115:1068–1081. 2005. View Article : Google Scholar : PubMed/NCBI
|
|
6
|
Cohen Y, Xing M, Mambo E, et al: BRAF
mutation in papillary thyroid carcinoma. J Natl Cancer Inst.
95:625–627. 2003. View Article : Google Scholar : PubMed/NCBI
|
|
7
|
Fusco A, Viglietto G and Santoro M: A new
mechanism of BRAF activation in human thyroid papillary carcinomas.
J Clin Invest. 115:20–23. 2005. View Article : Google Scholar : PubMed/NCBI
|
|
8
|
Nikiforova MN, Kimura ET, Gandhi M, et al:
BRAF mutations in thyroid tumors are restricted to papillary
carcinomas and anaplastic or poorly differentiated carcinomas
arising from papillary carcinomas. J Clin Endocrinol Metab.
88:5399–5404. 2003. View Article : Google Scholar : PubMed/NCBI
|
|
9
|
Jhiang SM, Sagartz JE, Tong Q, et al:
Targeted expression of the ret/PTC1 oncogene induces papillary
thyroid carcinomas. Endocrinology. 137:375–378. 1996.PubMed/NCBI
|
|
10
|
Tallini G, Santoro M, Helie M, et al:
RET/PTC oncogene activation defines a subset of papillary thyroid
carcinomas lacking evidence of progression to poorly differentiated
or undifferentiated tumor phenotypes. Clin Cancer Res. 4:287–294.
1998.PubMed/NCBI
|
|
11
|
Ciledag N, Arda K, Aribas BK, Aktas E and
Köse SK: The utility of ultrasound elastography and MicroPure
imaging in the differentiation of benign and malignant thyroid
nodules. AJR Am J Roentgenol. 198:W244–W249. 2012. View Article : Google Scholar : PubMed/NCBI
|
|
12
|
Giordano TJ, Kuick R, Thomas DG, et al:
Molecular classification of papillary thyroid carcinoma: distinct
BRAF, RAS, and RET/PTC mutation-specific gene expression profiles
discovered by DNA microarray analysis. Oncogene. 24:6646–6656.
2005. View Article : Google Scholar : PubMed/NCBI
|
|
13
|
Jarzab B, Wiench M, Fujarewicz K, et al:
Gene expression profile of papillary thyroid cancer: sources of
variability and diagnostic implications. Cancer Res. 65:1587–1597.
2005. View Article : Google Scholar : PubMed/NCBI
|
|
14
|
Prasad ML, Pellegata NS, Kloos RT,
Barbacioru C, Huang Y and de la Chapelle A: CITED1 protein
expression suggests papillary thyroid carcinoma in high throughput
tissue microarray-based study. Thyroid. 14:169–175. 2004.
View Article : Google Scholar : PubMed/NCBI
|
|
15
|
Vasko V, Espinosa AV, Scouten W, et al:
Gene expression and functional evidence of
epithelial-to-mesenchymal transition in papillary thyroid carcinoma
invasion. Proc Natl Acad Sci USA. 104:2803–2808. 2007. View Article : Google Scholar : PubMed/NCBI
|
|
16
|
He H, Jazdzewski K, Li W, et al: The role
of microRNA genes in papillary thyroid carcinoma. Proc Natl Acad
Sci USA. 102:19075–19080. 2005. View Article : Google Scholar : PubMed/NCBI
|
|
17
|
Smyth GK: Limma: linear models for
microarray data. Bioinformatics and Computational Biology Solutions
using R and Bioconductor. Gentleman R, et al: Springer; New York:
pp. 397–420. 2005, View Article : Google Scholar
|
|
18
|
Benjamini Y and Hochberg Y: Controlling
the false discovery rate: a practical and powerful approach to
multiple testing. J R Stat Soc Series B Stat Methodol. 57:289–300.
1995.
|
|
19
|
Wingender E, Kel AE, Kel OV, et al:
TRANSFAC, TRRD and COMPEL: towards a federated database system on
transcriptional regulation. Nucleic Acids Res. 25:265–268. 1997.
View Article : Google Scholar : PubMed/NCBI
|
|
20
|
Smoot ME, Ono K, Ruscheinski J, Wang PL
and Ideker T: Cytoscape 2.8: new features for data integration and
network visualization. Bioinformatics. 27:431–432. 2011. View Article : Google Scholar :
|
|
21
|
Huang da W, Sherman BT and Lempicki RA:
Systematic and integrative analysis of large gene lists using DAVID
bioinformatics resources. Nat Protoc. 4:44–57. 2009. View Article : Google Scholar : PubMed/NCBI
|
|
22
|
Huang Y, Prasad M, Lemon WJ, et al: Gene
expression in papillary thyroid carcinoma reveals highly consistent
profiles. Proc Natl Acad Sci USA. 98:15044–15049. 2001. View Article : Google Scholar : PubMed/NCBI
|
|
23
|
Hawthorn L, Stein L, Varma R, Wiseman S,
Loree T and Tan D: TIMP1 and SERPIN-A overexpression and TFF3 and
CRABP1 underexpression as biomarkers for papillary thyroid
carcinoma. Head Neck. 26:1069–1083. 2004. View Article : Google Scholar : PubMed/NCBI
|
|
24
|
Finley DJ, Arora N, Zhu B, Gallagher L and
Fahey TJ III: Molecular profiling distinguishes papillary carcinoma
from benign thyroid nodules. J Clin Endocrinol Metab. 89:3214–3223.
2004. View Article : Google Scholar : PubMed/NCBI
|
|
25
|
Takano T, Miyauchi A, Yoshida H, Kuma K
and Amino N: High-throughput differential screening of mRNAs by
serial analysis of gene expression: decreased expression of trefoil
factor 3 mRNA in thyroid follicular carcinomas. Br J Cancer.
90:1600–1605. 2004. View Article : Google Scholar : PubMed/NCBI
|
|
26
|
Qin XQ, Beckham C, Brown JL, et al: Human
and mouse IFN-beta gene therapy exhibits different anti-tumor
mechanisms in mouse models. Mol Ther. 4:356–364. 2001. View Article : Google Scholar : PubMed/NCBI
|
|
27
|
Mccarthy N: Tumorigenesis: Cut here for
differentiation. Nat Rev Cancer. 12:3202012. View Article : Google Scholar : PubMed/NCBI
|
|
28
|
Arden KC: Multiple roles of FOXO
transcription factors in mammalian cells point to multiple roles in
cancer. Exp Gerontol. 41:709–717. 2006. View Article : Google Scholar : PubMed/NCBI
|
|
29
|
Reagan-Shaw S and Ahmad N: The role of
Forkhead-box Class O (FoxO) transcription factors in cancer: a
target for the management of cancer. Toxicol Appl Pharmacol.
224:360–368. 2007. View Article : Google Scholar : PubMed/NCBI
|
|
30
|
Nucera C, Eeckhoute J, Finn S, et al:
FOXA1 is a potential oncogene in anaplastic thyroid carcinoma. Clin
Cancer Res. 15:3680–3689. 2009. View Article : Google Scholar : PubMed/NCBI
|
|
31
|
Kim HS, Kim Do H, Kim JY, et al:
Microarray analysis of papillary thyroid cancers in Korean. Korean
J Intern Med. 25:399–407. 2010. View Article : Google Scholar : PubMed/NCBI
|
|
32
|
Akagi T, Luong QT, Gui D, et al: Induction
of sodium iodide symporter gene and molecular characterisation of
HNF3 beta/FoxA2, TTF-1 and C/EBP beta in thyroid carcinoma cells.
Br J Cancer. 99:781–788. 2008. View Article : Google Scholar : PubMed/NCBI
|
|
33
|
Yashiro T, Arai M, Shizume K, et al:
Increased activity of insulin-like growth factor-binding protein in
human thyroid papillary cancer tissue. Jpn J Cancer Res. 85:46–52.
1994. View Article : Google Scholar : PubMed/NCBI
|
|
34
|
Soikkeli J, Podlasz P, Yin M, et al:
Metastatic outgrowth encompasses COL-I, FN1, and POSTN upregulation
and assembly to fibrillar networks regulating cell adhesion,
migration, and growth. Am J Pathol. 177:387–403. 2010. View Article : Google Scholar : PubMed/NCBI
|
|
35
|
Takano T, Matsuzuka F, Sumizaki H, Kuma K
and Amino N: Rapid detection of specific messenger RNAs in thyroid
carcinomas by reverse transcription-PCR with degenerate primers:
specific expression of oncofetal fibronectin messenger RNA in
papillary carcinoma. Cancer Res. 57:3792–3797. 1997.PubMed/NCBI
|
|
36
|
Soto JL, Cabrera CM, Serrano S and
López-Nevot MA: Mutation analysis of genes that control the G1/S
cell cycle in melanoma: TP53, CDKN1A, CDKN2A, and CDKN2B. BMC
Cancer. 5:362005. View Article : Google Scholar : PubMed/NCBI
|
|
37
|
Arnaldi LA, Borra RC, Maciel RM and
Cerutti JM: Gene expression profiles reveal that DCN, DIO1, and
DIO2 are underexpressed in benign and malignant thyroid tumors.
Thyroid. 15:210–221. 2005. View Article : Google Scholar : PubMed/NCBI
|
|
38
|
Kroll TG, Sarraf P, Pecciarini L, et al:
PAX8-PPARgamma1 fusion oncogene in human thyroid carcinoma
[corrected]. Science. 289:1357–1360. 2000. View Article : Google Scholar : PubMed/NCBI
|
|
39
|
Antico Arciuch VG, Russo MA, Dima M, et
al: Thyrocyte-specific inactivation of p53 and Pten results in
anaplastic thyroid carcinomas faithfully recapitulating human
tumors. Oncotarget. 2:1109–1126. 2011.PubMed/NCBI
|