Introduction
Acute myelogenous leukemia (AML) is a heterogeneous
disease caused by the uncontrolled proliferation of myeloid
precursor cells with abnormal maturation.
Genes encoding transcription factors (TF), involved
in normal hematopoiesis, are among the most common targets of
genetic aberrations in AML (1).
This involves chromosomal translocations, including the most
prevalent t (8;21) (RUNX1-ETO), inv (16) (CBF-MYH11) and 11q23 MLL
rearrangements and point mutations in key regulators of
hematopoietic cell differentiation, termed class II mutations.
Among these point mutations, the most frequent are changes in
CEBPA, NPM1, RUNX1 and MLL (2). Recurrent chromosomal translocations,
together with CEBPA and NPM1 mutations, constitute
the basis of the current World Health Organization (WHO)
classification and are included in the guidance for AML patients
risk stratification (3).
In addition to genetic alterations, epigenetic
aberrations are also involved in leukemogenesis. DNA methylation is
one of the most widely described epigenetic elements involved in
regulating gene expression. Aberrant DNA methylation in the
regulatory regions of the genes encoding hematopoietic TFs has been
observed in AML patients, including early-acting TFs, such as HOX
cluster genes (4).
The present study focused on the role of DNA
methylation and the expression levels of three selected
early-acting hematopoietic TFs genes: HOXA4, HOXA5
and MEIS1 in AML.
HOXA genes are clustered at the 7p15.2
chromosomal region and these encode TFs that are crucial for
embryogenesis and tissues differentiation (5). HOXA proteins are also involved in the
early stages of hematopoiesis and lineage specification (6).
HOXA4 controls hematopoietic stem cell (HSC)
self-renewal and the expansion of either myeloid- and
lymphoid-primed progenitors (7).
In addition to its paralogs, HOXB4 and HOXD4, HOXA4 is also
involved in the inhibition of cell differentiation (8).
Another HOXA cluster gene, HOXA5, governs the
specification of myeloid and erythroid lineages. Its constitutive
expression inhibits erythropoiesis and promotes myelopoiesis
(9,10). MEIS1 is a transcription
activator-like effector protein, which functions as a HOX protein
cofactor. This protein exerts its function by enhancing HOXA4 and
HOXA5 DNA binding specificity (11).
Aberrations in the HOXA and MEIS1
genes have been identified in human neoplasms, including AML
(5). The HOXA4,
HOXA5 and MEIS1 genes are frequently hypermethylated
in different types of leukemia, including adult AML (4,12).
Previous studies have demonstrated the prognostic value of
HOXA4 and HOXA5 methylation in leukemia patients
(4,13).
Materials and methods
Patients
Bone marrow (BM) samples from 78 AML patients were
used and 12 BM samples were obtained from healthy donors as
controls. The patients were classified based on their
French-American-British (FAB) subtypes and their cytogenetic
statuses. The BM mononuclear cells (BMMC) were isolated from the BM
samples using Ficoll density gradient centrifugation at 400 × g for
30 min at room temperature. The patient characteristics are shown
in Table I. The present study was
approved by the committee of M. Sklodowska-Curie Memorial Cancer
Center and Institute of Oncology (Warsaw, Poland).
 | Table ICharacteristics of patients with
acute myeloid leukemia in the present study. |
Table I
Characteristics of patients with
acute myeloid leukemia in the present study.
| Patient
characteristic | Number of
patientsb |
|---|
| Gender |
| Male | 38/78 |
| Female | 40/78 |
| Age (years) |
| <60 | 64/77 |
| ≥60 | 13/77 |
| FAB
classification |
| M0 | 6/76 |
| M1 | 16/76 |
| M2 | 16/76 |
| M3 | 10/76 |
| M4 | 15/76 |
| M5 | 13/76 |
| Cytogenetics |
| Inv (16) | 7/76 |
| T (8;21) | 9/76 |
| T (15;17) | 8/76 |
| 3q/11q
abnormalities | 6/76 |
| Complex
karyotype | 4/76 |
| Normal
karyotype | 31/76 |
| Other | 11/76 |
| Cytogenetic
risk |
| Favorable | 24/76 |
| Intermediate | 33/76 |
| Adverse | 19/76 |
| CEBPA
mutationsa |
| Negative | 25/29 |
| Positive | 4/29 |
| NPM1
mutationsa |
| Negative | 12/29 |
| Positive | 17/29 |
|
FLT3-Itd |
| Negative | 57/76 |
| Positive | 19/76 |
| MLL-Ptd |
| Negative | 56/61 |
| Positive | 5/61 |
| WBC count at
diagnosis (103/Ml) |
| Median | 23,15 |
| Range | 0.3–331.1 |
| Blast percentage in
bone marrow |
| Median | 75 |
| Range | 6.3–98 |
Cell sorting
The CD34+ progenitor cells were purified
from normal BMMC samples using a Dynabeads® CD34
Positive Isolation kit (Invitrogen Life Technologies, Carlsbad, CA,
USA). The CD34+ fraction was subsequently labeled with
fluorescein isothiocyanate (FITC)-conjugated anti-CD34 and
APC-conjugated anti-CD38 antibodies. The depleted fraction (CD34−)
was labeled with FITC-conjugated anti-CD15 antibodies (all
antibodies were purchased from BD Biosciences, Franklin Lakes, NJ,
USA). The CD34+CD38−,
CD34+CD38+ and CD15+ BM cell
populations were sorted using a BD FACSAria (BD Biosciences). The
results are presented in Fig.
1.
Quantitative DNA methylation
analysis
The DNA was extracted from the BMMC using a QIAamp
DNA Mini kit (Qiagen, Hilden, Germany) and subsequently subjected
to bisulfite conversion using an EpiTect kit (Qiagen). The cells
isolated by fluorescence-activated cell-sorting were subjected to
direct bisulfite conversion using an EpiTect Lyse All kit (Qiagen).
The levels of DNA methylation were determined by quantitative
methylation-specific PCR (qMSP). Each region of interest was
amplified with methylation-specific primer pairs using reverse
transcription (RT) qPCR in parallel to a reference ACTB
region containing no CpG dinucleotides. The RT-qPCR reaction was
performed in 7.5 μl (1.5 μl bisulfite-converted DNA template, 2X
SensiMix II Probe mastermix (Bioline, London, UK), 2.25 pmol of
each primer (4.5 pmol of each primer for ACTB) and 1.88 pmol
of the probe. The RT-qPCR amplification was performed using an
Applied Biosystems 7900 HT Sequence Detection system (Applied
Biosystems, Foster City, CA, USA) in 384-well plates. The sequences
of the primers and probes used are shown in Table II.
| Table IISequences of polymerase chain
reaction primers and probes used for quantitate
methylation-specific analysis. |
Table II
Sequences of polymerase chain
reaction primers and probes used for quantitate
methylation-specific analysis.
| Gene | Forward | Reverse | Probe |
|---|
| HOXA4 |
5′-GTAGTATTTATT | 5′-CCGTACCCC |
5′Fam-CCCCACCAATAA |
|
ACGTATTCGCGC-3′ | ACGTACAACG-3′ |
ACGCACCGCG-Tamra-3′ |
| HOXA5 |
5′-AATGGGTTGTAA | 5′-CGTTCAACC |
5′Fam-AAAACAAAACTC |
|
TTTTAATTCGATTTC-3′ | GAACTCGAACG-3′ |
ATCGCCCAACTTCCG-Tamra-3′ |
| MEIS1 | 5′-TGCGGTTAG |
5′-CATAACAAATCG |
5′-CATTAAACTACAACAAAT |
|
AGTTCGTTTCGC-3′ |
CGTCTTACACAA-3′ |
AAACTCCTCGAC-Tamra-3′ |
| ACTB |
5′-TGGTGATGGAGG |
5′-AACCAATAAAAC |
5′Fam-ACCACCACCCAACAC |
|
AGGTTTAGTAAGT-3′ |
CTACTCCTCCCTTAA-3′ |
ACAATAACAAACACA-Tamra-3′ |
The standard curves of known DNA template
concentrations were used to quantify the resulting PCR product.
These were prepared using serial dilutions of plasmid DNA
containing PCR product inserts of each amplified region. The
plasmid constructs were obtained by amplification of standard
methylated genomic DNA (Qiagen), with the use of each primer pair
and cloning of the PCR products using a Strataclone kit (Agilent,
Santa Clara, CA, USA). The plasmid DNA was amplified in bacteria,
purified using a Plasmid Mini kit (A&A Biotechnology, Gdynia,
Poland) and quantified using Quanti-iT Picogreen (Invitrogen Life
Technologies, Carlsbad, CA, USA).
The levels of DNA methylation, determined by the
percentage of the methylated reference (PMR), was calculated by
dividing the ‘gene of interest’:ACTB ratio of a patient
sample by the ‘gene of interest’:ACTB ratio of the
methylated DNA in the control sample (Qiagen) and multiplying by
100.
An EpiTect Control DNA and Control DNA set (Qiagen)
containing human methylated and unmethylated DNA served as positive
and negative control samples, respectively.
Expression analysis
RNA was isolated from the BMMC using an RNeasyMini
kit (Qiagen) and quantified using a NanoDrop 2000 Spectrophotometer
(ThermoScientific, Waltham, MA, USA). Each RNA sample (500 ng) was
subjected to RT using SuperScript II Reverse Transcriptase
(Invitrogen Life Technologies). The RNA from the cells, sorted by
flow cytometry, was extracted using RNAqueous-Micro (Ambion Life
Technologies, Carlsbad, CA, USA) and subjected to RT, as
previously.
The expression levels of HOXA4, HOXA5
and MEIS1 were assessed using gene expression assays:
Hs00269972_s1, Hs00270931_s1 and Hs00357657_m1 (Applied
Biosystems). The ubiquitin gene assay (Hs00824723_m1) (Applied
Biosystems) was used as a reference. RT-qPCR was performed using
the following cycling conditions: 95°C for 10 min followed by 45
cycles of 95°C for 15 sec and 60°C for 60 sec. Gene expression was
calculated using the 2−ΔCt method.
Statistical analysis
The gene expression levels and DNA methylation
levels (PMR) were analyzed using a two-sided Mann-Whitney U-test,
Kruskal-Walis test and Spearman’s correlation. For descriptive
statistics, the quantitative methylation results were also
categorized into binary data. The samples were classified as
methylation-positive/methylation-high or methylation-low based on
the assessment of DNA methylation level in the normal BM samples.
The mean value ± two standard deviations of the BM results was used
as a threshold for each gene independently. A two-sided exact
Fisher’s test was used for the comparison of proportions. P<0.05
was considered to indicate a statistically significant difference.
The statistical evaluation and visualization was performed using
GraphPad Prism software 5.03 (GraphPad, La Jolla, CA, USA).
Results
Promoter DNA methylation and gene
expression levels in AML patients and controls
The levels of DNA methylation were assessed using
qMSP in 78 AML patient samples and 12 normal BM samples. The
promoter regions of HOXA4 and HOXA5 revealed variable
degrees of methylation in the patient-derived samples and the
normal BM cells. AML samples with a methylation level exceeding the
threshold value, described previously, were classified as
methylation-high. According to these criteria, high levels of
HOXA4 and HOXA5 promoter DNA methylation were
observed in 38.1 (30/76) and 28.9% (21/76), respectively, in the
AML patients.
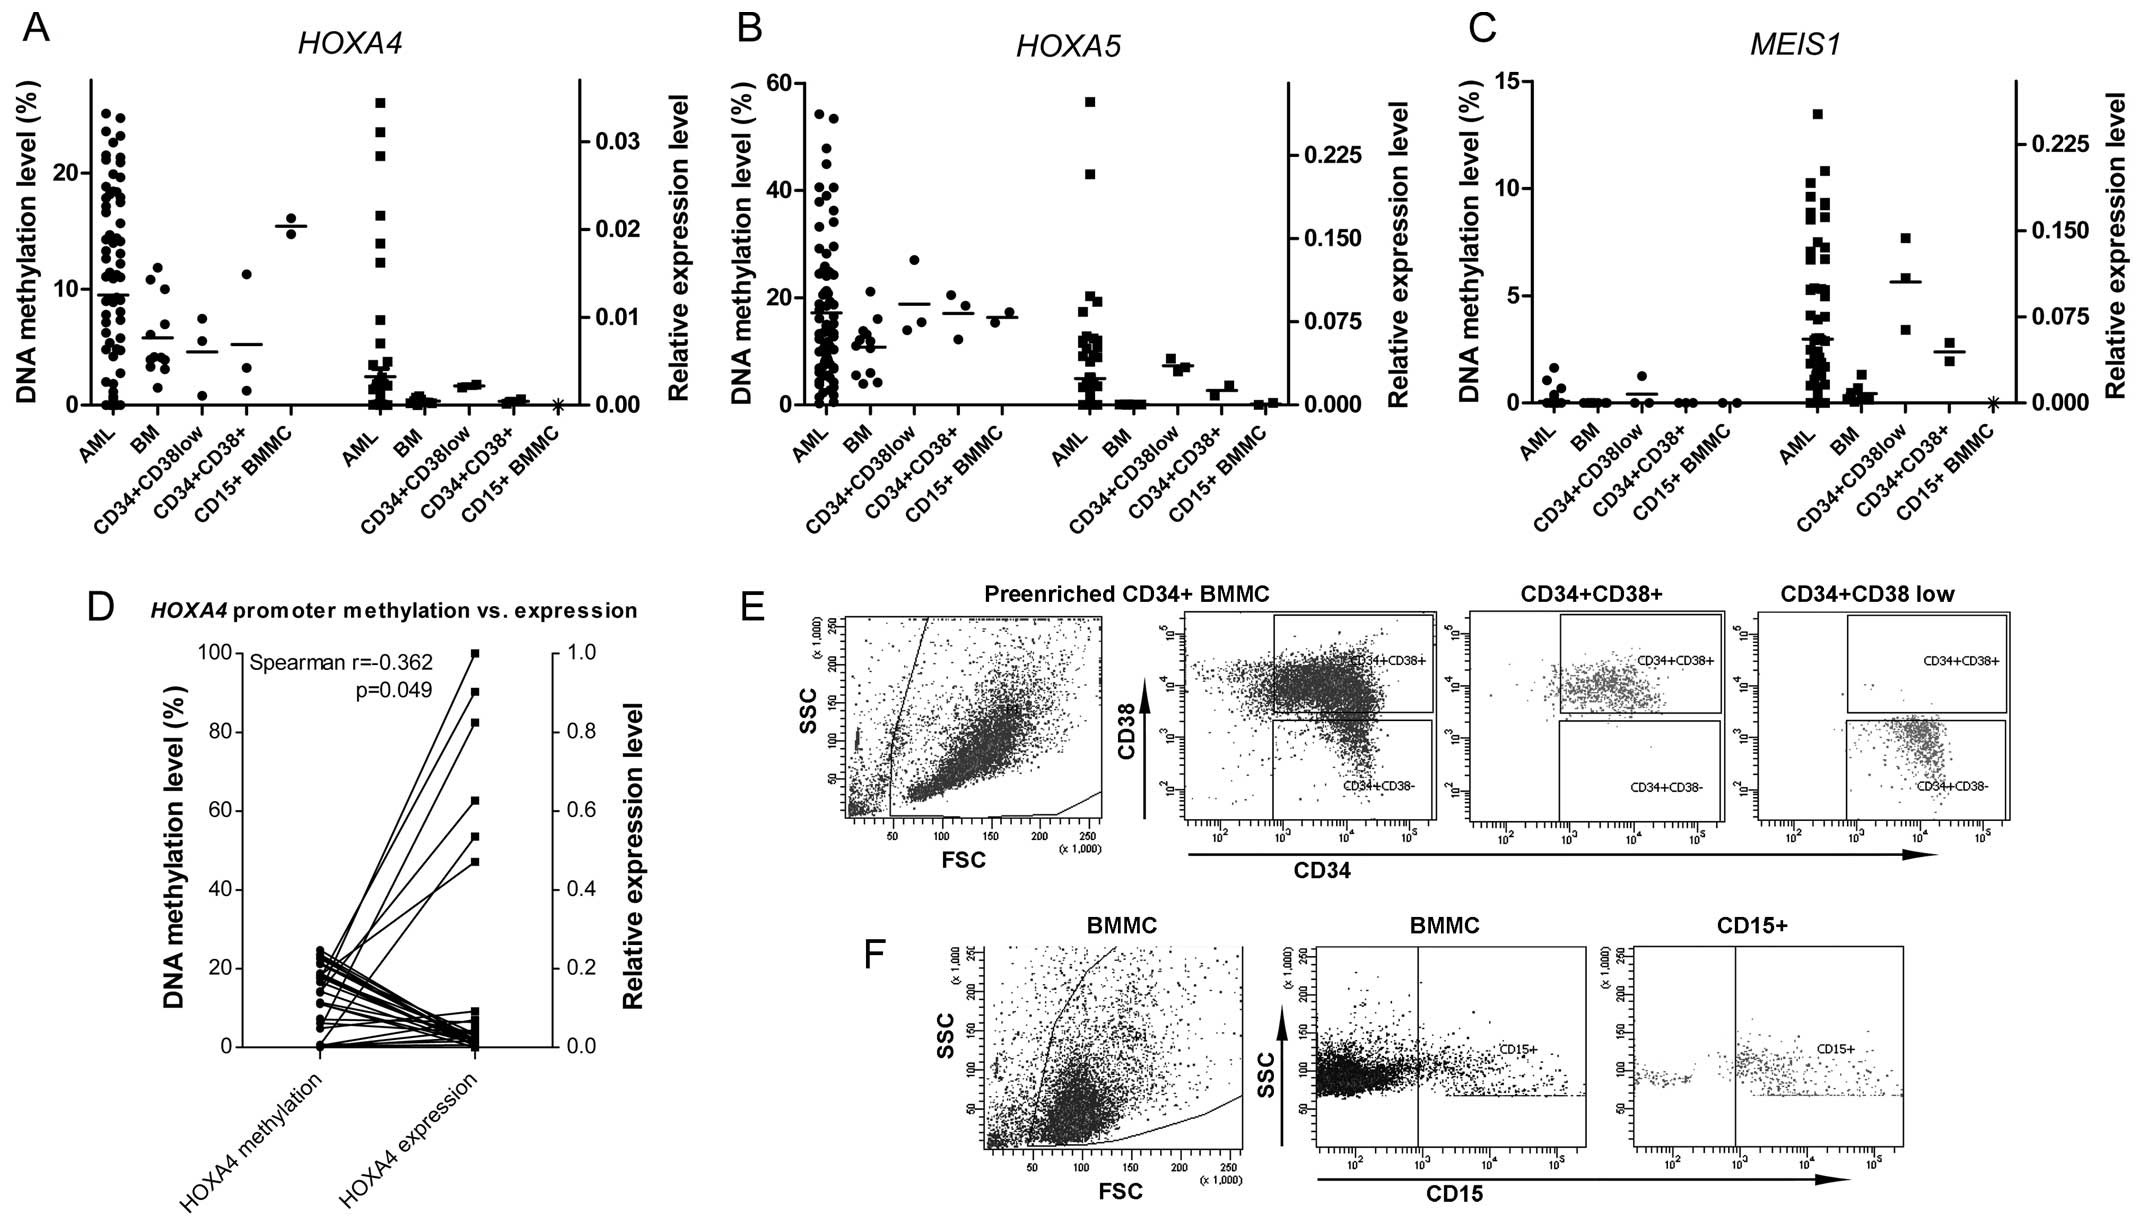
A degree of HOXA4 and HOXA5 promoter
methylation in the three sorted hematopoietic progenitors
populations was also observed. The level of HOXA4
methylation was higher in the immature BM-derived CD15+
granulocytes compared with the early CD34+ progenitors.
The HOXA5 methylation level, however, did not vary between
the sorted progenitor fractions, but was higher compared with the
total BMMC. DNA methylation was not observed in the MEIS1
promoter in either the patient or normal samples. The results are
shown in Fig. 1C.
The RNA extraction and assessment of relative gene
expression levels were successfully performed in 70 patient and 8
BM samples. All three genes of interest exhibited homogenous, low
levels of expression in the normal BM samples. Marked heterogeneity
was observed in the AML patient expression levels of HOXA4,
HOXA5 and MEIS1, with a notable proportion of
patients having high expression levels compared to the BM cells
(Fig. 1A–C).
The three examined genes were differentially
expressed when the hematopoietic progenitors and immature
CD15+ cells were compared. The highest level of
expression was observed in the earliest
CD34+CD38low progenitors, the expression
level decreased in the more mature CD34+CD38+
cells and expression either further decreased or was lost in the
CD15+ cells (Fig. 1E).
The decreased expression of HOXA4 in the three sorted
populations corresponded to an increase of gene promoter DNA
methylation.
Correlation between the HOXA4 and
HOXA5 promoter DNA methylation levels was observed in AML
(Spearman r=0.3020; P=0.0080). Correlation was also observed
between the expression levels of HOXA4 and HOXA5 and
the expression of their cofactor MEIS1 (Spearman r=0.3182;
P=0.0068 and Spearman r=0.800; P<0.0001, respectively).
The analysis of the association between promoter
methylation and expression levels in the entire group of AML
patients revealed no statistically significant correlation. This
was also preformed separately in cytogenetically normal AML
patients and an inverse correlation was observed between the
expression of HOXA4 and the levels of gene methylation
(Spearman r=−0.362; P=0.049; Fig.
1D).
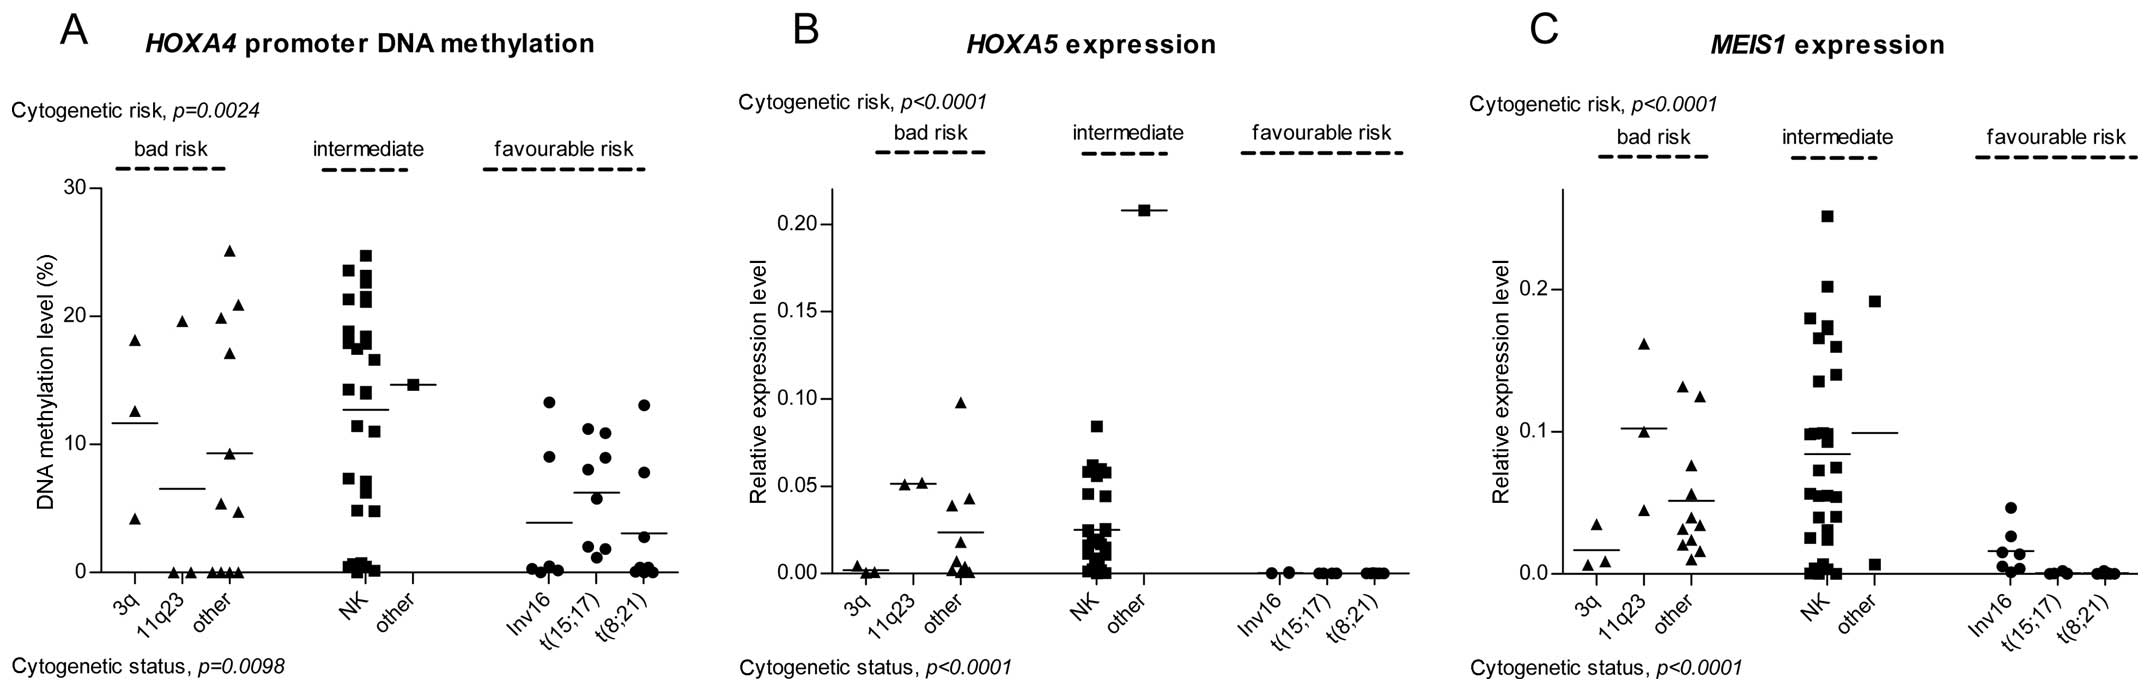
Gene promoter DNA methylation, expression
levels and cytogenetic risk
The DNA methylation and expression levels were
compared in the AML patients, grouped according to their
cytogenetic status, which constitutes the basis of the current WHO
classification and risk assessment.
The patients in the favorable prognostic group
demonstrated a lower level of HOXA4 methylation compared
with those in the intermediate and high risk groups. The NK
patients and those carrying unfavorable translocations exhibited
the highest variability in levels of HOXA4 methylation
(Fig. 2A). No significant
differences were detected in the levels of HOXA5 methylation
between the patients with distinct cytogenetic risk or status.
The gene expression analysis revealed differences in
the expression levels of HOXA5 and MEIS1 between
patients with different cytogenetic statuses (Fig. 2B and C). All the patients carrying
the favorable translocations, t(8;21), inv (16) and t(15;17), exhibited low
expression levels of HOXA5 and MEIS1 and the
expression levels of HOXA5 and MEIS1 were generally
lower in the favorable prognostic group compared with the
intermediate and high risk patients. Notably, all the patients with
3q aberrations revealed low expression levels of the two genes
compared with the favorable risk patients. However, the 3q group
consisted of only three patients.
No significant variation was observed in the
HOXA4 expression level between distinct cytogenetic risk and
status groups.
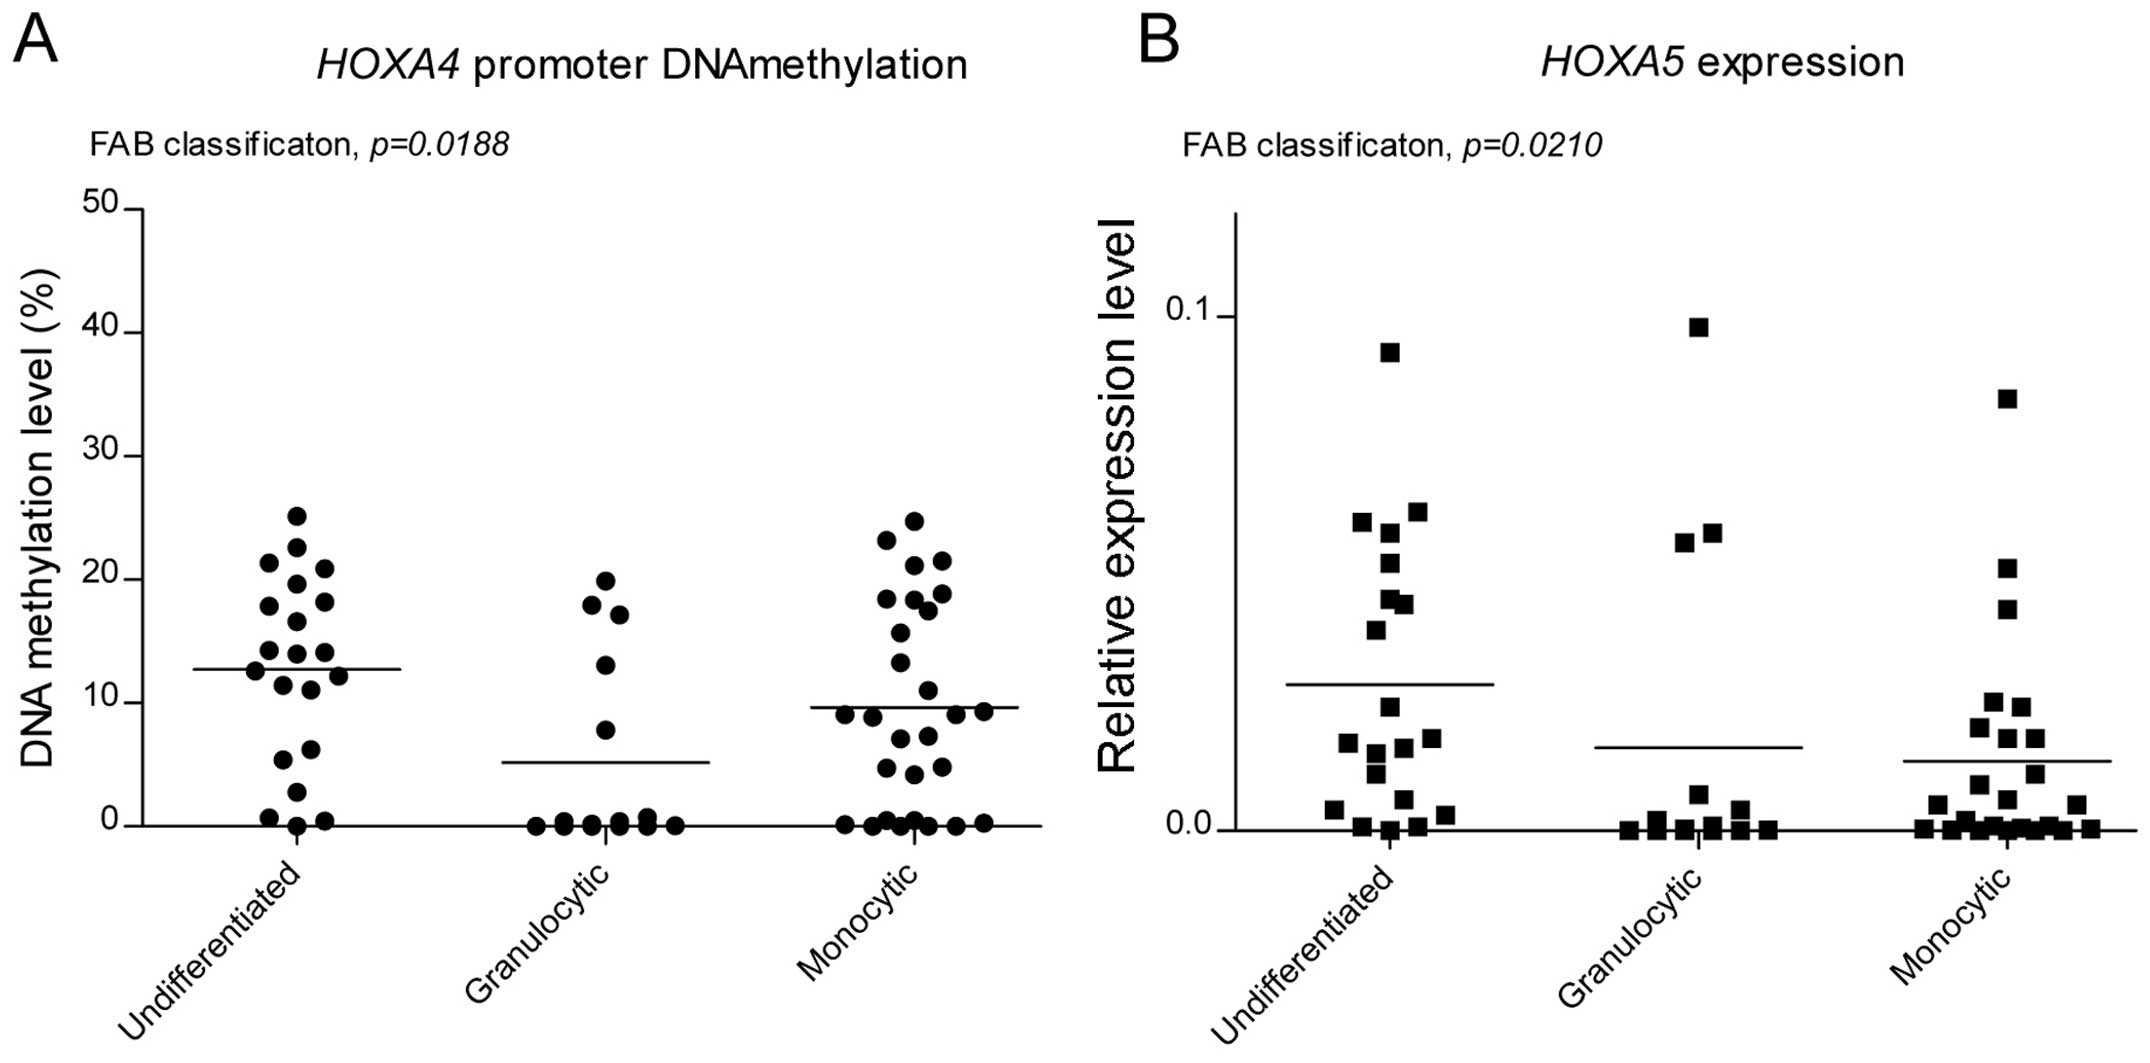
Promoter DNA methylation/expression
levels in patients grouped according to FAB
The FAB classification system has been commonly used
to classify AML patients on the basis of leukemic cell morphology,
cytochemistry and maturation (14). In the present study, the patients
were grouped into three categories based on the FAB classification
system: AML without maturation (M0 and M1), AML with granulocytic
maturation (M2) and AML with monocytic maturation (M4 and M5).
These three groups were then compared in terms of HOXA4,
HOXA5 and MEIS1 promoter methylation and expression
levels. The M3 PML patients were excluded as they constitute a
separate cytogenetic group defined by the presence of t(15:17),
which is described above. The groups differed significantly in
HOXA4 promoter methylation and expression levels of
HOXA5 (Fig. 3A and B,
respectively). The HOXA4 DNA methylation level was lowest in
the granulocytic AMLs and highest in the AMLs without maturation.
This differed to the previous observations in the normal
hematopoietic progenitors (Fig.
1A), where the undifferentiated CD34+ cells
exhibited lower HOXA4 methylation compared with the immature
granulocytes (BMMC CD15+). The patients with
granulocytic characteristics revealed the lowest expression levels
of HOXA5, whereas the highest mean value was observed in
patients without maturation.
In AML without maturation, high expression levels of
HOXA5 were observed compared with the AML with granulocytic
differentiation, which was concordant with the observed difference
between the isolated CD34+ progenitor and the BMMC
CD15+ immature granulocytes (Fig. 1B).
DNA promoter methylation and mRNA
expression analysis in the AML patients according to the FLT3-ITD
and NPM1 mutation status in NK AML
The promoter methylation and expression levels of
HOXA4, HOXA5 and MEIS1 were compared in the
entire group of AML patients, stratified according to
FLT3-ITD, which is a poor prognostic factor. The patients
with FLT3-ITD (FLT3-ITD+) demonstrated significantly
elevated expression levels of HOXA5 and MEIS1
compared with those without mutation with a 3.57-fold (P=0.0043)
and 2.38-fold (P=0.0048) change in mean relative expression,
repectively. No differences were observed in DNA promoter
methylation levels depending on the presence of FLT3-ITD.
Mutations in NPM1 and CEBPA are
favorable prognostic factors, which are used for the risk
assessment in AML patients without recurrent chromosomal
abnormalities (2). The present
study compared the methylation and expression levels of the three
genes of interest in NK AML, stratified according to NPM1
mutation status. The results revealed elevated HOXA4
methylation (2.03-fold change in the mean DNA methylation level;
P=0.0178) and elevated expression levels of HOXA5 and
MEIS1 in patients carrying the NPM1 mutation
(NPM1+) (3.27-fold change; P=0.0007 and 2.38-fold change;
P=0.0048, respectively). Since CEBPA mutations were
identified in only four AML patients, statistical evaluation was
not performed.
Discussion
HOXA transcription factors and their cofactor
MEIS1 are among the key regulators of development and
differentiation. They are involved in the initial stages of
hematopoiesis and contribute to subsequent lineage specification
(8–10). Aberrant HOXA expression is
associated with numerous types of cancer and DNA hypermethylation
has been identified as a mechanism partially responsible for the
downregulation of these genes (5).
The present study focused on the role of promoter
DNA methylation and expression levels of HOXA4, HOXA5
and MEIS1 in AML.
HOXA4 and HOXA5 promoters have been
previously described to be frequently methylated in AML (4). Analysis of these genes in the present
study revealed promoter methylation in normal BM samples (mean 4.1
and 11.5% for HOXA4 and HOXA5, respectively).
Therefore a cutoff value for methylation-high samples was applied
based on the results for the normal BM. The frequency of
HOXA4 and HOXA5 hypermethylation observed in the
present study differed from previous studies, possibly resulting
from the use of different analytical techniques and threshold
levels for ‘methylated’ sample classification. HOXA4
hypermethylation was previously reported to occur in 64% (by
combined bisulfite restriction analysis; COBRA) (4) and 77% (by methylation-sensitive
melting curve analysis) (12) of
patients compared with 39.4% of patients in the present study.
HOXA5 hypermethylation in AML was previously reported as 36%
(13) by pyrosequencing and 60 and
59% by COBRA (4,15), compared to 27.6% in the present
study. A slight correlation between the DNA methylation levels of
HOXA4 and HOXA5 were observed in the AML samples in
the present study, which may reflect the fact that the two
HOXA genes are located closely within the same chromosomal
region and are transcriptionally coregulated. This association was
also observed in childhood leukemia (4). Previously reported results,
indicating that MEIS1 is hypermethylated in 15% of AML
patients and frequently methylated in patients with t(8:21)
(16) were not observed in the
present study.
Gene expression is regulated through epigenetic
mechanisms, which include DNA methylation. It has been proposed
that HOXA4 downregulation may be associated with promoter
methylation status, which was supported by observations in chronic
lymphoblastic leukemia (17) and
AML (12). HOXA5 promoter
methylation regulates gene expression in myeloid leukemia cell
lines (15).
AML is a heterogenous and complex disease, in which
chromosomal aberrations are important in determining the leukemia
biology and prognosis (3). The
biological diversity of AML is the predominant factor, which may
explain the lack of correlation between the promoter methylation
and the expression levels of HOXA4 and HOXA5 in the
entire group of patients. This association was additionally
analyzed in NK AML and an inverse correlation of HOXA4
methylation and expression was observed. The comparison of
CD34+CD38low,
CD34+CD38+ and CD15+ BM derived
cells also supported the involvement of HOXA4 promoter
methylation in regulating gene expression, as an increase in DNA
methylation levels corresponded to a gradual decrease of RNA
expression.
The role of HOXA4 expression in myeloid
leukemogenesis has been investigated previously. AML patients with
low expression levels of HOXA4 have a poor prognosis in
terms of overall survival (18,19),
however, a previous study identified HOXA4 among the genes
overexpressed in patients with poor outcome (20). The prognostic role is possibly more
complex as it also dependent on the expression of MEIS1
(12).
The role of low expression levels of HOXA4 as
an adverse prognostic factor has been observed in a subgroup of
cytogenetically normal patients (21) and also on an entire group of AML
patients (18), despite the fact
that low levels of HOXA4 occur in patients with favorable
translocations, particularly t(15:17) (22,23).
The poor survival rates observed in AML with low HOXA4
expression in a study by Tholouli et al (18) was possibly due to the high
representation of NK AML patients and the fact that this group of
patients is characterized by a high and heterogenous level of gene
expression (18,21,24,25).
The expression of HOXA4 may therefore be involved,
particularly in molecularly heterogenous cytogenetically normal
patients, for which new prognostic markers are required.
In the present study, no statistically significant
difference was observed in the expression of HOXA4 between
the AML cytogenetic groups, however different levels of promoter
methylation were observed in this gene. A high, but variable
HOXA4 methylation level was observed in patients with NK AML
and those with adverse cytogenetic risk compared with patients a
with favorable prognosis. This was concordant with the previously
reported differences in the frequency of HOXA4
hypermethylation between the cytogenetic risk groups (12). Considering the observed association
between HOXA4 promoter methylation and expression levels in
NK AML and the prognostic role of the expression of this gene in
AML, it was suggested that the DNA methylation level of this gene
may have a prognostic value. This is consistent with previously
reported data, in which HOXA4 was among the genes
upregulated in NK AML patients with the NPM1 mutation, a
favorable prognostic factor (23,26).
However, this is inconsistent with the observation in the present
study of a higher HOXA4 methylation level in a group of NK
AML patients with the NPM1 mutation.
Different levels of HOXA4 promoter DNA
methylation were observed when groups of patients, stratified
according to the FAB classification system, were compared. However,
by contrast to the results in normal hematopoietic precursors, the
highest methylation level was observed in undifferentiated AMLs.
Aberrant HOXA4 methylation in leukemic BM samples may be
associated with the neoplastic nature of leukemic cells rather than
their differentiation stage.
HOXA5 promoter methylation was previously
identified as an independent prognostic factor in a group of AML
patients (13). As this study
involved a small number of patients, the observed prognostic role
was considered a possible result of higher levels of HOXA5
methylation in the favorable cytogenetic group. In the present
study, no difference in the methylation levels between the
prognostic groups of patients was observed, which indirectly
supported the previous finding. In the AML patients, no association
was found between the HOXA5 methylation and expression
levels, as observed in myeloid leukemia cell lines (15).
Unlike HOXA5 promoter methylation, diverse
gene expression levels were observed when patients with different
molecular profiles were analyzed. Similar to HOXA4 promoter
methylation, the expression levels of either HOXA5 or
MEIS1 were lowest in the cytogenetically favorable patients
and the FLT3 wild-type patients, as reported previously
(25). Notably, in NK AML, the two
genes were expressed at higher levels in the patients with
NPM1 mutations, as has been observed in genome-wide
expression profiling (27,28). This suggested that the HOXA
and MEIS1 genes may have slightly different roles in NK AML
compared with AML patients with cytogenetic abberations.
Elevated expression levels of the three genes were
observed in AML patients, compared with normal BM patients. The
HOXA and MEIS1 genes were expressed at relatively
high levels in the primitive CD34+CD38low
cells, decreased in the CD34+CD38+
progenitors and were further decreased or absent in the BM derived
CD15+ cells. It is possible that the expression levels
of the HOXA genes reflect the differentiation stage of
leukemic blasts, however the regulation of these genes appeared to
be generally impaired in AML. The expression levels of HOXA4
and HOXA5 may exceed their expression levels in normal
cells, including normal early progenitors. The phenotypic features
of the AML samples, according to the FAB classification, were not
associated with HOXA or MEIS1 methylation or
expression, with the exception of higher expression levels of
HOXA5 in AML without differentiation compared with AML with
granulocytic and monocytic differentiation. Similar observations
have been reported previously, in which M1 patients revealed higher
expression levels of HOXA5 compared with other AML patients
(29).
It appears that there is an association between
HOXA4, HOXA5 and MEIS1 in AML. The two
investigated HOXA genes are closely associated. They are
located in the same gene locus and appear to be transcriptionally
coregulated with MEIS1. The present study observed a
correlation between the promoter methylation and gene expression of
the HOXA genes and also observed a correlation between their
expression and that of MEIS1. This association was explicit
between HOXA5 and MEIS1 and the two genes exhibited
corresponding mRNA levels in the distinct molecular groups of the
AML patients.
Acknowledgements
The present study was supported by the Ministry of
Science and Higher Education of Poland (no. 344/N-INCA/2008/0).
References
|
1
|
Shima Y and Kitabayashi I: Deregulated
transcription factors in leukemia. Int J Hematol. 94:134–141. 2011.
View Article : Google Scholar : PubMed/NCBI
|
|
2
|
Döhner K and Döhner H: Molecular
characterization of acute myeloid leukemia. Haematologica.
93:976–982. 2008. View Article : Google Scholar : PubMed/NCBI
|
|
3
|
Vardiman J and Hyjek E: World health
organization classification, evaluation, and genetics of the
myeloproliferative neoplasm variants. Hematology Am Soc Hematol
Educ Program. 2011:250–256. 2011. View Article : Google Scholar : PubMed/NCBI
|
|
4
|
Strathdee G, Holyoake TL, Sim A, et al:
Inactivation of HOXA genes by hypermethylation in myeloid and
lymphoid malignancy is frequent and associated with poor prognosis.
Clin Cancer Res. 13:5048–5055. 2007. View Article : Google Scholar : PubMed/NCBI
|
|
5
|
Shah N and Sukumar S: The Hox genes and
their roles in oncogenesis. Nat Rev Cancer. 10:361–371. 2010.
View Article : Google Scholar : PubMed/NCBI
|
|
6
|
Argiropoulos B and Humphries RK: Hox genes
in hematopoiesis and leukemogenesis. Oncogene. 26:6766–6776. 2007.
View Article : Google Scholar : PubMed/NCBI
|
|
7
|
Fournier M, Lebert-Ghali CÉ, Krosl G and
Bijl JJ: HOXA4 induces expansion of hematopoietic stem cells in
vitro and confers enhancement of pro-B-cells in vivo. Stem Cells
Dev. 21:133–142. 2012. View Article : Google Scholar
|
|
8
|
Iacovino M, Hernandez C, Xu Z, Bajwa G,
Prather M and Kyba M: A conserved role for Hox paralog group 4 in
regulation of hematopoietic progenitors. Stem Cells Dev.
18:783–792. 2009. View Article : Google Scholar :
|
|
9
|
Fuller JF, McAdara J, Yaron Y, Sakaguchi
M, Fraser JK and Gasson JC: Characterization of HOX gene expression
during myelopoiesis: role of HOX A5 in lineage commitment and
maturation. Blood. 93:3391–3400. 1999.PubMed/NCBI
|
|
10
|
Crooks GM, Fuller J, Petersen D, Izadi P,
Malik P, Pattengale PK, et al: Constitutive HOXA5 expression
inhibits erythropoiesis and increases myelopoiesis from human
hematopoietic progenitors. Blood. 94:519–528. 1999.PubMed/NCBI
|
|
11
|
Argiropoulos B, Yung E and Humphries RK:
Unraveling the crucial roles of Meis1 in leukemogenesis and normal
hematopoiesis. Genes Dev. 21:2845–2849. 2007. View Article : Google Scholar : PubMed/NCBI
|
|
12
|
Zangenberg M, Grubach L, Aggerholm A,
Silkjaer T, Juhl-Christensen C, Nyvold CG, et al: The combined
expression of HOXA4 and MEIS1 is an independent prognostic factor
in patients with AML. Eur J Haematol. 83:439–448. 2009. View Article : Google Scholar : PubMed/NCBI
|
|
13
|
Kim SY, Hwang S-H, Song EJ, Shin HJ, Jung
JS and Lee EY: Level of HOXA5 hypermethylation in acute myeloid
leukemia is associated with short-term outcome. Korean J Lab Med.
30:469–473. 2010. View Article : Google Scholar : PubMed/NCBI
|
|
14
|
Walker H, Smith FJ and Betts DR:
Cytogenetics in acute myeloid leukaemia. Blood Rev. 8:30–36. 1994.
View Article : Google Scholar : PubMed/NCBI
|
|
15
|
Strathdee G, Sim A, Soutar R, Holyoake TL
and Brown R: HOXA5 is targeted by cell-type-specific CpG island
methylation in normal cells and during the development of acute
myeloid leukaemia. Carcinogenesis. 28:299–309. 2007. View Article : Google Scholar
|
|
16
|
Lasa A, Carnicer MJ, Aventín A, Estivill
C, Brunet S, Sierra J, et al: MEIS 1 expression is downregulated
through promoter hypermethylation in AML1-ETO acute myeloid
leukemias. Leukemia. 18:1231–1237. 2004. View Article : Google Scholar : PubMed/NCBI
|
|
17
|
Strathdee G, Sim A, Parker A, Oscier D and
Brown R: Promoter hypermethylation silences expression of the HoxA4
gene and correlates with IgVh mutational status in CLL. Leukemia.
20:1326–1329. 2006. View Article : Google Scholar : PubMed/NCBI
|
|
18
|
Tholouli E, MacDermott S, Hoyland J, Yin
JL and Byers R: Quantitative multiplex quantum dot in-situ
hybridisation based gene expression profiling in tissue microarrays
identifies prognostic genes in acute myeloid leukaemia. Biochem
Biophys Res Commun. 425:333–339. 2012. View Article : Google Scholar : PubMed/NCBI
|
|
19
|
Grubach L, Juhl-Christensen C, Rethmeier
A, et al: Gene expression profiling of Polycomb, Hox and Meis genes
in patients with acute myeloid leukaemia. Eur J Haematol.
81:112–122. 2008. View Article : Google Scholar : PubMed/NCBI
|
|
20
|
Bullinger L, Döhner K, Bair E, et al: Use
of gene-expression profiling to identify prognostic subclasses in
adult acute myeloid leukemia. N Engl J Med. 350:1605–1616. 2004.
View Article : Google Scholar : PubMed/NCBI
|
|
21
|
Grubach L, Juhl-Christensen C, Rethmeier
A, et al: Gene expression profiling of Polycomb, Hox and Meis genes
in patients with acute myeloid leukaemia. Eur J Haematol.
81:112–122. 2008. View Article : Google Scholar : PubMed/NCBI
|
|
22
|
Thompson A, Quinn MF, Grimwade D, et al:
Global down-regulation of HOX gene expression in PML-RARalpha+acute
promyelocytic leukemia identified by small-array real-time PCR.
Blood. 101:1558–1565. 2003. View Article : Google Scholar : PubMed/NCBI
|
|
23
|
Andreeff M, Ruvolo V, Gadgil S, et al: HOX
expression patterns identify a common signature for favorable AML.
Leukemia. 22:2041–2047. 2008. View Article : Google Scholar : PubMed/NCBI
|
|
24
|
Debernardi S, Lillington DM, Chaplin T, et
al: Genome-wide analysis of acute myeloid leukemia with normal
karyotype reveals a unique pattern of homeobox gene expression
distinct from those with translocation-mediated fusion events.
Genes Chromosomes Cancer. 37:149–158. 2003. View Article : Google Scholar : PubMed/NCBI
|
|
25
|
Roche J, Zeng C, Barón A, et al: Hox
expression in AML identifies a distinct subset of patients with
intermediate cytogenetics. Leukemia. 18:1059–1063. 2004. View Article : Google Scholar : PubMed/NCBI
|
|
26
|
Verhaak RG, Goudswaard CS, van Putten W,
et al: Mutations in nucleophosmin (NPM1) in acute myeloid leukemia
(AML): association with other gene abnormalities and previously
established gene expression signatures and their favorable
prognostic significance. Blood. 106:3747–3754. 2005. View Article : Google Scholar : PubMed/NCBI
|
|
27
|
Bacher U, Kohlmann A, Haferlach C and
Haferlach T: Gene expression profiling in acute myeloid leukaemia
(AML). Best Pract Res Clin Haematol. 22:169–180. 2009. View Article : Google Scholar : PubMed/NCBI
|
|
28
|
Whitman SP, Maharry K, Radmacher MD, et
al: FLT3 internal tandem duplication associates with adverse
outcome and gene- and microRNA-expression signatures in patients 60
years of age or older with primary cytogenetically normal acute
myeloid leukemia: a Cancer and Leukemia Group B study. Blood.
116:3622–3626. 2010. View Article : Google Scholar : PubMed/NCBI
|
|
29
|
Drabkin HA, Parsy C, Ferguson K, Guilhot
F, et al: Quantitative HOX expression in chromosomally defined
subsets of acute myelogenous leukemia. Leukemia. 16:186–195. 2002.
View Article : Google Scholar : PubMed/NCBI
|