Introduction
Chronic hepatitis B virus (CHB) represents a serious
global health concern. The World Health Organization (WHO)
estimates that there are ~400 million chronic HBV carriers
worldwide, and the weighted prevalence of hepatitis B surface
antigen (HBsAg) for the Chinese population aged 1–59 years was
shown to be 7.18% (1). Patients
with CHB have a higher risk of developing liver cirrhosis, hepatic
decompensation and hepatocellular carcinoma, and 15–20% of patients
develop liver cirrhosis within five years (2).
The natural course of CHB includes: i) An
immunotolerance (IT) phase characterized by the presence of
hepatitis B ‘e’ antigen (HBeAg), active HBV replication and normal
levels of alanine aminotransferase (ALT), ii) an immunoclearance
(IC) phase characterized by fluctuating or high serum HBV DNA and
ALT levels, liver inflammation and HBeAg seroconversion, iii) a low
replicative (LR) phase in which patients have undetectable levels
of HBV DNA, are HBeAg-negative, anti-HBeAg positive and show
minimal fibrosis and iv) HBeAg negative hepatitis (ENH) (3).
Overt HBV infection is characterized by the presence
of HBsAg, which is secreted by infected hepatocytes (4,5).
HBsAg levels have been suggested to i) reflect the presence of
covalently closed circular DNA (cccDNA), ii) predict HBsAg
seroclearance and iii) predict the therapeutic response during
antiviral therapy (6,7). Although HBsAg levels have
traditionally been estimated using enhanced chemiluminescence
(8), there has been a recent focus
on developing reproducible, automated, low-cost assay systems in
order to use it as a biomarker (9).
HBeAg is an important early serum marker of HBV
infection and correlates with high infectivity (10). Perinatal transmission of HBV is
strongly associated with HBeAg positivity in the mother (11) and HBeAg seroconversion is
considered as a marker for a sustained therapeutic response
(12). Quantitative assays for
HBeAg are not routinely available, and HBeAg levels are expressed
as serial dilutions of a reference sample from the Paul Ehrlich
Institute (Langen, Germany) (13).
It has been suggested that the evaluation of the HBeAg sample to
cut-off ratio (S/co ratio) could be useful for HBV diagnosis and
treatment (12,14).
Assessment of fibrosis by liver biopsy remains the
most reliable parameter in determining appropriate treatment
options (15). Given the
invasiveness of the liver biopsy procedure, it has become important
to develop novel, non-invasive strategies to diagnose fibrosis.
Median HBsAg levels have been shown to fluctuate through the
different stages of HBV infection (7,9,16)
and serum HBsAg levels were shown to correlate with HBV DNA levels
(17). However, there is limited
information describing the association between HBsAg and liver
pathology in patients with CHB who are in the IC phase (18). There is also limited information on
the association of HBeAg with the grade of inflammation and
fibrosis in CHB patients (19).
Treatment-naïve HBeAg-positive CHB patients were recently shown to
have a strong positive correlation between HBsAg and HBV DNA levels
and a negative correlation between HBsAg levels and severity of
fibrosis (20). The major goals of
this study were to understand the association between HBsAg, HBeAg
and fibrosis and to evaluate HBsAg and HBeAg as non-invasive
biomarkers of liver inflammation and fibrosis in CHB patients in
the IC phase of the disease.
Patients and methods
Patients
This study received approval from the Institutional
Review Board of Fujian Medical University, Fuzhou, China. Patients’
informed consent was obtained prior to the study. This
retrospective cross-sectional study included a total of 237
patients diagnosed with CHB and consecutively admitted to the First
Affiliated Hospital of Fujian Medical University (Fujian, China)
between March 2009 and May 2012. Only patients in the immune
clearance phase were included in this study. The IC phase was
defined as the presence of HBsAg for at least six months and serum
HBV DNA≥2,000 IU/ml (~104 copies/ml) in HBeAg-positive
patients. ALT levels at least twice the upper limit of normal (ULN)
were used as one of the criteria to define the IC phase, based on
previous reports (6,7,20)
and based on the APASL guide (21), which defines minimally elevated ALT
as a value between ULN and 2× ULN. Exclusion criteria were i)
presence of other types of viral hepatitis, ii) hepatocellular
carcinoma, iii) alcoholic liver disease, iv) decompensated
cirrhosis, v) autoimmune hepatitis, vi) concurrent infection with
human immunodeficiency virus (HIV), vii) hereditary liver diseases,
viii) drug-induced liver injury and ix) serum creatinine levels
1.5-fold the ULN. None of the patients received antiviral therapy
prior to the liver biopsy. Biochemical and virological data were
obtained from patient serum samples collected within the previous
seven days.
Liver histology and quantification of
fibrosis
Liver tissue was obtained by
ultrasonographic-guided, percutaneous liver biopsy. Specimens of
15–20 mm liver tissues were fixed, paraffin-embedded and stained
with hematoxylin-eosin-safran and Masson’s trichrome. A minimum of
six portal tracts was required for diagnosis. The liver biopsies
were evaluated with or without knowing the patient history.
Histological staging was performed in order to classify the degree
of fibrosis according to the Chinese Guidelines of the Programme of
Prevention and Cure for Viral Hepatitis (20). All biopsy samples were classified
as inflammation levels G 0–4. This classification system for
fibrosis stages (FS) was similar to the Scheuer system (22) and METAVIR system (23), with F0 (no fibrosis), F1 (mild
fibrosis without septa), F2 (moderate fibrosis with few septa), F3
(severe fibrosis with numerous septa without cirrhosis) and F4
(cirrhosis) (23). However, in the
present study, fibrosis stages were simplified as F1 (F0–F1), F2,
F3 and F4.
Serum parameters
Serum HBsAg was quantified using the
chemiluminescent ARCHITECT platform (Abbott Laboratories, Chicago,
IL, USA), according to the manufacturer’s instructions. The
ARCHITECT quantitative HBsAg assay is a chemiluminescent
microparticle assay, internally calibrated using the WHO standard
for HBsAg. Samples were diluted 1:100 in horse serum and if >250
IU/ml, samples were retested at a dilution of 1:500. Serum HBeAg
levels were measured using the AxSYM microparticle enzyme
immunoassay (Abbott Laboratories) according to the manufacturer’s
instructions. The AxSYM assay measures the ratio of the sample (S)
to the cut-off (Co) (S/Co ratio) and an S/Co ratio ≥1.0 is defined
as HBeAg-positive. Serum HBV DNA levels were measured by
fluorescence quantitative polymerase chain reaction with a
detection range of 500-1.0×10⁹ IU/ml (HBV PCR Detection
kit; PG Company, Shenzhen, China), according to the manufacturer’s
instructions. Serum biochemical parameters, including total
bilirubin, ALT, aspartate aminotransferase (AST), gamma glutamyl
transpeptidase (GGT), albumin, globulin, total cholesterol,
α-fetoprotein, prothrombin time (PT), international normalized
ratio (INR), white blood corpuscle count (WBC) and platelet count
(PLT) were determined within 1 week prior to taking the liver
biopsy.
Model development
Numerous biochemical markers, including albumin,
cholinesterase, cholesterol, platelet count, AST, ALT, bilirubin,
globin, GGT, total bile acid, prothrombin time and INR were
evaluated in addition to HBV DNA, HBsAg, and HBeAg levels, for
their ability to determine cirrhosis in CHB patients. These
parameters were measured using an Olympus AU2700 Biochemistry
Analyzer (Olympus Corporation, Tokyo, Japan). A comparative
analysis of patients with or without cirrhosis was then performed
in order to select the most appropriate markers to develop a liver
pathology-predicting model (IC model). The predictive value of the
IC model was compared with other existing models, including the
fibrosis index (FI), AST to platelet ratio index (APRI), FIB-4,
age-AST and age-platelet (AP) index (24–29)
using receiver operating characteristic (ROC) curves.
Statistical analysis
The correlations between clinical parameters and
liver pathological stages were determined by using Kendall’s rank
correlation coefficient, with the exception of correlation between
gender and liver pathological stages. Spearman’s correlation was
used to test the correlation between gender and liver pathological
stages. Data are presented as medians (IQR), unless indicated. All
continuous variables were analyzed after logarithmic transformation
for normality of distribution. Univariate logistic regression
analysis was performed to analyze the odds ratio (OR) of
significant factors associated with patients with cirrhosis.
Variables with a P<0.05 in the univariate analysis were selected
and evaluated by multivariate logistic regression models with a
conditional forward selection method. Furthermore, an ROC curve was
employed to obtain the area under the curve (AUC), sensitivity,
specificity, positive predictive value (PPV) and negative
predictive value (NPV) of HBsAg and HBeAg levels, in order to
distinguish between the different stages of inflammation and
fibrosis. ROC curves were constructed for the IC model, APRI,
age-AST, FIB4, FI and the AP index to predict cirrhosis. The AUC
was statistically construed as the probability of assessing HBsAg
and HBeAg as non-invasive biomarkers of liver inflammation and
fibrosis in CHB patients who were in the IC stage of the disease.
All statistical assessments were two-sided and evaluated at the
0.05 level of significance. Statistical analyses were performed
using SPSS 15.0 statistics software (SPSS, Inc., Chicago, IL, USA).
Multiple ROC curves were analyzed to predict cirrhosis with six
non-invasive models (IC-model, FI, APRI, FIB-4, age-AST model and
AP index). For pairwise comparison of the ROC curves, MedCalc for
Windows, version 9.38 (MedCalc Software, Mariakerke, Belgium), was
used.
Results
The clinical characteristics of CHB patients in the
IC phase and the correlation between the clinical characteristics
and liver pathological stages are summarized in Table I. Two hundred and thirty seven
patients admitted to the First Affiliated Hospital of Fujian
Medical University consecutively, and diagnosed with CHB from March
2009 to May 2012, were included in this cross-sectional study. Of
the 237 patients, 186 (78.5%) were male and the median age of all
patients was 32 years (range, 11–61 years). 54 (22.8%), 78 (32.9%),
61 (25.7%) and 44 (18.6%) had F1, F2, F3 or F4 fibrosis,
respectively. The levels of albumin, cholinesterase, cholesterol,
platelet count, HBV DNA, HBsAg and HBeAg were negatively correlated
with liver pathological stages (both the inflammation and fibrosis
stages). In contrast, age, bilirubin, globin, GGT, total bile acid,
prothrombin time and international normalized ratio (INR) were
positively correlated with liver pathological stages (Table I). There were significant positive
correlations between HBsAg and HBeAg levels (γ=0.317, P<0.001),
and between HBsAg and HBV-DNA levels (γ=0.489, P<0.001).
However, no correlation between HBsAg and ALT levels was identified
(data not shown).
 | Table ICharacteristics of 237 patients in the
immune clearance phase of persistent hepatitis B viral-infection
and the correlation between clinical parameters and liver
pathological stages. |
Table I
Characteristics of 237 patients in the
immune clearance phase of persistent hepatitis B viral-infection
and the correlation between clinical parameters and liver
pathological stages.
| | G stage | F stage |
|---|
| |
|
|
|---|
| Variables | Median (IQR) | Correlation
coefficient | P-value | Correlation
coefficient | P-value |
|---|
| Age
(years)a | 32 (24–38) | 0.236 |
<0.001c | 0.217 |
<0.001c |
| Gender
(male/female)b | 186/51 | 0.027 | 0.674 | 0.025 | 0.706 |
| Bilirubin
(μmol/l)a | 17 (12.7–23.2) | 0.145 |
0.004c | 0.137 |
0.005c |
| Albumin
(g/l)a | 39.7
(36.7–43.2) | −0.321 |
<0.001c | −0.268 |
<0.001c |
| Globin
(g/l)a | 30.5
(27.8–33.5) | 0.118 |
0.019c | 0.128 |
0.008c |
| ALT
(IU/l)a | 226 (124–428) | 0.108 |
0.031c | 0.022 | 0.646 |
| AST
(IU/l)a | 121 (73–228) | 0.176 |
<0.001c | 0.094 | 0.054 |
| GGT
(IU/l)a | 68 (43–120) | 0.258 |
<0.001c | 0.164 |
0.001c |
| Cholinesterase
(IU/l)a | 6671
(5432–8033) | −0.294 |
<0.001c | −0.283 |
<0.001c |
| Total bile acid
(mmol/l)a | 15.9
(8.6–32.8) | 0.167 |
0.001c | 0.166 |
0.001c |
| Total cholesterol
(mmol/l)a | 4.25
(3.70–4.98) | −0.136 |
0.008c | −0.120 |
0.015c |
| Prothrombin time
(s)a | 13.4
(12.9–14.3) | 0.252 |
<0.001c | 0.271 |
<0.001c |
|
INRa | 1.02
(0.97–1.10) | 0.308 |
<0.001c | 0.283 |
<0.001c |
| White cell count
(109/l)a | 5.6 (4.6–6.6) | −0.128 |
0.011c | −0.053 | 0.277 |
| Platelet count
(1011/l)a | 1.91
(1.58–2.22) | −0.248 |
<0.001c | −0.277 |
<0.001c |
| HBV DNA (log
IU/ml)a | 6.81
(5.86–7.45) | −0.132 |
0.008c | −0.130 |
0.008c |
| HBsAg (log
IU/ml)a | 3.94
(3.45–4.41) | −0.244 |
<0.001c | −0.298 |
<0.001c |
| HBeAg (log
S/Co)a | 2.63
(2.07–3.01) | −0.304 |
<0.001c | −0.371 |
<0.001c |
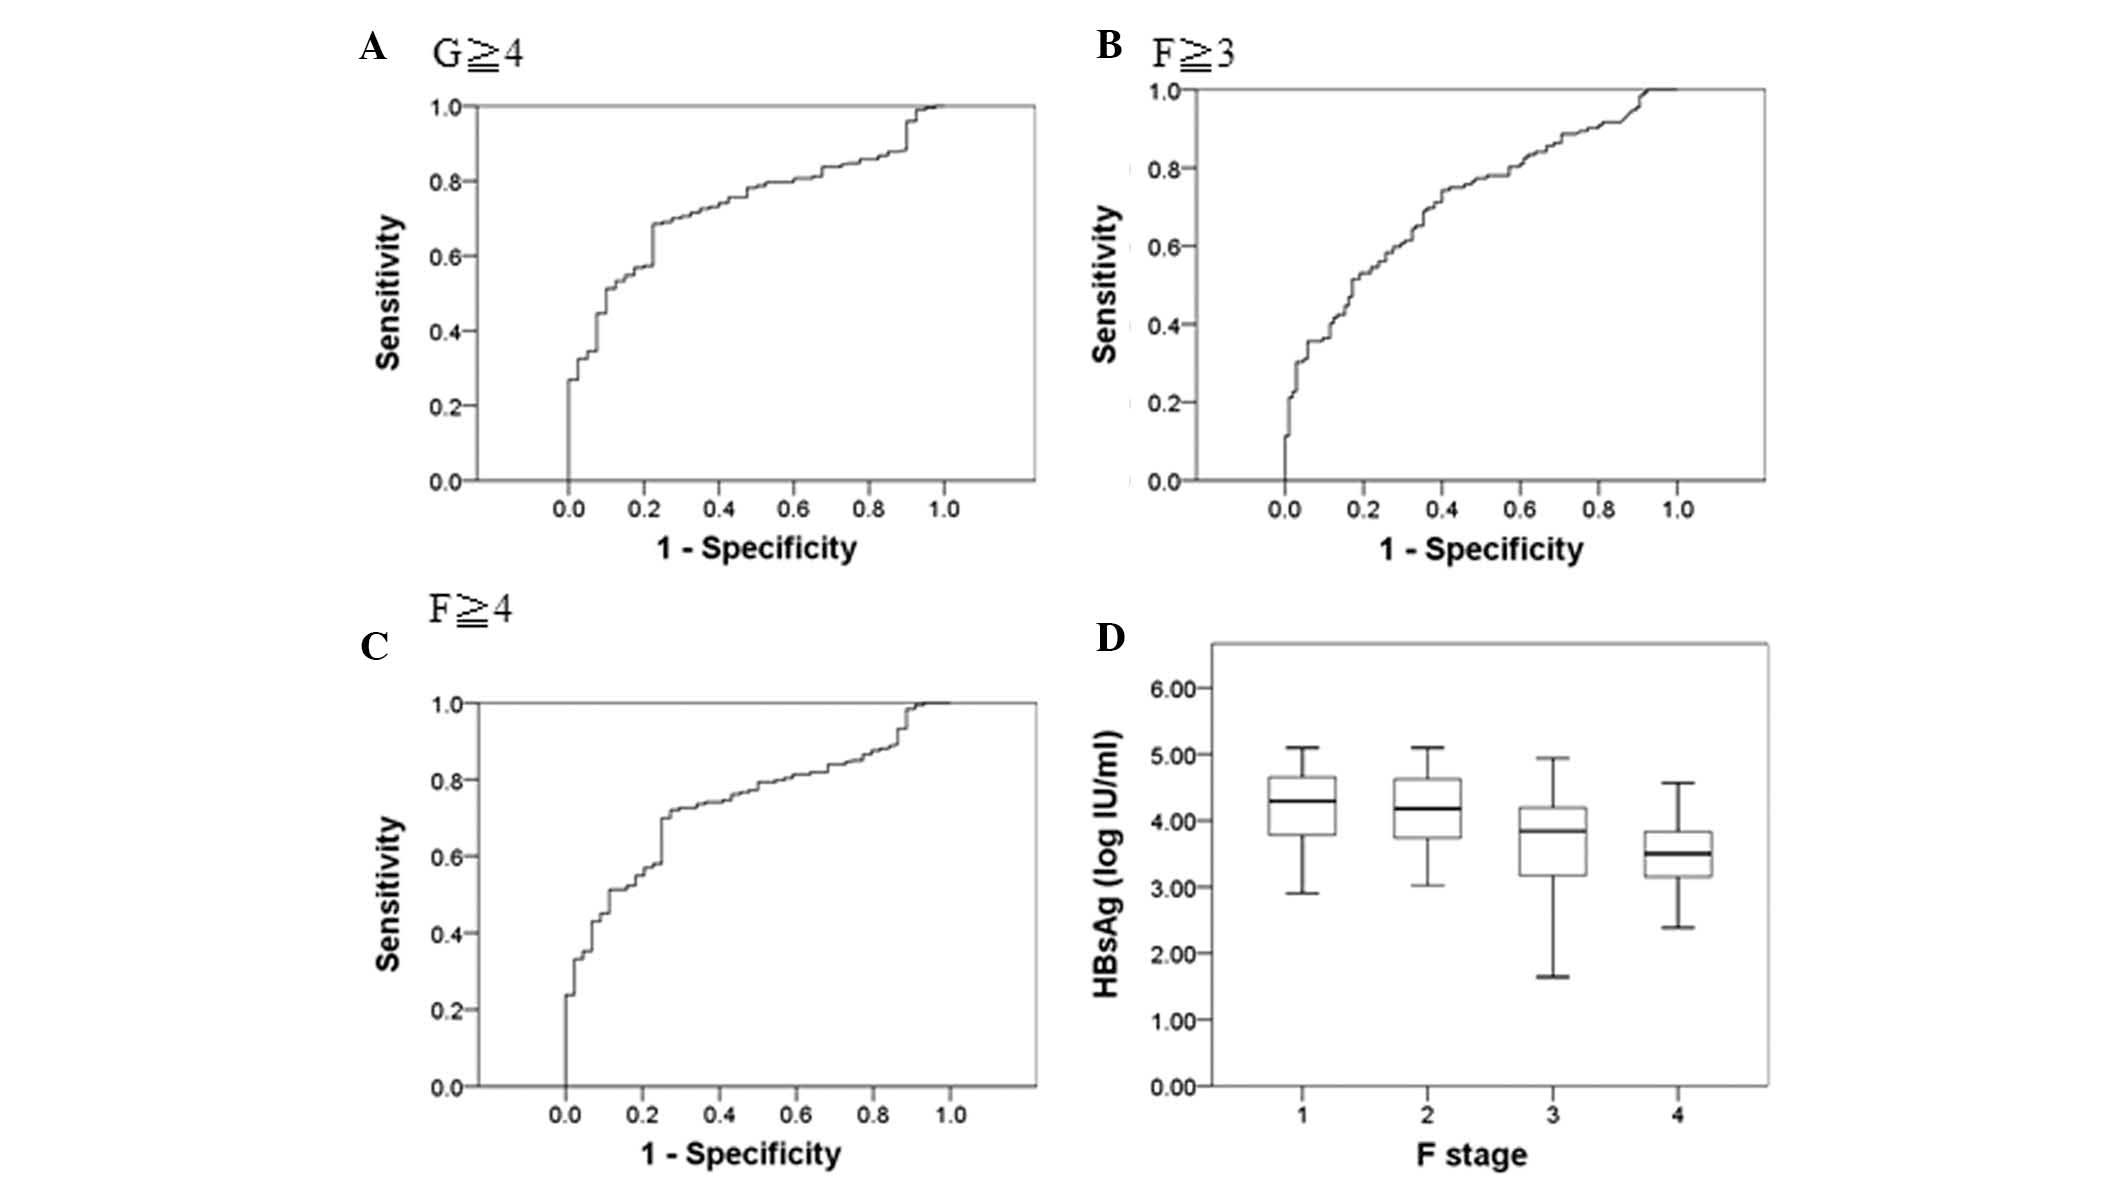
Table II shows the
performance of HBsAg and HBeAg levels in distinguishing the
different stages of inflammation and fibrosis using AUC values. ROC
curve analysis revealed that the AUC was 0.73 (G≥4), 0.72 (F≥3),
and 0.74 (F≥4) and the cut-off point of HBsAg (log IU/ml) was 3.76,
4.20 and 3.75, respectively (Fig.
1A–C). The median HBsAg levels (log10 IU/ml) at liver fibrosis
stages F1 to F4 were 4.29, 4.18, 3.84 and 3.50, respectively
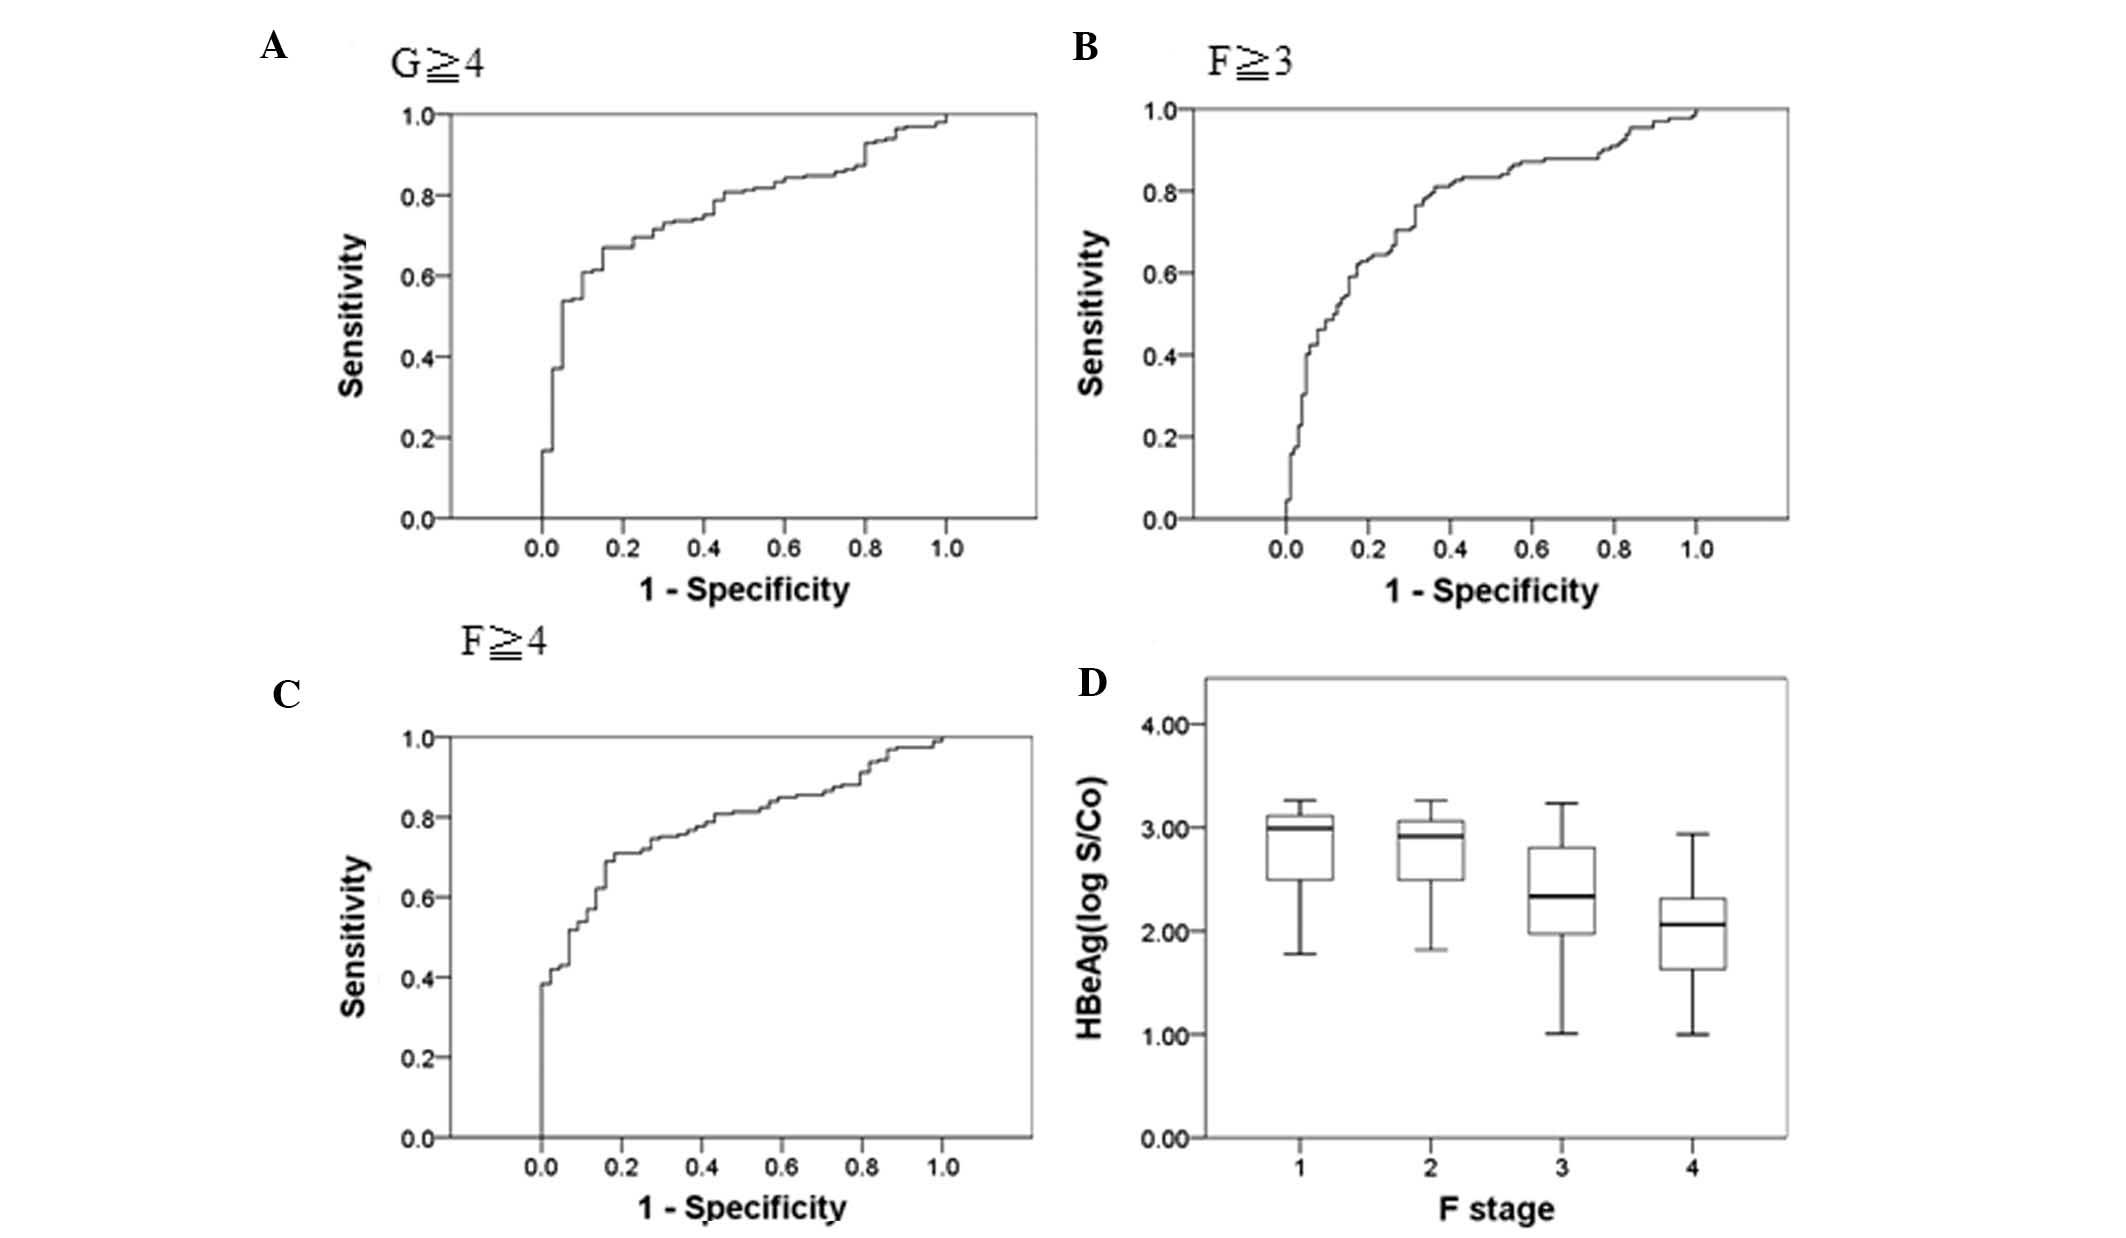
(Fig. 1D). Similarly, ROC curve
analysis revealed that the area under the curve was 0.77 (G≥4),
0.77 (F≥3) and 0.78 (F≥4), respectively (Fig. 2A–C), and the median HBeAg levels
(log10 S/Co) were 2.99, 2.91, 2.33 and 2.03, respectively (Fig. 2D).
| Table IIHBsAg and HBeAg levels distinguish
different stages of inflammation and fibrosis as measured by AUC
values. |
Table II
HBsAg and HBeAg levels distinguish
different stages of inflammation and fibrosis as measured by AUC
values.
| AUC (95% CI) | Youden index | Cut-off point | Sensitivity
(%) | Specificity
(%) |
|---|
| HBsAg |
| G≥4 | 0.73 (0.66,
0.81) | 0.460 | 3.76 | 68.53 | 77.50 |
| F≥3 | 0.72 (0.65,
0.78) | 0.344 | 4.20 | 51.52 | 82.86 |
| F≥4 | 0.74 (0.67,
0.81) | 0.449 | 3.75 | 69.95 | 75.00 |
| HBeAg |
| G≥4 | 0.77 (0.70,
0.84) | 0.520 | 2.43 | 67.00 | 85.00 |
| F≥3 | 0.77 (0.71,
0.83) | 0.451 | 2.47 | 76.52 | 68.57 |
| F≥4 | 0.78 (0.72,
0.85) | 0.530 | 2.42 | 68.91 | 84.09 |
Table III
presents the univariate and multivariate analyses of determinants
predicting cirrhosis. The univariate logistic regression model
indicated the following significant factors: Age, albumin, globin,
GGT, total bile acid, cholesterol, prothrombin time, platelet
count, INR, HBsAg, HBeAg, and HBV DNA (P<0.05). Variables with a
P<0.05 in the univariate analysis were selected and evaluated by
multivariate logistic regression models using a conditional forward
selection method. In addition, prothrombin time was excluded from
the final multivariate logistic regression model because of the
high correlation between prothrombin and INR. Multivariate logistic
regression indicated that age (OR: 1.071, P=0.001), INR (OR: 10958,
P<0.001), HBsAg (OR: 0.536, P=0.009) and HBeAg (OR: 0.532,
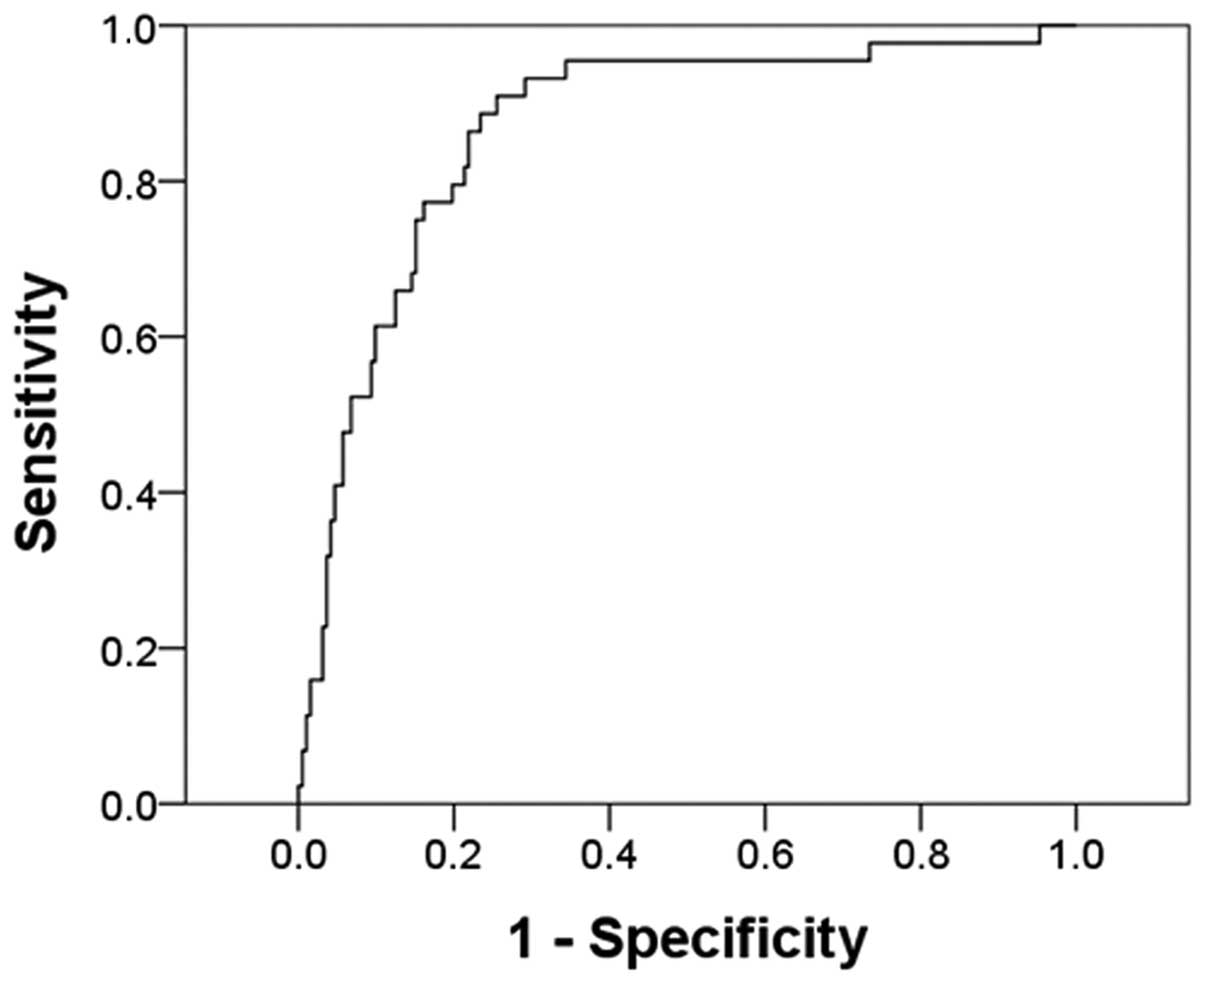
P=0.013) were significantly associated with cirrhosis. Based on
these data, variables identified by multivariate logistic
regression were used to construct the following formula for the
predictor model: Predictor model = −0.614 + 0.065 × log(age) −
0.623× log (HBsAg) − 0.631× log(HBeAg) + 9.302× log (INR). Fig. 3 shows the ROC curve from which the
cut-off point was selected. The AUC was 0.87 (P<0.001, 95% CI:
0.81 to 0.93). The cut-off point was designated as the probability
of (−1.89). Table IV presents the
sensitivity and specificity of the model. Using this cut-off point,
the likelihood of cirrhosis with a 88.64% sensitivity and 78.24%
specificity could be predicted. The PPV for predicting patients
with cirrhosis was 48.15%; however, the NPV for patients not having
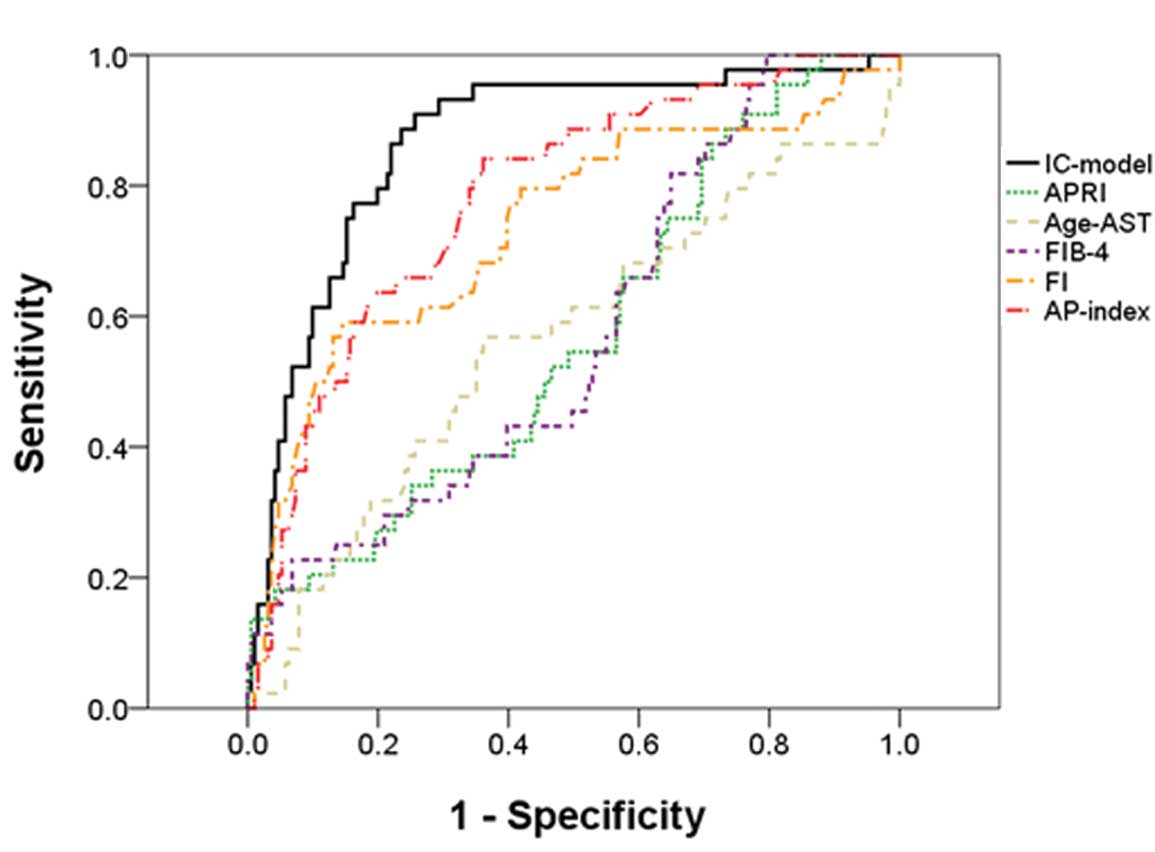
cirrhosis was 96.79%. Fig. 4 shows
the ROC curves of the IC model, APRI, age-AST model, FIB-4, FI, and
AP index for predicting cirrhosis. The results indicated that the
APRI (AUC=0.57, P=0.162), age-AST model (AUC=0.57, P=0.177) and
FIB-4 (AUC=0.58, P=0.115) were not good predictor models for
patients with cirrhosis. Further comparisons of the IC model with
the FI and AP index are shown in Table IV. The IC model had a
significantly improved predictive performance, as demonstrated by
the largest AUC (P<0.05).
| Table IIILogistic regression analysis to
determine factors significantly associated with cirrhosis in
patients with chronic hepatitis B virus infection. |
Table III
Logistic regression analysis to
determine factors significantly associated with cirrhosis in
patients with chronic hepatitis B virus infection.
| Univariate | Multivariate |
|---|
|
|
|
|---|
| Variables | OR (95% CI) | P-value | OR (95% CI) | P-value |
|---|
| Log Age
(years) | 1.077 (1.040,
1.115) |
<0.001a | 1.071 (1.027,
1.116) |
0.001a |
| Log Bilirubin
(μmol/l) | 1.603 (0.985,
2.611) | 0.058 | | |
| Log Albumin
(g/l) | 0.002 (0.001,
0.046) |
<0.001a | | |
| Log Globin
(g/l) | 26.32 (2.43,
285.17) |
0.007a | | |
| Log ALT (IU/l) | 0.977 (0.642,
1.486) | 0.914 | | |
| Log AST (IU/l) | 1.230 (0.814,
1.857) | 0.326 | | |
| Log GGT (IU/l) | 1.698 (1.108,
2.600) |
0.015a | | |
| Log Cholinesterase
(IU/l) | 0.427 (0.179,
1.104) | 0.054 | | |
| Log Total bile acid
(mmol/l) | 1.486 (1.081,
2.043) |
0.015a | | |
| Log Cholesterol
(mmol/l) | 0.116 (0.022,
0.606) |
0.011a | | |
| Prothrombin time
(s) | 2.169 (1.573,
2.990) |
<0.01a | | |
| Log White cell
count (109/l) | 0.366 (0.022,
6.168) | 0.485 | | |
| Log Platelet count
(1011/l) | 0.033 (0.003,
0.337) |
0.004a | | |
| Log INR | 5581 (159,
196075) |
<0.001a | 10958 (184,
652792) |
<0.001a |
| Log HBsAg
(IU/ml) | 0.463 (0.318,
0.675) |
<0.001a | 0.536 (0.323,
0.877) |
0.009a |
| LogHBeAg
(S/Co) | 0.381 (0.254,
0.572) |
<0.001a | 0.532 (0.323,
0.877) |
0.013a |
| Log HBV DNA
(IU/ml) | 0.773 (0.604,
0.988) |
0.040a | | |
| Table IVValidity of noninvasive models for
prediction of cirrhosis and comparison with IC-model. |
Table IV
Validity of noninvasive models for
prediction of cirrhosis and comparison with IC-model.
| Fibrosis test | Cut-off point | Sensitivity
(%) | Specificity
(%) | PPV (%) | NPV (%) | AUC (95% CI) | P-value (vs.
IC-model) |
|---|
| IC-model | −1.89 | 90.91 | 74.48 | 44.94 | 97.29 | 0.87
(0.81−0.93)a | |
| FI |
−1.5×10⁹ | 59.09 | 84.97 | 32.13 | 94.51 | 0.74
(0.65−0.83)a | 0.009 |
| AP index |
1.7×10⁻¹⁰ | 84.09 | 64.06 | 47.85 | 91.12 | 0.78
(0.71−0.86)a | 0.041 |
Discussion
In the present study, both the HBsAg and HBeAg were
evaluated as biomarkers to predict fibrosis in patients with CHB.
There was a negative and indirect correlation between the HBsAg and
HBeAg levels and liver inflammation and fibrosis in CHB patients
who were in the IC phase. A liver pathology-predicting model (the
IC model), which accurately and reliably predicted cirrhosis, was
developed for this study population.
The current understanding of the natural course of
CHB infection has been expanded by numerous research observations,
including: i) HBV replication persists throughout the course of
chronic HBV infection, ii) the host immune response has a pivotal
role in HBV-associated liver injury, and iii) the balance between
the host immune response and HBV replication is dynamic. The IT,
IC, LR and ENH phases of CHB are classified based on biochemical,
serological and virological characteristics, including serum ALT
levels, HBeAg serostatus and HBV DNA levels (30,31).
Patients in the IC phase are HBsAg positive for at least six
months, and HBeAg-positive patients have serum levels of HBV DNA
≥2000 IU/ml (~104 copies/ml) and ALT levels at least
twice the ULN (6,7). Patients with late childhood,
adolescence or adult-acquired CHB infection usually present in the
immunoactive phase with HBeAg positive chronic hepatitis and
exhibit elevated serum ALT and moderate to severe necroinflammation
with variable amounts of fibrosis in the liver biopsy.
Previous studies have reported that the median
levels of HBsAg among Asian and European carriers in the IC phase
were 4.03 and 4.37 log IU/ml, respectively (7,9).
These data were consistent with the present study, which showed a
median of HBsAg levels of 3.94 log IU/ml among the CHB patients of
the present study in the IC phase.
Levels of albumin, cholinesterase, cholesterol,
HBsAg and HBeAg all showed a negative correlation with liver
inflammation and fibrosis. These data were consistent with a recent
report showing that low serum HBsAg levels were associated with
moderate to severe fibrosis in HBeAg-positive CHB patients and a
serum HBsAg cutoff of 3.85 log IU/ml was predictive of fibrosis
severity in patients with hepatitis B or C virus (20). Previous reports have shown a strong
correlation between HBsAg and HBV DNA among Asian patients during
the immune clearance phase (9).
Based on these studies, it will be valuable to compare the efficacy
of HBsAg and HBeAg levels as non-invasive markers of liver
inflammation and fibrosis stages to that of HBV DNA.
The IC phase is characterized by flares of
aminotransferases, which occur as a result of immune-mediated lysis
of infected hepatocytes secondary to increased T-cell responses to
HBcAg and HBeAg (32,33). The duration of the IC phase, and
the frequency and severity of flares, have been shown to correlate
with the risk of cirrhosis (34).
The IC phase represents the period of symptomatic hepatitis, which
lasts for 3–4 weeks in patients with acute HBV infection. In
patients with chronic disease, the IC phase may persist for 10 or
more years, during which severe necroinflammation may result in
morphologically apparent fibrosis, leading to cirrhosis (35,36).
In the present study, a significant decrease in the HBsAg and HBeAg
levels with increasing liver damage suggested that liver injury is
mediated by the host cellular response to small epitopes of HBV
proteins, which is consistent with previous reports (36). HBsAg and HBeAg levels reflected the
role of the immune system in CHB patients in the present study;
however, the possibility of representation bias in this
single-centered study should be acknowledged, since the biopsied
patients were not randomly selected.
Although liver biopsy is currently the gold standard
in assessing liver histology, it is an invasive and expensive
procedure, making it imperative to develop accurate and
non-invasive alternatives. ROC curve analysis was used in the
present study to show that the AUC for HBsAg was 0.74 (F≥4) and the
AUC for HBeAg was 0.78 (F≥4). HBsAg and HBeAg levels were predicted
to be indirectly associated with the stage of fibrosis in CHB
patients in the IC phase by: i) A previous report showing that age
and INR were determinants of fibrosis progression in CHB and CHC
patients (37) and ii) a model
consisting of a combination of four variables (HBsAg, HBeAg, age
and INR) to distinguish between patients with and without
cirrhosis. A number of studies have explored the feasibility of
using non-invasive tests to predict cirrhosis. These include the
Fibroscan and FibroTest-ActiTest, galactose and methacetin breath
tests, TE, fibrotest, cirrhosis discriminant score, AST/ALT ratio,
APRI, FIB-4 and AP index (24–29).
However, certain tests are impractical to use in a clinical setting
since they require expensive instrumentation or may use less common
biochemical markers, including α2-macroglobulin, haptoglobin and
apolipoprotein A1, or the use of specialized software for
computations. By contrast, the IC model generated in the present
study combined routinely available laboratory test results along
with serum HBsAg and HBeAg levels to accurately predict cirrhosis
in treatment-naïve patients who are in the IC phase of HBV
infection. The IC model predicted cirrhosis in CHB patients in the
IC phase, with an AUC of 0.87, a sensitivity of 88.64%, a
specificity of 78.24%, a PPV of 48.15% and an NPV of 96.79%. This
data suggested that a combination of routinely used markers,
together with HBsAg and HBeAg levels, is able to reliably and
accurately predict the probability of liver cirrhosis. The IC model
also exhibited a significantly higher predictive performance as
compared with the FI and the AP index models.
It has been documented for numerous years that the
transition from the IT phase of an HBV infection to the IC phase is
caused by the activation of the immune system against virus
replication, which causes necro-inflammation within the liver. If
this immune reaction is short and effective, it may lead to: i)
Immune clearance of serum HBeAg and anti-HBeAg seroconversion with
complete recovery and eventual HBsAg loss and anti-HBsAg
seroconversion; ii) the transition to the inactive HBsAg positive,
HBeAg negative and anti-HBeAg positive carrier status associated
with the clearance of HBV-associated liver disease, namely recovery
from HBeAg positive CHB. If the immune reaction is long lasting and
ineffective, it may lead to anti-HBeAg seroconversion and
persistence of liver inflammation. This can result in progressive
fibrosis, eventually evolving to cirrhosis and HCC through the
progression of HBeAg positive CHB or reactivation of the HBV
infection, namely HBeAg negative CHB. The decline of serum HBsAg
and HBeAg can therefore be associated with either complete recovery
and cure or progressive liver disease.
Cross-sectional retrospective studies require
longitudinal follow-up, since an HBV-infection is a highly dynamic
disease. One major limitation of the present study is that all
consecutive patients in the IC phase were not followed up for long
enough (five years). With a longer-term follow-up, all consecutive
patients would have been divided into: i) Those who seroconverted
to anti-HBeAg, eventually progressing to the inactive HBsAg carrier
condition or to HBeAg negative CHB, and ii) those who did not
persist in a progressive HBeAg positive CHB. The analysis of the
baseline levels of HBsAg and HBeAg and their ratios would have been
correlated with outcomes, histology and baseline, and possibly
histology or a surrogate test of liver fibrosis (fisbroscan,
fibrotest APRI, other) at the end of several years of follow-up.
Furthermore, the current data did not validate the non-invasive
model in a separate group of patients. The clinical relevance of
these findings is difficult to observe, since all patients are
required to later be administered antiviral therapy according to
European Association for the Study of the Liver (EASL) guidelines
(38).
In conclusion, HBsAg and HBeAg levels exhibited a
negative correlation with liver inflammation and fibrosis in
patients with CHB in the IC phase, and can be considered as
potential markers which predict significant necroinflammation and
fibrosis. HBsAg and HBeAg levels may additionally be used as a
non-invasive predictors of the degree of hepatic fibrosis. The
present findings have important implications, particularly in
patients who refuse to undergo liver biopsy or who have
contraindications. The IC model, which uses routinely assessed
markers in combination with HBsAg and HBeAg levels, reliably
predicted the probability of liver cirrhosis. It is important to
validate these data in larger, prospective studies.
References
|
1
|
Liang X, Bi S, Yang W, et al:
Epidemiological serosurvey of hepatitis B in China - declining HBV
prevalence due to hepatitis B vaccination. Vaccine. 27:6550–6557.
2009. View Article : Google Scholar : PubMed/NCBI
|
|
2
|
Lok AS: Chronic hepatitis B. N Engl J Med.
346:1682–1683. 2002. View Article : Google Scholar : PubMed/NCBI
|
|
3
|
Shi YH and Shi CH: Molecular
characteristics and stages of chronic hepatitis B virus infection.
World J Gastroenterol. 15:3099–3105. 2009. View Article : Google Scholar : PubMed/NCBI
|
|
4
|
Blumberg BS, Alter HJ and Visnich S: A
“new” antigen in leukemia sera. JAMA. 191:541–546. 1965. View Article : Google Scholar : PubMed/NCBI
|
|
5
|
Rotman Y, Brown TA and Hoofnagle JH:
Evaluation of the patient with hepatitis B. Hepatology. 49:S22–27.
2009. View Article : Google Scholar : PubMed/NCBI
|
|
6
|
Cornberg M, Protzer U, Dollinger MM, et
al: The German guideline for the management of hepatitis B virus
infection: short version. J Viral Hepat. 15:1–21. 2008. View Article : Google Scholar : PubMed/NCBI
|
|
7
|
Jaroszewicz J, Calle Serrano B, Wursthorn
K, et al: Hepatitis B surface antigen (HBsAg) levels in the natural
history of hepatitis B virus (HBV)-infection: a European
perspective. J Hepatol. 52:514–522. 2010. View Article : Google Scholar : PubMed/NCBI
|
|
8
|
Whitehead TP, Thorpe GHG, Carter TJN,
Groucutt C and Kricka LJ: Enhanced luminescence procedure for
sensitive determination of peroxidase labelled conjugates in
immunoassay. Nature. 305:1581983. View
Article : Google Scholar
|
|
9
|
Nguyen T, Desmond P and Locarnini S: The
role of quantitative hepatitis B serology in the natural history
and management of chronic hepatitis B. Hepatol Int. 3:5–15. 2009.
View Article : Google Scholar : PubMed/NCBI
|
|
10
|
Dwivedi M, Misra SP, Misra V, et al:
Seroprevalence of hepatitis B infection during pregnancy and risk
of perinatal transmission. Indian J Gastroenterol. 30:66–71. 2011.
View Article : Google Scholar : PubMed/NCBI
|
|
11
|
Ott JJ, Stevens GA and Wiersma ST: The
risk of perinatal hepatitis B virus transmission: hepatitis B e
antigen (HBeAg) prevalence estimates for all world regions. BMC
Infect Dis. 12:1312012. View Article : Google Scholar : PubMed/NCBI
|
|
12
|
Chen CH, Lee CM, Hung CH, et al: Hepatitis
B virus genotype B results in better immediate, late and sustained
responses to peginterferon-alfa in hepatitis-B-e-antigen-positive
patients. J Gastroenterol Hepatol. 26:461–468. 2011. View Article : Google Scholar : PubMed/NCBI
|
|
13
|
Perrillo R, Mimms L, Schechtman K, Robbins
D and Campbell C: Monitoring of antiviral therapy with quantitative
evaluation of HBeAg: a comparison with HBV DNA testing. Hepatology.
18:1306–1312. 1993. View Article : Google Scholar : PubMed/NCBI
|
|
14
|
Yen YH, Lu SN, Chen CH, et al: Changes in
serum hepatitis B e antigen (HBeAg) levels associated with the
emergence of YMDD mutants in HBeAg non-seroconverted patients
during lamivudine therapy. Liver Int. 27:1349–1355. 2007.
View Article : Google Scholar : PubMed/NCBI
|
|
15
|
Cadranel JF, Rufat P and Degos F:
Practices of liver biopsy in France: results of a prospective
nationwide survey. For the Group of Epidemiology of the French
Association for the Study of the Liver (AFEF). Hepatology.
32:477–481. 2000. View Article : Google Scholar : PubMed/NCBI
|
|
16
|
Chan HL, Wong VW, Wong GL, et al: A
longitudinal study on the natural history of serum hepatitis B
surface antigen changes in chronic hepatitis B. Hepatology.
52:1232–1241. 2010. View Article : Google Scholar : PubMed/NCBI
|
|
17
|
Gupta E, Kumar A, Choudhary A, Kumar M and
Sarin SK: Serum hepatitis B surface antigen levels correlate with
high serum HBV DNA levels in patients with chronic hepatitis B: a
cross-sectional study. Indian J Med Microbiol. 30:150–154. 2012.
View Article : Google Scholar : PubMed/NCBI
|
|
18
|
Seto WK, Wong DK, Fung J, et al: High
hepatitis B surface antigen levels predict insignificant fibrosis
in hepatitis B e antigen positive chronic hepatitis B. PLoS One.
7:e430872012. View Article : Google Scholar : PubMed/NCBI
|
|
19
|
Liu SQ, Zhu XJ, Sun XH, Li M and Gao YQ:
Characteristic of liver pathology in HBeAg-positive and
HBeAg-negative chronic hepatitis B patients with mildly elevated
ALT. Zhonghua Gan Zang Bing Za Zhi. 20:348–352. 2012.(In Chinese).
PubMed/NCBI
|
|
20
|
Martinot-Peignoux M, Carvalho-Filho R,
Lapalus M, et al: Hepatitis B surface antigen serum level is
associated with fibrosis severity in treatment-naïve, e
antigen-positive patients. J Hepatol. 58:1089–1095. 2013.
View Article : Google Scholar : PubMed/NCBI
|
|
21
|
Liaw YF, Kao JH, Piratvisuth T, et al:
Asian-Pacific consensus statement on the management of chronic
hepatitis B: a 2012 update. Hepatol Int. 6:531–561. 2012.
View Article : Google Scholar
|
|
22
|
Scheuer PJ, Standish RA and Dhillon AP:
Scoring of chronic hepatitis. Clin Liver Dis. 6:335–47. 2002.
View Article : Google Scholar : PubMed/NCBI
|
|
23
|
The programme of prevention and cure for
viral hepatitis. Parasitology ASoIDa, Medical aCSoHoC, Association,
. Zhonghua Ganzangbing Zazhi. 8. pp. 324–329. 2000
|
|
24
|
Kim SM, Sohn JH, Kim TY, et al: Comparison
of various noninvasive serum markers of liver fibrosis in chronic
viral liver disease. Korean J Hepatol. 15:454–463. 2009.(In
Korean). View Article : Google Scholar : PubMed/NCBI
|
|
25
|
Lee IC, Chan CC, Huang YH, et al:
Comparative analysis of noninvasive models to predict early liver
fibrosis in hepatitis B e Antigen-negative Chronic Hepatitis B. J
Clin Gastroenterol. 45:278–285. 2011. View Article : Google Scholar
|
|
26
|
Tong MJ, Hsu L, Hsien C, et al: A
comparison of hepatitis B viral markers of patients in different
clinical stages of chronic infection. Hepatol Int. 4:516–522. 2010.
View Article : Google Scholar : PubMed/NCBI
|
|
27
|
Park SH, Kim CH, Kim DJ, et al:
Development and validation of a model to predict advanced fibrosis
in chronic hepatitis B virus-infected patients with high viral load
and normal or minimally raised ALT. Dig Dis Sci. 56:1828–1834.
2011. View Article : Google Scholar
|
|
28
|
Poynard T, Ngo Y, Marcellin P, et al:
Impact of adefovir dipivoxil on liver fibrosis and activity
assessed with biochemical markers (FibroTest-ActiTest) in patients
infected by hepatitis B virus. J Viral Hepat. 16:203–213. 2009.
View Article : Google Scholar : PubMed/NCBI
|
|
29
|
Stibbe KJ, Verveer C, Francke J, et al:
Comparison of non-invasive assessment to diagnose liver fibrosis in
chronic hepatitis B and C patients. Scand J Gastroenterol.
46:962–972. 2011. View Article : Google Scholar : PubMed/NCBI
|
|
30
|
Liaw YF, Leung N, Kao JH, et al:
Asian-Pacific consensus statement on the management of chronic
hepatitis B: a 2008 update. Hepatol Int. 2:263–283. 2008.
View Article : Google Scholar
|
|
31
|
European Association For The Study Of The
Liver. EASL Clinical Practice Guidelines: management of chronic
hepatitis B. J Hepatol. 50:227–242. 2009. View Article : Google Scholar
|
|
32
|
Tsai SL, Chen PJ, Lai MY, et al: Acute
exacerbations of chronic type B hepatitis are accompanied by
increased T cell responses to hepatitis B core and e antigens.
Implications for hepatitis B e antigen seroconversion. J Clin
Invest. 89:87–96. 1992. View Article : Google Scholar : PubMed/NCBI
|
|
33
|
Chu CM and Liaw YF: Intrahepatic
distribution of hepatitis B surface and core antigens in chronic
hepatitis B virus infection. Hepatocyte with cytoplasmic/membranous
hepatitis B core antigen as a possible target for immune
hepatocytolysis. Gastroenterology. 92:220–225. 1987.PubMed/NCBI
|
|
34
|
McMahon BJ, Holck P, Bulkow L and Snowball
M: Serologic and clinical outcomes of 1536 Alaska Natives
chronically infected with hepatitis B virus. Ann Intern Med.
135:759–768. 2001. View Article : Google Scholar : PubMed/NCBI
|
|
35
|
Friedman SL: Liver fibrosis - from bench
to bedside. J Hepatol. 38:S38–S53. 2003. View Article : Google Scholar
|
|
36
|
Lee WM: Hepatitis B virus infection. N
Engl J Med. 337:1733–1745. 1997. View Article : Google Scholar : PubMed/NCBI
|
|
37
|
Imperial JC: Natural history of chronic
hepatitis B and C. J Gastroenterol Hepatol. 14:S1–S5. 1999.
View Article : Google Scholar : PubMed/NCBI
|
|
38
|
European Association for the Study of the
Liver. EASL clinical practice guidelines: Management of chronic
hepatitis B virus infection. J Hepatol. 57:167–185. 2012.PubMed/NCBI
|