Introduction
Liver fibrosis is a common result of chronic liver
damage, which is caused by factors such as infections, toxins and
autoimmune disorders, as well as cholestatic and metabolic diseases
(1). At present, the global
population is threatened by chronic liver diseases, with the
prevalence of hepatitis B virus (HBV) infection particularly high
in China. According to the World Health Organisation, >350
million individuals are chronically infected with HBV, which is
responsible for ~5.8 million fatalities from decompensate cirrhosis
or hepatocellular carcinoma annually (2,3).
However, accumulating evidence suggests that liver fibrosis is
reversible and that recovery from cirrhosis is possible (4). Chronic liver disease involves the
replacement of the hepatic parenchyma with extracellular matrix,
The prognosis and management of chronic liver disease depend
largely on the extent and progression of hepatic fibrosis (1). Liver biopsy (LB) remains the ‘gold
standard’ for liver fibrosis assessment (5). However, LB has several major
limitations. In removing ~1/50,000 total liver volume (6), LB does not completely evaluate the
overall status of the liver. In addition, LB is an invasive
procedure that may result in serious complications (5).
A number of studies have revealed that liver
stiffness is associated with the degree of liver fibrosis. Over the
past decade, non-invasive ultrasound-based diagnostic methods,
including transient elastography (TE; FibroScan®;
Echosens, Paris, France), real-time elastography (Hitachi, Tokyo,
Japan), supersonic shear wave elastography and acoustic radiation
force impulse (ARFI) elastography, have been developed to replace
invasive LB. TE was the first ultrasound-based elastographic method
developed for liver fibrosis evaluation in patients with chronic
hepatitis C and other etiologies of chronic hepatopathy (7). In recent years, ARFI imaging has been
used as a novel ultrasound-guided elastographic method to predict
liver fibrosis. In contrast to TE, ARFI permits measurements in
well-defined areas of the liver tissue (8). ARFI may offer superior and more
detailed diagnostic options than TE, which may only be applied in a
standardised measuring position without two-dimensional (2D) image
control (9).
Virtual Touch Tissue Quantification (VTQ) is the
first available technique developed to implement ARFI. The method
has recently been introduced using the commercial US scanner Acuson
S2000™ (Siemens Healthcare, Erlangen, Germany) and offers the
possibility of performing quantitative measurement of liver
parenchyma elasticity during conventional US evaluations without
requiring additional transducers or other equipment (7). In the present study, the diagnostic
accuracy of VTQ (using Acuson S2000™) for predicting fibrosis
severity in rats with hepatitis fibrosis, compared with that of LB,
was investigated.
Materials and methods
Animal model
Experiments were performed in male Sprague-Dawley
rats, aged eight weeks, weighing 180–210 g, which were provided by
the Guangdong Medical Laboratory Animal Centre (Guangzhou, China).
Hypodermic injections of thioacetamide (TAA; Kemiou Chemical
Reagent Co. Ltd., Tianjin, China) in physiological saline (Sun
Yat-sen University, Guangzhou, China) were administered twice a
week to induce liver fibrosis. The study was conducted in strict
accordance with the recommendations in the Guide for the Care and
Use of Laboratory Animals of the National Institutes of Health
(Bethesda, MA, USA). The animal use procedure was reviewed and
approved by the Institutional Animal Care and Use Committee of
Guangzhou First People’s Hospital, (Guangzhou Medical University,
Guangzhou, China).
TAA saline solution (4%) was subcutaneously injected
in the abdominal wall near the hind legs. An initial dose (1 ml) of
the solution was injected to induce modeling, followed by
subsequent injections (200 mg/kg) twice a week. The majority of the
animals reached liver fibrosis phase 2 after week 5, then reached
phases 3 and 4 on week 9. In total, >95% animals reached a
cirrhotic state after week 12. Liver specimens from the rats were
obtained on weeks 5, 9 and 12.
Elastography
Following successful modeling, the rats were
examined using Acuson S2000™ Color Doppler ultrasonography (Siemens
Healthcare) on weeks 5, 9 and 12. A 9L4 high-frequency probe with a
frequency of 9 MHz was used. Rat hair was subsequently removed
under ether anesthesia. The rats were then placed in a supine
position on a mounting plate. The examined site region of interest
(ROI) was the right lobe of the liver tissue, avoiding the lobe
boundary and the large vessels. Semi-quantitative analysis (eSie
Touch™ elasticity imaging; Siemens Healthcare) was used to assess
the elastic stiffness to ensure a quality figure (QF) value of ≥45.
Semi-quantitative scoring criteria for this study were produced by
Yang et al (10)
(Department of Ultrasonic Center, Tenth People’s Hospital, Tongji
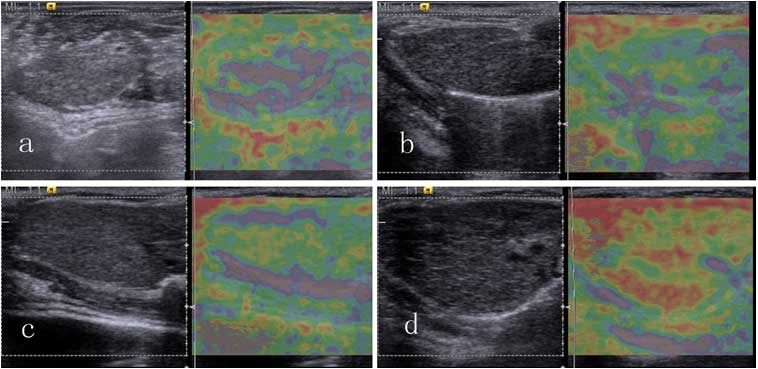
University, Shanghai, China). The following five-point scale grade
reference was designed by Professor Ei Ueno (University of Tsukuba,
Tsukuba, Japan) (11): 1, lesion
completely colored pink; 2, lesion area mainly colored purple, with
a small amount of green; 3, lesion area mainly colored green, with
a small amount of yellow; 4, lesion area colored yellow, with a
small amount of red; and 5, lesion area mainly colored red, with a
small amount of yellow (Fig. 1).
VTQ was used to measure the transverse shear wave velocity (Vs
value) of the organ. The standard deviation in stiffness
measurements is reduced with increasing numbers of measurements
(12), therefore, the median
stiffness values were recorded subsequent to seven measurements,
instead of the mean values. The final sonogram and numerical data
were collected and stored in a computer for statistical
analysis.
Specimen collection
A total of 10 rats randomly selected from the
modeling group and four rats from the control group were examined
on weeks 5 and 9 using ultrasound. The rats were deeply
anesthetized with phenobarbital sodium (Guangdong Bangmin
Pharmaceutical Co., Ltd, Jiangmen, China), laparotomized and
sacrificed. The liver mid-lobes were rapidly clipped, fixed in 10%
neutral formalin-fixed solution (Guangzhou Wexis Biotech, Ltd,
Guangzhou, China), dehydrated in gradient alcohol and embedded in
paraffin (Shanghai Huntz Enterprises Co., Ltd, Shanghai, China).
The lobes were then conventionally sliced, dewaxed and stained with
hematoxylin and eosin (Guangzhou Wexis Biotech, Ltd). The
pathological states of the liver tissues were observed under an
optical microscope (Olympus ix51; Olympus Corp., Tokyo, Japan) and
classified according to the Court of Pathology (Department of
Pathology, Guangzhou First People’s Hospital, Guangzhou, China).
The remaining animals were sacrificed with the same methods on week
12. Animal care, surgery and sacrifice procedures used in the
present study were approved by the Animal Care and Use Committee of
Guangzhou First People’s Hospital, Guangzhou Medical University
(Guangzhou, China).
Pathological diagnostic criteria
The following characteristics were examined: Liver
cell degeneration, necrosis, inflammatory cell infiltration,
fibrosis, collagen deposition, fibrous septa formation,
pseudolobule formation, portal area structure and fibrotic stage,
as determined by the well-validated METAVIR scoring system
(13). This scoring system
assesses fibrotic stage on a five-point scale: F0, no fibrosis; F1,
portal fibrosis without septa; F2, portal fibrosis with rare septa;
F3, numerous septa without cirrhosis; and F4, cirrhosis.
Statistical analysis
The experimental data were analyzed using the SPSS
13.0 statistical software (SPSS, Inc., Chicago, IL, USA). With
numerical variables, the mean value and standard deviation (SD)
were calculated. Spearman’s rank correlation coefficient was used
to assess the correlation between the findings of the histological
and elastographic methods.
The diagnostic performances of eSie Touch™
elasticity imaging and ARFI elastography were assessed using
receiver operating characteristic (ROC) curves. These curves were
plotted to detect the following: Fibrosis and significant fibrosis
(F ≥ 1 and 2), severe fibrosis (F≥3) and cirrhosis (F=4). Optimal
cut-off values were selected to allow the highest sum of
sensitivity and specificity. Confidence intervals (95%) were
calculated for each predictive method. P<0.05 was considered to
indicate a statistically significant difference for each
procedure.
Results
Modeling results
A total of 30 cases liver fibrosis were successfully
induced and the overall modeling success rate was 86% (Table I). Three out of the 35 rats
succumbed during the modeling process and fibrosis was not
successfully induced in two cases. All liver specimens in the
control group appeared as normal liver tissues. In the modeling
group, 10 cases scored F1 or F2, 10 cases scored F3 and 10 cases
scored F4.
 | Table ILiver fibrosis modeling results for
rats with either 5, 9 or 12 weeks thioacetamide treatment. |
Table I
Liver fibrosis modeling results for
rats with either 5, 9 or 12 weeks thioacetamide treatment.
| Treatment duration
(weeks) | Normal (n) | F1/F2 (n) | F3 (n) | F4 (n) | Mortality (n) | Success rate (%) |
|---|
| 5 | 2 | 8 | 1 | 0 | 1 | 75 |
| 9 | 0 | 2 | 7 | 3 | 1 | 92 |
| 12 | 0 | 0 | 2 | 7 | 1 | 90 |
| Total | 2 | 10 | 10 | 10 | 3 | 86a |
Pathological results
General observation
The liver weights of the control, F1–2, F3 and F4
groups were 11.3±0.48, 12.8±0.79, 15.3±1.57 and 9.2±1.55 g,
respectively. The difference between groups was tested using
one-way analysis of variance, and found to be statistically
significant (P<0.001).
Liver general appearance
The livers of the control group rats were rosy, with
smooth surfaces, indurations imperceptible to touch and good
elasticity. Examination of the tangent planes revealed a normal red
color. The livers of the F1 and F2 group rats appeared slightly
grey and had a matte-like surface with fine particles, an absence
of marked indurations to touch and a marginally greater hardness.
Tangent plane analysis revealed an even red color, with fine grainy
feeling. The livers of the F3 group rats were dark red, rough and
exhibited high hardness. The surfaces were covered with particle
protrusions of diameter marginally <1 mm, with visible small
nodules observed on the tangent planes, almost evenly distributed
throughout the livers with a dark red color. The livers of the F4
group mice were markedly smaller than those of the other groups.
The surfaces were covered with stiff, uneven projections, ranging
between 1 mm and 3 mm, with a lighter color. Indurations and bumps
were perceptible by touch. Tangent plane examination revealed
scattered distributions of indurations of varied sizes. The tissue
color surrounding the indurations was markedly lighter than that of
normal liver tissue.
Imaging results
The 10 cases in the control group had an average
score of 2 points; group F1/F2 had 3 [80% (8/10)] and 4 [20%
(2/10)] points; group F3 had 2 [10% (1/10)], 3 [30% (3/10)] and 4
[60% (6/10)] points; and group F4 had 5 points. The eSie Touch™
elasticity imaging analysis results showed 85% total accuracy
compared with the pathological results as a gold standard (Table II).
| Table IIeSie Touch™ elasticity imaging
data. |
Table II
eSie Touch™ elasticity imaging
data.
| | Pathological
results | |
|---|
| |
| |
|---|
| Score | Normal | F1–2 | F3 | F4 | Total |
|---|
| 2 | 10 | 0 | 1 | 0 | 11 |
| 3 | 0 | 8 | 3 | 0 | 11 |
| 4 | 0 | 2 | 6 | 0 | 8 |
| 5 | 0 | 0 | 0 | 10 | 10 |
| Total | 10 | 10 | 10 | 10 | 40 |
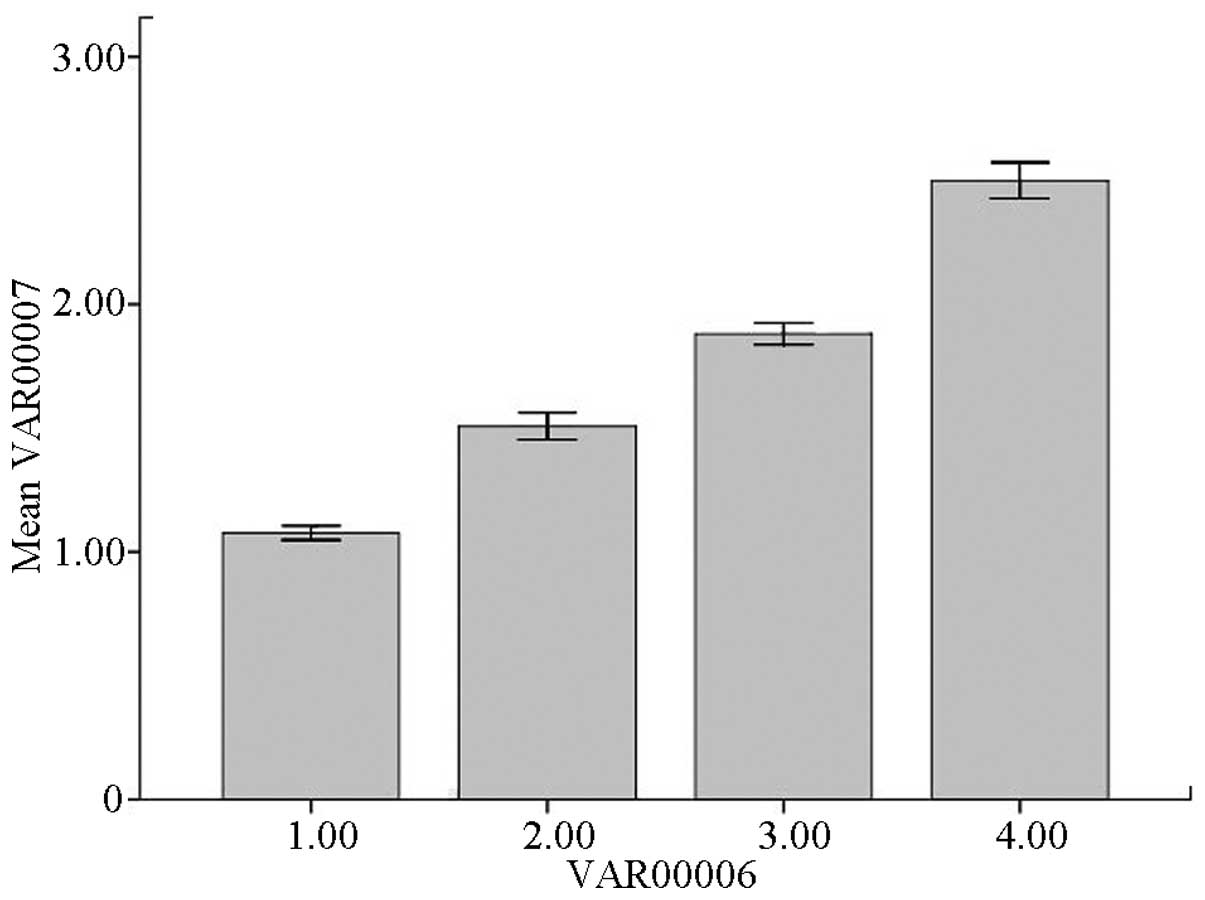
VTQ results and pathological standard
correlation analysis
The VTQ value difference between the F1 and F2
groups was not statistically significant and the appearances of
these two stages were not pathologically distinct. Thus, F1 and F2
were merged as one group. The VTQ values of the 40 rats ranged
between 0.69 and 3.56. The mean VTQ values for the control, F1/F2,
F3 and F4 groups were 1.08±0.12, 1.51±0.22, 1.88±0.18 and
2.50±0.30, respectively, with statically significant differences
between any two groups (P<0.05; Table III).
| Table IIIVirtual touch tissue quantification
data. |
Table III
Virtual touch tissue quantification
data.
| Group | Minimum | Maximum | Meana |
|---|
| Control | 0.69 | 1.32 | 1.08±0.12 |
| F1/F2 | 0.79 | 2.09 | 1.51±0.22 |
| F3 | 1.52 | 2.47 | 1.88±0.18 |
| F4 | 1.95 | 3.56 | 2.50±0.30 |
These results demonstrate that ARFI reliably
identified advanced hepatic fibrosis but was insufficient to
discriminate between the different stages of minimal and moderate
fibroses. Diagnostic accuracy for fibrosis F1 and F2 has been
previously demonstrated to be impaired by a marked variation in the
shear-wave velocities in these patients (12). Spearman’s rank correlation was used
to analyze data that were not normally distributed. This revealed a
correlation coefficient of 0.969 (P<0.001) between the Vs values
and the pathological results (Table
IV).
| Table IVCorrelation analysis between VTQ and
pathological results. |
Table IV
Correlation analysis between VTQ and
pathological results.
| Pathological
result | VTQ Vs value |
|---|
| Correlation
coefficient | 0.969a |
| Significance
(two-tailed) | <0.001 |
| n | 40 |
eSie Touch™ elasticity imaging results
and pathological standard correlation analysis
Using the eSie Touch™ semi-quantitative scoring
criteria, the 10 cases in the control group all had a score of 2
points; the F1/F2 group had scores of 3 points [80% (8/10)] and 4
points [20% (2/10)]; the F3 group had scores of 2 points [10%
(1/10)], 3 points [30% (3/10)] and 4 points [60% (6/10)]; and the
cases in the F4 group all had a score of 5 points (Table II). The eSie Touch™ elasticity
imaging analysis results had 85% total accuracy compared with the
gold-standard pathological results. Spearman’s rank correlation
tests demonstrated a correlation coefficient of 0.913 (P<0.001)
between the elasticity scores and pathological results (Table V).
| Table VCorrelation analysis of elasticity
and pathological standard scores. |
Table V
Correlation analysis of elasticity
and pathological standard scores.
| Fibrosis assessment
method | Parameter | Elasticity
score | Pathology type |
|---|
| Elasticity
score | Correlation
coefficient significance (two-tailed) | 1.000 | 0.913a <0.001 |
| N | 40 | 40 |
| Pathological
type | Correlation
coefficient significance (two-tailed) | 0.913a <0.001 | 1.000 |
| N | 40 | 40 |
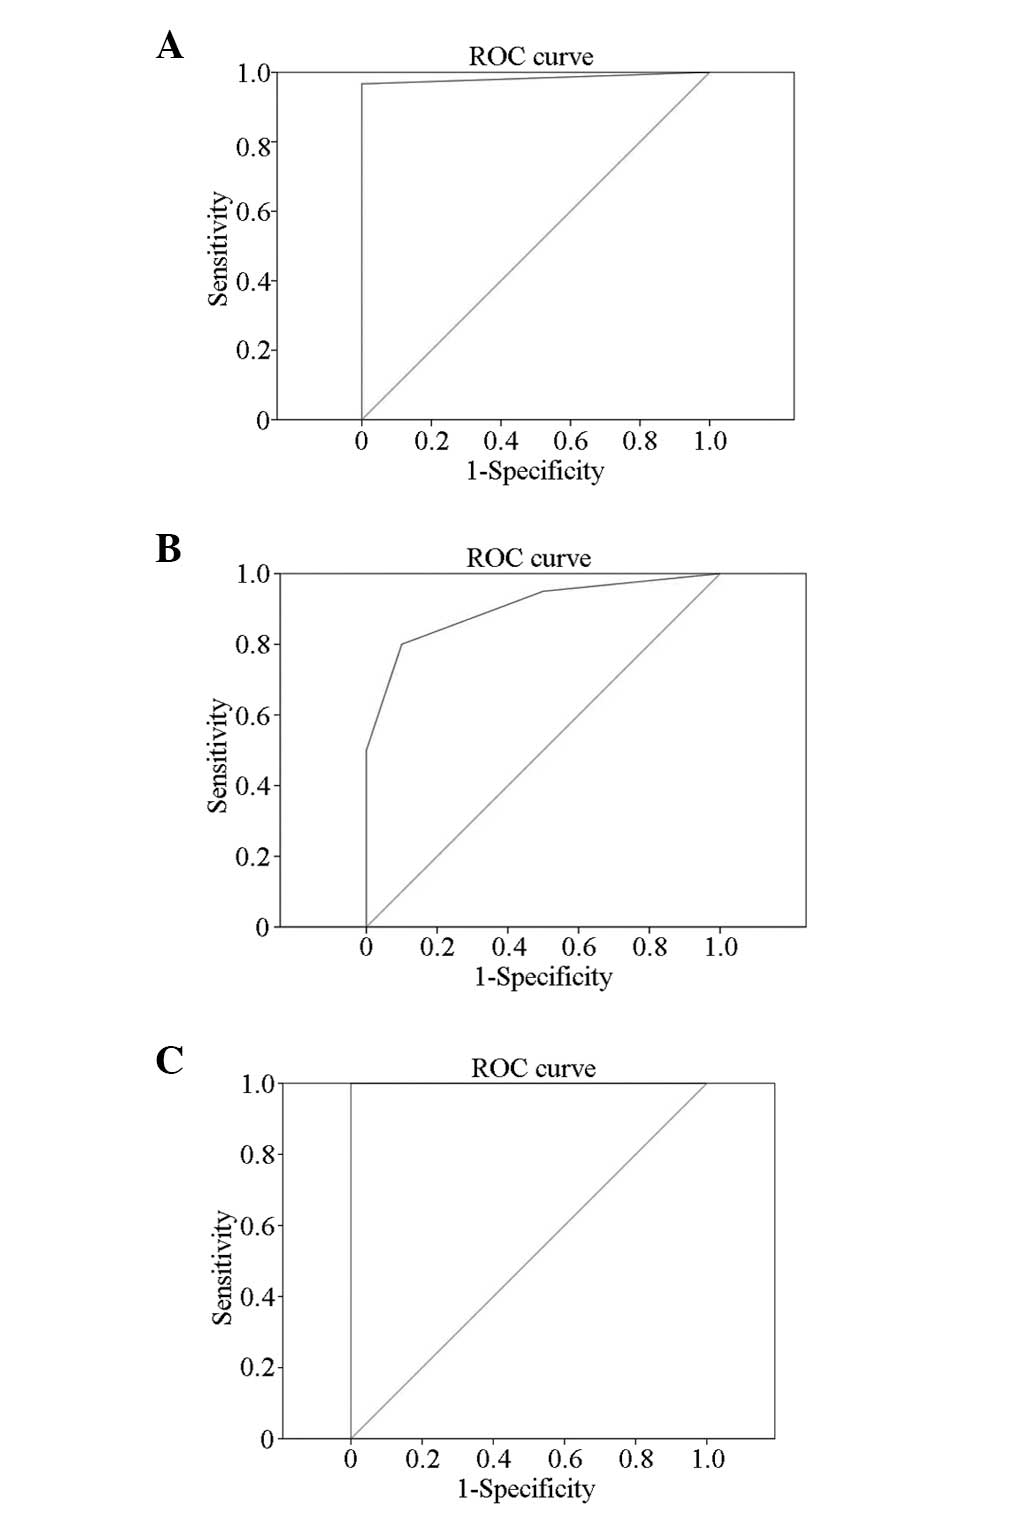
ROC analysis
ROC analyses were conducted using VTQ and LB staging
results as the gold standard, with F ≥ F1/F2, F3 and F4 as
different endpoint packets. The ROC curves were drawn with the VTQ
results as quantitative parameters. The maximum total sensitivity
and specificity values were used to determine the critical value of
the degree of liver fibrosis to analyze the diagnosic efficiency of
VTQ (Fig. 2). The results were as
follows: F ≥ F1/F2: Area under ROC (AUROC) is 1 (P<0.001) and
the best cut-off point is 1.250 (when Vs >1.250, the
pathological grading is ≥F1/F2); F ≥ F3: AUROC is 1 (P<0.001)
and the best cut-off point is 1.685 (when Vs >1.685, the
pathological grading is ≥F3); and F4: AUROC is 1 (P<0.001) and
the best cut-off point is 2.166 (when Vs >2.166, the
pathological grading is cirrhosis).
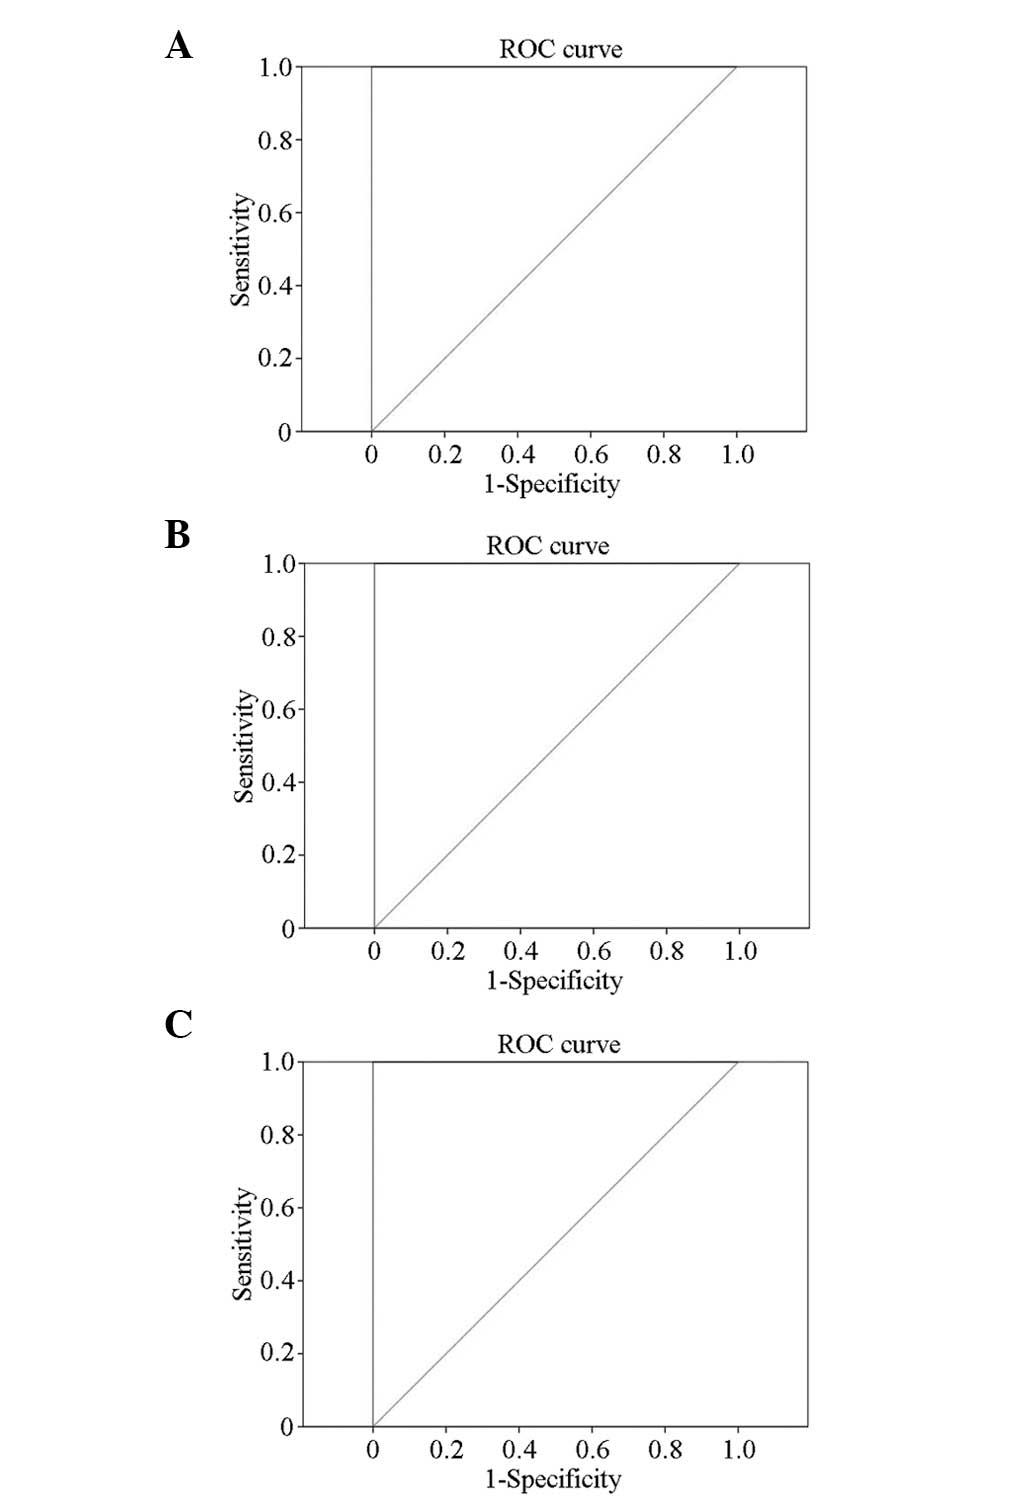
ROC analyses were also conducted using eSie Touch™
elasticity imaging, with LB staging results as the gold standard
(Fig. 3), and the following
results were obtained: F ≥ F1/F2: AUROC is 0.983 (P<0.001) and
the best cut-off point is 2.5 (when the elasticity score >2.5,
the pathological grading is ≥F1/F2); F ≥ F3: AUROC is 0.903
(P<0.001) and the best cut-off point is 3.5 (when the elasticity
score >3.5, the pathological grading is ≥F3); F4: AUROC is 1
(P<0.001) and the best cut-off point is 4.5 (when the elasticity
score >4.5, the pathological grading is cirrhosis).
Effect contrast between eSie Touch™
elasticity imaging and VTQ
The eSie Touch™ elasticity imaging and VTQ results
were divided into different pathological types according to the
previously determined diagnostic boundary values and compared with
the gold standard pathological results (Table VI). The accuracy rate of eSie
Touch™ elasticity imaging was 85%, whereas that of VTQ was 100%.
The VTQ values of the control, F1/F2, F3 and F4 groups were
aggregately distributed and distinguishable from each other
(Fig. 4).
| Table VIResults of eSie Touch™ elasticity
imaging and VTQ. |
Table VI
Results of eSie Touch™ elasticity
imaging and VTQ.
| Pathological
results (Gold standard) | eSie Touch™
elasticity imaging prediction | VTQ prediction |
|---|
|
|
|---|
| Normal | F1–2 | F3 | F4 | Normal | F1–2 | F3 | F4 |
|---|
| Normal (n) | 10 | 0 | 0 | 0 | 10 | 0 | 0 | 0 |
| (%) | 25.00 | 0.00 | 0.00 | 0.00 | 25.00 | 0.00 | 0.00 | 0.00 |
| F1–2 (n) | 0 | 8 | 2 | 0 | 0 | 10 | 0 | 0 |
| (%) | 0.00 | 20.00 | 5.00 | 0.00 | 0.00 | 25.00 | 0.00 | 0.00 |
| F3 (n) | 1 | 3 | 6 | 0 | 0 | 0 | 10 | 0 |
| (%) | 2.50 | 7.50 | 15.00 | 0.00 | 0.00 | 0.00 | 25.00 | 0.00 |
| F4 (n) | 0 | 0 | 0 | 10 | 0 | 0 | 0 | 10 |
| (%) | 0.00 | 0.00 | 0.00 | 25.00 | 0.00 | 0.00 | 0.00 | 25.00 |
Discussion
Over the past decade, various groups worldwide have
made considerable effort to establish reliable and reproducible
non-invasive markers of liver fibrosis. In recent years, several
studies have assessed the value of ARFI elastography to evaluate
liver fibrosis in chronic hepatopathy (7,14,15).
In contrast to LBs, in which analysis is limited to
a single core sample, ARFI may be used to noninvasively measure
stiffness at multiple points inside the liver. The variation in the
excitation location and focal point allows the construction of
stiffness images revealing the spatial distribution of shear
moduli. Therefore, ARFI has the potential to provide additional
information with regard to the spatial distribution of liver
stiffness, which may also be diagnostically relevant.
The Siemens ACUSON S2000 with eSie Touch™ elasticity
and VTQ imaging technology was used in the present study. The eSie
Touch™ elasticity imaging technology was established based on
ordinary ultrasound diagnostic technology. The low-frequency and
low-amplitude vibration wave ultrasonic transducer probe generates
an elastic shear wave, the wave velocity of which provides
information regarding liver stiffness. Liver tissue fibrosis
increases liver hardness and changes liver elasticity, which
provides the theoretical basis for the possibility of elasticity
imaging diagnosis.
eSie Touch™ elasticity imaging qualitatively reveals
stiffness in the ROI, with spatial resolution similar to 2D
imaging. The mechanical strain depends on the relative displacement
(compressibility) and the stiffness is evaluated by comparing the
deformation of the organ between frames. The proprietary filtering
and time-processing algorithm technology improves the
signal-to-noise and carrier-to-noise ratios, and even small
displacements (deformations) may be detected. The operator does not
need to pressure the probe since the proprietary imaging technology
detects the compressed tissue deformation caused by breathing and
heart beating, in addition to providing a visually qualitative
method and enhancing the patient’s comfort. Real-time QF is used to
evaluate the accuracy of displacement. A higher QF indicates a
small illusion of the entire displacement, whereas a lower QF
indicates a reduced diagnostic value by the illusion. The rapid
respiratory movement of rats reduces the QF; thus, monitoring the
breathing motion of the rats and achieving probe stability during
examination of the rat’s liver is required.
The VTQ technique is determined by ARFI principles.
This novel technology is used to detect and evaluate tissue
stiffness. The principle is to produce an acoustic shear wave in
the biological tissue using viscoelastic focused ultrasonic beam
modulation, where the signal of the shear wave in the tissue is
recorded by a special electronic system. The rapid decay of the
radiation force in the focused area results in the limitation of
the shear wave to small regional areas. Therefore, the machine
obtains the propagation velocity of the shear wave at low frequency
in the ROI. The tissue elasticity modulus is estimated through the
detected shear wave propagation. The system uses a standard
ultrasonic probe and a depth-adjustable sampling frame with a
length of ~5 mm. The probe sends short-duration acoustic pulses to
generate localised, micron-scale displacements in the organ. The
displacement in the ROI is tracked using the ultrasonic probe. The
results are expressed by the shear-wave velocity (m/sec), which
indicates the stiffness of the tissue (16).
The present study demonstrated a significant
positive correlation between ARFI elastographic velocity and liver
fibrosis severity in rats, with the VTQ values of the control,
F1/F2, F3 and F4 groups aggregately distributed and distinct from
each other. Fibrogenesis is assumed to be heterogeneous in the
liver as fibrosis variation in different hepatic regions is a known
phenomenon in LB samples (17,18)
and the distribution curves of the control, F1/F2, F3 and F4 groups
overlap. Despite the small overlapping range, the normal, F1/F2, F3
and liver cirrhosis stages may be distinguished. The present study
suggests that a rat with mean VTQ value <1.250 m/sec (the best
VTQ value cut-off point distinguishing normal liver tissue and
fibrotic liver tissue) and an associated eSie Touch™ score of 2 may
be excluded from liver fibrosis diagnosis. If the mean VTQ value of
a rat is between 1.250 and 1.685 m/sec with a score of 3 on the
eSie Touch™, F1/F2 liver fibrosis may be diagnosed. If ARFI values
are between 1.685 and 2.166 m/sec, with a score of 4 on the eSie
Touch™, F3 liver fibrosis may be diagnosed. If the VTQ value is
>2.166 m/sec with a score of 5 on the eSie Touch™, the diagnosis
is liver fibrosis grade F4. This technique meets the requirements
for the early diagnosis of liver fibrosis.
Statistical analysis revealed that the accuracy
rates of eSie Touch™ elasticity imaging and VTQ were 85 and 100%,
respectively. Thus, VTQ is superior to eSie Touch™ elasticity
imaging in terms of grading liver fibrosis.
The VTQ data in the present study are similar to
those observed in comparative studies of patients with liver
fibrosis and healthy controls. In other studies, the mean ± SD vs.
the values for the controls were found to be 1.08±0.13 (19), 1.15±0.21 (20) and 1.08±0.15 m/sec (21), with values for healthy volunteers
similar to those of control rats in the present study (1.08±0.12).
The cut-off values used in the present study to identify the
controls and classify the fibrosis stage (F0 versus F1–F4, 1.250
m/sec; F0–F2 versus F3/F4, 1.685 m/sec; and F0–F3 versus F4, 2.166
m/sec) are close to those determined by Karlas et al
(12), who calculated the cut-off
values for patients with fibrosis as follows: F0 versus F1–F4, 1.40
m/sec; F0/F1 versus F2–F4, 1.70 m/sec; F0–F2 versus F3/F4, 1.70
m/sec; F0–F3 versus F4, 2.13 m/sec.
Therefore, the eSie Touch™ elasticity imaging and
VTQ techniques may be successfully adopted to assess the extent of
liver stiffness and the two techniques are expected to replace LB.
VTQ technology provides multiple advantages, including
non-invasiveness, rapid process, low cost and dynamic evaluation.
The technique is advantageous in examining liver fibrosis,
particularly for patients who are obese or have a narrow
intercostal space, rendering examination of fibrosis by TE
difficult. The present study is important for clinical research, as
further studies based on the present study may be conducted
addressing the clinical aspect of fibrosis.
Acknowledgements
This study was supported by the Guangdong Natural
Science Foundation (no. 9151008901000201), the Guangdong Social
Development Project (no. 2011 NO.02), the Guangdong Science and
Technology Project (no. 01557050170800038), and the Guangzhou
Medical Science and Technology Project (nos. 20121A011027,
20131A010004 and 20131A011014).
References
|
1
|
Friedman SL: Liver fibrosis - from bench
to bedside. J Hepatol. 38(Suppl 1): S38–S53. 2003. View Article : Google Scholar
|
|
2
|
World Health Organization. Hepatitis B.
World Health Organization Fact Sheet 204 (Revised August 2008).
http://www.who.int/mediacentre/factsheets/fs204/en/index.html.
Accessed February 25, 2012
|
|
3
|
Goldstein ST, Zhou F, Hadler SC, Bell BP,
Mast EE and Margolis HS: A mathematical model to estimate global
hepatitis B disease burden and vaccination impact. Int J Epidemiol.
34:1329–1339. 2005. View Article : Google Scholar : PubMed/NCBI
|
|
4
|
Bonis PA, Friedman SL and Kaplan MM: Is
liver fibrosis reversible? N Engl J Med. 344:452–454. 2001.
View Article : Google Scholar : PubMed/NCBI
|
|
5
|
Bravo AA, Sheth SG and Chopra S: Liver
biopsy. N Engl J Med. 344:495–500. 2001. View Article : Google Scholar : PubMed/NCBI
|
|
6
|
Rockey DC, Caldwell SH, Goodman ZD, Nelson
RC and Smith AD: American Association for the Study of Liver
Diseases: Liver biopsy. Hepatology. 49:1017–1044. 2009. View Article : Google Scholar : PubMed/NCBI
|
|
7
|
Friedrich-Rust M, Wunder K, Kriener S, et
al: Liver fibrosis in viral hepatitis: noninvasive assessment with
acoustic radiation force impulse imaging versus transient
elastography. Radiology. 252:595–604. 2009. View Article : Google Scholar : PubMed/NCBI
|
|
8
|
Zhai L, Palmeri ML, Bouchard RR,
Nightingale RW and Nightingale KR: An integrated indenter-ARFI
imaging system for tissue stiffness quantification. Ultrason
Imaging. 30:95–111. 2008. View Article : Google Scholar : PubMed/NCBI
|
|
9
|
Sandrin L, Fourquet B, Hasquenoph JM, et
al: Transient elastography: a new noninvasive method for assessment
of hepatic fibrosis. Ultrasound Med Biol. 29:1705–1713. 2003.
View Article : Google Scholar : PubMed/NCBI
|
|
10
|
Yang L, Ma F, Liu YY and Dang YY: Value of
ultrasonic elastography in qualitative diagnosis for breast
parenchymatous tumors. J Tongji Univ (Med Sci). 2008:135–137.
2008.
|
|
11
|
Itoh A, Ueno E, Tohno E, et al: Breast
disease: clinical application of US elastography for diagnosis.
Radiology. 239:341–350. 2006. View Article : Google Scholar : PubMed/NCBI
|
|
12
|
Karlas T, Pfrepper C, Wiegand J, et al:
Acoustic radiation force impulse imaging (ARFI) for non-invasive
detection of liver fibrosis: examination standards and evaluation
of interlobe differences in healthy subjects and chronic liver
disease. Scand J Gastroenterol. 46:1458–1467. 2011. View Article : Google Scholar : PubMed/NCBI
|
|
13
|
Bedossa P and Poynard T: An algorithm for
the grading of activity in chronic hepatitis C. The METAVIR
Cooperative Study Group. Hepatology. 24:289–293. 1996. View Article : Google Scholar : PubMed/NCBI
|
|
14
|
Sporea I, Sirli RL, Deleanu A, et al:
Acoustic radiation force impulse elastography as compared to
transient elastography and liver biopsy in patients with chronic
hepatopathies. Ultraschall Med. 32(Suppl 1): S46–S52. 2011.
View Article : Google Scholar
|
|
15
|
Rizzo L, Calvaruso V, Cacopardo B, et al:
Comparison of transient elastography and acoustic radiation force
impulse for non-invasive staging of liver fibrosis in patients with
chronic hepatitis C. Am J Gastroenterol. 106:2112–2120. 2011.
View Article : Google Scholar : PubMed/NCBI
|
|
16
|
Palmeri ML, Sharma AC, Bouchard RR,
Nightingale RW and Nightingale KR: A Finite-Element Method Model of
Soft Tissue Response to Impulsive Acoustic Radiation Force. IEEE
Trans Ultrason Ferroelectr Freq Control. 52:1699–1712. 2005.
View Article : Google Scholar : PubMed/NCBI
|
|
17
|
Goldstein NS, Hastah F, Galan MV and
Gordon SC: Fibrosis heterogeneity in nonalcoholic steatohepatitis
and hepatitis C virus needle core biopsy specimens. Am J Clin
Pathol. 123:382–387. 2005. View Article : Google Scholar : PubMed/NCBI
|
|
18
|
Mehta SH, Lau B, Afdhal NH and Thomas DL:
Exceeding the limits of liver histology markers. J Hepatol.
50:36–41. 2009. View Article : Google Scholar :
|
|
19
|
Takahashi H, Ono N, Eguchi Y, et al:
Evaluation of acoustic radiation force impulse elastography for
fibrosis staging of chronic liver disease: a pilot study. Liver
Int. 30:538–545. 2010. View Article : Google Scholar
|
|
20
|
Popescu A, Sporea I, Sirli R, et al: The
mean values of liver stiffness assessed by Acoustic Radiation Force
Impulse elastography in normal subjects. Med Ultrason. 13:33–37.
2011.PubMed/NCBI
|
|
21
|
Horster S, Mandel P, Zachoval R and
Clevert DA: Comparing acoustic radiation force impulse imaging to
transient elastography to assess liver stiffness in healthy
volunteers with and without valsalva manoeuvre. Clin Hemorheol
Microcirc. 46:159–168. 2010.PubMed/NCBI
|