Introduction
Cholangiocarcinoma (CC) is an adenocarcinoma that
forms glands or secretes significant amounts of mucins. These are
composed of mutated epithelial cells that originate in the bile
ducts, which drain bile from the liver into the small intestine
(1–3). CC is currently considered to be an
incurable and rapidly lethal malignancy. Currently, surgery has
been shown to be the only existing curative treatment for CC
(4,5). Even though the incidence rate of CC
is considerably low, this rate has been rising over the past
decades (6–8).
Both environmental and genetic factors can affect
the risk of CC. One of the most common factors that cause CC in the
western world is primary sclerosing cholangitis (PSC), which is an
inflammatory disease closely related with ulcerative colitis. It
was suggested that PSC can increase the risk of CC by ~10–15%
(9). However, the molecular
mechanism of PSC increasing the risk of CC remains largely unknown
(10,11). Some liver diseases caused by
parasitic infection have been considered causative of CC. Previous
research has identified that colonization with the liver flukes
Opisthorchis viverrini and Clonorchis sinensis is
associated with the development of CC (12–14).
Numerous studies have suggested that chronic liver disease can also
increase the risk of CC, including viral hepatitis related liver
disease and alcoholic liver disease (15,16).
To date, numerous genetic factors have also been investigated to
show evidences of being involved in the outcome of CC, including
p53, cyclins, mucins and CRP (17). Aneuploidy has additionally been
suggested to have a significant role in the development of CC.
Despite previous research aiming to reveal the
genetic association with the risk of CC, few studies have focused
on gene expression changes together with the development of CC over
different days. The present study aimed to generate a time series
analysis of CC at the gene expression level in order to identify
novel gene patterns that are associated with the development of CC
(18).
Materials and methods
Microarray data for CC
The study was approved by the ethics committee of
Haerbin Medical University. A gene expression profile dataset
related to CC development formed over different days was obtained
from the Gene Expression Omnibus (GEO, http://www.ncbi.nlm.nih.gov/geo/) (19) in the National Center for
Biotechnology Information (NCBI), with accession number GSE15498.
There were 21 samples in total, including nine normal tissues, nine
intrahepatic CC tissues and three metastasis tissues. All
microarray data were generated on the platform of the Affymetrix
Rat Genome 230 2.0 Array (Affymetrix, Inc., Santa Clara, CA,
USA).
Microarray data pre-processing
The original CEL files were downloaded from NCBI and
the standard array processing procedures of the Affymetrix Rat
Genome 230 2.0 Array were followed. The ‘affy’ package in R
(20) was used to extract signal
values, which were then scaled to a mean of 100, followed by log2
transformation of the array signals. A quantile normalization
method (21) was used to normalize
the expression value across samples. Finally, all probe set IDs
were transformed to gene symbol IDs based on the documentation of
the manufacturer for downstream analysis.
Principle component analysis (PCA) and
pair-wise correlation analysis
The R (http://www.r-project.org/) ‘princomp’ function in the
package ‘stats’, was used to perform the (PCA) based on the gene
expression level following normalization across all 21 samples.
Furthermore, a pair-wise correlation matrix was calculated among
these samples. A heatmap based on the correlation matrix was
constructed, as well as hierarchical clustering, by using
‘euclidean’ distance as the input.
Differentially expressed genes (DEGs)
analysis
To detect the DEGs among normal, CC and metastasis
tissue, a two-way analysis of variance (ANOVA) test was performed
(22) with the gene expression
profile as an input. Genes with a P<0.0001 were considered to be
associated with the development of CC. To investigate whether these
DEGs were significant, a permutation test to evaluate the false
discovery rate (FDR) was additionally performed.
Functional enrichment analysis
The Database for Annotation, Visualization and
Integrated Discovery (DAVID) (23)
was used to analyze the enriched Gene Ontology (GO) and Kyoto
Encyclopedia of Genes and Genomes (KEGG) pathway terms (24). All expressed genes were treated as
the background for this test.
k-means cluster analysis
To perform a comprehensive analysis of genes
associated with CC genesis and identify gene clusters that may
function in the development of CC, a k-means cluster method
(25) was used to classify genes
into different groups according to their change in expression
pattern. Specifically, the mean expression value for each
differentially expressed gene within each group (normal and tumor
tissues from 10, 15 and 25 days, respectively, as well as
metastasis tissue) was calculated. Next, a z-score transformation
for the gene expression profile with mean values across sample
groups described above based on a standard normalization method was
performed in order to eliminate the absolute expression value
effect and focus on the pattern change. Finally, a k-means cluster
method was carried out for these significantly DEGs, according to
their z-transformed expression profile (k=8).
Gene module functional analysis
For each gene module identified by the k-means
cluster method, DAVID was used to analyze the enriched GO terms, as
well as KEGG pathway terms. Functional terms with P<0.05 were
considered to indicate statistically significant enriched
functions.
Results
Genes associated with CC
There were 21 samples used in total in the present
study, which were grouped into three types, including, 12
intrahepatic CC samples formed at different days ranging from 10 to
25 days, 12 normal control samples taken from the same days as a
pair-wise comparison with intrahepatic CC samples and three
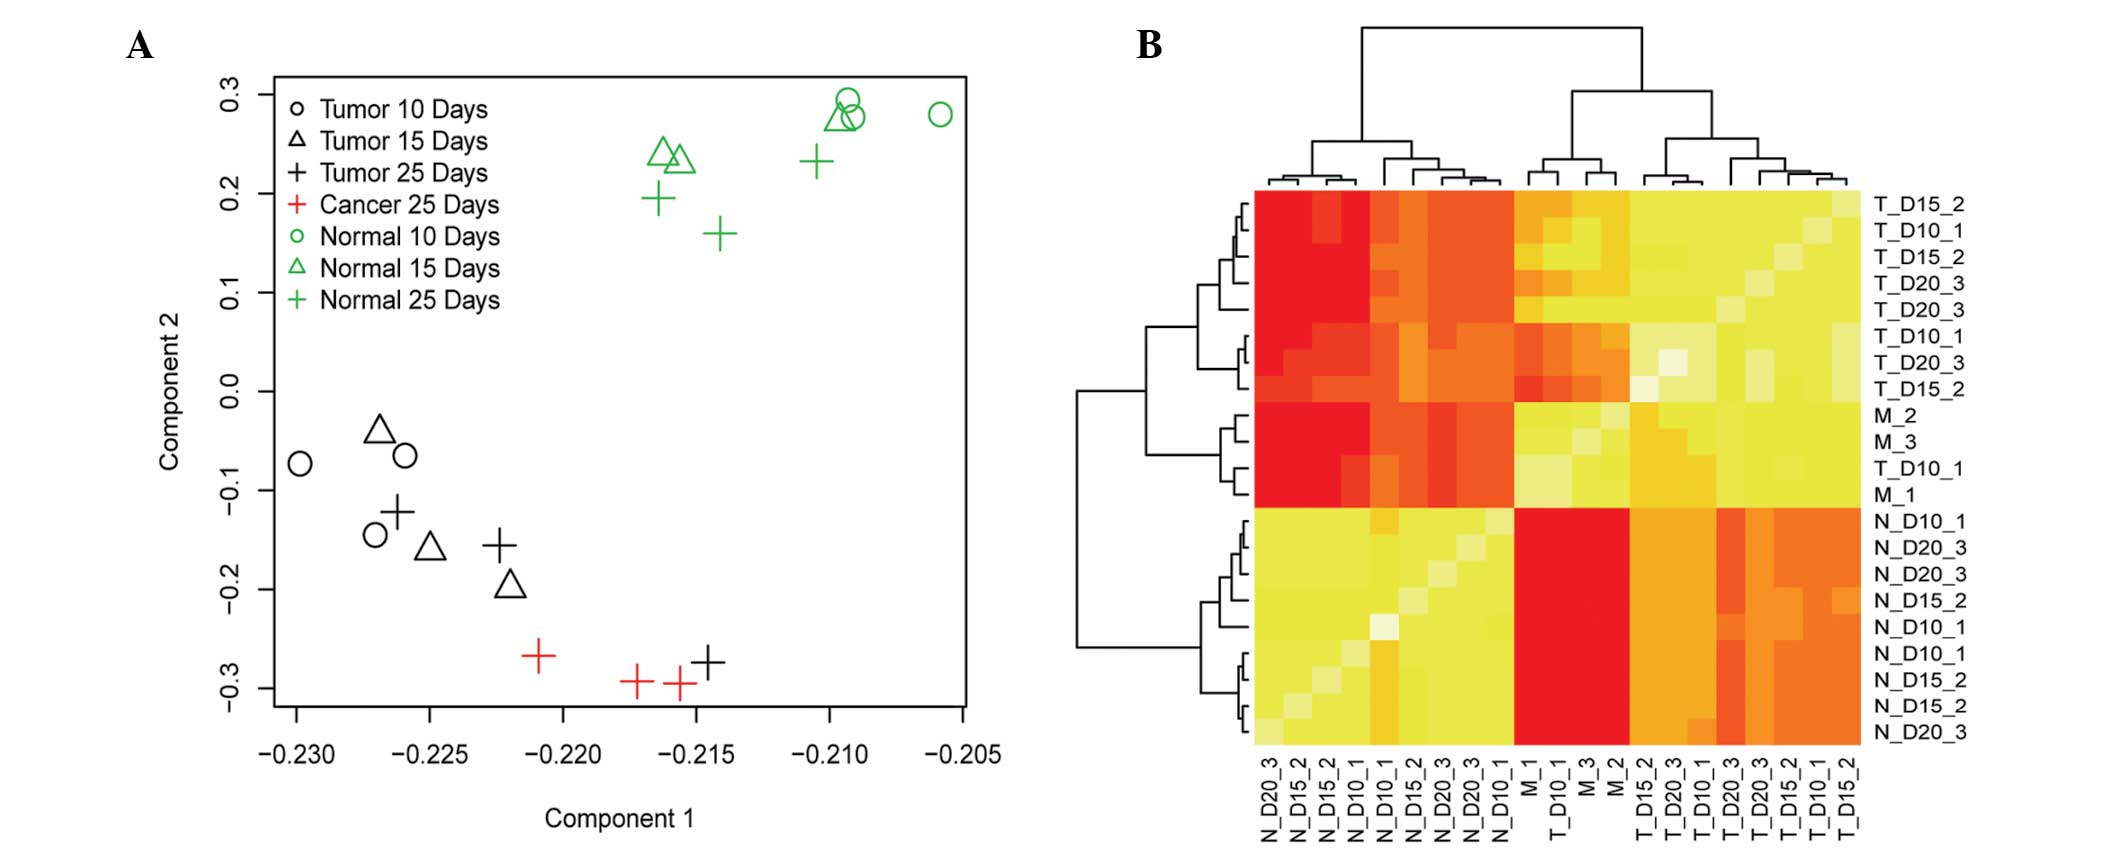
metastasis samples used as a positive control. A PCA was conducted
to demonstrate the association between samples in terms of their
gene expression profile. The results showed a clear separation
pattern between control samples and samples with disease (Fig. 1A). Hierarchical cluster results
based on the pair-wise correlation matrix of each sample (shown in
Fig. 1B) also suggest that control
samples and disease samples may be successfully separated in terms
of their gene expression profile. A two-way ANOVA was used to
detect genes differentially expressed among these three groups of
samples, as well as between the samples that derived from different
days. Genes with P<0.0001 were defined as CC related genes. In
total, 4,136 genes were identified that showed significantly
different levels of expression between at least two types of
samples. To evaluate whether these genes were significant rather
than random, a permutation test was performed by shuffling the
samples and repeating the ANOVA test 100,000 times. By using
P<0.0001 as a cutoff, an FDR=0.03% was produced.
Functional analysis of CC gene
signatures
In order to fully determine the association between
the DEGs and the phenotype of CC, a hypergeometric test to detect
the enriched GO terms was used. DAVID was used to perform this
analysis. Only over-represented GO terms with P<0.05 following
Bonferroni correction were considered to be significantly enriched
GO terms. The top ten enriched GO terms are listed in Table I. The enriched terms, such as
intracellular organelle lumen, membrane-enclosed lumen, organelle
lumen have been associated with CC in several previous studies
(26,27).
 | Table ITop ten enriched GO terms. |
Table I
Top ten enriched GO terms.
| GO ID | Term | Count | Bonferroni | Fold enrichment |
|---|
| GO:0005829 | Cytosol | 384 |
2.69×10⁻²³ | 3.412796 |
| GO:0005739 | Mitochondrion | 409 |
2.37×10⁻²⁰ | 3.078936 |
| GO:0031974 | Membrane-enclosed
lumen | 405 |
7.46×10⁻¹⁹ | 2.782038 |
| GO:0043233 | Organelle lumen | 394 |
3.12×10⁻¹⁸ | 2.423745 |
| GO:0070013 | Intracellular
organelle lumen | 380 |
1.98×10⁻¹⁷ | 3.017707 |
| GO:0006414 | Translational
elongation | 61 |
3.36×10⁻¹⁶ | 2.548286 |
| GO:0022627 | Cytosolic small
ribosomal subunit | 31 |
1.10×10⁻¹¹ | 1.543415 |
| GO:0044429 | Mitochondrial
part | 185 |
1.21×10⁻¹¹ | 2.26445 |
| GO:0044445 | Cytosolic part | 60 |
4.53×10⁻¹¹ | 1.482382 |
| GO:0022626 | Cytosolic
ribosome | 37 |
4.91×10⁻¹¹ | 2.004213 |
Pathway analysis of CC gene
signatures
To further understand the association between the
DEGs and their involvement in the development of CC, the type of
molecular pathways that were significantly enriched were tested
using the KEGG definition. KEGG terms with a P<0.05 following
Bonferroni correction were selected (Table II). As expected, a significantly
enriched pathway termed ‘mitochondrion’, was identified, which is
directly linked with CC (28),
suggesting that these DEGs participate in the development of
CC.
| Table IIEnriched Kyoto Encyclopedia of Genes
and Genomes pathways. |
Table II
Enriched Kyoto Encyclopedia of Genes
and Genomes pathways.
| KEGG ID | Term | Count | Bonferroni | Fold
enrichment |
|---|
| rno03010 | Ribosome | 64 |
6.62×10⁻²³ | 3.412796 |
| rno00280 | Valine, leucine and
isoleucine degradation | 32 |
1.83×10−08 | 3.078936 |
| rno03030 | DNA
replication | 22 |
3.75×10−04 | 2.782038 |
| rno00071 | Fatty acid
metabolism | 23 | 0.004411 | 2.423745 |
| rno00410 | β-alanine
metabolism | 15 | 0.008072 | 3.017707 |
| rno00640 | Propanoate
metabolism | 19 | 0.012183 | 2.548286 |
| rno04510 | Focal adhesion | 68 | 0.016978 | 1.543415 |
| rno00380 | Tryptophan
metabolism | 22 | 0.025275 | 2.26445 |
| rno04810 | Regulation of actin
cytoskeleton | 70 | 0.049876 | 1.482382 |
Identification of gene clusters
associated with specific CC pathways
For those genes that were differentially expressed
between normal and tumor tissues at various developmental stages,
it was asked what was their changing pattern as well as each
pattern’s biological function, in terms of their association with
CC. A k-means cluster method was used to classify the genes into
different modules according to their change in expression pattern.
To eliminate the absolute expression level effect and only focus on
the gene expression change curve difference, the gene expression
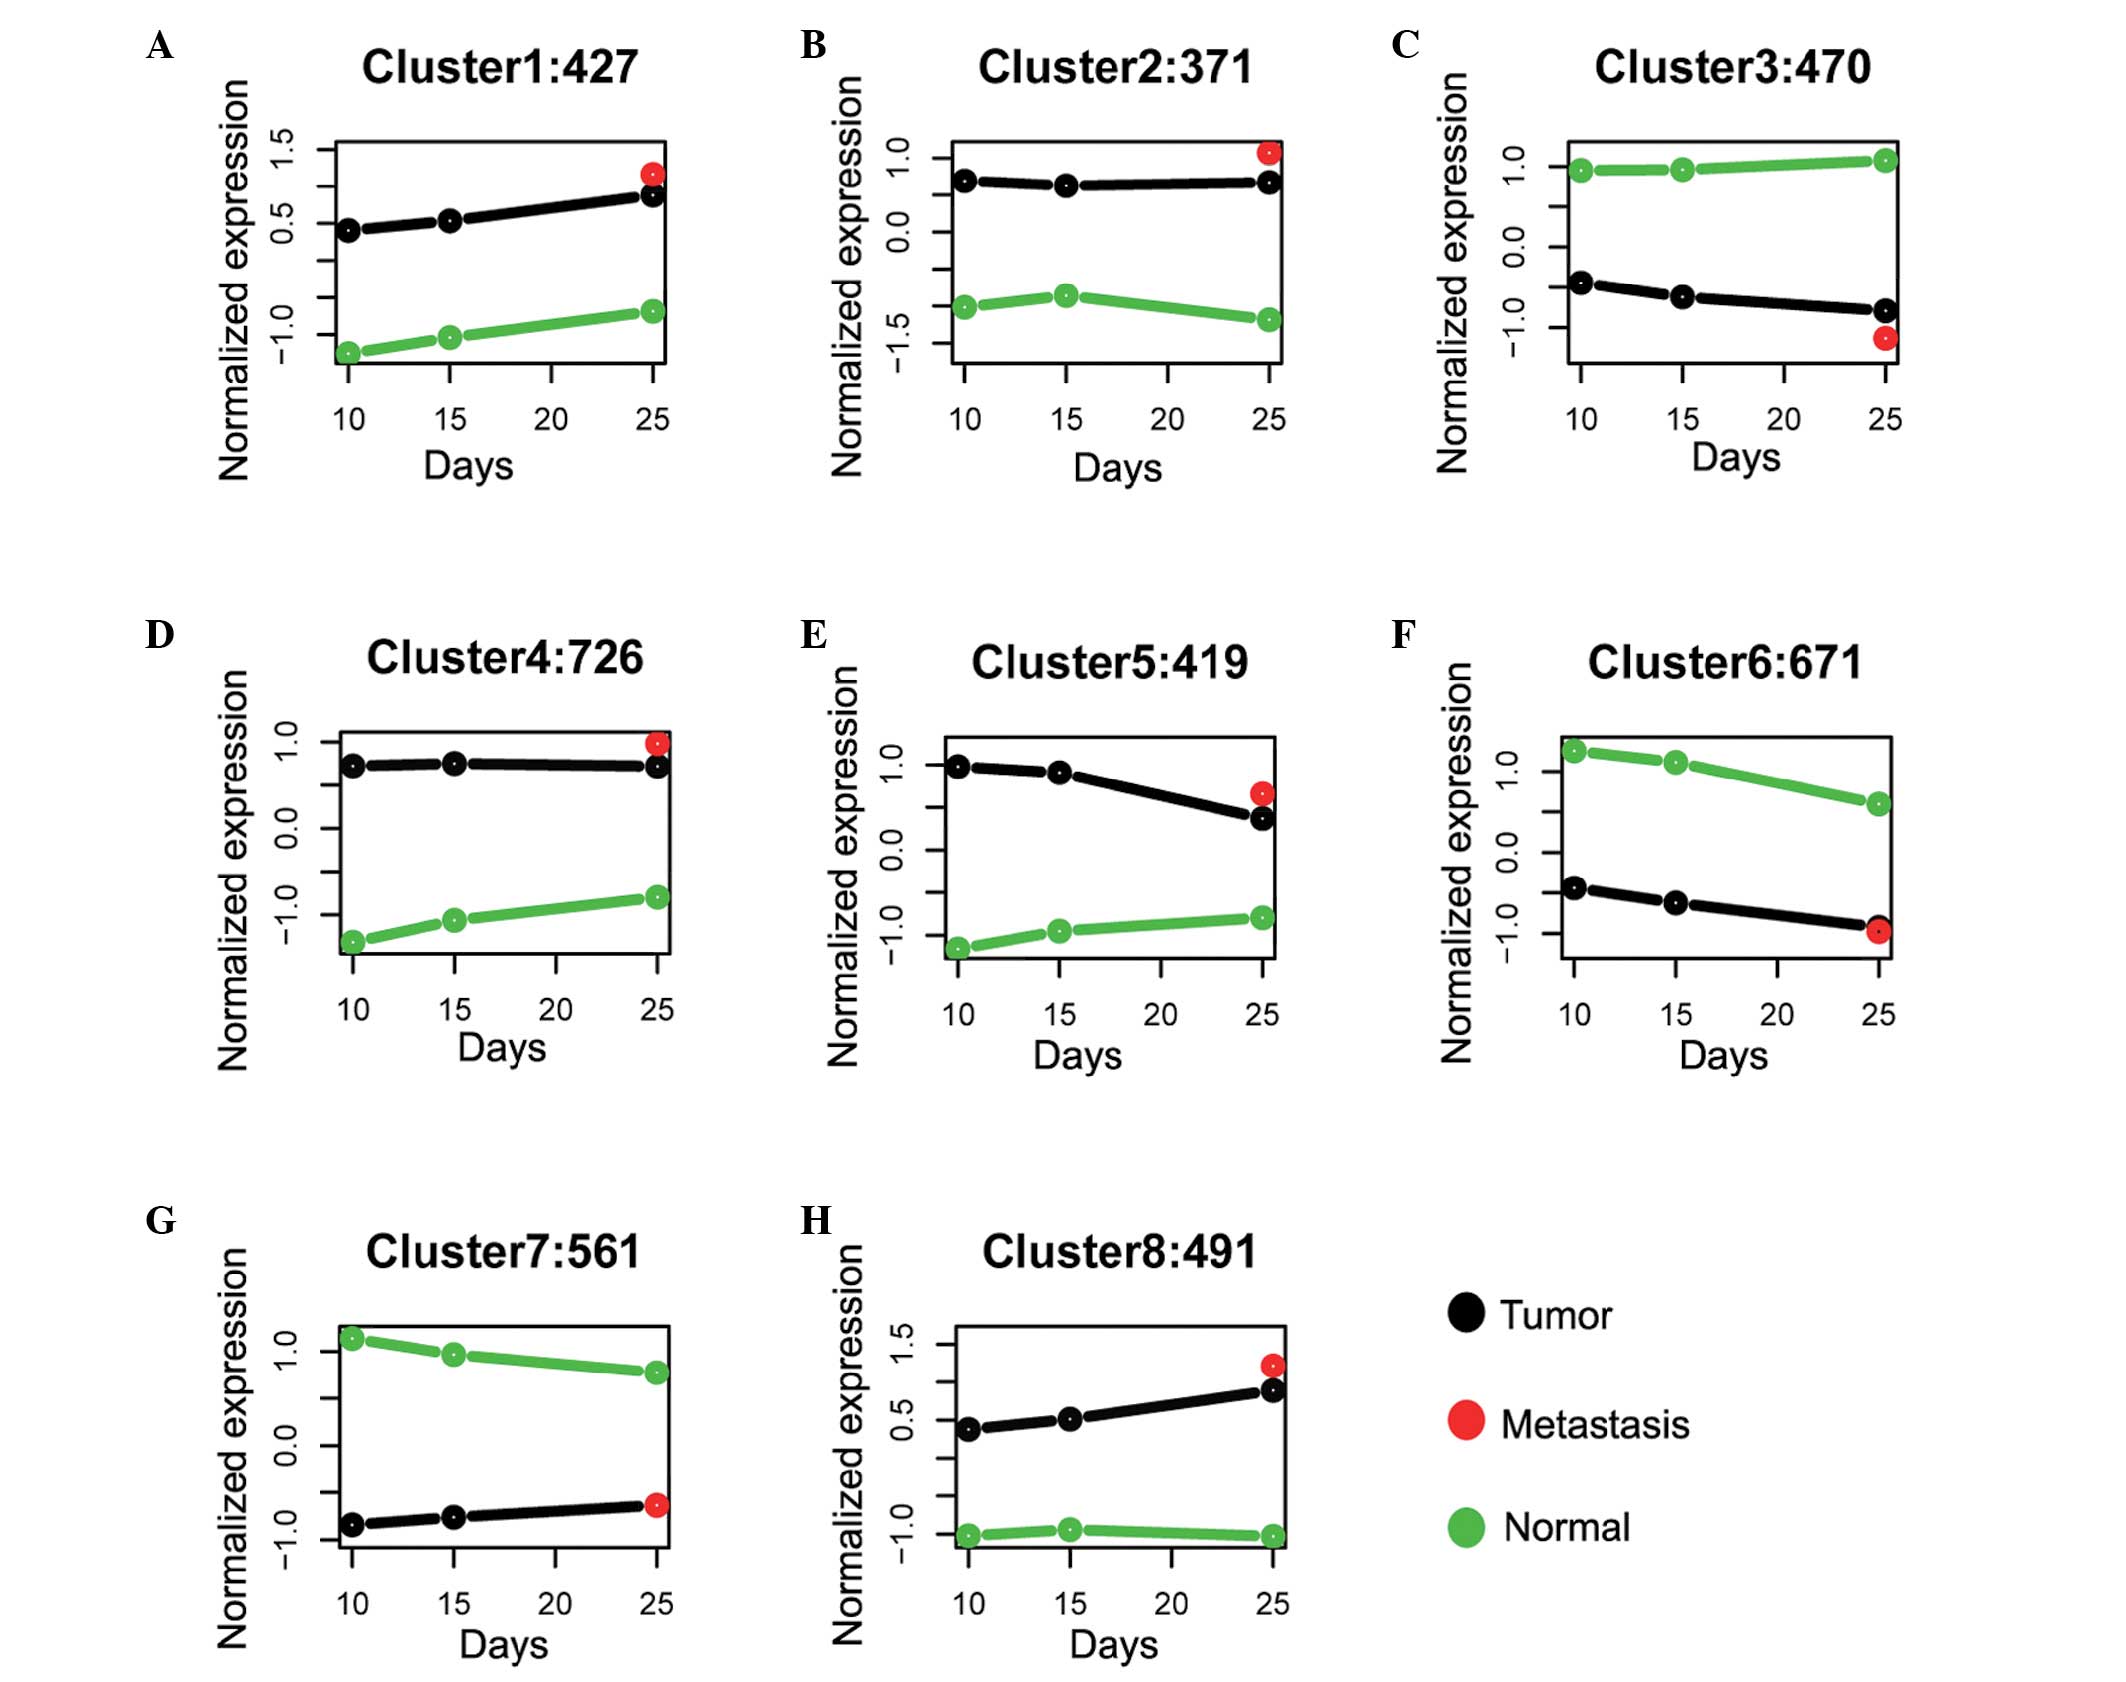
profile was normalized based on the z-score transformation. Eight
patterns were produced in total (Fig.
2). Genes that show a consistent changing pattern along with
developmental stages of CC (such as from 10 to15 days and to 25
days) should be considered to be associated with the chronological
development of CC, since it was hypothesized that a good
correlation between change in gene expression and change in disease
phenotype is strong evidence of association. Genes that show a
pattern difference between tumor and normal samples across the same
chronological days should also be firstly considered to have
functional impact, especially for those genes that have an opposite
pattern. Notably, three interesting gene clusters were identified:
i) 470 downregulated genes along with the developmental stage of CC
while the control curve was flat (Fig.
2C); ii) 419 downregulated genes along with the developmental
stage of CC while the control curve showed a slight upregulation
(Fig. 2E); iii) 491 upregulated
genes along with the developmental stage of CC while the control
curve was flat (Fig. 2H). These
genes were possible candidate biomarkers of CC in specific
pathways, which may function in the development of CC and should be
studied further in future studies.
To investigate the functional importance of the gene
clusters mentioned, the enriched function of all three interested
gene groups was investigated. For gene cluster-3 (Fig. 2C), it was identified that genes
were enriched in cell structural related functions such as
‘structural molecule activity’, ‘microtubule’, and ‘microtubule
skeleton’. Genes in cluster-5 (Fig.
2E) were predominantly enriched in gene transcription and
translation related pathways, suggesting that these genes may
participate in facilitating translation of important genes that are
associated with CC. Notably, genes in module-5 were found to be
additionally enriched in a KEGG pathway termed ‘mitochondrion’,
which was suggested to be a direct evidence that these genes were
related with the development of CC (28). This indicated that genes
downregulated with the development stage of CC were candidate
biomarkers of CC. Genes in cluster-8 (Fig. 2H) were enriched in the GO terms
‘Focal adhesion’ and ‘Regulation of actin cytoskeleton’
(P<0.05).
Discussion
CC is considered to be an incurable cancer, as well
as a rapid lethal malignancy, unless the primary tumor and any
metastases can be fully removed surgically. To date, only a few
genetic regions have been investigated to show an association with
the development of CC, including p53, cyclins, mucins, and CRP
(17). In the present study, a
gene expression profile change along with the chronological
development of CC, was performed in a time-series dataset of CC
patient samples by using the same chronological samples as a
control. The PCA revealed that normal samples may be obviously
distinguished both from tumor and cancer samples (Fig. 1A), demonstrating that the most
marked change in the gene expression level is between normal
developed tissue and tumor tissue. It was additionally noticed,
however, that there was a fundamental difference between tumor
tissues with various developmental stages, ranging from 10 to 25
days. Notably, there was a consistent change in gene expression
pattern as indicated by the PCA, in particular in the late
developmental stages of tumor tissue (25 days) is closer to the
stage of cancerous tissue (Fig.
1A). A heatmap based on pair-wise correlation of each sample in
terms of their gene expression profile, generated the same
conclusion as the PCA (Fig. 1B).
These data suggested that the development of CC from early to late
stage was generally a consistent process at the molecular level,
reflecting that the transcriptome status is a potential molecular
symbol of the developmental stage of CC. It is hypothesized that
this result will facilitate the molecular diagnostic research of CC
in the future.
A two-way ANOVA was performed in order to identify
candidate gene markers that were differentially expressed between
normal and tumor tissues, with various developmental stages. In
total, 4,136 DEGs, of which most were significantly differentially
expressed between normal and intrahepatic CC tissues (P<0.0001),
we identified. Permutation testing provided a considerably low FDR
(0.03%), suggesting these DEGs were truly significant molecular
markers rather than background noise. Of these DEGs, numerous genes
have been previously identified to be CC-associated genes,
including GAPDH, CITED4 and CLDN4 (17,30,31).
Notably, a well studied zinc finger gene, SNAI1, which is
considered to be associated in the molecular pathways of CC
development was identified in the DEG gene list (4.1 fold change;
P=1.08e-07) (31–33). SNAI1 was shown to be upregulated in
intrahepatic CC, which is consistent with the observations of the
present study. The function of SNAI1 is to suppress the expression
of E-cadherin that mediates cell-to-cell adhesion in order to
regulate tumor progression and metastases (26,35).
GO enrichment analysis revealed that the significant
DEGs were likely to be involved in functions such as intracellular
organelle lumen, membrane-enclosed lumen and organelle lumen. These
terms were significantly associated with the development of CC as
additionally shown in previous research (26,36).
This suggested that our analysis was robust and consistent with
previous studies. In addition, mitochondrial functions (including
mitochondrion, mitochondrial part) were also significantly enriched
(Bonferroni P<1e-12), suggesting that mitochondrion-related
molecular pathways were associated with the development of CC. In
agreement with this, previous studies have shown that
mitochondrion-mediated specific cell type apoptosis is an important
cause for the development of metastases in human CC cells. Okaro
et al (28) showed that a
mitochondrial benzodiazepine receptor antagonist, Pk11195, can
downregulate the apoptosis tolerance in human CC cells (28). Another study found that Mcl-1 can
mediate apoptosis-inducing ligand resistance in human CC cells
(37). Taken together, these data
suggest that other genes in the gene list produced in the present
study, that are associated with mitochondrion function, are
potential candidate genes that should be studied in the future in
the context of CC. KEGG pathway enrichment analysis provided
additional information regarding the linkage between molecular
pathways and the phenotype of CC (Table II). It was observed that
significantly enriched terms, such as ‘Focal adhesion’ and
‘Regulation of actin cytoskeleton’ (P<0.05) were well studied
pathways that have been previously associated with metastasis
(38,39), thus adding to the reliability of
these DEGs. In conclusion, it is considered that these DEGs
detected by two-way ANOVA represent true molecular markers that can
distinguish between normal intrahepatic duct cells and intrahepatic
CC cells.
To further investigate genes that have different
functions in the tumorigenesis and development of CC, a k-means
cluster method was performed for these DEGs, in order to identify
gene markers that could distinguish each other by gene expression
pattern. Specifically, genes that showed a consistent change with
developmental stages (from 10 to 25 days) and a different change in
expression curve in that we believe a correlation between gene
expression and phenotypic change of CC is always a strong evidence
of association were investigated. Distinguishable patterns between
tumor and normal samples should be considered to be of importance
in terms of gene function in specific pathways of CC. Based on
these two criteria, 3/8 clusters produced notable patterns of
expression. In cluster-3, genes in normal tissues were highly
expressed as compared with tumor tissues, and were expressed in a
steady state across different days. In comparison the genes in the
tumor tissues were downregulated together with the development of
CC. Enrichment tests suggested that genes within this cluster were
involved in pathways including ‘structural molecule activity’,
‘microtubule’ and ‘microtubule skeleton’, which have been linked
with tumorigenesis in several previous studies (40,41).
Genes in cluster-5 were also shown to have a downregulation
expression pattern in the developmental stages of CC. However,
genes in this group were highly expressed in tumor tissues as
compared with normal tissues. Pathway enrichment analysis showed
that these genes were enriched in mitochondrion related pathways,
suggesting they may function in cell apoptosis-induced pathways.
Interestingly, SNAI1 was consistently within this cluster,
indicating that studying other genes within this cluster may
provide a link between SNAI1 regulation in the development of CC.
For cluster-8, genes that were upregulated across tumor samples
whilst maintaining flat expression across normal samples were
identified. GO enrichment analysis additionally suggested that
genes within this group were related with ‘Focal adhesion’ and
‘Regulation of actin cytoskeleton’, raising the possibility that
these genes may be tumorigenesis related markers associated with CC
development.
In conclusion, the present study has conducted a
time series analysis to reveal gene signatures that are associated
with the development of CC, based on changes in the gene expression
profile. Genes related to CC were shown to be involved in cancer
pathways such as ‘mitochondrion’ and ‘focal adhesion’. Three
interesting gene groups were identified by a k-means cluster method
based on a normalized gene expression profile, of which each showed
enrichment functions associated with the development of CC. It is
considered that this work is of great importance and will lead to
novel discoveries regarding the genetic study of CC.
References
|
1
|
Tsao JI, Nimura Y, Kamiya J, et al:
Management of hilar cholangiocarcinoma: comparison of an American
and a Japanese experience. Ann Surg. 232:166–174. 2000. View Article : Google Scholar : PubMed/NCBI
|
|
2
|
Nakeeb A, Pitt HA, Sohn TA, et al:
Cholangiocarcinoma. A spectrum of intrahepatic, perihilar, and
distal tumors. Ann Surg. 224:463–473. PubMed/NCBI
|
|
3
|
Rajagopalan V, Daines WP, Grossbard ML and
Kozuch P: Gallbladder and biliary tract carcinoma: A comprehensive
update, Part 1. Oncology (Williston Park). 18:889–896. 2004.
|
|
4
|
Weber SM, DeMatteo RP, Fong Y, Blumgart LH
and Jarnagin WR: Staging laparoscopy in patients with extrahepatic
biliary carcinoma. Analysis of 100 patients. Ann Surg. 235:392–399.
2002. View Article : Google Scholar : PubMed/NCBI
|
|
5
|
Callery MP, Strasberg SM, Doherty GM,
Soper NJ and Norton JA: Staging laparoscopy with laparoscopic
ultrasonography: optimizing resectability in hepatobiliary and
pancreatic malignancy. J Am Coll Surg. 185:33–39. 1997. View Article : Google Scholar : PubMed/NCBI
|
|
6
|
Miyakawa S, Ishihara S, Horiguchi A, et
al: Biliary tract cancer treatment: 5,584 results from the Biliary
Tract Cancer Statistics Registry from 1998 to 2004 in Japan. J
Hepatobiliary Pancreat Surg. 16:1–7. 2009. View Article : Google Scholar
|
|
7
|
Landis SH, Murray T, Bolden S and Wingo
PA: Cancer statistics, 1998. CA Cancer J Clin. 48:6–29. 1998.
View Article : Google Scholar : PubMed/NCBI
|
|
8
|
Patel T: Worldwide trends in mortality
from biliary tract malignancies. BMC Cancer. 2:102002. View Article : Google Scholar : PubMed/NCBI
|
|
9
|
Burak K, Angulo P, Pasha TM, et al:
Incidence and risk factors for cholangiocarcinoma in primary
sclerosing cholangitis. Am J Gastroenterol. 99:523–526. 2004.
View Article : Google Scholar : PubMed/NCBI
|
|
10
|
Khorsandi SE, Salvans S, Zen Y, et al:
Cholangiocarcinoma complicating recurrent primary sclerosing
cholangitis after liver transplantation. Transpl Int. 24:e93–e96.
2011. View Article : Google Scholar : PubMed/NCBI
|
|
11
|
Kaya M, de Groen PC, Angulo P, et al:
Treatment of cholangiocarcinoma complicating primary sclerosing
cholangitis: the Mayo Clinic experience. Am J Gastroenterol.
96:1164–1169. 2001. View Article : Google Scholar : PubMed/NCBI
|
|
12
|
Chaiyarit P, Sithithaworn P, Thuwajit C
and Yongvanit P: Detection of salivary antibodies to crude antigens
of Opisthorchis viverrini in opisthorchiasis and cholangiocarcinoma
patients. Clin Oral Investig. 15:477–483. 2011. View Article : Google Scholar
|
|
13
|
Hughes NR, Pairojkul C, Royce SG, Clouston
A and Bhathal PS: Liver fluke-associated and sporadic
cholangiocarcinoma: an immunohistochemical study of bile duct,
peribiliary gland and tumour cell phenotypes. J Clin Pathol.
59:1073–1078. 2006. View Article : Google Scholar : PubMed/NCBI
|
|
14
|
Shin HR, Lee CU, Park HJ, et al: Hepatitis
B and C virus, Clonorchis sinensis for the risk of liver cancer: a
case-control study in Pusan, Korea. Int J Epidemiol. 25:933–940.
1996. View Article : Google Scholar : PubMed/NCBI
|
|
15
|
Shaib YH, El-Serag HB, Davila JA, Morgan R
and McGlynn KA: Risk factors of intrahepatic cholangiocarcinoma in
the United States: a case-control study. Gastroenterology.
128:620–626. 2005. View Article : Google Scholar : PubMed/NCBI
|
|
16
|
Sorensen HT, Friis S, Olsen JH, et al:
Risk of liver and other types of cancer in patients with cirrhosis:
a nationwide cohort study in Denmark. Hepatology. 28:921–925. 1998.
View Article : Google Scholar : PubMed/NCBI
|
|
17
|
Briggs CD, Neal CP, Mann CD, et al:
Prognostic molecular markers in cholangiocarcinoma: a systematic
review. Eur J Cancer. 45:33–47. 2009. View Article : Google Scholar
|
|
18
|
Storto PD, Saidman SL, Demetris AJ, et al:
Chromosomal breakpoints in cholangiocarcinoma cell lines. Genes
Chromosomes Cancer. 2:300–310. 1990. View Article : Google Scholar : PubMed/NCBI
|
|
19
|
Barrett T and Edgar R: Gene expression
omnibus: microarray data storage, submission, retrieval, and
analysis. Methods Enzymol. 411:352–369. 2006. View Article : Google Scholar : PubMed/NCBI
|
|
20
|
Gautier L, Cope L, Bolstad BM and Irizarry
RA: affy - analysis of Affymetrix GeneChip data at the probe level.
Bioinformatics. 20:307–315. 2004. View Article : Google Scholar : PubMed/NCBI
|
|
21
|
Hu J and He X: Enhanced quantile
normalization of microarray data to reduce loss of information in
gene expression profiles. Biometrics. 63:50–59. 2007. View Article : Google Scholar : PubMed/NCBI
|
|
22
|
Perneger T and Perrier A: Analysis of
variance, part 1 (the t-test and ANOVA). Rev Mal Respir.
21:797–801. 2004.(In French). View Article : Google Scholar : PubMed/NCBI
|
|
23
|
Huang da W, Sherman BT, Tan Q, et al:
DAVID Bioinformatics Resources: expanded annotation database and
novel algorithms to better extract biology from large gene lists.
Nucleic Acids Res. 35:W169–W175. 2007. View Article : Google Scholar : PubMed/NCBI
|
|
24
|
Kanehisa M and Goto S: KEGG: kyoto
encyclopedia of genes and genomes. Nucleic Acids Res. 28:27–30.
2000. View Article : Google Scholar
|
|
25
|
Beauchaine TP and Beauchaine RJ 3rd: A
comparison of maximum covariance and K-means cluster analysis in
classifying cases into known taxon groups. Psychol Methods.
7:245–261. 2002. View Article : Google Scholar : PubMed/NCBI
|
|
26
|
Sirica AE: The role of cancer-associated
myofibroblasts in intrahepatic cholangiocarcinoma. Nat Rev
Gastroenterol Hepatol. 9:44–54. 2011. View Article : Google Scholar : PubMed/NCBI
|
|
27
|
Masyuk AI, Huang BQ, Ward CJ, et al:
Biliary exosomes influence cholangiocyte regulatory mechanisms and
proliferation through interaction with primary cilia. Am J Physiol
Gastrointest Liver Physiol. 299:G990–G999. 2010. View Article : Google Scholar : PubMed/NCBI
|
|
28
|
Okaro AC, Fennell DA, Corbo M, Davidson BR
and Cotter FE: Pk11195, a mitochondrial benzodiazepine receptor
antagonist, reduces apoptosis threshold in Bcl-X(L) and Mcl-1
expressing human cholangiocarcinoma cells. Gut. 51:556–561. 2002.
View Article : Google Scholar : PubMed/NCBI
|
|
29
|
Lamberts RR, Van Rijen MH, Sipkema P, et
al: Coronary perfusion and muscle lengthening increase cardiac
contraction: different stretch-triggered mechanisms. Am J Physiol
Heart Circ Physiol. 283:H1515–H1522. 2002. View Article : Google Scholar : PubMed/NCBI
|
|
30
|
Nishino R, Honda M, Yamashita T, et al:
Identification of novel candidate tumour marker genes for
intrahepatic cholangiocarcinoma. J Hepatol. 49:207–216. 2008.
View Article : Google Scholar : PubMed/NCBI
|
|
31
|
Nehls O, Gregor M and Klump B: Serum and
bile markers for cholangiocarcinoma. Semin Liver Dis. 24:139–154.
2004. View Article : Google Scholar : PubMed/NCBI
|
|
32
|
Zhang K, Zhaos J, Liu X, et al: Activation
of NF-B upregulates Snail and consequent repression of E-cadherin
in cholangiocarcinoma cell invasion. Hepatogastroenterology.
58:1–7. 2011.PubMed/NCBI
|
|
33
|
Zhang KJ, Wang DS, Zhang SY, et al: The
E-cadherin repressor slug and progression of human extrahepatic
hilar cholangiocarcinoma. J Exp Clin Cancer Res. 29:882010.
View Article : Google Scholar : PubMed/NCBI
|
|
34
|
Techasen A, Namwat N, Loilome W, et al:
Tumor necrosis factor-α (TNF-α) stimulates the
epithelial-mesenchymal transition regulator Snail in
cholangiocarcinoma. Med Oncol. 29:3083–3091. 2012. View Article : Google Scholar : PubMed/NCBI
|
|
35
|
Zabron A, Edwards RJ and Khan SA: The
challenge of cholangiocarcinoma: dissecting the molecular
mechanisms of an insidious cancer. Dis Model Mech. 6:281–292. 2013.
View Article : Google Scholar : PubMed/NCBI
|
|
36
|
Larusso NF: Patients, cells, and
organelles: the intersection of science and serendipity.
Hepatology. 53:1417–1426. 2011. View Article : Google Scholar : PubMed/NCBI
|
|
37
|
Taniai M, Grambihler A, Higuchi H, et al:
Mcl-1 mediates tumor necrosis factor-related apoptosis-inducing
ligand resistance in human cholangiocarcinoma cells. Cancer Res.
64:3517–3524. 2004. View Article : Google Scholar : PubMed/NCBI
|
|
38
|
Schwock J, Dhani N and Hedley DW:
Targeting focal adhesion kinase signaling in tumor growth and
metastasis. Expert Opin Ther Targets. 14:77–94. 2010. View Article : Google Scholar
|
|
39
|
Fraley SI, Feng Y, Krishnamurthy R, et al:
A distinctive role for focal adhesion proteins in three-dimensional
cell motility. Nat Cell Biol. 12:598–604. 2010. View Article : Google Scholar : PubMed/NCBI
|
|
40
|
Drukman S and Kavallaris M: Microtubule
alterations and resistance to tubulin-binding agents (review). Int
J Oncol. 21:621–628. 2002.PubMed/NCBI
|
|
41
|
Pokorný J, Vedruccio C, Cifra M and Kučera
O: Cancer physics: diagnostics based on damped cellular
elastoelectrical vibrations in microtubules. Eur Biophys J.
40:747–759. 2011. View Article : Google Scholar : PubMed/NCBI
|