Introduction
Venous thromboembolism (VTE), comprising deep venous
thrombosis and pulmonary embolism, is a frequent disease with high
morbidity and mortality, which affects 1–2 per 1,000 individuals
(1–3). Furthermore, VTE is associated with a
significant rate of recurrence in as many as 30% of VTE patients
after termination of the standard course of anti-coagulant therapy
(4–6). Therefore, it is desired to explore
the molecular mechanisms and potential biomarkers that enable
clinicians to identify patients at a risk of single VTE (SVTE) or
recurrent VTE (RVTE) for prompt clinical diagnosis and early
prevention (7).
Kyrle et al (8) reported that patients with a high
level of factor VIII have an increased risk of RVTE. A study by
Comp and Esmon (9) suggested that
the levels of protein S may be used in the evaluation of RVTE.
Various established and novel biomarkers, including D-dimer,
E-selectin, P-selectin, thrombin, inflammatory markers and
C-reactive protein, have been investigated for their predictive
value in SVTE and RVTE (10–13).
However, only a small number of biomarkers, such as D-dimer,
associated with a first or recurrent event of VTE were highlighted
by these studies, while novel and promising biomarkers, including
P-selectin and inflammatory cytokines, are still controversial
(1). A study by Lewis et al
(14) performed a pathway
enrichment analysis of differentially expressed genes (DEGs) in
samples from patients with SVTE and samples from patients with RVTE
and found that insulin-like growth factor receptor 1 and Akt
pathways may be useful for distinguishing patients with SVTE from
those with RVTE.
The present study identified DEGs in RVTE and SVTE,
as well as specific DEGs in RVTE. Functional and pathway enrichment
analyses for these DEGs were performed to explore the molecular
mechanisms and potential biomarkers of SVTE and RVTE in order to
facilitate the diagnosis and clinical therapy management of
VTE.
Materials and methods
Affymetrix microarray data
The gene expression profile dataset GSE19151 was
obtained from Gene Expression Omnibus (http://www.ncbi.nlm.nih.gov/geo/), which was deposited
by Lewis et al (14).
Microarray data from 133 whole blood specimens were available,
including 63 samples from healthy controls, 32 samples from
patients with SVTE (sampled at <three years since their most
recent VTE) and 38 samples from subjects with recurrent venous
thromboembolism (RVTE) on warfarin. The platform was GPL571
(HG-U133A_2) Affymetrix Human Genome U133A 2.0 Array (Affymetrix,
Inc., Santa Clara, CA, USA).
DEG analysis and gene clustering
analysis
For the GSE19151 dataset, the Bioconductor software
package in R (http://www.bioconductor.org/; version 3.1) was
implemented to analyze the 133 blood gene chips (15). Background correction and quartile
data normalization were performed using the robust multiarray
average algorithm with defaulted parameters in the Affy package
(http://www.bioconductor.org/packages/release/bioc/html/affy.html;
version 1.46.1) (16). The t-test
was used to identify DEGs using the Simpleaffy package (http://www.bioconductor.org/packages/release/bioc/html/simpleaffy.html;
version 2.44.0) (17). The DEGs
were selected with the cutoff criteria of P<0.05 and |log(fold
change)|>1. Hierarchical clustering analysis of the DEGs was
performed using the Hclust command in R and the default complete
linkage method (18).
Gene ontology (GO) functional and pathway
enrichment analyses
The Integrated GEne and PROtein annotation Server
(IGEPROS; http://www.biosino.org/iGepros/index.jsp) (19) bioinformatics resources consist of
an integrated biological knowledge base and analytic tools aimed at
systematically extracting biological information from large gene or
protein lists. IGEPROS was used to perform the GO (http://www.geneontology.org/) functional and Kyoto
Encyclopedia of Genes and Genomes (KEGG; http://www.genome.jp/kegg/pathway.html) pathway
enrichment analyses for the identified DEGs with the threshold of
P<0.05. The pathview package in R was utilized to depict the
KEGG pathway (20).
Results
DEG selection and hierarchical clustering
analysis
A total of 42 DEGs were identified between RVTE and
normal whole-blood specimens (RVTE vs. control), including 35 up-
and 7 downregulated genes. Subsequently, 20 DEGs between SVTE and
normal whole-blood specimens (SVTE vs. control) were identified,
including 17 up- and 3 downregulated genes. A total of 22
non-overlapping genes were selected as specific DEGs of RVTE,
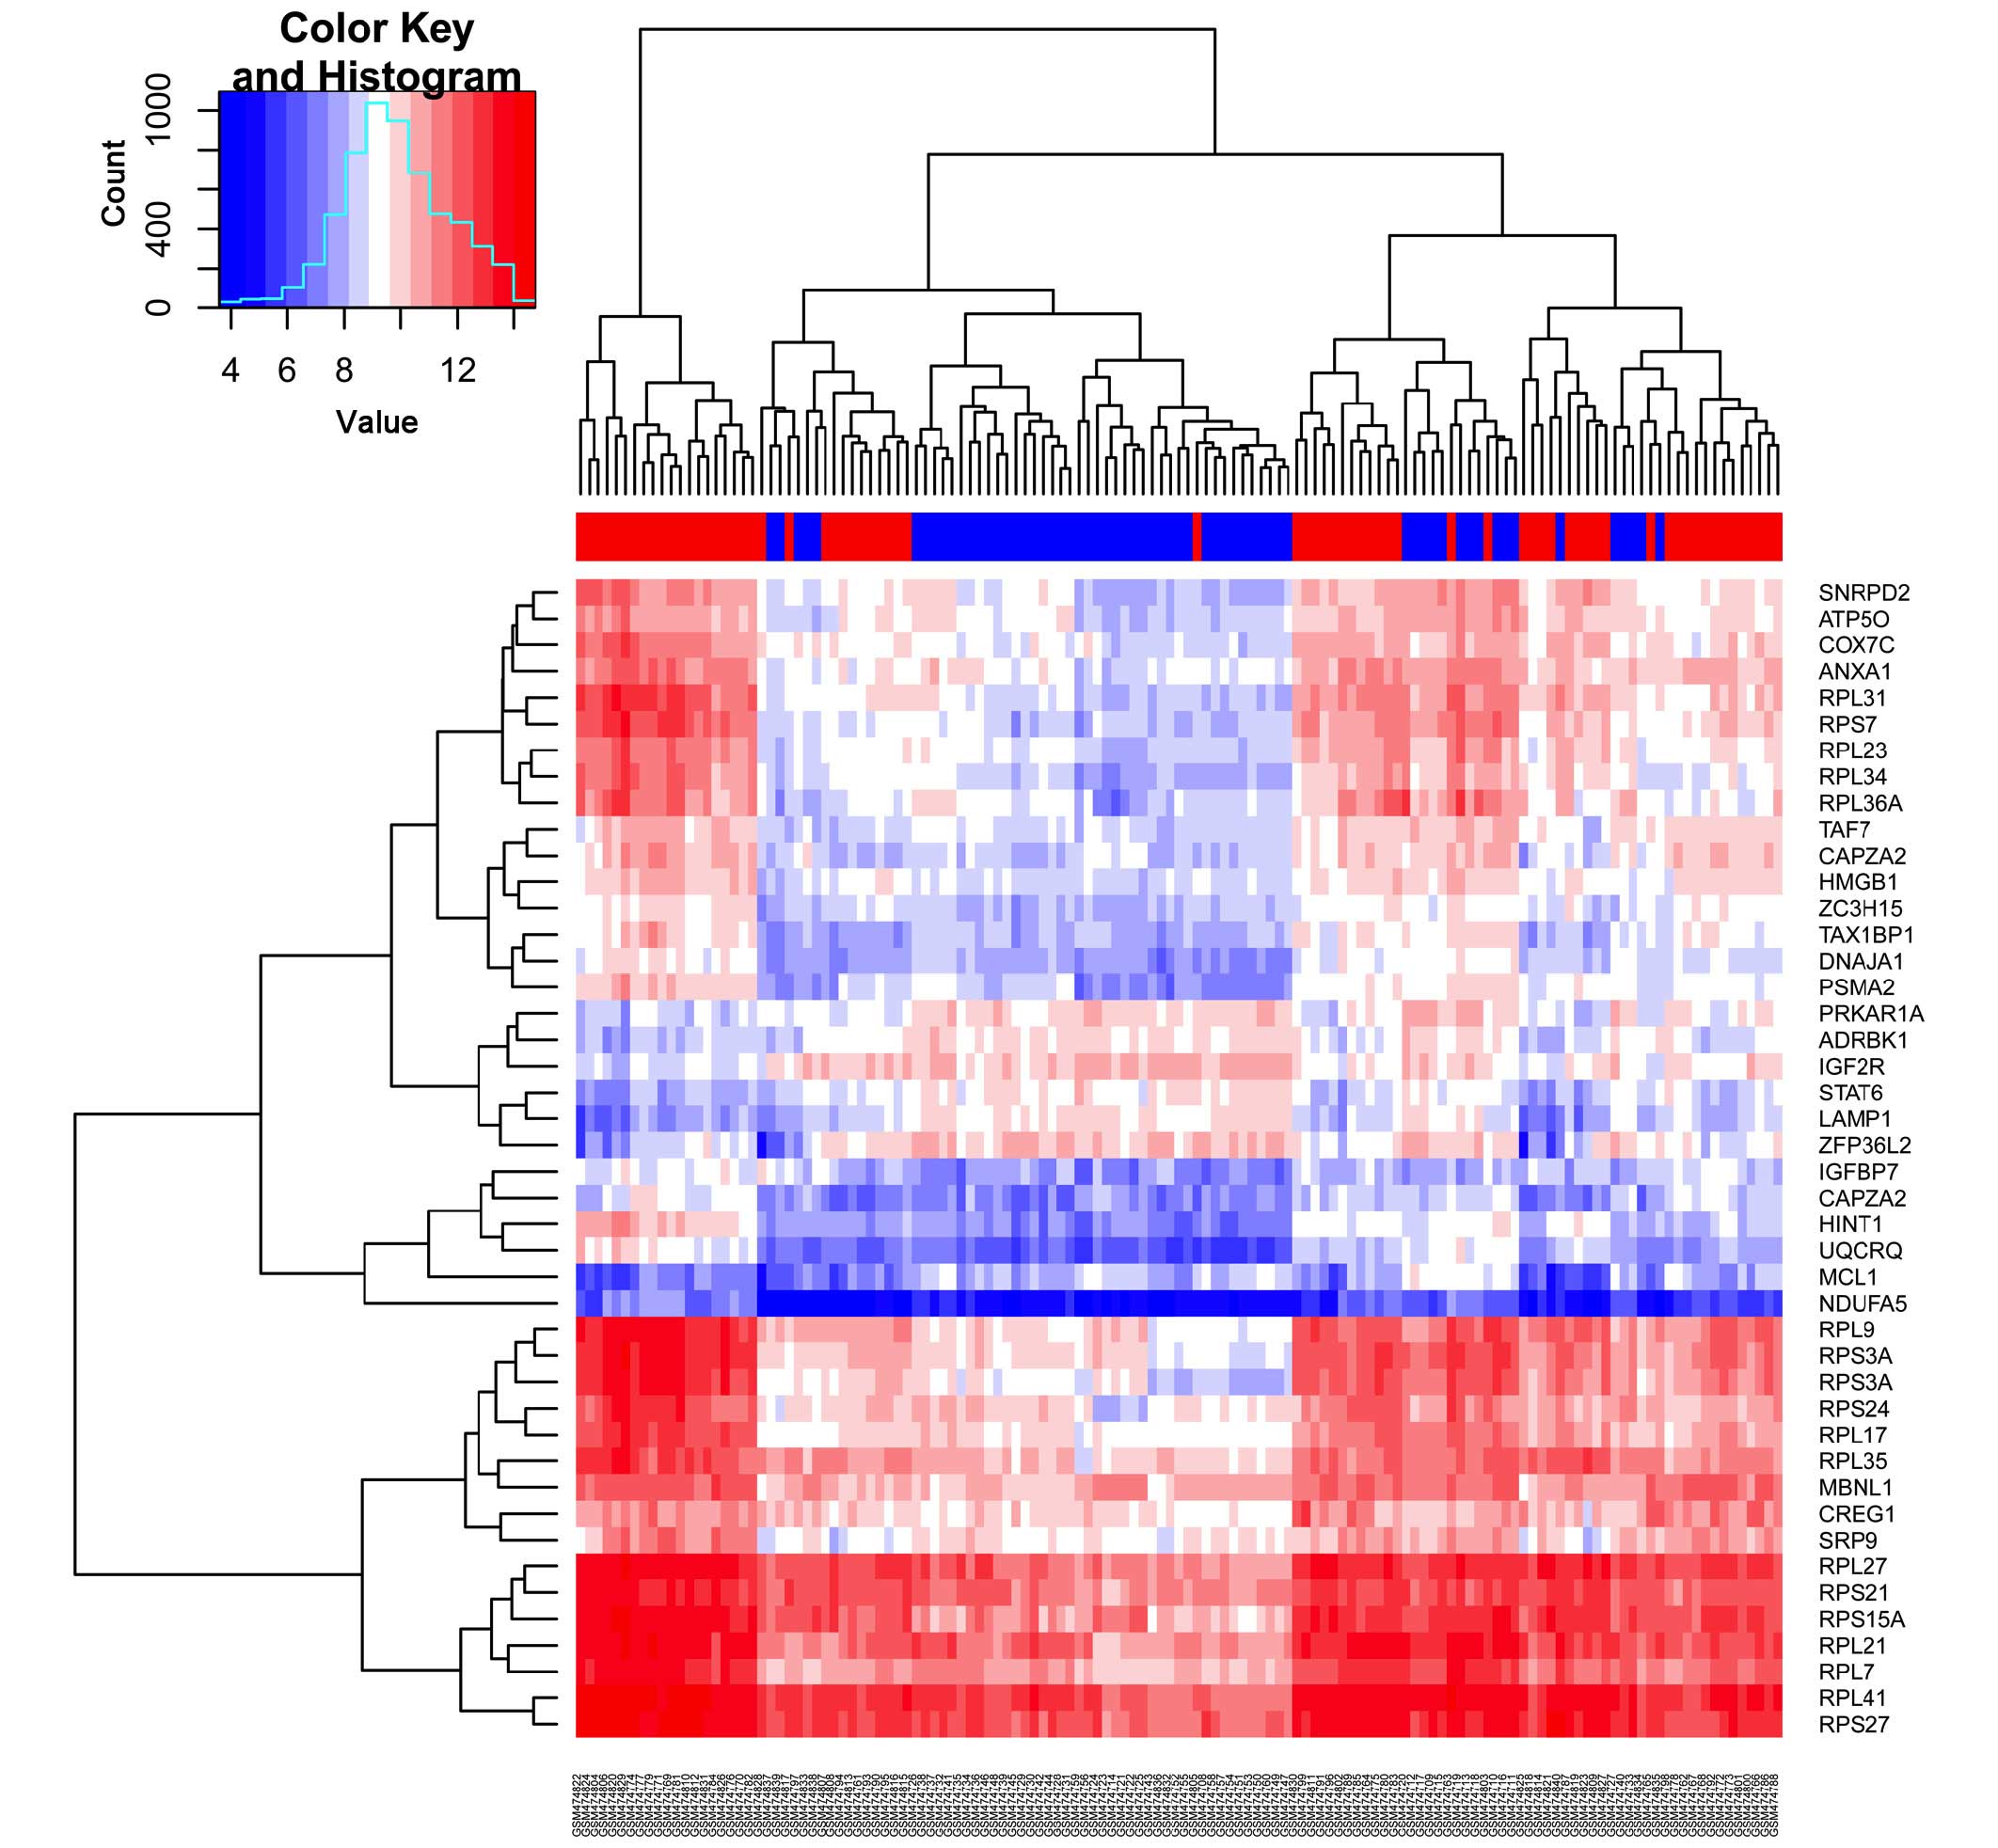
including 18 up- and 4 downregulated genes (Table I). Hierarchical clustering analysis
was performed for the 42 DEGs from the 133 whole blood specimens of
patients with SVTE, patients with RVTE and healthy controls. The
result of this clustering analysis suggested that these DEGs may
have important roles in VTE (Fig.
1).
 | Table ISpecific differentially expressed
genes of recurrent VTE. |
Table I
Specific differentially expressed
genes of recurrent VTE.
| Probe ID | Mean of recurrent VTE
(R) | Mean of healthy
(N) | Log2 (R/N) | P-value | Gene symbol | ENTREZGENE_ID |
|---|
| 201304_at | 6.22 | 4.64 | 1.58 |
2.55×10⁻⁵ | NDUFA5 | 4698 |
| 200679_x_at | 9.86 | 8.67 | 1.19 |
4.85×10⁻¹⁰ | HMGB1 | 3146 |
| 201317_s_at | 9.49 | 8.16 | 1.33 |
2.18×10⁻⁷ | PSMA2 | 5683 |
| 200977_s_at | 9.41 | 8.16 | 1.24 |
1.39×10⁻⁵ | TAX1BP1 | 8887 |
| 201152_s_at | 11.86 | 10.69 | 1.17 |
1.17×10⁻⁶ | MBNL1 | 4154 |
| 201163_s_at | 8.79 | 7.54 | 1.24 |
1.19×10⁻¹² | IGFBP7 | 3490 |
| 201593_s_at | 9.38 | 8.26 | 1.12 |
3.27×10⁻¹⁰ | ZC3H15 | 55854 |
| 201401_s_at | 8.57 | 9.69 | −1.13 |
1.39×10⁻¹¹ | ADRBK1 | 156 |
| 200834_s_at | 12.54 | 11.54 | 1.01 |
1.97×10⁻¹¹ | RPS21 | 6227 |
| 201367_s_at | 8.91 | 10.14 | −1.24 |
2.12×10⁻⁷ | ZFP36L2 | 678 |
| 201392_s_at | 9.09 | 10.22 | −1.13 |
5.39×10⁻¹⁰ | IGF2R | 3482 |
| 201200_at | 10.98 | 9.82 | 1.16 |
1.72×10⁻¹¹ | CREG1 | 8804 |
| 200012_x_at | 13.08 | 11.66 | 1.42 |
1.40×10⁻⁶ | RPL21 | 6144 |
| 200061_s_at | 11.34 | 9.94 | 1.40 |
4.02×10⁻⁹ | RPS24 | 6229 |
| 200741_s_at | 13.56 | 12.34 | 1.22 |
1.28×10⁻¹¹ | RPS27 | 6232 |
| 200880_at | 8.92 | 7.73 | 1.19 |
1.17×10⁻⁷ | DNAJA1 | 3301 |
| 201012_at | 10.84 | 9.29 | 1.55 |
2.33×10⁻⁹ | ANXA1 | 301 |
| 201273_s_at | 10.76 | 9.69 | 1.07 | 0.000332 | SRP9 | 6726 |
| 201332_s_at | 8.22 | 9.35 | −1.13 |
1.44×10⁻¹³ | STAT6 | 6778 |
| 201406_at | 10.35 | 9.03 | 1.32 |
6.59×10⁻⁵ | RPL36A | 6173 |
| 201023_at | 9.93 | 8.76 | 1.17 | 0.000185 | TAF7 | 6879 |
| 200818_at | 10.17 | 9.16 | 1.02 |
5.51×10⁻⁵ | ATP5O | 539 |
GO enrichment analysis of DEGs
GO enrichment analysis was performed for 42 DEGs in
RVTE, 20 DEGs in SVTE and 22 specific DEGs of RVTE. In RVTE, most
enriched GO terms of DEGs in biological processes were associated
with biopolymer biosynthesis, including cellular protein metabolism
(P=1.12×10⁻⁸), gene expression (P=1.36×10⁻⁶),
translational elongation (P=9.65×10⁻²⁷) and cellular
macromolecular biosynthetic processes (P=8.78×10⁻⁶). In
the cellular component category, enriched GO terms were mainly
associated with the ribosomal sub-unit (P=2.03×10⁻¹⁸),
cytosol (P=2.43×10⁻¹²) and macromolecular complexes
(P=8.61×10⁻¹¹). In the molecular function category, GO
terms enriched for DEGs in RVTE included structural constituents of
ribosomes (P=9.13×10⁻²⁴), insulin-like growth factor
binding (P=0.002) and beta-adrenergic receptor kinase activity
(P=0.005) (Tables II–IV).
| Table IIGO functional enrichment analysis of
DEGs in patients with RVTE and SVTE, and top 10 specific DEGs of
RVTE associated with biological processes. |
Table II
GO functional enrichment analysis of
DEGs in patients with RVTE and SVTE, and top 10 specific DEGs of
RVTE associated with biological processes.
|
Category/GOBPID | P-value | Count (n) | Size (n) | Term |
|---|
| RVTE |
| GO:0006414 |
9.65×10⁻²⁷ | 17 | 104 | Translational
elongation |
| GO:0044267 |
1.12×10⁻⁸ | 22 | 2361 | Cellular protein
metabolic process |
| GO:0010467 |
1.36×10⁻⁶ | 25 | 3592 | Gene
expression |
| GO:0043284 |
2.88×10⁻⁶ | 23 | 3183 | Biopolymer
biosynthetic process |
| GO:0034645 |
8.78×10⁻⁶ | 23 | 3386 | Cellular
macromolecule biosynthetic process |
| GO:0044237 |
1.49×10⁻⁵ | 34 | 7160 | Cellular metabolic
process |
| GO:0009058 | 0.000114 | 24 | 4223 | Biosynthetic
process |
| GO:0042274 | 0.000360 | 2 | 10 | Ribosomal small
subunit biogenesis |
| GO:0044238 | 0.001536 | 31 | 7368 | Primary metabolic
process |
| GO:0006364 | 0.002059 | 3 | 88 | rRNA
processing |
| SVTE |
| GO:0006414 |
7.47×10⁻²² | 12 | 106 | Translational
elongation |
| GO:0044267 |
1.24×10⁻⁷ | 14 | 2499 | Cellular protein
metabolic process |
| GO:0043284 |
2.35×10⁻⁵ | 13 | 3183 | Biopolymer
biosynthetic process |
| GO:0034645 |
4.76×10⁻⁵ | 13 | 3386 | Cellular
macromolecule biosynthetic process |
| GO:0010467 |
9.42×10⁻⁵ | 11 | 3052 | Gene
expression |
| GO:0044237 | 0.000402 | 17 | 7160 | Cellular metabolic
process |
| GO:0009058 | 0.000549 | 13 | 4223 | Biosynthetic
process |
| GO:0006610 | 0.004003 | 1 | 3 | Ribosomal protein
import into nucleus |
| GO:0006364 | 0.006046 | 2 | 88 | rRNA
processing |
| GO:0042273 | 0.010641 | 1 | 8 | Ribosomal large
subunit biogenesis |
| Non-overlap |
| GO:0006414 |
3.52×10⁻⁷ | 5 | 104 | Translational
elongation |
| GO:0000296 | 0.001547 | 1 | 1 | Spermine
transport |
| GO:0003108 | 0.001547 | 1 | 1 | Negative regulation
of the force of heart contraction by chemical signal |
| GO:0008283 | 0.002157 | 6 | 917 | Cell
proliferation |
| GO:0044267 | 0.002941 | 9 | 2361 | Cellular protein
metabolic process |
| GO:0006916 | 0.002998 | 3 | 190 | Anti-apoptosis |
| GO:0048523 | 0.003033 | 7 | 1334 | Negative regulation
of cellular process |
| GO:0045988 | 0.003092 | 1 | 2 | Negative regulation
of striated muscle contraction |
| GO:0045900 | 0.003092 | 1 | 2 | Negative regulation
of translational elongation |
| GO:0048295 | 0.003092 | 1 | 2 | Positive regulation
of isotype switching to IgE isotypes |
| Table IVGO functional enrichment analysis of
DEGs in patients with RVTE and SVTE, and top 10 specific DEGs of
RVTE associated with molecular function. |
Table IV
GO functional enrichment analysis of
DEGs in patients with RVTE and SVTE, and top 10 specific DEGs of
RVTE associated with molecular function.
|
Category/GOMFID | P-value | Count (n) | Size (n) | Term |
|---|
| RVTE |
| GO:0003735 |
9.13×10⁻²⁴ | 17 | 158 | Structural
constituent of ribosome |
| GO:0003723 |
2.87×10⁻⁶ | 10 | 646 | RNA binding |
| GO:0005520 | 0.002031 | 2 | 25 | Insulin-like growth
factor binding |
| GO:0015266 | 0.002686 | 1 | 1 | Protein channel
activity |
| GO:0015077 | 0.002942 | 3 | 107 | Monovalent
inorganic cation transmembrane transporter activity |
| GO:0047696 | 0.005365 | 1 | 2 | Beta-adrenergic
receptor kinase activity |
| GO:0005010 | 0.008037 | 1 | 3 | Insulin-like growth
factor receptor activity |
| GO:0019834 | 0.008037 | 1 | 3 | Phospholipase A2
inhibitor activity |
| GO:0003729 | 0.008574 | 2 | 52 | mRNA binding |
| GO:0005047 | 0.010702 | 1 | 4 | Signal recognition
particle binding |
| SVTE |
| GO:0003735 |
4.69×10⁻²⁰ | 12 | 158 | Structural
constituent of ribosome |
| GO:0003723 |
2.79×10⁻⁵ | 6 | 630 | RNA binding |
| GO:0015266 | 0.001245 | 1 | 1 | Protein channel
activity |
| GO:0003729 | 0.001876 | 2 | 52 | mRNA binding |
| GO:0015077 | 0.007702 | 2 | 107 | Monovalent
inorganic cation transmembrane transporter activity |
| GO:0008121 | 0.009917 | 1 | 8 |
Ubiquinol-cytochrome C reductase
activity |
| GO:0016679 | 0.009917 | 1 | 8 | Oxidoreductase
activity, acting on diphenols and associated substances as
donors |
| GO:0030552 | 0.017294 | 1 | 14 | cAMP binding |
| GO:0005080 | 0.018518 | 1 | 15 | Protein kinase C
binding |
| GO:0008603 | 0.019741 | 1 | 16 | cAMP-dependent
protein kinase regulator activity |
| Non-overlap |
| GO:0003735 |
2.55×10⁻⁶ | 5 | 158 | Structural
constituent of ribosome |
| GO:0005520 | 0.000583 | 2 | 25 | Insulin-like growth
factor binding |
| GO:0047696 | 0.002881 | 1 | 2 | Beta-adrenergic
receptor kinase activity |
| GO:0005010 | 0.004318 | 1 | 3 | Insulin-like growth
factor receptor activity |
| GO:0019834 | 0.004318 | 1 | 3 | Phospholipase A2
inhibitor activity |
| GO:0005047 | 0.005753 | 1 | 4 | Signal recognition
particle binding |
| GO:0035035 | 0.008618 | 1 | 6 | Histone
acetyltransferase binding |
| GO:0008312 | 0.008618 | 1 | 6 | 7S RNA binding |
| GO:0004703 | 0.010048 | 1 | 7 | G-protein coupled
receptor kinase activity |
| GO:0031369 | 0.011475 | 1 | 8 | Translation
initiation factor binding |
In SVTE, the most significantly enriched GO terms
for DEGs in biological processes included biopolymer biosynthesis
(P=2.35×10⁻⁵), translational elongation
(P=2.35×10⁻⁵), cellular protein metabolism
(P=1.24×10⁻⁷) and rRNA processing (P=0.006). The
predominantly enriched GO terms of the cellular component category
were the cytosol (P=1.68×10⁻¹¹), the cytosolic large
ribosomal sub-unit (P=8.62×10⁻¹⁰) and macromolecular
complexes (P=4.86×10⁻⁹). The main GO terms of DEGs in
SVTE in the molecular function category were structural
constituents of ribosomes (P=4.69×10⁻²⁰), RNA binding
(P=2.79×10⁻⁵) and protein channel activity (P=0.001).
Among the DEGs in SVTE, 12 genes, including RPS3A and RPS7, were
involved in translational elongation, 2 genes (UQCRQ and COX7C)
were involved in oxidoreductase activity and 2 genes (HINT1 and
LAMP1) were associated with proteolysis (Tables II–IV).
The GO terms for biological processes of the 22
specific DEGs of RVTE were mainly translational elongation
(P=3.52×10⁻⁷), negative regulation of the force of heart
contraction by chemical signals (P=0.001) and cell proliferation
(P=0.002). In the cellular component category, enriched GO terms
were mainly associated with the cytosolic small ribosomal sub-unit
(P=1.56×10⁻⁵), ribosomal sub-unit
(P=1.84×10⁻⁵) and macromolecular complexes (P=0.0008).
The specific GO terms of the 22 specific DEGs in RVTE in the
molecular function category were mainly associated with structural
constituents of ribosomes (P=2.55×10⁻⁶), insulin-like
growth factor binding (P=0.0006), beta-adrenergic receptor kinase
activity (P=0.003) and phospholipase A2 inhibitor activity
(P=0.004). Two genes (IGF2R and IGFBP7) were shown to be involved
in anti-apoptotic signaling, ten genes, including RPL21 and RPS21,
were involved in translational elongation and six genes, including
NDUFA5, ATP5O and ADRBK1, were associated with the force of heart
contraction (Tables II–IV).
Pathway enrichment analysis of DEGs
The DEGs identified in the present study were
enriched in nine pathways (Table
V). The RVTE DEGs were mainly enriched in ribosomal pathways
(P=1.59×10⁻²³), Parkinson's disease (P=0.007) and
oxidative phosphorylation (P=0.008). The SVTE DEGs were enriched in
ribosomal pathways (P=4.58×10⁻¹⁹) and cardiac muscle
contraction (P=0.025). The non-overlapping DEGs were enriched in
ribosomal pathways (P=2.25×10⁻⁶) and protein export
(P=0.03).
| Table VKEGG pathway enrichment analysis of
DEGs in patients with RVTE and SVTE, and specific DEGs of RVTE. |
Table V
KEGG pathway enrichment analysis of
DEGs in patients with RVTE and SVTE, and specific DEGs of RVTE.
|
Category/KEGGID | P-value | Count (n) | Size (n) | Term |
|---|
| RVTE |
| K03010 |
1.59×10⁻²³ | 17 | 86 | Ribosome |
| K05012 | 0.007377 | 4 | 133 | Parkinson's
disease |
| K00190 | 0.007772 | 4 | 135 | Oxidative
phosphorylation |
| K05010 | 0.017421 | 4 | 171 | Alzheimer's
disease |
| K05016 | 0.022594 | 4 | 185 | Huntington's
disease |
| SVTE |
| K03010 |
4.58×10⁻¹⁹ | 12 | 86 | Ribosome |
| K04260 | 0.025106 | 2 | 79 | Cardiac muscle
contraction |
| Non-overlap |
| K03010 |
2.25×10⁻⁶ | 5 | 86 | Ribosome |
| K03060 | 0.03007 | 1 | 11 | Protein export |
Metabolic pathway visualization analysis
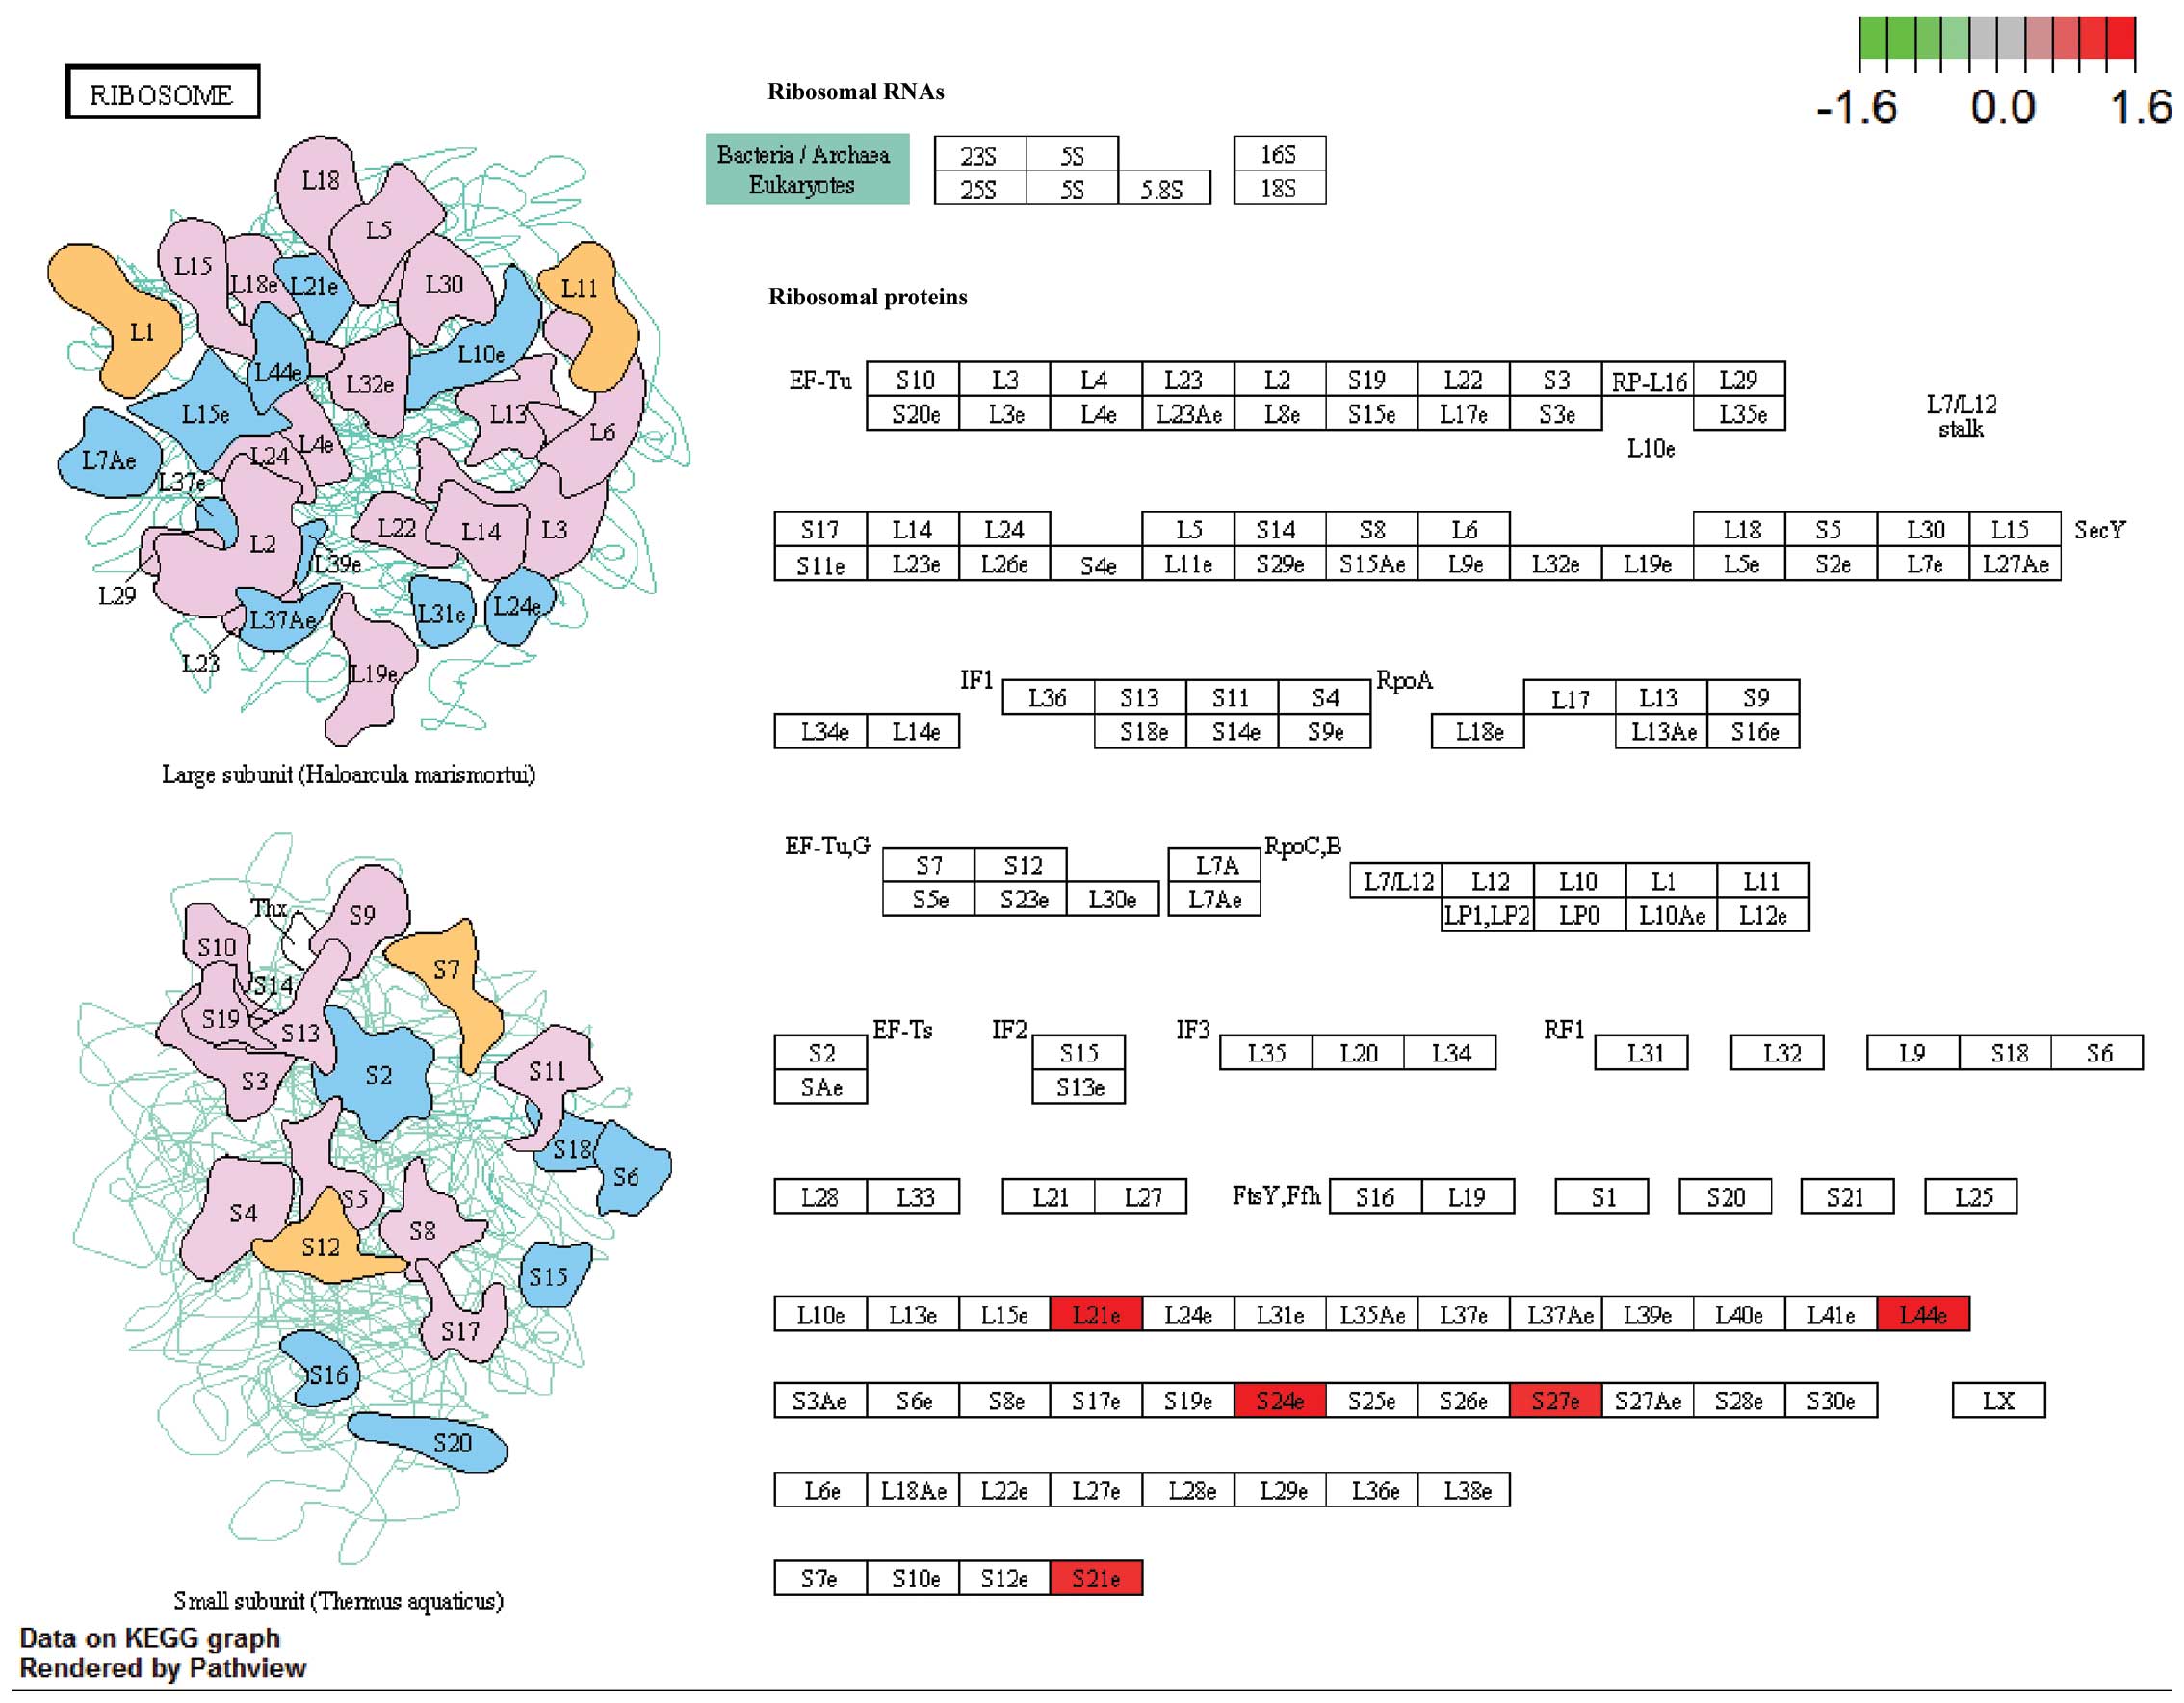
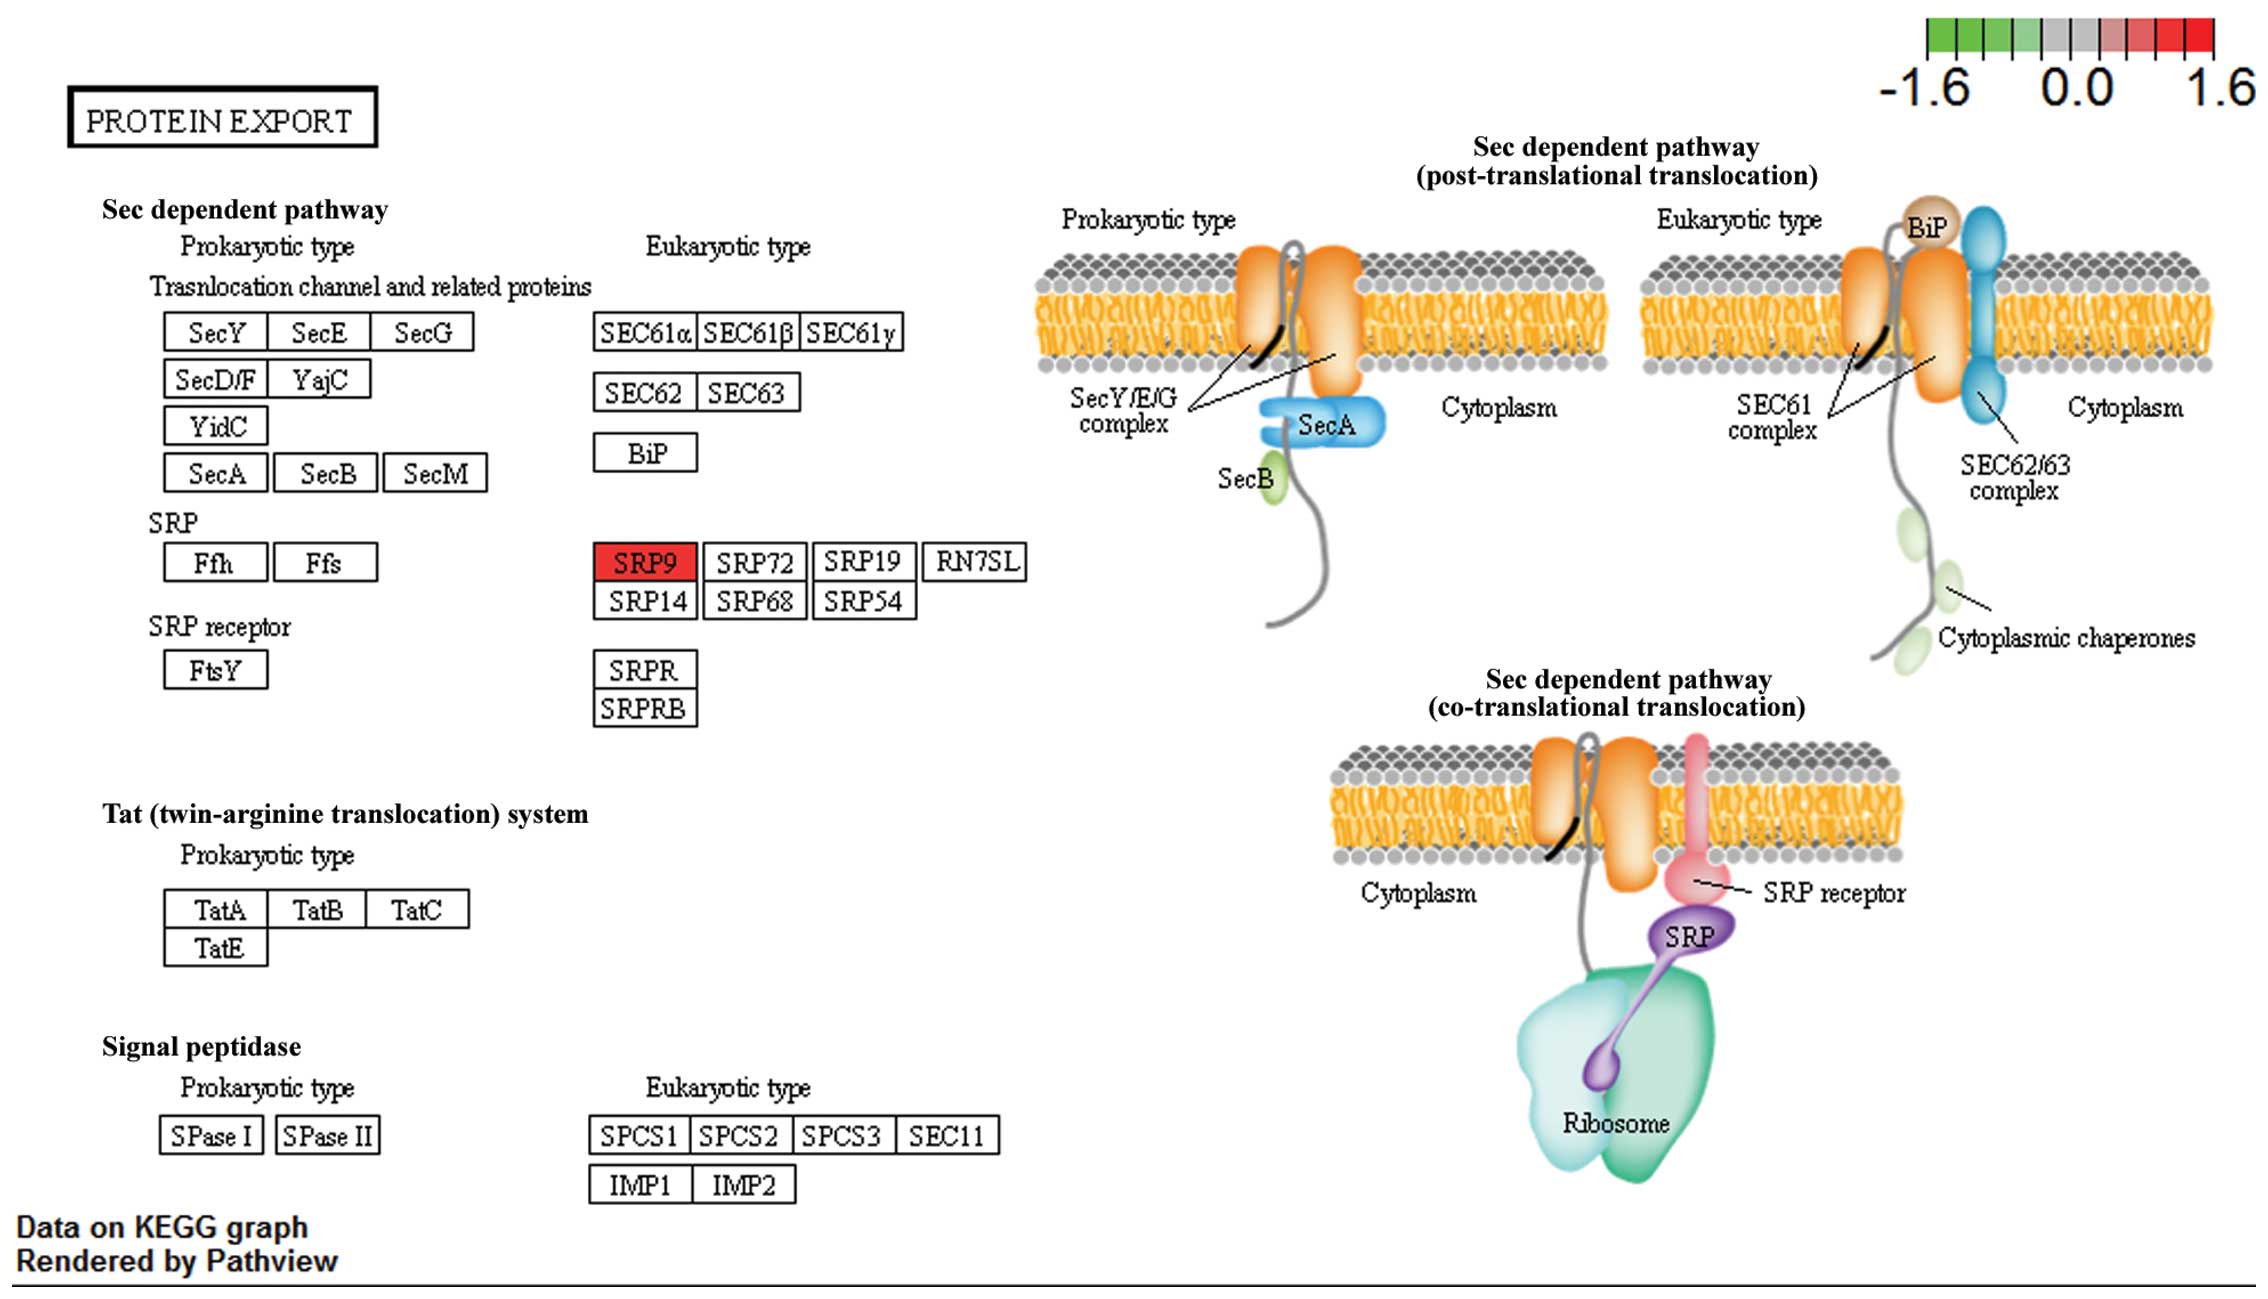
of specific DEGs of RVTE
The metabolic pathways were visualized in schemes
depicting the ribosomal pathway (Fig.
2) and the protein export pathway (Fig. 3; http://www.genome.jp/kegg/tool/map_pathway2.html).
In the ribosomal pathway, RPL21, RPS21, RPS24 and RPS27 were
upregulated and in the protein export pathway, SRP9 was
upregulated. The results suggested that these genes may be critical
in RVTE and that certain variations in the expression of these
genes may lead to an increased risk of recurrence.
Discussion
In recent years, the application of adequate
thromboprophylaxis has led to significant progress in the
management of VTE by successfully reducing morbidity and mortality
(21). However, to date, methods
for effectively preventing and diagnosing SVTE and RVTE have
remained controversial (22). The
present study used bioinformatics methods to investigate the
molecular mechanisms and potential biomarkers of SVTE and RVTE.
In the present study, gene expression profiles of
whole blood samples were successfully used to screen for DEGs in
specimens from patients with SVTE compared with those in control
specimens. With regard to enriched biological processes and
pathways for DEGs in SVTE, genes involved in ribosomal pathways,
including RPS3A and RPS7, and mitochondrial function, including
UQCRQ and COX7C, were indicated to be most consistently affected
and modulated. Ribosomal proteins have remained highly conserved
during evolution and reflect critical functions in ribosome
biogenesis; in addition, several ribosomal proteins were shown to
have extra-ribosomal functions in apoptosis, DNA repair and genetic
disease (23). A total of 12 DEGs
were involved in ribosomal pathways. A paucity of studies have
explored the pathogenesis of VTE. It has previously been indicated
that the ribosomal-related RP-MDM2-P53 axis may be involved in the
molecular pathogenesis of the 5q syndrome, and VTE was reported in
3% of patients with 5q syndrome (24). COX7C and UQCRQ are constituents of
the mitochondrial respiratory chain (25). Mutations of these two genes may
increase oxidative stress in coronary artery disease (26). The mortality after VTE is strongly
associated with presentation of underlying cardiovascular disease
(27). First-time VTE in numerous
patients is idiopathic and challenging to diagnose, while COX7C and
UQCRQ may represent novel biomarkers to identify SVTE.
The specific DEGs in RVTE were found to be mainly
involved in ribosomal pathways, heart contraction and oxidative
phosphorylation. Pathway visualization revealed that RPL21, RPS21,
RPS24 and RPS27, which all encode ribosomal proteins, were enriched
in ribosomal pathways, while SRP9 was enriched in the protein
export pathway. Furthermore, RPL21, RPS21, RPS24 and RPS27 were
found to be involved in RVTE through critical ribosome biogenesis
or extra-ribosomal functions; of note, the expression of these
genes was upregulated in patients with RVTE but unchanged in
patients with SVTE. It has been reported that certain diseases,
including transient ischemia/reperfusion and preeclampsia, are
associated with ribosomes (28,29).
RPS24 mutation was potentially linked to pathologies of
Diamond-Blackfan anemia (30). The
above results suggested that RPL21, RPS21, RPS24 and RPS27 may have
critical roles in RVTE.
The results of the present study showed that
β-adrenergic receptor kinase 1 (ADRBK1) was closely associated with
RVTE and involved in heart contraction. Polymorphisms in ADRB2 and
LPL genes are known to have central roles in vascular biology
(31). A previous study suggested
that the use of ADRBK1 as a biomarker significantly improved heart
failure therapy (32). Certain
studies showed that the ADRBK1/phosphoinositide-3 kinase (PI3K)
complex improved cardiac function and that PI3K-dependent
phosphorylation of ADRBK1 on Ser670 is responsible for the
downregulation of ADRBK1 protein via a proteasome-dependent pathway
(33,34). Furthermore, PI3K influences
insulin-like growth factor and blood vessel-related factor through
G protein beta gamma (35). These
results may suggest that ADRBK1 has a critical role in RVTE by
serving as a dual effector of the compensatory myocardial diastole
and the PI3K response.
The present study also identified NDUFA5 and ATP
ATP5O as DEGs, which were significantly associated with oxidative
phosphorylation. The oxidative stress injury and exitotoxicity in
mitochondria induced by NDUFA5 and ATP5O have been proved to be the
cause of a variety of nervous system degenerative diseases,
including Parkinson's, Alzheimer's and Huntington's disease
(36,37). Free-radical generation and
consequent oxidative stress in platelet activation and thrombotic
vascular diseases have a distinctive role with the potential
injurious effects of homocysteine (38,39).
Therefore, NDUFA5 and ATP5O inducing oxidative stress injury and
exitotoxicity in mitochondria may also have an impact on RVTE.
In conclusion, the screening performed in the
present study identified 42 DEGs in RVTE, including 35 up- and 7
downregulated genes, 20 DEGs in SVTE, including 17 up- and 3
downregulated genes, and 22 specific DEGs in RVTE. Furthermore,
functional and pathway enrichment analysis was performed for these
identified DEGs. The results indicated that DEGs in SVTE, including
COX7C and UQCRQ, may be used as potential biomarkers for SVTE and
that specific DEGs in RVTE, including ADRBK1, NDUFA5 and ATP5O, may
be considered as potential biomarkers of RVTE. However,
experimental studies are required to confirm these results.
Acknowledgments
The present study was supported by the National
Natural Science Foundation of China (grant no. 81370255).
References
|
1
|
Pabinger I and Ay C: Biomarkers and venous
thromboembolism. Arterioscler Thromb Vasc Biol. 29:332–336. 2009.
View Article : Google Scholar : PubMed/NCBI
|
|
2
|
Baglin T: What happens after venous
thromboembolism? J Thromb Haemost. 7(Suppl 1): 287–290. 2009.
View Article : Google Scholar : PubMed/NCBI
|
|
3
|
Stein PD, Beemath A and Olson RE: Trends
in the incidence of pulmonary embolism and deep venous thrombosis
in hospitalized patients. Am J Cardiol. 95:1525–1526. 2005.
View Article : Google Scholar : PubMed/NCBI
|
|
4
|
Nielsen JD: The incidence of pulmonary
embolism during deep vein thrombosis. Phlebology. 28(Suppl 1):
S29–S33. 2013. View Article : Google Scholar
|
|
5
|
Heit JA, Mohr DN, Silverstein MD,
Petterson TM, O'Fallon WM and Melton LJ III: Predictors of
recurrence after deep vein thrombosis and pulmonary embolism: A
population-based cohort study. Arch Intern Med. 160:761–768. 2000.
View Article : Google Scholar : PubMed/NCBI
|
|
6
|
Poli D and Palareti G: Assessing
recurrence risk following acute venous thromboembolism: Use of
algorithms. Curr Opin Pulm Med. 19:407–412. 2013. View Article : Google Scholar : PubMed/NCBI
|
|
7
|
Barnes DM, Wakefield TW and Rectenwald JE:
Novel biomarkers associated with deep venous thrombosis: A
comprehensive review. Biomarker Insights. 3:93–100. 2008.PubMed/NCBI
|
|
8
|
Kyrle PA, Minar E, Hirschl M, Bialonczyk
C, Stain M, Schneider B, Weltermann A, Speiser W, Lechner K and
Eichinger S: High plasma levels of factor VIII and the risk of
recurrent venous thromboembolism. N Engl J Med. 343:457–462. 2000.
View Article : Google Scholar : PubMed/NCBI
|
|
9
|
Comp PC and Esmon CT: Recurrent venous
thromboembolism in patients with a partial deficiency of protein S.
N Engl J Med. 311:1525–1528. 1984. View Article : Google Scholar : PubMed/NCBI
|
|
10
|
Palareti G, Cosmi B, Legnani C, Tosetto A,
Brusi C, Iorio A, Pengo V, Ghirarduzzi A, Pattacini C, Testa S, et
al: D-dimer testing to determine the duration of anticoagulation
therapy. N Engl J Med. 355:1780–1789. 2006. View Article : Google Scholar : PubMed/NCBI
|
|
11
|
Pabinger I, Thaler J and Ay C: Biomarkers
for prediction of venous thromboembolism in cancer. Blood.
122:2011–2018. 2013. View Article : Google Scholar : PubMed/NCBI
|
|
12
|
Ay C, Dunkler D, Simanek R, Thaler J,
Koder S, Marosi C, Zielinski C and Pabinger I: Prediction of venous
thromboembolism in patients with cancer by measuring thrombin
generation: Results from the Vienna cancer and thrombosis study. J
Clin Oncol. 29:2099–2103. 2011. View Article : Google Scholar : PubMed/NCBI
|
|
13
|
Bouman AC, Smits JJ, Ten Cate H and Ten
Cate-Hoek AJ: Markers of coagulation, fibrinolysis and inflammation
in relation to post-thrombotic syndrome. J Thromb Haemost.
10:1532–1538. 2012. View Article : Google Scholar : PubMed/NCBI
|
|
14
|
Lewis DA, Stashenko GJ, Akay OM, Price LI,
Owzar K, Ginsburg GS, Chi JT and Ortel TL: Whole blood gene
expression analyses in patients with single vs. recurrent venous
thromboembolism. Thromb Res. 128:536–540. 2011. View Article : Google Scholar : PubMed/NCBI
|
|
15
|
Gentleman RC, Carey VJ, Bates DM, Bolstad
B, Dettling M, Dudoit S, Ellis B, Gautier L, Ge Y, Gentry J, et al:
Bioconductor: open software development for computational biology
and bioinformatics. Genome Biol. 5:R802004. View Article : Google Scholar : PubMed/NCBI
|
|
16
|
Irizarry RA, Bolstad BM, Collin F, Cope
LM, Hobbs B and Speed TP: Summaries of affymetrix genechip probe
level data. Nucleic Acids Res. 31:e152003. View Article : Google Scholar : PubMed/NCBI
|
|
17
|
Wilson CL and Miller CJ: Simpleaffy: A
Bioconductor package for affymetrix quality control and data
analysis. Bioinformatics. 21:3683–3685. 2005. View Article : Google Scholar : PubMed/NCBI
|
|
18
|
R Development Core Team: R: A Language and
Environment for Statistical Computing. The R Foundation for
Statistical Computing; Vienna, Austria: 2011, ISBN:
3-900051-07-0
|
|
19
|
Zheng G, Wang H, Wei C and Li Y: iGepros:
An integrated gene and protein annotation server for biological
nature exploration. BMC Bioinformatics. 12(Suppl 14): S62011.
View Article : Google Scholar
|
|
20
|
Luo W and Brouwer C: Pathview: an
R/Bioconductor package for pathway-based data integration and
visualization. Bioinformatics. 29:1830–1831. 2013. View Article : Google Scholar : PubMed/NCBI
|
|
21
|
Verhamme P and Bounameaux H: Direct oral
anticoagulants for acute venous thromboembolism: Closing the
circle? Circulation. 129:725–727. 2014. View Article : Google Scholar
|
|
22
|
Lippi G, Cervellin G, Franchini M and
Favaloro EJ: Biochemical markers for the diagnosis of venous
thromboembolism: The past, present and future. J Thromb
Thrombolysis. 30:459–471. 2010. View Article : Google Scholar : PubMed/NCBI
|
|
23
|
Lindström MS: Emerging functions of
ribosomal proteins in gene-specific transcription and translation.
Biochem Biophys Res Commun. 379:167–170. 2009. View Article : Google Scholar
|
|
24
|
Komrokji RS, Padron E, Ebert BL and List
AF: Deletion 5q MDS: Molecular and therapeutic implications. Best
Pract Res Clin Haematol. 26:365–375. 2013. View Article : Google Scholar
|
|
25
|
Beech RD, Lowthert L, Leffert JJ, Mason
PN, Taylor MM, Umlauf S, Lin A, Lee JY, Maloney K, Muralidharan A,
et al: Increased peripheral blood expression of electron transport
chain genes in bipolar depression. Bipolar disorders. 12:813–824.
2010. View Article : Google Scholar : PubMed/NCBI
|
|
26
|
Taurino C, Miller WH, McBride MW, McClure
JD, Khanin R, Moreno MU, Dymott JA, Delles C and Dominiczak AF:
Gene expression profiling in whole blood of patients with coronary
artery disease. Clin Sci (Lond). 119:335–343. 2010. View Article : Google Scholar
|
|
27
|
White RH: The epidemiology of venous
thromboembolism. Circulation. 107:I4–I8. 2003. View Article : Google Scholar : PubMed/NCBI
|
|
28
|
Textoris J, Ivorra D, Ben Amara A,
Sabatier F, Ménard JP, Heckenroth H, Bretelle F and Mege JL:
Evaluation of current and new biomarkers in severe preeclampsia: A
microarray approach reveals thevs.ig4 gene as a potential blood
biomarker. PLoS One. 8:e826382013. View Article : Google Scholar
|
|
29
|
White BC, Sullivan JM, DeGracia DJ, O'Neil
BJ, Neumar RW, Grossman LI, Rafols JA and Krause GS: Brain ischemia
and reperfusion: Molecular mechanisms of neuronal injury. J Neurol
Sci. 179:1–33. 2000. View Article : Google Scholar : PubMed/NCBI
|
|
30
|
Choesmel V, Fribourg S, Aguissa-Touré AH,
Pinaud N, Legrand P, Gazda HT and Gleizes PE: Mutation of ribosomal
protein RPS24 in Diamond-Blackfan anemia results in a ribosome
biogenesis disorder. Hum Mol Genet. 17:1253–1263. 2008. View Article : Google Scholar : PubMed/NCBI
|
|
31
|
Zee RY, Cook NR, Cheng S, Erlich HA,
Lindpaintner K and Ridker PM: Polymorphism in the beta2-adrenergic
receptor and lipoprotein lipase genes as risk determinants for
idiopathic venous thromboembolism: A multilocus, population-based,
prospective genetic analysis. Circulation. 113:2193–2200. 2006.
View Article : Google Scholar : PubMed/NCBI
|
|
32
|
Tachibana H, Naga Prasad SV, Lefkowitz RJ,
Koch WJ and Rockman HA: Level of beta-adrenergic receptor kinase 1
inhibition determines degree of cardiac dysfunction after chronic
pressure overload-induced heart failure. Circulation. 111:591–597.
2005. View Article : Google Scholar : PubMed/NCBI
|
|
33
|
Ito K, Akazawa H, Tamagawa M, Furukawa K,
Ogawa W, Yasuda N, Kudo Y, Liao CH, Yamamoto R, Sato T, et al: PDK1
coordinates survival pathways and beta-adrenergic response in the
heart. Proc Natl Acad Sci USA. 106:8689–8694. 2009. View Article : Google Scholar : PubMed/NCBI
|
|
34
|
Lombardi MS, Vroon A, Sodaar P, van
Muiswinkel FL, Heijnen CJ and Kavelaars A: Down-regulation of GRK2
after oxygen and glucose deprivation in rat hippocampal slices:
Role of the PI3-kinase pathway. J Neurochem. 102:731–740. 2007.
View Article : Google Scholar : PubMed/NCBI
|
|
35
|
Hideshima T, Nakamura N, Chauhan D and
Anderson KC: Biologic sequelae of interleukin-6 induced PI3-K/Akt
signaling in multiple myeloma. Oncogene. 20:5991–6000. 2001.
View Article : Google Scholar : PubMed/NCBI
|
|
36
|
Chou JL, Shenoy DV, Thomas N, Choudhary
PK, Laferla FM, Goodman SR and Breen GA: Early dysregulation of the
mitochondrial proteome in a mouse model of Alzheimer's disease. J
Proteomics. 74:466–479. 2011. View Article : Google Scholar : PubMed/NCBI
|
|
37
|
Weydt P, Pineda VV, Torrence AE, Libby RT,
Satterfield TF, Lazarowski ER, Gilbert ML, Morton GJ, Bammler TK,
Strand AD, et al: Thermoregulatory and metabolic defects in
Huntington's disease transgenic mice implicate PGC-1alpha in
Huntington's disease neurodegeneration. Cell Metab. 4:349–362.
2006. View Article : Google Scholar : PubMed/NCBI
|
|
38
|
Davi G, Di Minno G, Coppola A, Andria G,
Cerbone AM, Madonna P, Tufano A, Falco A, Marchesani P, Ciabattoni
G and Patrono C: Oxidative stress and platelet activation in
homozygous homocystinuria. Circulation. 104:1124–1128. 2001.
View Article : Google Scholar : PubMed/NCBI
|
|
39
|
El Kossi MM and Zakhary MM: Oxidative
stress in the context of acute cerebrovascular stroke. Stroke.
31:1889–1892. 2000. View Article : Google Scholar : PubMed/NCBI
|