Introduction
Diabetes mellitus is a common and increasing public
health concern, which affects developed and developing countries.
In China, the prevalence of diabetes and pre-diabetes were
estimated to be 9.7 and 15.5%, respectively, in 2008 (1). Although diabetic vascular disease
contributes significantly to the disability and mortality rates of
diabetic patients, the mechanisms underlying its pathology remain
to be fully elucidated. Previous studies confirmed that the
earliest hallmark for the development of such complications is
endothelial cell injury (2,3)
characterized by increased cell inflammation and
leukocyte-endothelial cell adhesion, and by alterations in cell
proliferation, cell cycle, cellular metabolism and cell
differentiation (4–6). There are four major molecular damage
signaling pathways, which are considered indicative of a diabetic
condition: Increases in the activity of the polyol pathway,
increases in the formation of advanced glycation end products,
increases in the activation of the diacylglycerol-protein kinase C
(PKC) signaling pathway and increases in the production of reactive
oxygen species (7).
PKC is a widely conserved family, containing ≥12
serine-threonine kinases, which are involved in a number of complex
cell regulatory events. The functions of the individual PKC
isoforms are conferred by their subcellular localization, their
differentially regulated cofactor-dependent activity and their
signaling architecture following translocation and activation
(8,9). Among the diverse PKC isoforms,
PKC-β2 and PKC-δ are preferentially activated in the
heart and vasculature (10,11).
The functional role and mechanism of PKC-β2 are
important, specifically in diabetes. In previous years, several
cellular signaling pathways associated with the PKC-β2
isoform have been uncovered. Studies in Zucker fatty rats and in
mice overexpressing PKC-β2 in the vasculature indicated
that PKC-β2 upregulates the production of nitric oxide
and the expression of endothelial nitric oxide synthase via the Akt
signaling pathway (12). In human
umbilical vein endothelial cells (HUVECs) exposed to high glucose,
the mRNA expression levels of vascular endothelial growth factor
and vascular cell adhesion molecule 1 increase via the
PKC-β2 activation-dependent peroxisome
proliferator-activated receptor (PPAR)-α signaling pathway
(13). In cultured cardiomyocytes
from neonatal Sprague-Dawley rats treated with high glucose, the
structure and function of PKC-β2 are significantly
affected by the PKC/nuclear factor (NF)-κB/c-Fos signaling pathway
(14). In human aortic vascular
smooth muscle cells, alterations in cell adhesion, cell speed and
lamellipodia formation appear to be affected by the
PKC-β2-phosphoinositide 3-kinase signaling pathway
(15). The majority of the
above-mentioned studies have focused on only one molecule or
signaling pathway. However, cell signaling cascades are not linear,
but are complex and involve crosstalks. Global characterization of
the mechanism underlying the signaling pathway of the
PKC-β2 isoform remains to be fully elucidated.
In the present study, a combination of recombinant
adenovirus transfection, subcellular fraction extraction,
two-dimensional electrophoresis (2-DE), mass spectrometry and
signaling network analysis was used to identify novel downstream
effectors of the PKC-β2 signaling pathway, and to
examine crosstalk between the nucleus and cytoplasm in high
glucose-stimulated HUVECs. The present study also used subcellular
and functional proteomics to determine effective techniques to
profile subcellular signaling in endothelial cells during
PKC-β2 activation. These findings may provide
system-wide insight into the mechanisms underlying
diabetes-associated blood vessel damage.
Materials and methods
Cell culture and experimental groups
HUVECs were provided by the Institute of Biological
Sciences of Chongqing Medical University (Chongqing, China). The
cells were cultured in RPMI-1640 medium (Gibco Life Technologies,
Carlsbad, CA, USA) supplemented with 10% fetal bovine serum (Gibco
Life Technologies) at 37°C in an atmosphere containing 5%
CO2 and 95% air. To ameliorate cell responsiveness to
high glucose, the cells were serum starved for 24 h prior to
experimentation. For the 2-DE analysis, the HUVECs were divided
into the following four groups: Normal glucose control group (NG),
comprising cells treated with 5.6 mmol/l D-glucose (Bio Basic
Canada, Inc., Markham, OT, Canada); high glucose group (HG),
comprising cells treated with 25 mmol/l D-glucose;
PKC-β2 overexpression group (PO), comprising cells
transfected with Ad5-PKC-β2 cultured in medium
containing 25 mmol/l glucose; empty vector control group (EV),
comprising cells transfected with Ad5-Null, cultured in medium
containing 25 mmol/l glucose. Ad5-PKC-β2 and Ad5-Null
were constructed and identified according to the protocol of
previous studies by our group (16,17).
For western blot analyses, a PKC-β2 inhibition group
(POPI), comprising cells transfected with Ad5-PKC-β2
cultured in medium containing 25 mmol/l glucose and 1 µmol/l
CGP 53353 (Sigma-Aldrich, St. Louis, MO, USA); a high glucose and
PKC-β2 inhibition group (HGPI), comprising cells
cultured in medium containing 25 mmol/l glucose and 1 µmol/l
CGP 53353; and a normal glucose and PKC-β2 inhibition
group (NGPI) comprising cells cultured in medium containing 5.6
mmol/l glucose and 1 µmol/l CGP 53353, were also included.
All cells were cultured for six days following plating.
Recombinant adenovirus infection of
HUVECs
The recombinant adenoviral vector constructed to
express PKC-β2 had a titer of 7.5×10⁹ U/ml
Ad5-PKC-β2. The cells were seeded into 6-well culture
plates (1.5×10⁴ cells/well) and treated with RPMI-1640
medium supplemented with 25 mmol/l glucose. The cells were grown
until they were in a logarithmic phase and washed twice with
serum-free RPMI 1640 medium. The recombinant adenovirus, which was
constructed to express PKC-β2 at a multiplicity of
infection (MOI) of 100, was then added to each well. After 90 min,
the medium was replaced with RPMI-1640 medium supplemented with 5.6
mmol/l or 25 mmol/l glucose and 10% fetal bovine serum. Ad5-Null
was used as an empty vector to infect cells, which served as a
control. Over the following 6 days, the medium was replaced every 2
days. These cells were used for subsequent proteomics analysis and
confocal imaging assays.
Subcellular fractionation: Nuclear and
cytoplasm protein extraction
Nuclear extraction and
purification
The nuclear extraction and purification process was
performed, as previously described by Turck et al (18), with modifications. Cell suspensions
were centrifuged at 1,000 x g for 10 min at 4°C. Following
discarding of the supernatant, the cell pellet was resuspended
(~1×10⁶/ml) in lysis buffer (Keygen Biotech, Jiangsu,
China) containing 5 mM MgCl2, 10 mM NaCl, 5 mM Tris-HCl
(pH 7.5), 1 mM dithiothreitol (DTT) and 1 mM phenylmethanesulfonyl
fluoride, prior to being placed on ice for 10 min. This step was
repeated twice. The nuclear pellet was resuspended in 0.25 M
sucrose solution. The nuclei were then layered on a 2 M sucrose
solution and centrifuged for 30 min at 30,000 x g at 4°C. To
precipitate the DNA, 10 mM spermine (Keygen Biotech) was added for
1 h at room temperature. To extract the protein, the nuclei were
placed three times into liquid nitrogen (Jingfeng Co., Sichuan,
China) and centrifuged at 12,000 x g for 30 min; the supernatant
containing the nuclear proteins was collected. Protein
concentrations were quantified using an RC DC protein assay kit
(Bio-Rad Laboratories, Inc., Hercules, CA, USA), and the protein
solutions were aliquoted (500 µl per tube).
Cytosol protein extraction
The cytosol protein was extracted using a
ProteoExtract Cytosol/Mitochondria Fraction kit (Merck Millipore,
Darmstadt Germany), according to the manufacturer's instructions.
The cells were collected by centrifugation at 600 x g for 5 min at
4°C, prior to being washed with 10 ml ice-cold phosphate-buffered
saline (PBS) and centrifuged at 600 x g for 5 min at 4°C. The
supernatant was then discarded, and the cells were resuspended
(~1×10⁶/ml) with 1 ml 1X Cytosol Extraction Buffer mix
containing DTT and protease inhibitors. The cell suspension was
incubated on ice for 10 min and then homogenized on ice using an
ice-cold dounce tissue grinder (Keygen Biotech). The homogenates
were transferred into a 1.5 ml microcentrifuge tube and centrifuged
at 700 x g for 10 min at 4°C. The supernatants were then
transferred into a fresh 1.5 ml tube and centrifuged at 10,000 x g
for 30 min at 4°C. The resulting supernatant, the cytosolic
fraction, was collected and the samples were stored at −80°C.
Protein concentrations were quantified using a Bio-Rad RC DC
protein assay kit (Bio-Rad Laboratories, Inc.), and the protein
solutions were aliquoted (500 µl per tube).
2-DE and image analysis
The protein samples (180 µg nuclear protein,
200 µg cytosol protein) were applied to ReadyStrip™
immobilized pH gradient strips (17 cm; pH 3–10; nonlinear; Bio-Rad
Laboratories, Inc.) using a passive rehydration method as follows:
The protein samples were added to rehydration buffer (final volume,
400 µl), and 1% (w/v) DTT and ampholytes were added prior to
use. Then ReadyStrip IPG strips [pH 3–10, 17 cm, unlined (Bio-Rad
Laboratories)] were soaked in the rehydration buffer and covered
with mineral oil to be passively rehydrated for 14 h at 17°C.
Following rehydration, the strips were transferred to a
PROTEAN® i12™ Isoelectric Focusing (IEF) system (Bio-Rad
Laboratories, Inc.). IEF was performed as follows: 250 V for 30
min, linear; 1,000 V for 1 h, rapid; linear ramping to 10,000 V for
6 h; and 10,000 V for 6 h. Once IEF was complete, the strips were
equilibrated in equilibration buffer (Keygen Biotech), containing
25 mM Tris-HCl (pH 8.8), 6 M urea, 20% glycerol, 2% SDS and 130 mM
DTT) for 15 min at room temperature, prior to being incubated in
the same buffer containing 200 mM iodoacetamide (Keygen Biotech)
instead of DTT for an additional 15 min. The second dimension was
separated using a 12% SDS-PAGE gradient at 60 V for 30 min followed
by 200 V for 7 h at 16°C. For the 2-DE analysis, each of the paired
samples was run in triplicate to ensure the consistency of the
data. The protein spots were visualized with silver nitrate (Merck
Millipore). The differentially expressed proteins were identified
using PDQuest Image Analysis Software 9.0 (Bio-Rad Laboratories,
Inc.). The quantity of each spot in a gel was normalized as a
percentage of the total quantity of all spots in that gel, and was
evaluated in terms of optical density. Only the spots that changed
consistently and significantly (>1.5-fold) were selected for
tandem mass spectronomy (MS/MS) analysis.
Matrix-assisted laser
desorption/ionization time of flight (MALDI-TOF)-MS analysis and
identification
Tryptic in-gel digestion
Protein spots of interest were excised from the gel
using a sterile blade and washed three times with MilliQ water
(Merck Millipore). The gel spots were destained twice with 0.2 ml
100 mM NH4HCO3 in 50% acetonitrile (ACN) for
45 min at 37°C prior to being dehydrated in 100% ACN for 5 min. The
spots were then incubated with 10 µl of 10 µg/ml
trypsin (Bio-Rad Laboratories, Inc.) at room temperature for 1 h,
followed by incubation at 37°C overnight in 20 µl digestion
buffer (40 mM NH4HCO3 in 10% ACN; Keygen
Biotech). The liquid was then removed. The tryptic peptides were
extracted twice using 50 µl of 50% ACN with 5%
trifluoroacetic acid (TFA; Keygen Biotech) by sonication
(JY98-IIIN; Ningbo Scientz Biotechnology Co., Ltd, Zhejiang, China)
for 15 min. All extracts were then pooled and dried in a Speed Vac
(Keygen Biotech) at room temperature. The peptides were desalted
using C18 Zip Tips (EMD Millipore, Billerica, MA, USA) and
reconstituted in 5 µl 70% ACN with 0.1% TFA.
Protein identification and database
search
The MALDI-TOF-MS data were compared against the
Homo sapiens subset of sequences, according to the following
parameters: Enzyme, trypsin; allowance of up to one missed cleavage
peptide; mass tolerance, 1.0 Da; parameter carbamoyl methylation
(Cys); variable modification parameters, oxidation (at Met) and
phosphorylation (ST), peptide summary report. The data were
analyzed using the MASCOT search engine (Matrix science, London,
UK; http://www.matrixscience.com) against
the Swiss-Prot protein database. The proteins were identified on
the basis of two or more peptides, whose ion scores exceeded the
threshold and were P<0.05, indicating a 95% confidence interval
for the matched peptides.
Western blot analysis
Total protein was extracted using lysis buffer
containing a protease inhibitor cocktail. The nuclear and cytosolic
proteins were previously prepared and stored at −80°C. For western
blot analysis, 20 µg protein was separated by 12% SDS-PAGE,
transferred to a polyvinylidene difluoride membrane (EMD
Millipore), prior to being probed separately with goat polyclonal
anti-phosphorylated (p)-PKC-β2 (cat. no. sc-11760;
1:500; Santa Cruz Biotechnology, Inc., Dallas, TX, USA), mouse
monoclonal anti-PPAR-δ (cat. no. ab58137; 1:170; Abcam, Cambridge,
UK) or mouse monoclonal anti-NF-κB inhibitor-interacting Ras-like
protein 1 (NKIRAS1; cat. no. ab13666; 1:750; Abcam) primary
antibodies. The primary antibodies were incubated overnight at 4°C
and then incubated with horseradish peroxidase-conjugated secondary
antibodies (cat. no. ab150115; 1:2,000; Abcam) 2 h at 37°C. The
blots were then visualized using an Enhanced Chemiluminescence
detection kit (Beyotime Institute of Biotechnology, Jiangsu,
China). A Bio-Rad gel imaging system (Bio-Rad Laboratories) was
used to capture images of the gels and the optical density values
of the bands were determined using Quantity One image software
(Bio-Rad Laboratories). The relative expression levels of target
proteins were represented by the ratio of target protein bands to
β-actin.
Immunofluorescence and confocal
microscopy
The cells (~1×10⁶/ml) were cultured in
six-well culture plates with a glass cover slip (10 mm diameter) at
the bottom of each well of the seven groups: NG, HG, PO, NGPI,
HGPI, POPI and EV. On the seventh day, the cells were treated as
follows: Medium was removed from each well, the cells were washed
three times with PBS, treated with 4% paraformaldehyde (EMD
Millipore) for 15 min and washed again with PBS in the dark. The
cells were subsequently permeabilized with 0.2% Triton-X 100
(Solarbio, Beijing, China) for 10 min in the dark. Following three
washes with PBS, the cells were blocked with 1% goat serum and 0.1%
bovine serum albumin (Sigma-Aldrich) in PBS for 60 min at room
temperature. An anti-NF-κB (p65/RELA) antibody (EMD Millipore) was
diluted to 1:100 in blocking solution (Keygen Biotech) and added to
each cover slip overnight at 4°C. The cover slips were washed with
PBS. Fluorescein isothiocyanate (FITC)-conjugated goat anti-rabbit
IgG (1:160) in blocking solution was added to each cover slip, and
the cover slips were incubated in the dark at 37°C for 1.5 h. The
cover slips were washed three times with PBS and mounted with 50%
glycerol (Sigma-Aldrich). The fluorescence intensity of p65/RELA in
the nuclei and cytosol was detected at an excitation wavelength of
488 nm using a FITC filter (Leica Microsystems, Oberkochen,
Germany). The average absolute fluorescence intensities of the
labeled p65/RELA were calculated using Image-Pro Plus 6.0 (Media
Cybernetics,. Rockville, MD, USA). The obtained fluorescence
intensity images were analyzed using the average fluorescence as a
quantitative parameter.
Cell cycle assays
Following incubation in culture medium for six days,
the cells were harvested by trypsinization (HyClone, Logan, UT,
USA), resuspended in PBS at a concentration of 1×10⁵
cells/ml and fixed in ice-cold 75% ethanol (30 min at 4°C). The
cells were then washed twice in cold PBS, treated with 20
µg/ml RNase A (HyClone) for 30 min at room temperature, and
stained with 50 µg/ml propidium iodide (PI; Keygen Biotech).
Finally, the cells were resuspended in 1 ml PBS and analyzed using
flow cytometry, according to the manufacturer's instructions.
Apoptosis assays
The rates of apoptosis were measured using an
Annexin V-FITC Cell Apoptosis kit (Abcam, Cambridge, MA, USA). To
measure early or late/necrotic apoptotic cell death,
~1–5×10⁵ cells were stained with 5 µl
FITC-labeled Annexin V and PI in 500 µl binding buffer
(Keygen Biotech). The cells were then analyzed using flow
cytometry, according to the manufacturer's instructions. Annexin V
and PI emissions were detected in the FL1 and FL2 channels of a
FACSCalibur flow cytometer (BD Biosciences, Franklin Lakes, NJ,
USA) using emission filters of 488 nm and 532 nm, respectively.
Web-based protein-protein interactions
(PPIs)
To identify the PPIs, the web-based protein
information sharing software tool, the Biological General
Repository for Interaction Datasets (BioGRID 3.1) was used. A PPI
network was constructed of the potential connections for the
PKC-β2-associated proteins, which were identified in the
proteomics investigation.
Statistical analysis
The data are expressed as the mean ± standard
deviation. The 2-DE quantitative comparisons were performed using
PDQuest gel analysis software 9.0 (Bio-Rad Laboratories, Inc.). The
spot volumes were expressed as numerical values of optical density.
Student's t-test was used for independent groups and
inter-group comparisons. The data from the apoptosis and cell cycle
assays were analyzed using one-way analysis of variance, and a
Student-Newman-Keuls test was used for further comparisons between
the two groups. All statistical analyses were performed using SPSS
11.0 (SPSS, Inc. Chicago, IL, USA). P<0.05 was considered to
indicated a statistically significant difference.
Results
Effectiveness of recombinant adenovirus
transfection of HUVECs at MOI 100 and the role of a selective
PKC-β2 inhibitor on p-PKC-β2
In the present study, an overexpressing
PKC-β2 cell model was constructed using a recombinant
adenoviral vector, which was designed to express PKC-β2.
The cells were transfected at an MOI of 100; Ad5-Null was used as
an empty vector to infect the cells, which served as a control.
Western blotting with antibodies targeting PKC-β2
phosphorylated at specific residues revealed that incubating the
cells with high glucose levels increased the phosphorylation of
Ser-660 in the HUVECs. Treatment with CGP53353 (1 µmol/l), a
selective PKC-β2 inhibitor, significantly affected the
basal expression levels of p-PKC-β2 under high glucose
conditions (25 mmol/l). As shown in Fig. 1, incubation of the HUVECs in medium
containing high glucose concentration levels (25 mmol/l) resulted
in a significant increase in the phosphorylation levels of
PKC-β2 (1.87-fold), compared with the NG group (n=5;
P<0.05). Similar results were observed in cells transfected with
Ad5-null under high glucose conditions, however, no significant
changes were observed, despite the empty vector effect, between the
HG and EV groups (Fig. 1).
Furthermore, the protein expression levels of PKC-β2 in
the cells PO group were markedly increased (1.32-fold), compared
with the HG group (P<0.05). Treating the cells with the
selective PKC-β2 inhibitor, CGP53353, prevented the
glucose-induced and overexpression-induced phosphorylation of
PKC-β2 (P<0.05), compared with the HG group and PO
group. The levels of p-PKC-β2 were unchanged, compared
with those observed under normal glucose conditions following the
inactivation of PKC-β2 by CGP53353.
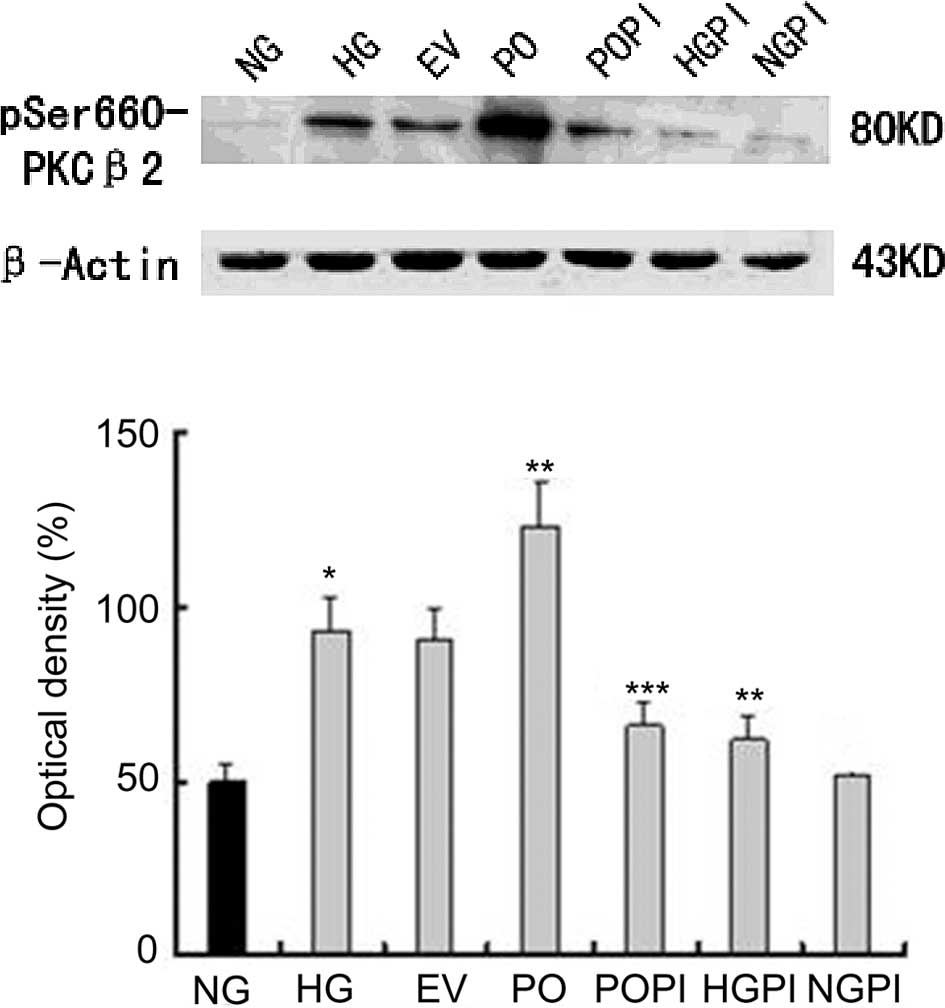 | Figure 1Functional analysis of the
effectiveness of recombinant adenovirus transfection of HUVECs at a
multiplicity of infection of 100. The phosphorylation levels of
PKC-β2 in the HUVECs was assessed using western
blotting, and the following groups were analyzed: Normal glucose
control group (5.6 mmol/l glucose); high glucose group (25 mmol/l
glucose); empty vector control group (25 mmol/l glucose+Ad5-null);
PKC-β2 overexpression group (25 mmol/l
glucose+Ad5-PKC-β2); PKC-β2 inhibition group
(25 mmol/l glucose+Ad5-PKC-β2+1µmol/l CGP53353);
high glucose inhibition group (25 mmol/l glucose+1 µmol/l
CGP53353); normal glucose inhibition group (5.6 mmol/l glucose+1
µmol/l CGP53353). The data are expressed as the mean ±
standard deviation. *P<0.05, vs. NG group;
**P<0.05, vs. HG group; ***P<0.05, vs. PO group
(n=5). HUVECs, human umbilical vein endothelial cells;
PKC-β2, protein kinase C-β2; NG, normal
glucose group; HG, high glucose group; EV, empty vector group; PO,
PKC-β2 overexpression group; POPI, PKC-β2
inhibition group; HGPI, high glucose inhibition group; NGPI, normal
glucose inhibition group. |
Comparison of nuclear and cytoplasmic
protein expression levels in HUVECs, determined using 2-DE
Representative 2-DE maps of the four groups are
shown in Fig. 2. To ensure
reproducibility, the experiment was repeated three times for each
group, and the same protein patterns were obtained. The evaluation,
normalization of images and compensation of background variations
were performed using PDQuest gel analysis software 9.0. An average
of 812±28 spots in the NG group, 832±27 spots in the HG group,
843±31 spots in the EV group and 864±36 spots in the PO group were
visualized for the nuclear proteins. For the cytosol protein
samples, an average of 591±32 spots in the NG group, 662±27 spots
in the HG group, 624±21 spots in the EV group and 637±32 spots in
the PO group were visualized. Protein expression levels in the gels
under the various conditions were quantified and processed for
comparison, and a >1.5-fold difference in optical density
between groups was considered statistically significant. To screen
the protein spots with differential expression in the various
conditions, a three-step comparison was performed. The 2-DE images
of the nuclear proteins from the cells under normal glucose
conditions were compared with those of the cells under high glucose
conditions. Inter-group statistical analyses allowed the detection
of 47±6 protein spots from the nucleus. The protein spots
exhibiting differential expression were considered to be induced by
high glucose stress. To screen the altered protein spots induced by
PKC-β2 activation, inter-group cross-matching was
applied between the Ad5-PKCδ-transfected group and the
Ad5-null-transfected group cultured in 25 mmol/l glucose medium,
resulting in 52±5 spots. The protein spots exhibiting differential
expression were considered to be induced by sustained
PKC-β2 activation under high glucose stress. A total of
38 common protein spots from steps one and two were defined as
PKC-β2-associated proteins induced under high glucose
stress, determined by inter-group comparison. A total of 30
differentially expressed spots were identified using MALDI-TOF-MS
(marked with arrows and numbers in Fig. 2A). For the cytosol protein 2-DE
gels, the same process was performed, and 28 common protein spots
were identified. From these spots, 20 proteins were identified
using MALDI-TOF-MS (marked with arrows and numbers in Fig. 2B). A database search was
subsequently performed using peptide mass fingerprints. Using
subcellular proteomics, 50 proteins were identified. Information
regarding the numbered spots is presented in Tables I and II (19–27).
For these spots, the accession number, protein name, molecular mass
(kD), theoretical PI, number of peptides, queries matched and
sequence coverage for each particular isoform of a protein were
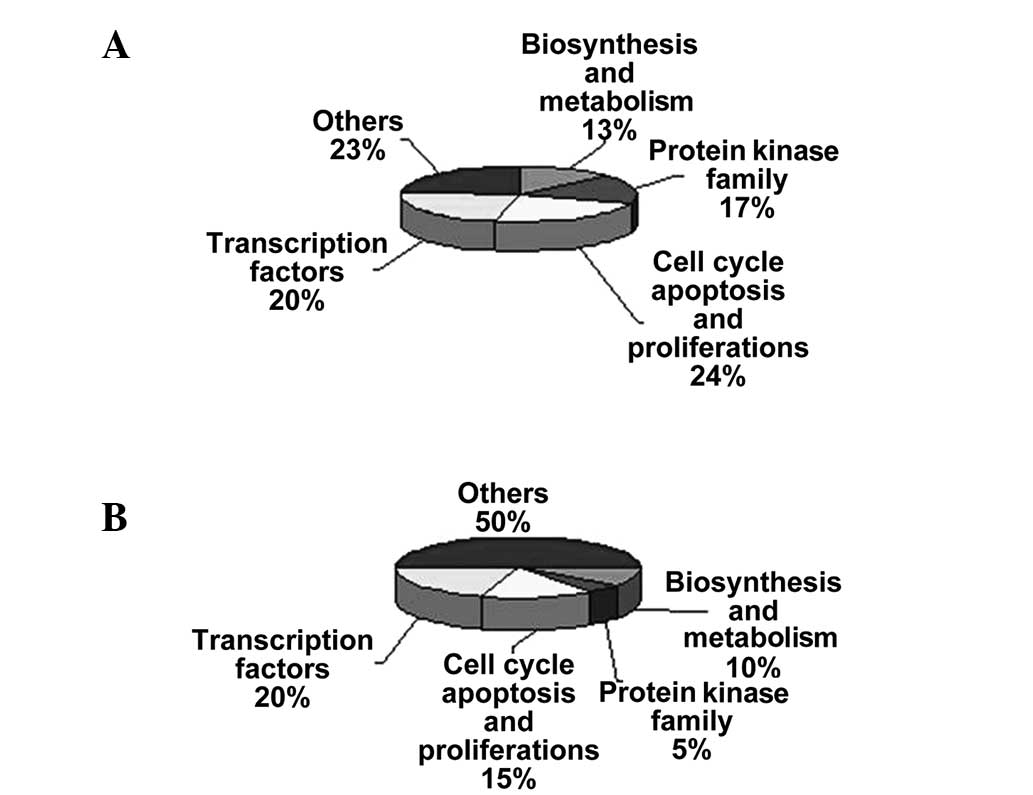
reported. The majority of these proteins were found to be involved
in cellular functions, including biosynthesis, metabolism, cell
cycle, apoptosis, proliferation and transcription, and are
associated with the protein kinase family (Fig. 3A and B).
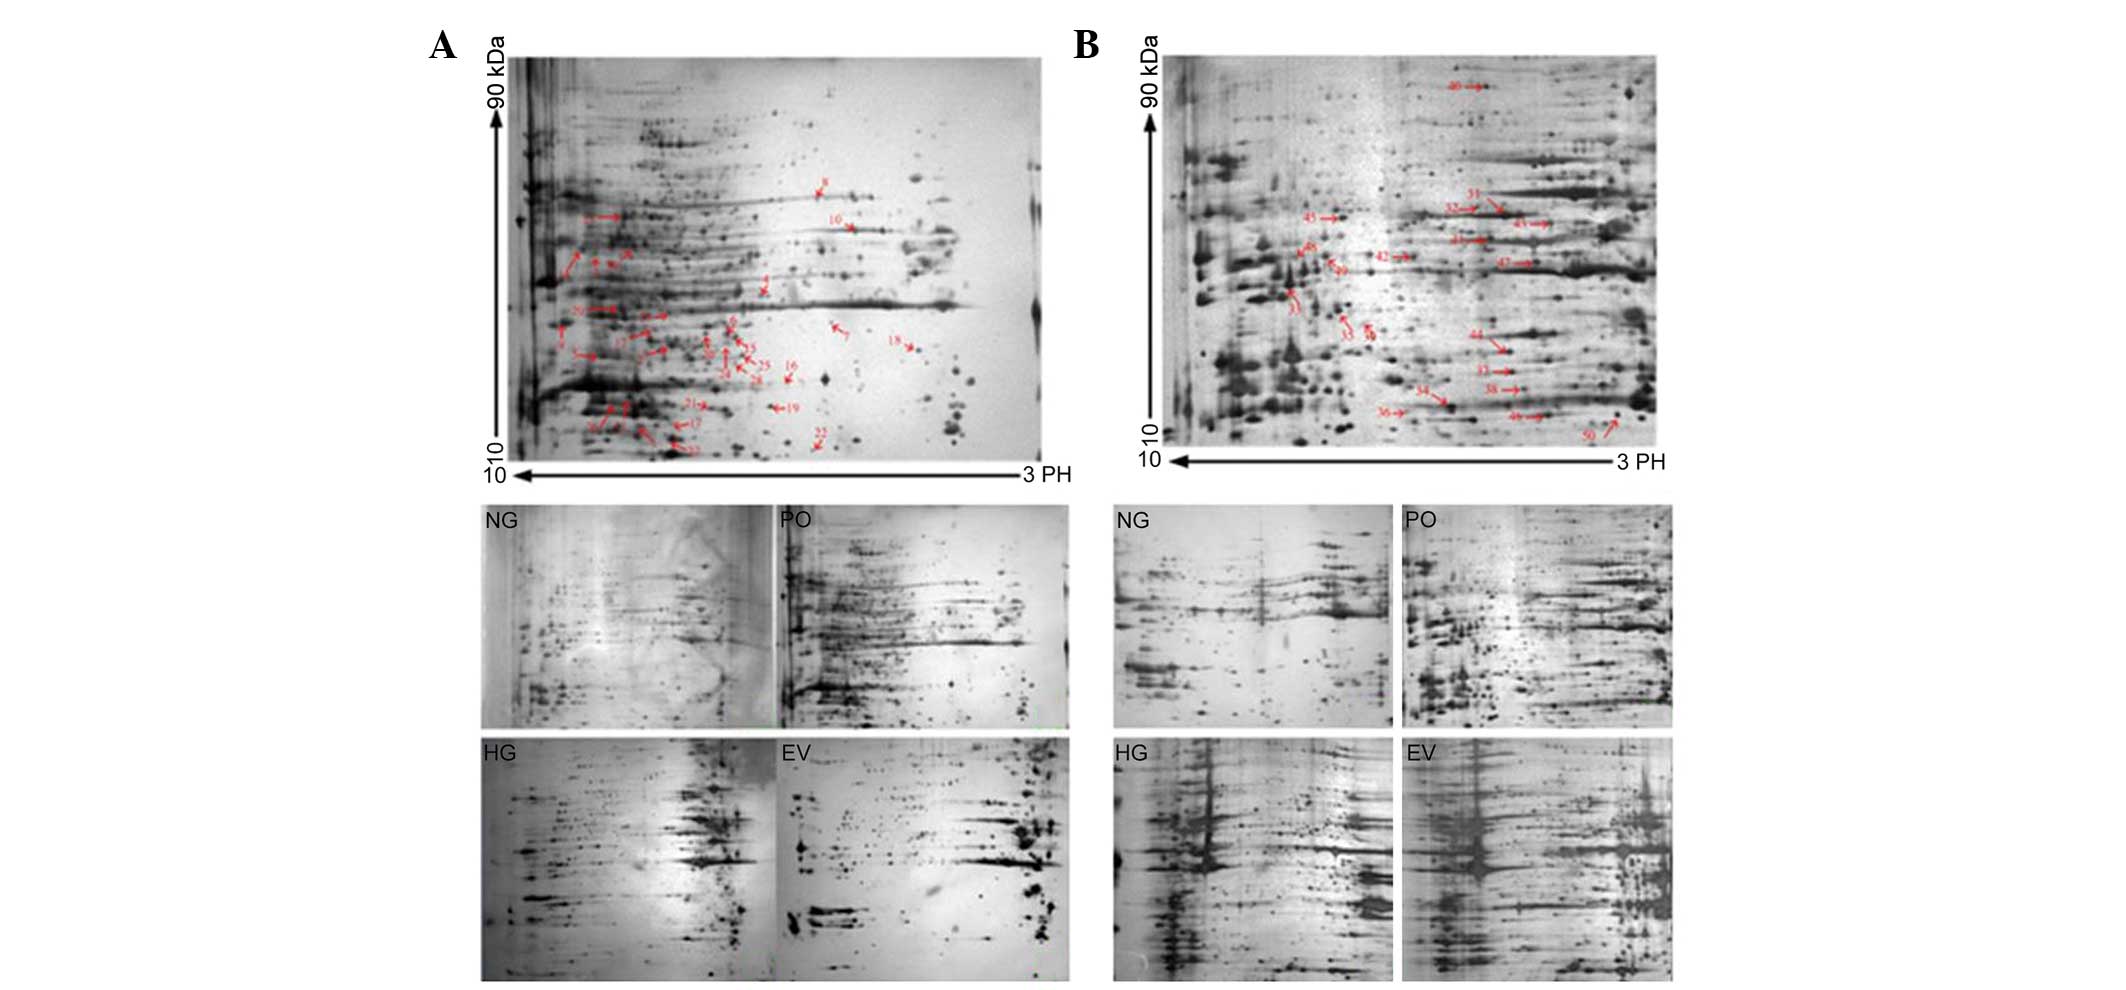 | Figure 2(A) 2-DE gel of the nuclear proteins
from the HUVECs of each group. Nuclear proteins (180 µg)
were separated on pH 3–10 nonlinear IPG strips (17 cm) in the first
dimension, prior to being separated by 12% SDS-PAGE in the second
dimension and visualized by silver staining. The HUVECs were
divided into four treatment groups: Normal glucose control group
(5.6 mmol/l glucose); high glucose group (25 mmol/l glucose);
PKC-β2 overexpression group (Ad5-PKC-β2+25
mmol/l glucose); empty vector control group (Ad5-Null+25 mmol/l
glucose). A total of 30 differentially expressed spots were
identified using MALDI-TOF-MS/MS (marked with arrows and numbers).
(B) 2-DE gel of the cytoplasmic proteins from the HUVECs of each
group. Cytoplasmic proteins (200 µg) were separated on pH
3–10 nonlinear IPG strips (17 cm) in the first dimension, prior to
being separated by 12% SDS-PAGE in the second dimension and
visualized by silver staining. The treatment groups were the same
as those in Fig. 2A. A total of 20
differentially expressed spots were identified using
MALDI-TOF-MS/MS (marked with arrows and numbers). Information on
each numbered spot is reported in Table I. 2-DE, two-dimensional
electrophoresis; HUVECs, human umbilical vein endothelial cells;
MALDI-TOF-MS/MS, matrix-assisted laser desorption/ionization-time
of flight-tandem mass spectronomy; IPG, immobilized pH gradient;
PKC-β2, protein kinase C-β2. NG, normal
glucose group; HG, high glucose group; EV, empty vector group; PO,
PKC-β2 overexpression group. |
 | Table IProteins identified by
matrix-assisted laser desorption/ionization time of flight/mass
spectronomy in the nuclear and cytoplasm of human umbilical vein
endothelial cells. |
Table I
Proteins identified by
matrix-assisted laser desorption/ionization time of flight/mass
spectronomy in the nuclear and cytoplasm of human umbilical vein
endothelial cells.
| Spot and
function | Symbol | Protein name | SWISS-PORT
accession no. | Molecular mass
(kD) | Theoretical PI | Queries
matched | Sequence coverage
(%) | Upregulation or
downregulation |
|---|
| Subcellular
location: Nucleus Biosynthesis and metabolism |
| 1 | DUS22 | Dual specificity
protein phosphatase 22 | Q9NRW4 | 21.19 | 8.28 | 4 | 18 | U (1.56±0.05
fold) |
| 2 | DYR | Dihydrofolate
reductase | P00374 | 29.11 | 7.63 | 8 | 32 | U (1.60±0.03
fold) |
| 3 | CP2U1 | Cytochrome P450,
family 2, subfamily U, polypeptide 1 | Q7Z499 | 62.41 | 8.63 | 3 | 25 | U (1.69±0.10
fold) |
| 4 | 1A1L1 |
1-aminocyclopropane-1-carboxylate
synthase-like protein | Q96Q16 | 57.86 | 6.01 | 2 | 19 | D (1.59±0.08
fold) |
| Protein kinase
family |
| 5 | PRKACB | cAMP-dependent
protein kinase catalytic subunit beta | P22694 | 40.71 | 8.84 | 4 | 27 | U (1.62±0.04
fold) |
| 6 | MAPK3 | Mitogen-activated
protein kinase 3 | P27361 | 43.48 | 6.86 | 7 | 37 | U (1.65±0.04
fold) |
| 7 | AMPK β1 | 5′-AMP-activated
protein kinase subunit beta-1 | Q9Y478 | 30.53 | 5.49 | 3 | 24 | U (1.71±0.12
fold) |
| 8 | PRKCZ | Protein kinase C
zeta type | Q05113 | 68.55 | 5.49 | 8 | 12 | U (1.57±0.02
fold) |
| 9 | MP2K7 | Dual specificity
mitogen-activated protein kinase kinase 7 | O14733 | 47.91 | 9.26 | 5 | 18 | U (1.65±0.12
fold) |
| Cell cycle,
apoptosis and proliferation |
| 10 | LMNB2 | Lamin-B2 | Q03252 | 67.76 | 5.29 | 7 | 10 | U (1.66±0.08
fold) |
| 11 | THAP1 | THAP
domain-containing protein 1 | Q9NVV9 | 25.44 | 8.66 | 4 | 28 | U (1.55±0.03
fold) |
| 12 | CCNE |
G1/S-specific cyclin-E2 | O96020 | 47.3 | 7.96 | 5 | 32 | U (1.65±0.07
fold) |
| 13 | DBF4B | Protein DBF4
homolog B | Q8NFT6 | 68.57 | 8.72 | 5 | 25 | U (1.67±0.10
fold) |
| 14 | CDC7 | Cell division cycle
7-RELAted protein kinase | O00311 | 64.65 | 8.96 | 3 | 27 | D (1.60±0.05
fold) |
| 15 | CCNJ | Cyclin-J | Q5T5M9 | 43.238 | 6.75 | 6 | 19 | D (1.56±0.04
fold) |
| 16 | PHB | Prohibitin | P35232 | 29.84 | 5.75 | 4 | 13 | D (1.66±0.03
fold) |
| Transcription
factors |
| 17 | SAP25 | Histone deacetylase
complex subunit | Q8TEE9 | 21.21 | 7.63 | 8 | 38 | U (1.64±0.06
fold) |
| 18 | RCAN3 | Calcipressin-3 | Q9UKA8 | 27.77 | 4.54 | 9 | 61 | U (1.60±0.04
fold) |
| 19 | COMD7 | COMM
domain-containing protein 7 | Q86VX2 | 22.7 | 5.96 | 8 | 56 | U (1.74±0.09
fold) |
| 20 | ZN193 | Zinc finger protein
193 | O15535 | 46.95 | 6.95 | 4 | 7 | U (1.60±0.07
fold) |
| 21 | EID2 | EP300-interacting
inhibitor of differentiation | Q8N6L1 | 25.29 | 6.95 | 7 | 42 | U (1.61±0.07
fold) |
| 22 | ATRAP | Type-1 angiotensin
II receptor-associated protein | Q6RW13 | 17.58 | 5.71 | 3 | 11 | D (1.57±0.03
fold) |
| 23 | PPARD | Peroxisome
proliferator activated receptor Δ | Q03181 | 50.683 | 7.53 | 8 | 56 | D (1.82±0.06
fold) |
| Others |
| 24 | CAH2 | Carbonic anhydrase
2 | P00918 | 29.26 | 6.87 | 13 | 21 | U (1.66±0.05
fold) |
| 25 | GLNA | Glutamine
synthetase | P15104 | 42.67 | 6.43 | 15 | 23 | U (1.61±0.07
fold) |
| 26 | GSTA1 |
Glutathione-S-transferase A1 | P08263 | 25.67 | 8.91 | 16 | 24 | U (1.58±0.02
fold) |
| 27 | PPIGA | Cyclophilin A | Q13427 | 18.23 | 7.68 | 12 | 31 | U (1.57±0.04
fold) |
| 28 | GON4L | GON4L protein | Q6PHZ4 | 34.33 | 6.52 | 2 | 6 | U (1.58±0.04
fold) |
| 29 | FIBB | Fibrinogen β
chain | P02675 | 56.56 | 8.64 | 7 | 22 | U (1.69±0.10
fold) |
| 30 | HNRPL | Heterogeneous
nuclear ribonucleoprotein L | P14866 | 64.73 | 8.46 | 2 | 18 | U (1.62±0.10
fold) |
| Subcellular
location: Cytoplasm Biosynthesis and metabolism |
| 31 | UAP1 |
UDP-N-acteylglucosamine
pyrophosphorylase | Q16222 | 59.13 | 5.92 | 9 | 26 | U (1.61±0.02
fold) |
| 32 | HSP7E | Heat-shock 70kDa
protein 14 | Q0VDF9 | 55.44 | 5.41 | 6 | 29 | D (1.74±0.05
fold) |
| Protein kinase
family |
| 33 | PRKACA | cAMP-dependent
protein kinase catalytic subunit α | P17621 | 40.68 | 8.84 | 5 | 8 | U (1.63±0.02
fold) |
| CC, apoptosis and
proliferation |
| 34 | BNIP3 | BCL2/adenovirus E1B
19kDa interacting protein 3 | Q12983 | 21.53 | 6.31 | 5 | 12 | U (1.60±0.04
fold) |
| 35 | NEK6 |
Serine/threonine-protein kinase Nek6 | Q9HC98 | 36.26 | 8.26 | 4 | 7 | U (1.74±0.06
fold) |
| 36 | CDN1B | Cyclin-dependent
kinase inhibitor 1B | P46527 | 22.29 | 6.54 | 3 | 23 | D (1.64±0.03
fold) |
| Transcription
factors |
| 37 | NRBF2 | Nuclear receptor
binding factor | Q96F24 | 32.53 | 5.61 | 4 | 24 | U (1.72±0.07
fold) |
| 38 | NKIRAS1 | NF-κB
inhibitor-interacting Ras-like protein 1 | Q9NYS0 | 22.80 | 6.00 | 6 | 28 | D (1.66±0.13
fold) |
| 39 | ACOT8 | Acylcoenzyme A
thioesterase 8 | O14734 | 36.35 | 7.23 | 2 | 10 | D (1.60±0.04
fold) |
| 40 | SAPMI | Sterile alpha and
TIR motif containing 1 | Q6SZW1 | 80.365 | 6.14 | 7 | 9 | D (1.61±0.04
fold) |
| Others |
| 41 | TBG1 | Tubulin, gamma
1 | P23258 | 51.48 | 5.75 | 6 | 14 | U (1.68±0.10
fold) |
| 42 | ACTT1 | Actin-RELAted
protein T1 | Q8TDG2 | 42.24 | 6.32 | 5 | 9 | U (1.58±0.06
fold) |
| 43 | DESM | Mutant desmin | P17661 | 53.53 | 5.21 | 7 | 16 | U (1.67±0.04
fold) |
| 44 | F92A1 | Protein
FAM92A1 | A1XBS5 | 33.59 | 5.89 | 3 | 18 | U (1.67±0.11
fold) |
| 45 | LCAP | Leucine
aminopeptidase | Q9UIQ6 | 56.41 | 7.58 | 2 | 11 | U (1.61±0.04
fold) |
| 46 | HPCL1 | Hippocalcin-like
protein 1 | P37235 | 22.29 | 5.21 | 7 | 23 | U (1.65±0.05
fold) |
| 47 | TXNL1 | Thioredoxin-like
protein 5 | O43396 | 42.17 | 5.4 | 3 | 12 | U (1.58±0.06
fold) |
| 48 | UB2CB |
Ubiquitin-conjugating enzyme E2C-binding
protein | Q7Z6J8 | 44.61 | 8.51 | 4 | 8 | D (1.66±0.12
fold) |
| 49 | MIIP | Migration and
invasion-inhibitory protein | Q5JXC2 | 43.37 | 8.33 | 4 | 19 | D (1.61±0.09
fold) |
| 50 | MLRV | Myosin regulatory
light chain 2 | P10916 | 18.78 | 4.92 | 5 | 21 | D (1.58±0.07
fold) |
| Table IIDifferently expressed proteins
associated with PKC-β2 and involved in molecular
mechanisms in human umbilical vein endothelial cells. |
Table II
Differently expressed proteins
associated with PKC-β2 and involved in molecular
mechanisms in human umbilical vein endothelial cells.
| Spot code | Protein name | Protein
function | Reference |
|---|
| 6 | MAPK3 | MAPKs are
serine-threonine kinases that regulate a wide variety of cellular
functions. MAPKs are involved in both the initiation and of
meiosis, mitosis, and post-mitotic functions in differentiated
cells by phosphorylating several transcription factors. | 19 |
| 13 | DBF4B | DBF4B is a
regulatory subunit of CDC7, activating its kinase activity, and has
a central role in DNA replication and cell proliferation. DBF4B is
required for the progression of the S and M phases. The CDC7-DBF4B
complex selectively phosphorylates the MCM2 subunit at Ser-40, and
is also involved in regulating the initiation of DNA replication
during the cell cycle. | 20,21 |
| 14 | CDC7 | CDC7 encodes a cell
division cycle protein with kinase activity that is important for
the G1/S phase transition. | 22,23 |
| 23 | PPARD | PPARD is a member
of the peroxisome proliferator-activated receptor family. PPARD
regulates the peroxisomal β-oxidation pathway of fatty acids, and
functions as a transcriptional activator for the acylcoenzyme A
oxidase gene. PPARD decreases NPC1L1 expression following ligand
activation. | 24,25 |
| 32 | HSP7E | HSP7E inhibits
stress-induced JNK activation, thereby reducing apoptosis. | 26 |
| 38 | NKIRAS1 | NKIRAS1 is an
atypical Ras-like protein that acts as a potent regulator of NF-κB
activity by preventing the degradation of NFKBIB by the majority of
signals, which is why NFKBIB is more resistant to degradation.
NKIRAS1 may act by inhibiting the phosphorylation of NFKBIB, and by
mediating cytoplasmic retention of the p65/RELA NF-κB subunit. It
is unclear whether NKIRAS1 acts as a GTPase. GTP and GDP-bound
forms of NKIRAS1 inhibit NFKBIB phosphorylation. | 27 |
Identification of proteins located
downstream of PKC-β2 using western blot analysis
To determine whether the protein alterations
observed in the proteomics analysis correlated with changes in
protein expression at the translational level, two proteins, the
expression levels of which were significantly altered in the
proteomics analysis, PPAR-δ and NKIRAS1 (Figs. 4 and 5), were selected for further examination
using western blotting.
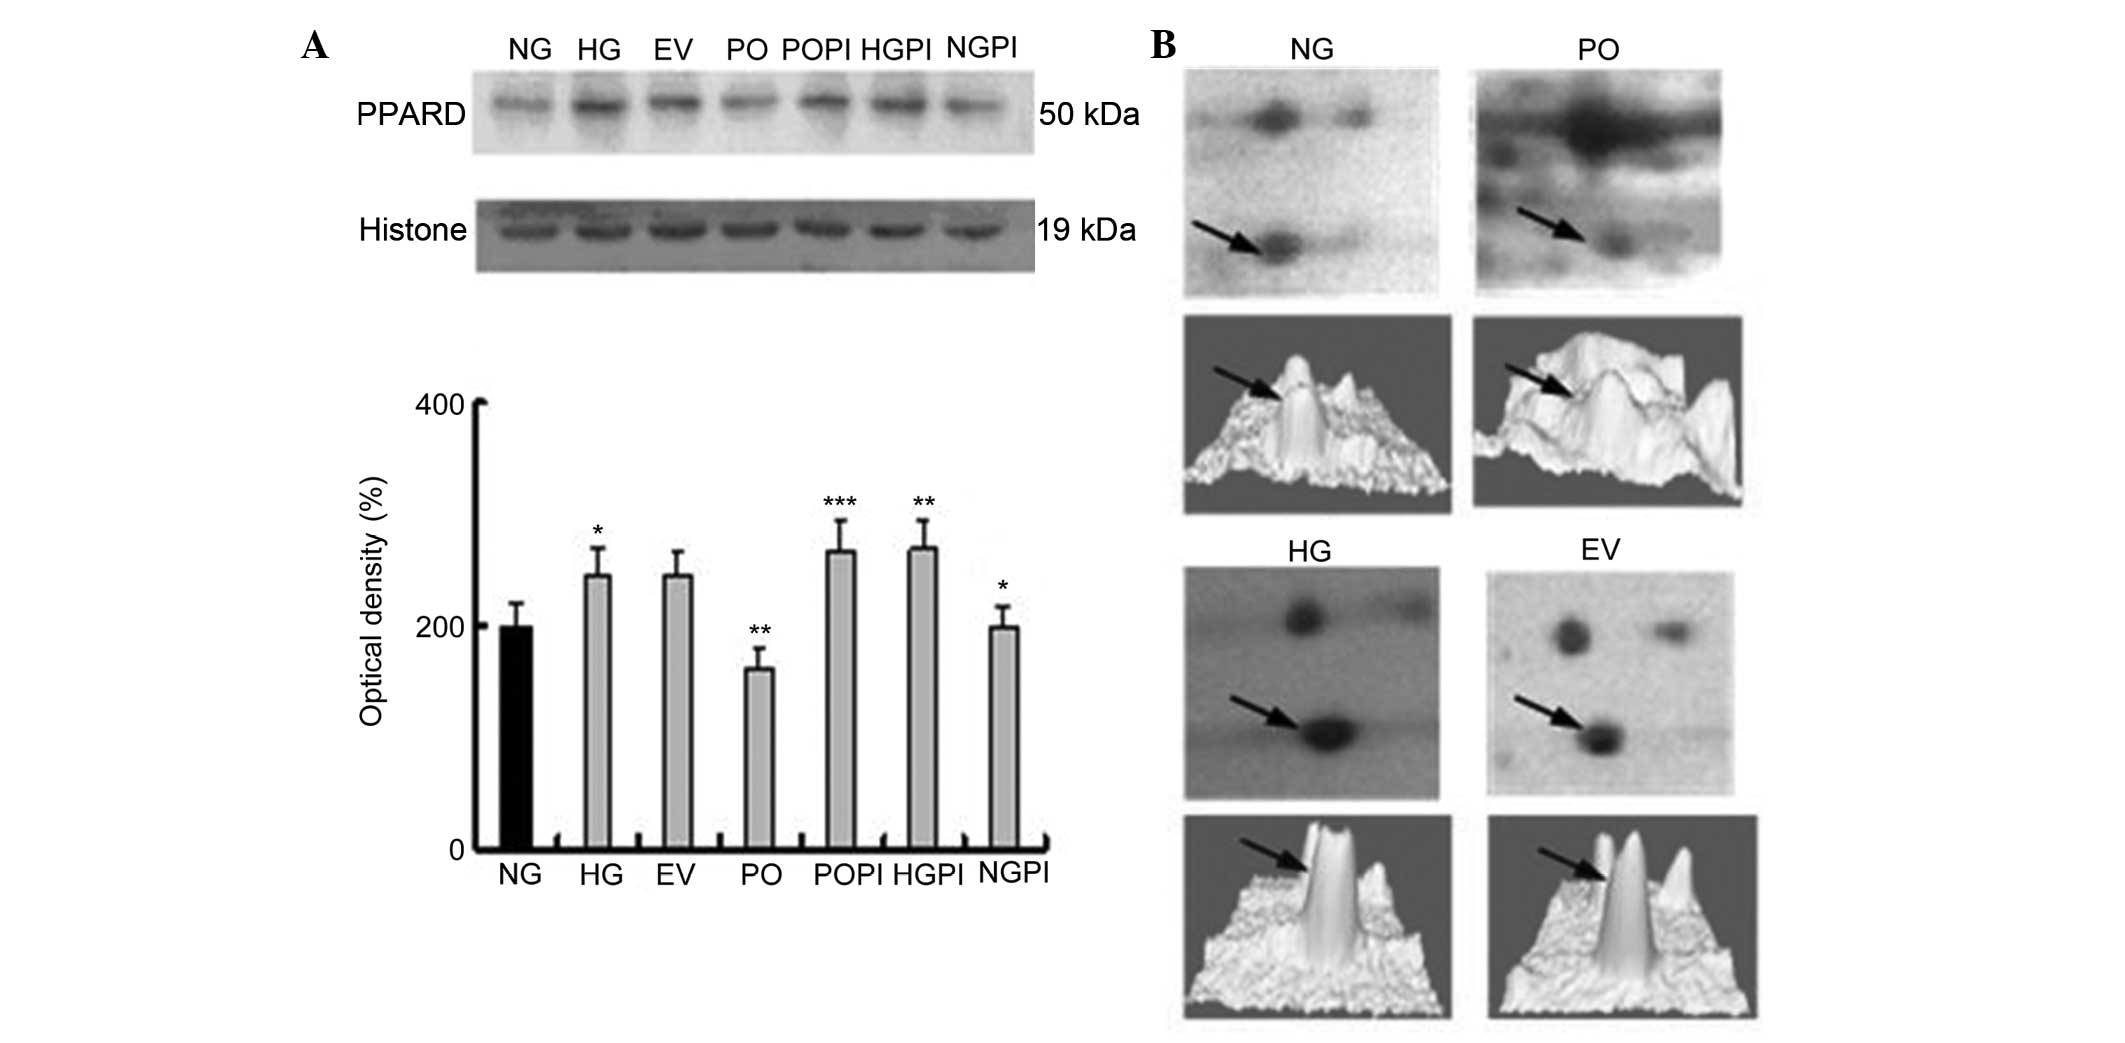 | Figure 4Expression levels of the
PKC-β2 downstream protein, PPAR-δ, in the nuclear
fraction. (A) Representative images of the quantitative
measurements of the protein expression of PPAR-δ in the seven
treatment groups using western blot analysis with a PPAR-δ-specific
antibody. The error bars represent the mean ± standard deviation of
the mean. *P<0.05, vs. NG control group,
**P<0.05, vs. HG group; ***P<0.05, vs.
PO group (n=5). (B, above) Two-dimensional electrophoresis gel map
of PPAR-δ from the nuclear fractions of the NG, HG, EV and PO
groups; arrows indicate PPAR-δ spots. (B, below) Three-dimensional
image of the expression of PPAR-δ, determined using PDQuest
software. PKC-β2, protein kinase C-β2; PPAR,
peroxisome proliferator-activated receptor; NG, normal glucose
group; HG, high glucose group; EV, empty vector group; PO,
PKC-β2 overexpression group; POPI, PKC-β2
inhibition group; HGPI, high glucose inhibition group; NGPI, normal
glucose inhibition group. |
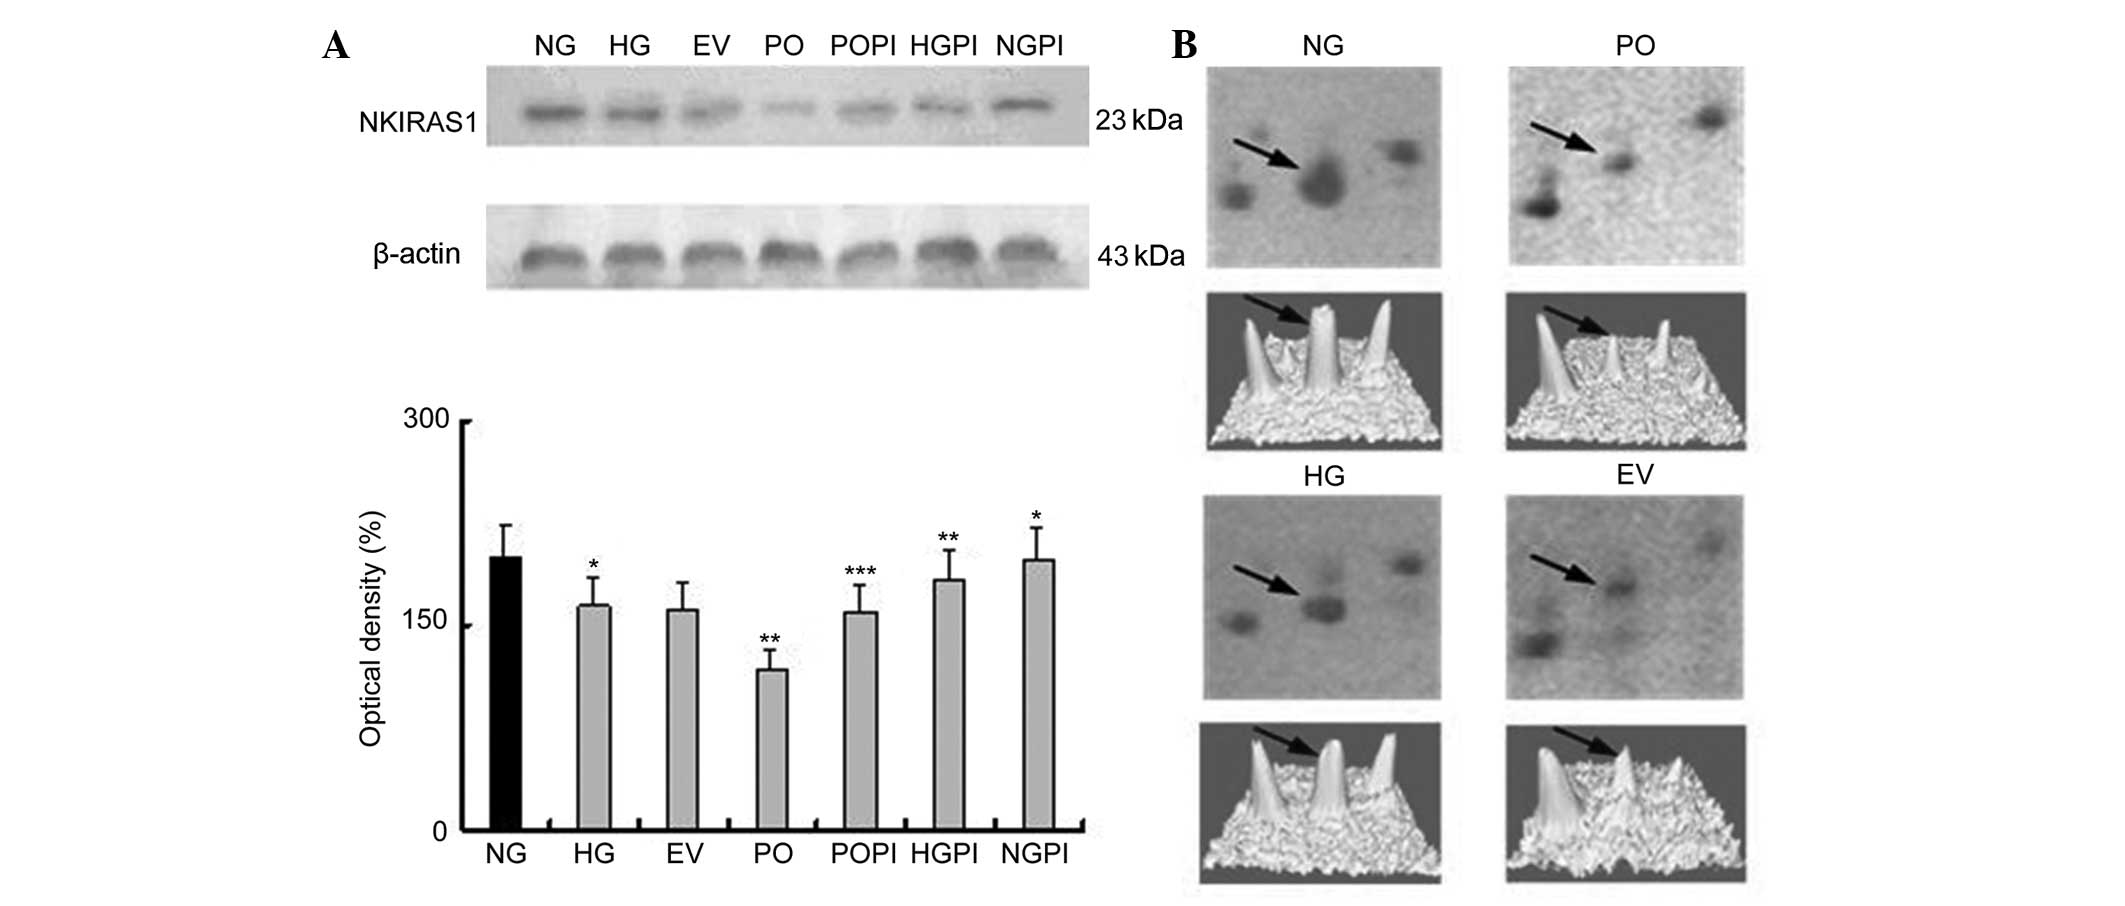 | Figure 5(A) Expression levels of NKIRAS1 in
the cytoplasmic fraction, determined using western blot analysis
with an NKIRAS1-specific antibody. The error bars represent the
mean ± standard deviation of the mean. *P<0.05, vs.
NG control group; **P<0.05 vs. HG group;
***P<0.05, vs. PO group (n=5) (B, above)
Two-dimensional electrophoresis gel map of NKIRAS1 in the nuclear
fractions of the NG, HG, EV and PO groups; arrows indicate the
NKIRAS1 spots. (B, below) Three-dimensional image of the expression
of NKIRAS1, determined using PDQuest software. NKIRAS1, nuclear
factor NF-κB inhibitor-interacting Ras-like protein 1.
PKC-β2, protein kinase C-β2; NG, normal
glucose group; HG, high glucose group; EV, empty vector group; PO,
PKC-β2 overexpression group. |
Determination of the expression levels of
PPAR-δ in the various groups of HUVECs
A PPAR-δ-specific mouse monoclonal antibody was used
to quantify the expression levels of PPAR-δ in the nuclear fraction
under various conditions. The groups were the same as in Fig. 1. As shown in Fig. 4, there was a 1.2±0.03-fold increase
in the expression levels of PPAR-δ (also termed PPAR-β) in the
HUVECs exposed to 25 mmol/l glucose, compared with those exposed to
5 mmol/l glucose (n=5; P<0.05). In the cells overexpressing
PKC-β2 in 25 mmol/l glucose, these stimulatory effects
were partly eliminated, and the expression was decreased by
34.0±2.3%, compared with the HG group (P<0.05). No significant
changes in the expression levels of PPAR-δ were observed in the EV
group. Furthermore, treatment of the cells with the selective
PKC-β2 inhibitor, CGP53353 (1 µmol/led to an
increase in the expression of PPAR-δ (110±2.4%), compared with the
HG group (P<0.05; Fig. 4).
Determination of the expression levels of
NKIRAS1 in the various groups of HUVECs
An NKIRAS1-specific mouse monoclonal antibody was
used to quantify NKIRAS1 expression levels in the cytoplasmic
fraction under various conditions. As shown in Fig. 5, incubation of the HUVECs with
medium containing high glucose (25 mmol/l) resulted in a decrease
in thee expression of NKIRAS1 by 17.69%, compared with the NG group
(n=5; P<0.05). No significant changes in the expression of
NKIRAS1 were observed, compared with the EV group. Furthermore, the
protein expression levels of NKIRAS1 in the cells overexpressing
PKC-β2 in 25 mmol/l glucose were significantly lower, by
28.16%, compared with the HG group (P<0.05). Treating the cells
with the selective PKC-β2 inhibitor, CGP53353, inhibited
the PKC-β2-induced decrease in the expression of NKIRAS1
(P<0.05), compared with the HG group and PO group. The
expression levels of NKIRAS1 were increased following
PKC-β2 inactivation by CGP53353 (1.12-fold), compared
with the HG group, (P<0.05), and 1.34-fold, compared with the PO
group (P<0.05).
Upregulation and nuclear translocation of
NF-κB (p65/RELA) is induced by sustained PKC-β2
activation under high glucose stress in HUVECs
Protein function analysis offered further insight
into the above findings. NKIRAS1 was one of the PKC-β2
downstream effectors identified in the present study. NKIRAS1 acts
as a potent regulator of NF-κB activity by inhibiting the
phosphorylation of NF-κB and by mediating the cytoplasmic retention
of the p65/RELA NF-κB subunit (27). To determine the role of high
glucose levels and PKC-β2 in a potential HUVEC
PKC-β2-NF-κB signaling pathway, immunofluorescence
labeling of NF-κB (p65/RELA) was detected using confocal microscopy
and an isoform-specific antibody. As shown in Fig. 6, under basal conditions, p65/RELA
exhibited a homogeneous distribution in the cytoplasm of the
HUVECs. There was little distribution of p65/RELA in the nucleus
under normal glucose conditions (Fig.
6A; NG group). However, the fluorescence intensity per cell was
increased in the cytoplasm, and the cytosol-to-nucleus fluorescence
ratio was decreased in the presence of high glucose levels
(Fig. 6A; HG group). Ad5-null
transfection was used as an empty vector control (Fig. 6A; EV group). As expected, no marked
differences were observed, and the quantity and distribution of
fluorescence were the same in response to the 25 mmol/l high
glucose concentrations in the cells transfected with or without the
Ad5-null vector. When PKC-β2 was overexpressed (Fig. 6A; PO group), the fluorescence
intensity per cell significantly increased (1.95-fold), compared
with the non-transfected HG control group (**P<0.05;
Fig. 6B). In addition, the
cytosol-to-nucleus fluorescence ratio of p65/RELA significantly
decreased in these groups (1.21±0.06 and 1.48±0.07, respectively;
P<0.05; Fig. 6C). These results
suggested that the protein expression levels of p65/RELA in the
HUVECs were increased, and that p65/RELA was activated via nuclear
translocation following high glucose exposure. Therefore, the
upregulation and nuclear translocation of NF-κB (p65/RELA) were
induced by sustained PKC-β2 activation under high
glucose stress in the HUVECs.
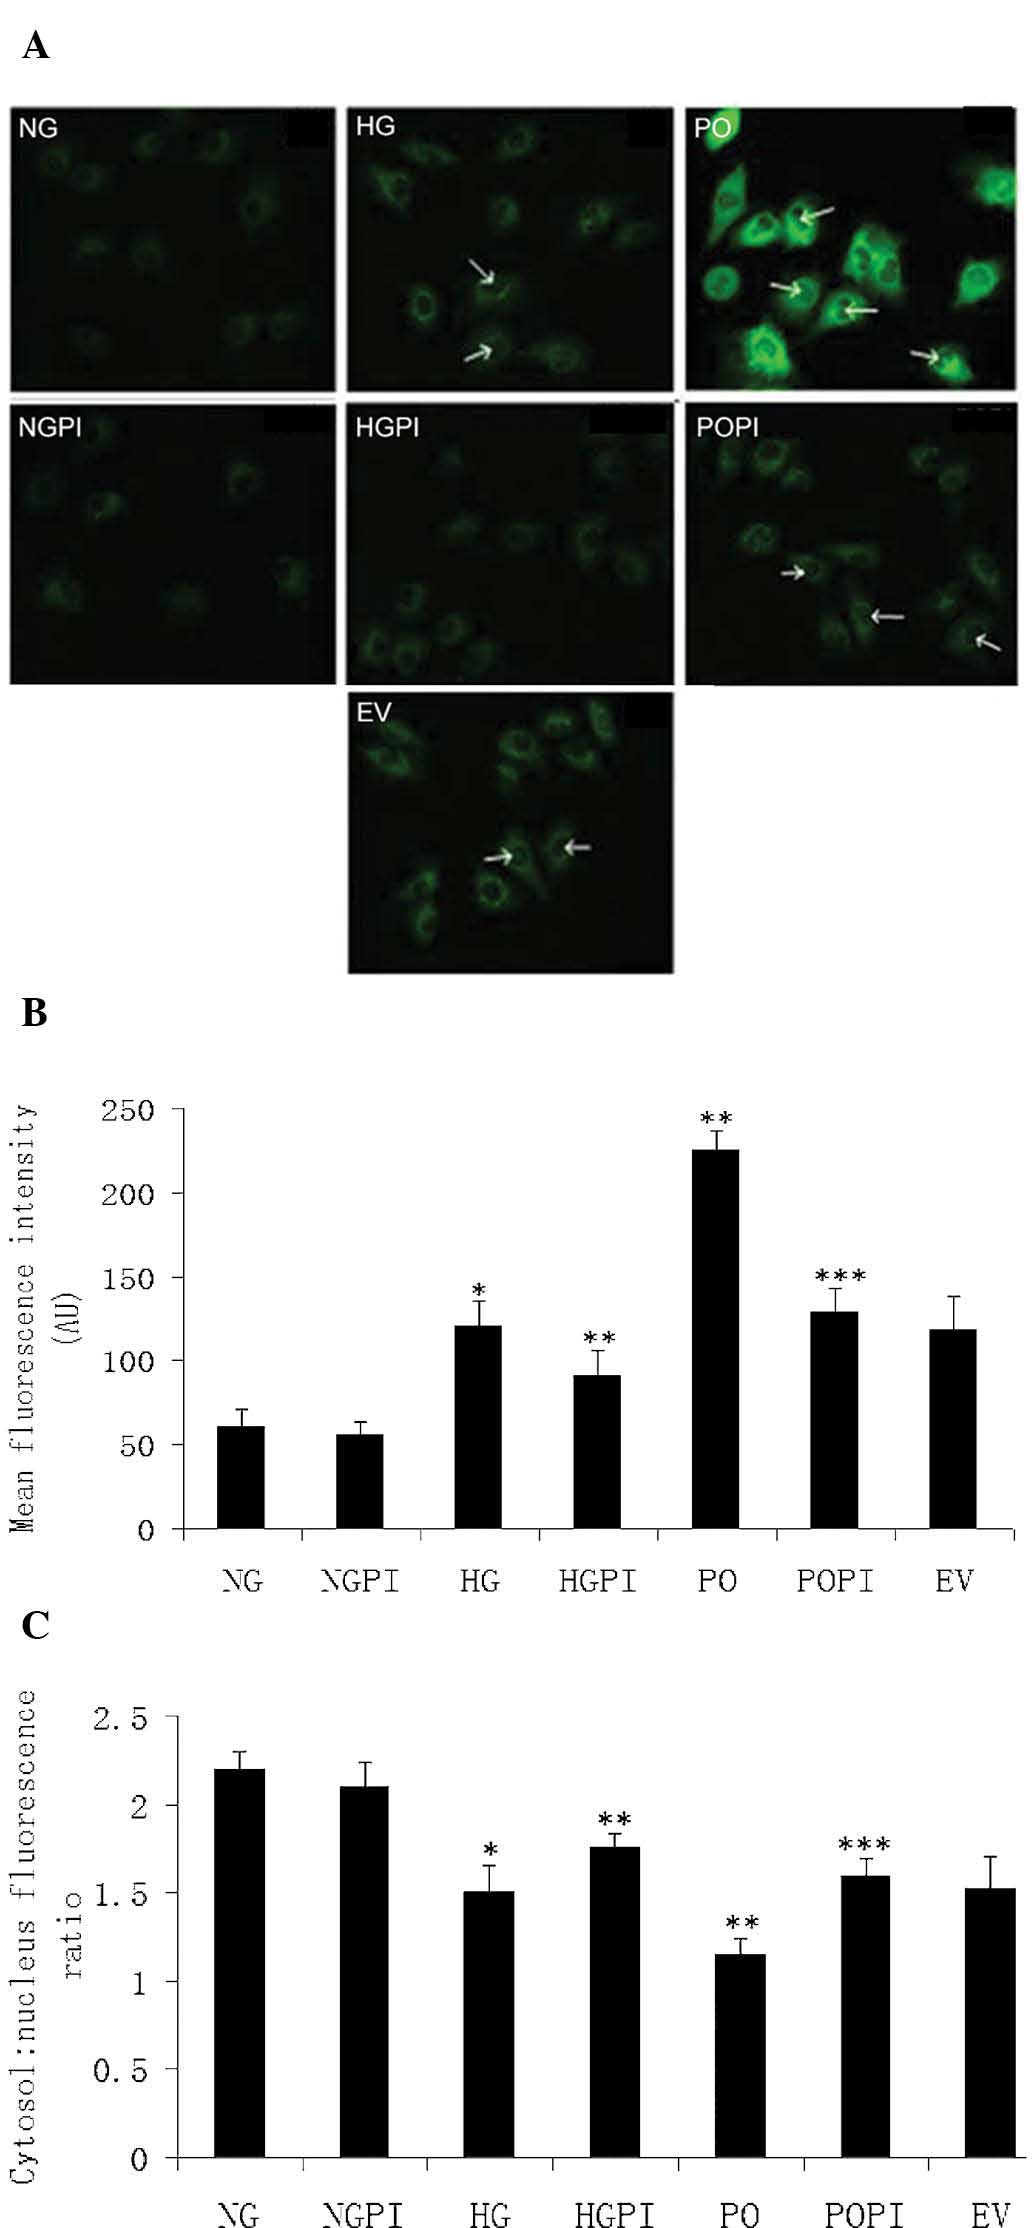 | Figure 6Determination of fluorescence
intensity. (A) Expression and distribution of NF-κB (p65/RELA),
determined using confocal microscopy (magnification, ×400) in the
seven treatment groups: Normal glucose control group (5.6 mmol/l
glucose); high glucose group (25 mmol/l glucose); empty vector
control (25 mmol/l glucose+Ad5-null); PKC-β2
overexpression (25 mmol/l glucose+Ad5-PKC-β2);
PKC-β2 inhibition (25 mmol/l
glucose+Ad5-PKC-β2+1 µmol/l CGP53353); high
glucose inhibition (25 mmol/l glucose+1µmol/l CGP53353);
normal glucose inhibition (5.6 mmol/l glucose+1 µmol/l
CGP53353). Green fluorescence represents protein abundance of
p65/RELA in the HUVECs. White arrows indicate increased
fluorescence in the nucleus. (B) Mean fluorescence intensity in the
cells. (C) Measurement of the cytosol: nucleus fluorescence ratio.
The error bars represent the mean ± standard deviation of the mean.
*P<0.05, vs. NG control group;
**P<0.05, vs. HG group; ***P<0.05, vs.
PO group (n=5). HUVECs, human umbilical vein endothelial cells;
RELA, v-rel avian reticuloendotheliosis viral oncogene homolog A;
PKC-β2, protein kinase C-β2; NG, normal
glucose group; HG, high glucose group; EV, empty vector group; PO,
PKC-β2 overexpression group; POPI, PKC-β2
inhibition group; HGPI, high glucose inhibition group; NGPI, normal
glucose inhibition group. |
Cell cycle analysis
Flow cytometric analysis was used to determine which
cell cycle phase was affected by high glucose levels, and whether
PKC-β2 activation affected the HUVECs. The majority of
the cells were distributed in the G0/G1 phase
in the NG, HG and EV groups (Table
III). By contrast, high glucose (25 mmol/l) induced cell cycle
arrest in the G0/G1 phase, compared with
normal glucose (P<0.05). The distribution of endothelial cells
throughout the phases of the cell cycle when exposed to high
glucose, and overexpressing Ad5-PKC-β2 (PO group) was
40.98±3.86% for the G0/G1 phase, 38.23±4.33%
for the S phase and 22.42±1.68% for the G2/M phase. The
percentage of cells in the S and G2/M phases increased
significantly when the cells were transfected with
Ad5-PKC-β2, compared with the high glucose control
(P<0.05). No significant difference was observed in the EV cells
exposed to 25 mmol/l glucose, compared with the HG group
(P>0.05).
| Table IIICell cycle distribution in various
experimental groups. |
Table III
Cell cycle distribution in various
experimental groups.
| Group | G0/G1 (%) | S (%) | G2/M (%) |
|---|
| NG | 68.51±2.08 | 20.55±3.21 | 10.95±2.36 |
| HG | 73.78±3.85a | 22.15±2.42a | 4.07±1.21a |
| EV | 72.06±2.18 | 23.45±3.02 | 3.49±2.20 |
| PO | 40.98±3.86b | 38.23±4.33b | 22.42±1.68b |
Growth studies
The growth conditions of the cells were detected
using flow cytometric analysis. The results demonstrated that
~4.9±0.98% of the cells underwent early apoptosis in response to
5.6 mmol/l glucose exposure for six days, whereas ~8.70±1.15% of
the cells were considered early apoptotic in the presence of 25
mmol/l glucose. The early apoptosis ratio of the cells exposed to
25 mmol/l glucose was increased by 1.78-fold, compared with that of
the cells exposed to 5.6 mmol/l glucose (Fig. 7; P<0.05). However, the early
apoptosis ratio of cells overexpressing PKC-β2 exposed
to 25 mmol/l glucose was markedly decreased (73.8±5.23%), compared
with the HG group (P<0.05). By contrast, the cells transfected
either with or without the Ad5-null empty vector, and cultured
under conditions of high glucose exhibited no significant changes
in apoptotic ratio distribution (P>0.05). To examine whether
PKC-β2 modulated high glucose-induced cell cycle
acceleration and proliferation, the cells were also treated with a
PKC-β2 selective inhibitor, CGP53353 (1 µmol/l),
which amplified the anti-proliferative and pro-apoptotic effects of
high glucose exposure in the cultured HUVECs. These results
suggested that the over-expression of PKC-β2 led to cell
cycle acceleration and proliferation, whereas inhibition of the
PKC-β2 isoform had the reverse effect (P<0.05).
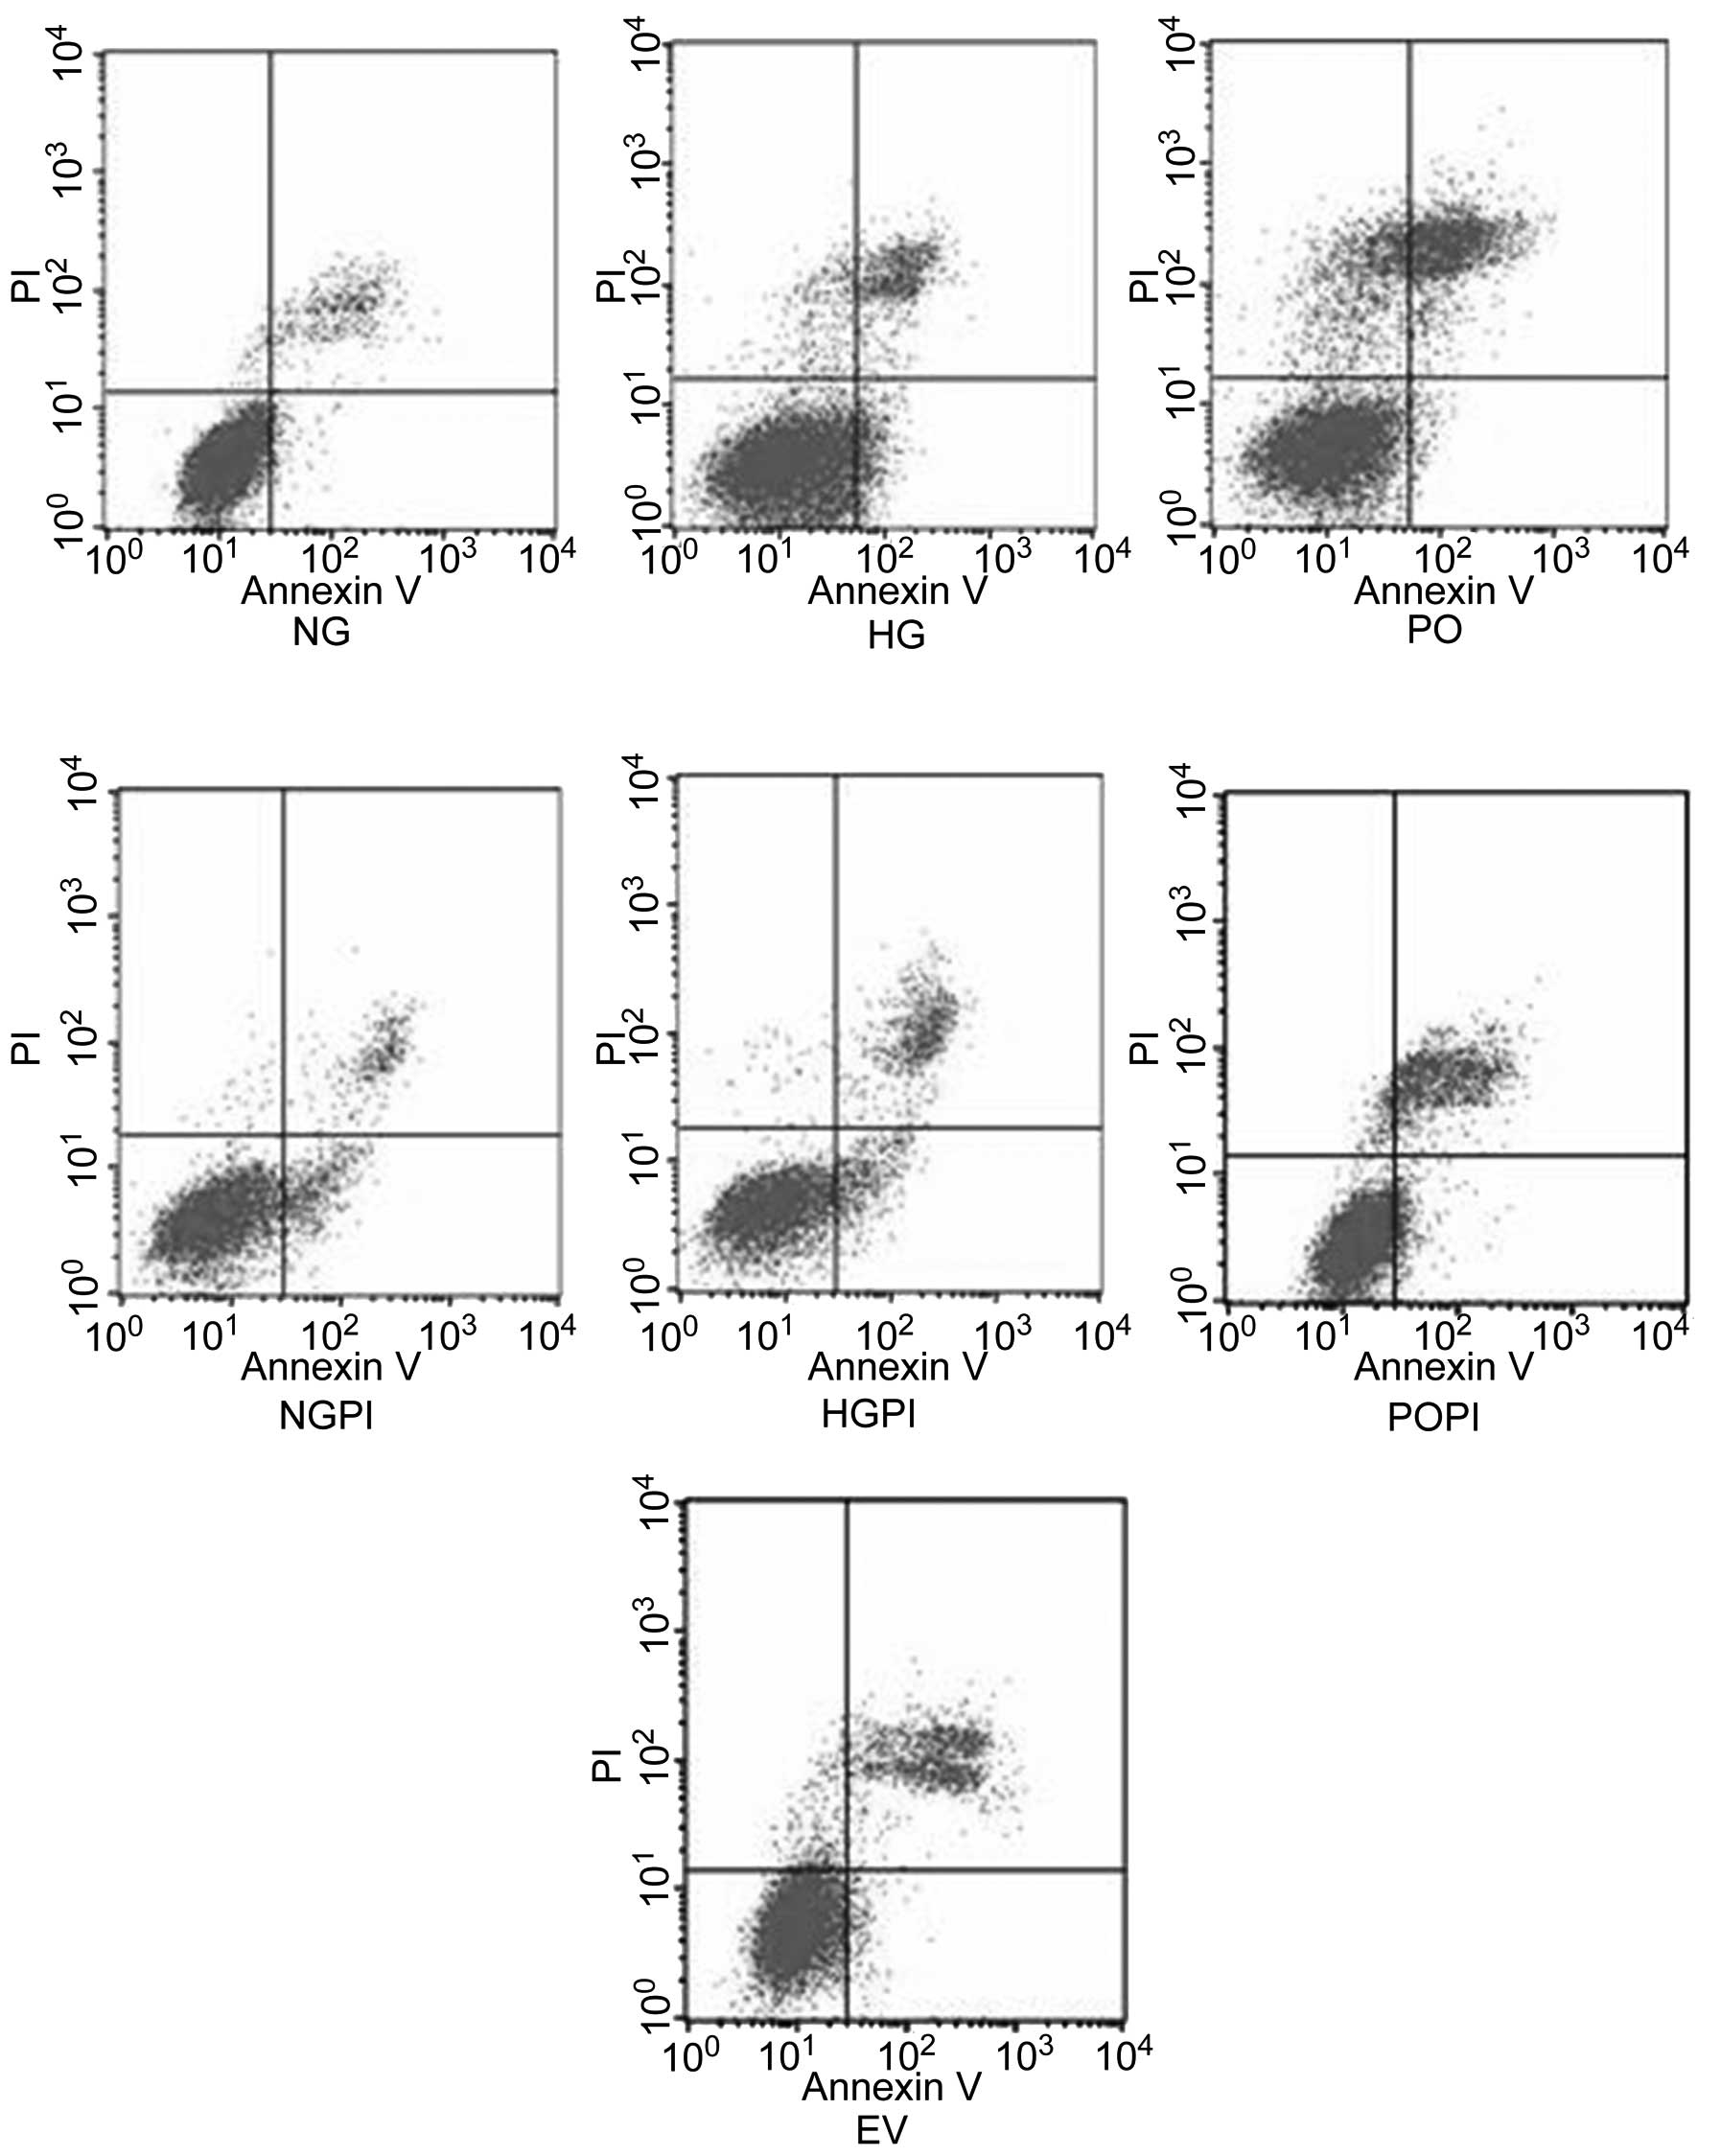 | Figure 7HUVECs were treated according to the
following treatment groups: Normal glucose control group (5.6
mmol/l glucose); high glucose group (25 mmol/l glucose); empty
vector control group (25 mmol/l glucose+Ad5-null);
PKC-β2 overexpression group (25 mmol/l
glucose+Ad5-PKC-β2); a PKC-β2 inhibition
group (25 mmol/l glucose+Ad5-PKC-β2+1 µmol/l
CGP53353),; high glucose inhibition group (25 mmol/l glucose+1
µmol/l CGP53353); normal glucose inhibition group (5.6
mmol/l glucose+1 µmol/l CGP53353). Cytogram of the cells
undergoing apoptosis demonstrates the early apoptotic cells in the
lower right quadrant, which were Annexin V positive and
phosphatidyl inositol negative. Late apoptotic or necrotic cells
are in the upper right quadrant, which were phosphatidyl inositol
positive and Annexin V positive. Live cells in the lower left
quadrant were negative for the two fluorescent probes. HUVECs,
human umbilical vein endothelial cells; PKC-β2, protein
kinase C-β2; NG, normal glucose group; HG, high glucose
group; EV, empty vector group; PO, PKC-β2 overexpression
group; POPI, PKC-β2 inhibition group; HGPI, high glucose
inhibition group; NGPI, normal glucose inhibition group; PI,
propidium iodide. |
Network of PKC-β2-associated
proteins, determined using subcellular proteomics
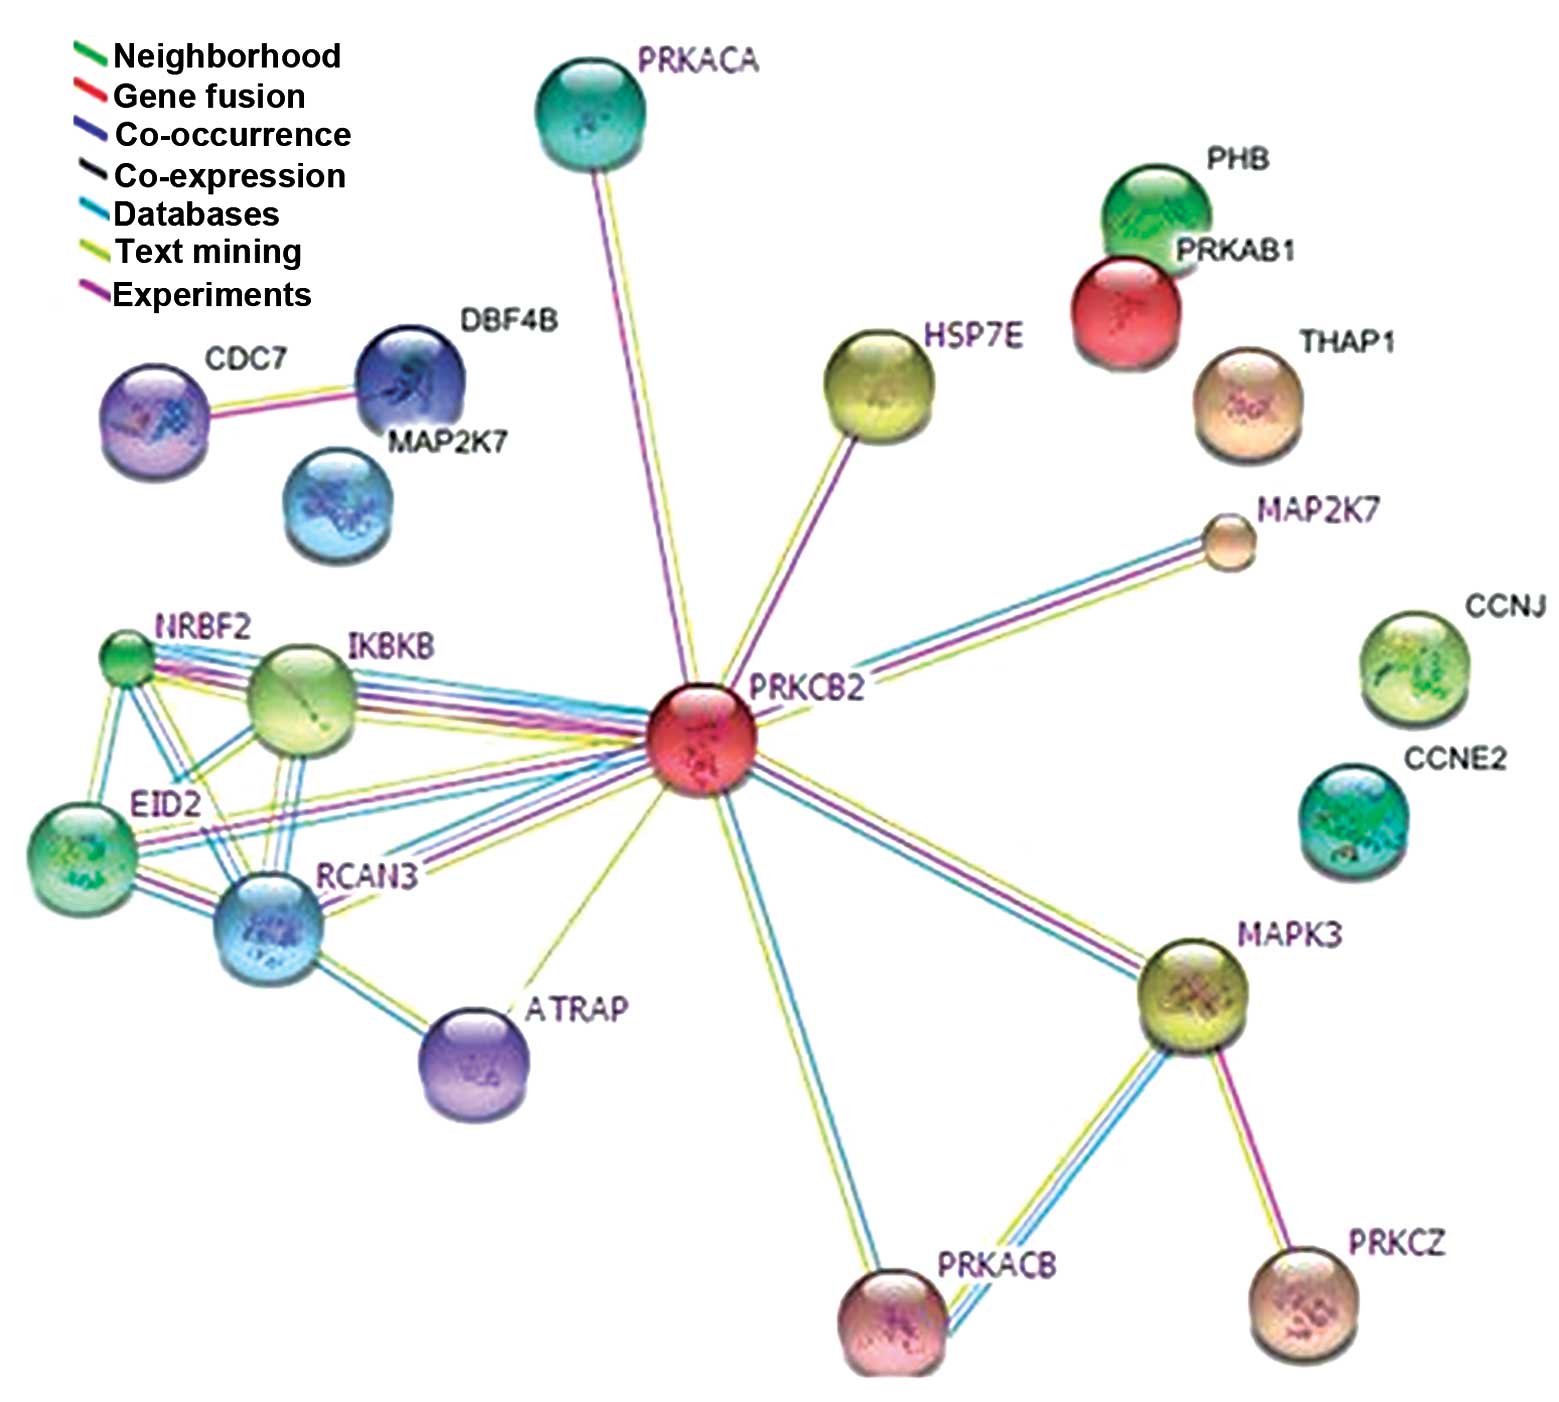
A human PPI network of potential connections was
determined for the PKC-β2-associated proteins identified
in the proteomics investigation, using BioGRID 3.1. Among the 50
proteins identified by MALDI-TOF-MS, 14 exhibited successful
connections (Fig. 8). These were
involved in inflammation, proliferation, cell cycle, apoptosis and
cellular metabolism. These results were based on predictions and
relevant reports, and provide a novel technique to identify
intracellular crosstalk and potential cellular signaling pathways
associated with PKC-β2.
Discussion
The present study established an in vitro
cell model of constitutively active PKC-β2 in HUVECs
exposed to high ambient glucose levels, which imitated the critical
molecular events of diabetes-associated vascular complications. The
results of the present study confirmed the effectiveness of
recombinant adenovirus transfection of HUVECs using immunoblotting.
A subcellular proteomics-based approach was undertaken to profile
the alterations in the molecular events in the nuclear and
cytoplasmic fractions of endothelial cells prior to, and following,
PKC-β2 activation. The present study focused, not only
on the differential protein expression in HUVECs in response to
high glucose conditions, but also on the effectors induced by
sustained PKC-β2 activity. A total of 50 proteins were
identified by MALDI-TOF-MS and exhibited variation in concentration
in response to constitutive PKC-β2 activation. The
proteins were associated with biosynthesis, metabolism, cell cycle,
apoptosis, proliferation transcription and translation, and were
associated with the protein kinase family. Among the identified
proteins associated with PKC-β2 were important effector
proteins: PPAR-δ, NKIRAS1, mitogen-activated protein kinase 3
(MAPK3), cell division cycle 7-related protein kinase (CDC7) and
protein DBF4 homolog B (DBF4B; listed in Table II), which are involved in glucose
metabolism crosstalk, lipid metabolism crosstalk, inflammatory
response, cell proliferation and cell cycle alterations,
respectively. The identification of PPAR-δ and NKIRAS1 were further
demonstrated using western blot analyses. In addition, to determine
the role of high glucose levels and constitutively active
PKC-β2 in the potential PKC-β2-NF-κB
inhibitor (IκB)-NF-κB signaling pathway in HUVECs, protein function
was analyzed. The characteristics and results for each protein are
discussed below.
Inflammatory response: NKIRAS1
NF-κB is a well-known transcription factor that
directly regulates the expression of immediate-early genes and
genes involved in the inflammatory response following physiological
or pathological stimuli, including high glucose stress (28,29).
As previously reported, cells exposed to high glucose, and vascular
tissues from patients with diabetes exhibit increased NF-κB
activity (30). The activation of
NF-κB may function as a causal event in intracellular inflammation
and endothelial cell dysfunction (31). Kouroedov et al (32) demonstrated that glucose-induced
phosphorylation of PKC-β2 activated NF-κB via an
IκBα-dependent mechanism. However, IκBα/IκBβ is less resistant to
degradation under high glucose stress (33), and the role of PKC-β2 in
glucose-induced NF-κB activation in arterial endothelial cells
remains to be fully elucidated. NKIRAS1 is an atypical Ras-like
protein, which acts as a potent regulator of NF-κB activity by
inhibiting the phosphorylation of IκB and mediating the cytoplasmic
retention of the p65/RELA NF-κB subunit (27). NKIRAS1 interacts with IκBα and IκBβ
in vitro, however, it has rarely been reported as an
important intermediate in tissue biology, and the only available
study focused on its role in human renal cell carcinomas (34). The results of the present study
demonstrated a decrease in the cytosolic localization of NKIRAS1 in
response to high glucose and sustained PKC-β2.
Furthermore, treatment of the cells with the selective
PKC-β2 inhibitor CGP53353 inhibited the
PKC-β2-induced decreased expression of NKIRAS1. Based on
these results, it was hypothesized that high glucose-induced
activation of PKC-β2 led to a decrease of NKIRAS1 in the
cytoplasm, and that this alteration induced IκBα/IκBβ degradation
resistance. As a result, NF-κB and the IκB-bound complex were
inclined to disaggregat and, simultaneously, an NF-κB subunit,
including p65/RELA entered the nucleus and activated gene
expression. To verify this hypothesis, further investigations was
performed. Glucose-induced upregulation and nuclear translocation
of NF-κB (p65/RELA) were predominantly prevented by the selective
inhibition of PKC-β2. The decrease in the cytosolic
localization of NKIRAS1 explained the increased rate of IκBα/IκBβ
degradation and the nuclear translocation of NF-κB (p65/RELA) in
HUVECs exposed to high ambient glucose. Thus, the present study
identified a potential PKC-β2-IκB-NF-κB signaling
pathway in HUVECs under conditions of high glucose. The data
further suggested that NKIRAS1 may be an important modulator of
NF-κB activity, by regulating the interaction between IκB and
NF-κB.
Glucose and lipid metabolism crosstalk:
PPAR-δ
In the present study, another protein that exhibited
changes in expression was PPAR-δ. PPAR-δ is a member of the PPAR
family, and PPARs are ligand-activated transcription factors that
regulate the expression of genes involved in fatty acid uptake and
oxidation, lipid metabolism and inflammation (35,36).
The three PPAR subtypes, PPAR-α, PPAR-γ and PPAR-δ (or PPAR-β),
have distinct tissue distributions and functions. PPAR-α and PPAR-γ
are predominantly expressed in liver and adipose tissue,
respectively, whereas PPAR-δ is ubiquitously expressed (37). Several studies have suggested
PPAR-δ has important metabolic regulatory functions (38). PPAR-δ increases fatty acid
oxidation in adipocytes (39),
augments lipogenesis and glycolysis in the liver (40) and increases oxidative metabolism in
skeletal muscles (41,42). However, its physiological and
pathophysiological roles in endothelial cells, which are critical
in vascular biology, remain to be fully elucidated. In the present
study, high glucose-induced upregulation in the expression of
PPAR-δ was observed in the HUVECs. These results are concordant
with those of a previous study on vascular endothelial cells (VECs)
by Riahi et al (43), who
reported that PPAR-δ is the endogenous receptor activated under
hyperglycemic conditions in VECs and demonstrated that high glucose
levels inhibit glucose transport and total glucose transporter-1
expression levels in a PPAR-δ-dependent manner. Kim et al
(44) also determined that 25
mmol/l glucose increases the gene expression of PPAR-δ in mouse
embryonic stem cells. The results of the present study demonstrated
a decrease in the nuclear localization of PPAR-δ in response to
constitutively active PKC-β2, as determined by western blot
analyses. These results were concordant with those obtained from
the 2-DE analysis, demonstrating that the quantitative change of
PPAR-δ is, in part, associated with excessive activation of the
PKC-β2 isoform. This hypothesis was further supported by the use of
the PKC-β2 inhibitor, CGP53353. To the best of our knowledge,
PPAR-δ has yet to be reported as a functional downstream effector
of PKC-β2 signaling. Although the underlying mechanism remains to
be elucidared, PKC-β2 may be involved in glucose and lipid
metabolism crosstalk by regulating PPAR-δ. Further investigation is
required in order to reveal the mechanisms underlying this
association.
Molecular events of cell proliferation
and the cell cycle: MAPK3, DBF4B and CDC7
Previous studies have demonstrated that high glucose
levels affect vascular endothelial cell proliferation, however, the
role of PKC isoforms in cell proliferation remains to be fully
elucidated (45–47). Flow cytometric analysis was used to
determine which phase of the cell cycle was affected by high
glucose exposure, as well as the effect PKC-β2 had on
cell proliferation and the cell cycle. The results indicated that
overexpression of PKC-β2 promoted cell proliferation by
reducing early apoptosis and increased the percentage of cells in
the S and G2/M phases under high glucose conditions in
HUVECs. Neri et al (48)
reported that the oral protein-kinase C beta inhibitor enzastaurin
(LY317615) inhibits proliferation by suppressing signaling via the
Akt pathway in multiple myeloma cell lines. However, the potential
signaling mechanism underlying the PKC-β2-induced
enhancement of endothelial cell proliferation remains to be
elucidated. In the present study 2-DE analysis revealed that the
overexpression of PKC-β2 led to an increase in the
expression of MAPK3, the activation of which is important in the
development of diabetic vascular complications. The expression
levels of MAPK3, also termed ERK1 and p44-MAPK, were also
quantitatively changed, as observed using MALDI-TOF-MS. MAPK3 is
activated by upstream kinases, resulting in its translocation to
the nucleus where it phosphorylates nuclear targets (49). Yang et al (50) reported that activated MAPK3/1
activates PKC via phospholipase A2 group IVA, and activated PKC
further stimulates MAPK3/1 via the reactivation of raf-1
proto-oncogene serine/threonine kinase and MAP2K1. MAPK3 acts in a
signaling cascade that regulates various cellular processes,
including proliferation, differentiation and cell cycle progression
(51). In the PPI network in the
present study, MAPK3 was associated with PKC-β2
signaling, suggesting that it may be involved in
PKC-β2-induced cell proliferation under high glucose
conditions in HUVECs. This signal amplification and the potential
for crosstalk appear to be important features of the
PKC-β2 signaling pathwa, however, the activation of
MAPK3 in the PKC-β2 signaling pathway was not an
isolated molecular event. DBF4B and CDC7 are cell cycle regulatory
proteins, and their expression levels were quantitatively altered
in response to PKC-β2 activation using MS. As determined
from the PPI network, the DBF4B and CDC7 proteins interacted.
Previous studies have demonstrated that the CDC7-DBF4 complex is
involved in regulating the initiation of DNA replication during
cell cycle progression (52,53).
Specifically, the complex is required for the progression of the
cells between the S and M phase. Flow cytometric analysis
demonstrated that activation of PKC-β2 led to a rapid
increase in the number of cells in the S/M phase of the cell cycle,
and markedly increased the rate of mitosis. The upregulation in the
expression of CDC7-DBF4 may partly explain the cell cycle
alterations induced by PKC-β2 signaling. The results of
the proteomics investigation suggested that MAPK3, DBF4B and CDC7
may act downstream of PKC-β2. However, further
investigations are required in order to elucidate the mechanisms
underlying the dominant roles of these proteins in the maintaining
the balance between cell death and survival.
PPI networks
Proteins in a 'subproteome' are expected to exhibit
apparent function-dependent associations. To examine a PPI network
of the potential connections for PKC-β2-associated
proteins in the present study, the identified proteins were entered
into BioGRID 3.1, a protein network and pathway analysis algorithm.
A total of 36 molecules from the dataset exhibited no association
with any other molecules in the group, which may have occurred due
to limitations of the database and article searches, or due to the
novelty of the proteins in this network. Therefore, further
investigations on the biological processes and underlying molecular
functions of these molecules are required to evaluate whether they
require inclusion in the network.
To the best of our knowledge, the present study is
the first to use subcellular and functional proteomics to profile
subcellular signaling in endothelial cells prior to, and following,
PKC-β2 activation. The proteomics analysis provided a
detailed profile of these changes at the molecular level, and a
number of the altered proteins identified were consistent with
those of previous studies (54–56).
The results of the present study demonstrated that
PKC-β2 may be an important molecular regulator of high
glucose-induced functional and metabolic changes in HUVECs. The
data further suggested that PKC-β2 may be involved in
glucose and lipid metabolism crosstalk, inflammatory response, cell
proliferation and alterations in the cell cycle. PKC-β2
may be involved in high glucose-induced glucose and lipid crosstalk
by regulating PPAR-δ. In addition, NKIRAS1 may be important in a
potential PKC-β2-IκB-NF-κB signaling pathway in HUVECs
under high glucose conditions. The present study enhanced the
current understanding of the molecular mechanisms underlying
PKC-β2-stimulated cross-talk in the signaling pathways
involved in pathophysiological conditions associated with diabetic
vascular complications. The results of the present study indicated
that PKC-β2 is a promising potential target for the treatment of
vascular complications of diabetes. Clinical treatments targeting
key signaling molecules of the PKC-β2 pathway may achieve
remissions of diabetes-associated vascular diseases or prevent
common medical complications in diabetic patients.
Acknowledgments
The present study was supported by the National
Natural Science Foundation of China (grant nos. 30570877 and
81370940) and the National Key Clinical Department Construction
Project. The authors of the present study acknowledge the support
of the Ophthalmology Laboratory of Chongqing Medical University,
and are grateful to Dr Mingjun Wu for the MALDI-TOF-MS analysis and
to Dr Yongbo Peng for technological support with the PPI
network.
Abbreviations:
|
PKC
|
protein kinase C
|
|
DAG
|
diacylglycerol
|
|
HUVECs
|
human umbilical vein endothelial
cells
|
|
MALDI-TOF-MS
|
matrix-assisted laser
desorption/ionization time-of-flight tandem mass spectrometry
|
|
NF-κB
|
nuclear factor-κB
|
|
MAPK
|
mitogen-activated protein kinase
|
|
CDC7
|
cell division cycle 7
|
|
HSP7E
|
heat shock 70 kDa protein 14
|
|
PPAR-δ
|
peroxisome proliferator-activated
receptor δ
|
|
NKIRAS1
|
NF-κB inhibitor-interacting Ras-like
protein 1
|
References
|
1
|
Yang W, Lu J, Weng J, Jia W, Ji L, Xiao J,
Shan Z, Liu J, Tian H, Ji Q, et al: Prevalence of diabetes among
men and women in China. N Engl J Med. 362:1090–1101. 2010.
View Article : Google Scholar : PubMed/NCBI
|
|
2
|
Bakker W, Eringa EC, Sipkema P and van
Hinsbergh VW: Endothelial dysfunction and diabetes: Roles of
hyperglycemia, impaired insulin signaling and obesity. Cell Tissue
Res. 335:165–189. 2009. View Article : Google Scholar
|
|
3
|
Orasanu G and Plutzky J: The pathologic
continuum of diabetic vascular disease. J Am Coll Cardiol. 53(5
Suppl): S35–S42. 2009. View Article : Google Scholar : PubMed/NCBI
|
|
4
|
Yuan SY, Ustinova EE, Wu MH, Tinsley JH,
Xu W, Korompai FL and Taulman AC: Protein kinase C activation
contributes to microvascular barrier dysfunction in the heart at
early stages of diabetes. Circ Res. 87:412–417. 2000. View Article : Google Scholar : PubMed/NCBI
|
|
5
|
King GL: The role of hyperglycaemia and
hyperinsulinaemia in causing vascular dysfunction in diabetes. Ann
Med. 28:427–432. 1996. View Article : Google Scholar : PubMed/NCBI
|
|
6
|
Hink U, Li H, Mollnau H, Oelze M, Matheis
E, Hartmann M, Skatchkov M, Thaiss F, Stahl RA and Warnholtz A:
Mechanisms underlying endothelial dysfunction in diabetes mellitus.
Circ Res. 88:E14–E22. 2001. View Article : Google Scholar : PubMed/NCBI
|
|
7
|
Kizub IV, Klymenko KI and Soloviev AI:
Protein kinase C in enhanced vascular tone in diabetes mellitus.
Int J Cardiol. 174:230–242. 2014. View Article : Google Scholar : PubMed/NCBI
|
|
8
|
Geraldes P and King GL: Activation of
protein kinase C isoforms and its impact on diabetic complications.
Circ Res. 106:1319–1331. 2010. View Article : Google Scholar : PubMed/NCBI
|
|
9
|
Meier M, Park JK, Overheu D, Kirsch T,
Lindschau C, Gueler F, Leitges M, Menne J and Haller H: Deletion of
protein kinase C-beta isoform in vivo reduces renal hypertrophy but
not albuminuria in the streptozotocin-induced diabetic mouse model.
Diabetes. 56:346–354. 2007. View Article : Google Scholar : PubMed/NCBI
|
|
10
|
Gaudreault N, Perrin RM, Guo M, Clanton
CP, Wu MH and Yuan SY: Counter regulatory effects of PKCbetaII and
PKCdelta on coronary endothelial permeability. Arterioscler Thromb
Vasc Biol. 28:1527–1533. 2008. View Article : Google Scholar : PubMed/NCBI
|
|
11
|
Dangwal S, Rauch BH, Gensch T, Dai L,
Bretschneider E, Vogelaar CF, Schrör K and Rosenkranz AC: High
glucose enhances thrombin responses via protease-activated
receptor-4 in human vascular smooth muscle cells. Arterioscler
Thromb Vasc Biol. 31:624–633. 2011. View Article : Google Scholar
|
|
12
|
Naruse K, Rask-Madsen C, Takahara N, Ha
SW, Suzuma K, Way KJ, Jacobs JR, Clermont AC, Ueki K, Ohshiro Y, et
al: Activation of vascular protein kinase C-beta inhibits
Akt-dependent endothelial nitric oxide synthase function in
obesity-associated insulin resistance. Diabetes. 55:691–698. 2006.
View Article : Google Scholar : PubMed/NCBI
|
|
13
|
Lin X, Zhou B and Sun F: Protein Kinase C
β2 mediated high glucose-induced human umbilical vein endothelial
cells injury via regulation of peroxisome proliferator-activated
receptor α. China J Endocrinol Metab. 26:10–14. 2010.
|
|
14
|
Min W, Bin ZW, Quan ZB, Hui ZJ and Sheng
FG: The signal transduction pathway of PKC/NF-kappa B/c-fos may be
involved in the influence of high glucose on the cardiomyocytes of
neonatal rats. Cardiovasc Diabetol. 8:82009. View Article : Google Scholar : PubMed/NCBI
|
|
15
|
Campbell M and Trimble ER: Modification of
PI3K- and MAPK-dependent chemotaxis in aortic vascular smooth
muscle cells by protein kinase CbetaII. Circ Res. 96:197–206. 2005.
View Article : Google Scholar
|
|
16
|
Duan L, Lin XB and Zhou B: Construction
and identification of endothelial cell model with overexpressed
human protein kinase Cβ2 induced by high glucose. Acta Acad Med
Militaris Tertiae. 31:1993–1996. 2009.In Chinese.
|
|
17
|
Sun F, Zhou B, Lin X and Duan L: Proteomic
analysis identifies nuclear protein effectors in PKC-δ signaling
under high glucose-induced apoptosis in human umbilical vein
endothelial cells. Mol Med Rep. 4:865–872. 2011.PubMed/NCBI
|
|
18
|
Turck N, Richert S, Gendry P, Stutzmann J,
Kedinger M, Leize E, Simon-Assmann P, Van Dorsselaer A and Launay
JF: Proteomic analysis of nuclear proteins from proliferative and
differentiated human colonic intestinal epithelial cells.
Proteomics. 4:93–105. 2004. View Article : Google Scholar : PubMed/NCBI
|
|
19
|
Cargnello M and Roux PP: Activation and
function of the MAPKs and their substrates, the MAPK-activated
protein kinases. Microbiol Mol Biol Rev. 75:50–83. 2011. View Article : Google Scholar : PubMed/NCBI
|
|
20
|
Furukohri A, Sato N, Masai H, Arai K,
Sugino A and Waga S: Identification and characterization of a
Xenopus homolog of Dbf4, a regulatory subunit of the Cdc7 protein
kinase required for the initiation of DNA replication. J Biochem.
134:447–457. 2003. View Article : Google Scholar : PubMed/NCBI
|
|
21
|
Jiang W, McDonald D, Hope TJ and Hunter T:
Mammalian Cdc7-Dbf4 protein kinase complex is essential for
initiation of DNA replication. EMBO J. 18:5703–5713. 1999.
View Article : Google Scholar : PubMed/NCBI
|
|
22
|
Kim JM, Sato N, Yamada M, Arai K and Masai
H: Growth regulation of the expression of mouse cDNA and gene
encoding a serine/threonine kinase related to Saccharomyces
cerevisiae CDC7 essential for G1/S transition. Structure,
chromosomal localization, and expression of mouse gene for S.
cerevisiae Cdc7-related kinase. J Biol Chem. 273:23248–23257. 1998.
View Article : Google Scholar : PubMed/NCBI
|
|
23
|
Jares P, Luciani MG and Blow JJ: A xenopus
Dbf4 homolog is required for Cdc7 chromatin binding and DNA
replication. BMC Mol Biol. 5:52004. View Article : Google Scholar : PubMed/NCBI
|
|
24
|
Monsalve FA, Pyarasani RD, Delgado-Lopez F
and Moore-Carrasco R: Peroxisome proliferator-activated receptor
targets for the treatment of metabolic diseases. Mediators Inflamm.
2013:5496272013. View Article : Google Scholar : PubMed/NCBI
|
|
25
|
Saez ME, Grilo A, Moron FJ, Manzano L,
Martínez-Larrad MT, Gonzalez-Perez A, Ser rano-Hernando J, Ruiz A,
Ramirez-Lorca R and Serrano-Rios M: Interaction between calpain 5,
peroxisome proliferator-activated receptor-gamma and peroxisome
proliferator-activated receptor-delta genes: A polygenic approach
to obesity. Cardiovasc Diabetol. 7:232008. View Article : Google Scholar : PubMed/NCBI
|
|
26
|
Mosser DD, Caron AW, Bourget L,
Denis-Larose C and Massie B: Role of the human heat shock protein
hsp70 in protection against stress-induced apoptosis. Mol Cell
Biol. 17:5317–5327. 1997. View Article : Google Scholar : PubMed/NCBI
|
|
27
|
Lin H, Wang Y, Zhang X, Liu B, Zhang W and
Cheng J: Prognostic significance of kappaB-Ras1 expression in
gliomas. Med Oncol. 29:1272–1279. 2012. View Article : Google Scholar
|
|
28
|
Jeong IK, Oh da H, Park SJ, Kang JH, Kim
S, Lee MS, Kim MJ, Hwang YC, Ahn KJ, Chung HY, et al: Inhibition of
NF-κB prevents high glucose-induced proliferation and plasminogen
activator inhibitor-1 expression in vascular smooth muscle cells.
Exp Mol Med. 43:684–692. 2011. View Article : Google Scholar : PubMed/NCBI
|
|
29
|
Green CJ, Pedersen M, Pedersen BK and
Scheele C: Elevated NF-κB activation is conserved in human myocytes
cultured from obese type 2 diabetic patients and attenuated by
AMP-activated protein kinase. Diabetes. 60:2810–2819. 2011.
View Article : Google Scholar : PubMed/NCBI
|
|
30
|
Chen S, Khan ZA, Cukiernik M and
Chakrabarti S: Differential activation of NF-kappaB and AP-1 in
increased fibronectin synthesis in target organs of diabetic
complications. Am J Physiol Endocrinol Metab. 284:E1089–E1097.
2003. View Article : Google Scholar : PubMed/NCBI
|
|
31
|
Csiszar A, Wang M, Lakatta EG and Ungvari
Z: Inflammation and endothelial dysfunction during aging: Role of
NF-kappaB. J Appl Physiol (1985). 105:1333–1341. 2008. View Article : Google Scholar
|
|
32
|
Kouroedov A, Eto M, Joch H, Volpe M,
Lüscher TF and Cosentino F: Selective inhibition of protein kinase
Cbeta2 prevents acute effects of high glucose on vascular cell
adhesion molecule-1 expression in human endothelial cells.
Circulation. 110:91–96. 2004. View Article : Google Scholar : PubMed/NCBI
|
|
33
|
Tang JR, Michaelis KA, Nozik-Grayck E,
Seedorf GJ, Hartman-Filson M, Abman SH and Wright CJ: The NF-κB
inhibitory proteins IκBα and IκBβ mediate disparate responses to
inflammation in fetal pulmonary endothelial cells. J Immunol.
190:2913–2923. 2013. View Article : Google Scholar : PubMed/NCBI
|
|
34
|
Gerashchenko GV, Bogatyrova OO, Rudenko
EE, Kondratov AG, Gordiyuk VV, Zgonnyk YM, Vozianov OF, Pavlova TV,
Zabarovsky ER, Rynditch AV and Kashuba VI: Genetic and epigenetic
changes of NKIRAS1 gene in human renal cell carcinomas. Exp Oncol.
32:71–75. 2010.PubMed/NCBI
|
|
35
|
Duan SZ, Usher MG and Mortensen RM: PPARs:
The vasculature, inflammation and hypertension. Curr Opin Nephrol
Hypertens. 18:128–133. 2009. View Article : Google Scholar : PubMed/NCBI
|
|
36
|
Wahli W and Michalik L: PPARs at the
crossroads of lipid signaling and inflammation. Trends Endocrinol
Metab. 23:351–363. 2012. View Article : Google Scholar : PubMed/NCBI
|
|
37
|
Escher P, Braissant O, Basu-Modak S,
Michalik L, Wahli W and Desvergne B: Rat PPARs: Quantitative
analysis in adult rat tissues and regulation in fasting and
refeeding. Endocrinology. 142:4195–4202. 2001. View Article : Google Scholar : PubMed/NCBI
|
|
38
|
Reilly SM and Lee CH: PPAR delta as a
therapeutic target in metabolic disease. FEBS Lett. 582:26–31.
2008. View Article : Google Scholar
|
|
39
|
Wang YX, Lee CH, Tiep S, Yu RT, Ham J,
Kang H and Evans RM: Peroxisome-proliferator-activated receptor
delta activates fat metabolism to prevent obesity. Cell.
113:159–170. 2003. View Article : Google Scholar : PubMed/NCBI
|
|
40
|
Lee CH, Olson P, Hevener A, Mehl I, Chong
LW, Olefsky JM, Gonzalez FJ, Ham J, Kang H, Peters JM and Evans RM:
PPARdelta regulates glucose metabolism and insulin sensitivity.
Proc Natl Acad Sci USA. 103:3444–3449. 2006. View Article : Google Scholar : PubMed/NCBI
|
|
41
|
Luquet S, Lopez-Soriano J, Holst D,
Fredenrich A, Melki J, Rassoulzadegan M and Grimaldi PA: Peroxisome
proliferator-activated receptor delta controls muscle development
and oxidative capability. FASEB J. 17:2299–2301. 2003.PubMed/NCBI
|
|
42
|
Wang YX, Zhang CL, Yu RT, Cho HK, Nelson
MC, Bayuga-Ocampo CR, Ham J, Kang H and Evans RM: Regulation of
muscle fiber type and running endurance by PPARdelta. PLoS Biol.
2:e2942004. View Article : Google Scholar : PubMed/NCBI
|
|
43
|
Riahi Y, Sin-Malia Y, Cohen G, Alpert E,
Gruzman A, Eckel J, Staels B, Guichardant M and Sasson S: The
natural protective mechanism against hyperglycemia in vascular
endothelial cells: Roles of the lipid peroxidation product
4-hydroxydodeca-dienal and peroxisome proliferator-activated
receptor delta. Diabetes. 59:808–818. 2010. View Article : Google Scholar : PubMed/NCBI
|
|
44
|
Kim YH and Han HJ: High-glucose-induced
prostaglandin E (2) and peroxisome proliferator-activated receptor
delta promote mouse embryonic stem cell proliferation. Stem Cells.
26:745–755. 2008. View Article : Google Scholar
|
|
45
|
Keats E and Khan ZA: Unique responses of
stem cell-derived vascular endothelial and mesenchymal cells to
high levels of glucose. PLoS One. 7:e387522012. View Article : Google Scholar : PubMed/NCBI
|
|
46
|
Yuan L, Hu J, Luo Y, Liu Q, Li T, Parish
CR, Freeman C, Zhu X, Ma W, Hu X, et al: Upregulation of heparanase
in high-glucose-treated endothelial cells promotes endothelial cell
migration and proliferation and correlates with Akt and
extracellular-signal-regulated kinase phosphorylation. Mol Vis.
18:1684–1695. 2012.PubMed/NCBI
|
|
47
|
Su J, Zhou H, Tao Y, Guo J, Guo Z, Zhang
S, Zhang Y, Huang Y, Tang Y, Dong Q and Hu R: G-CSF protects human
brain vascular endothelial cells injury induced by high glucose,
free fatty acids and hypoxia through MAPK and Akt signaling. PLoS
One. 10:e01207072015. View Article : Google Scholar : PubMed/NCBI
|
|
48
|
Neri A, Marmiroli S, Tassone P, Lombardi
L, Nobili L, Verdelli D, Civallero M, Cosenza M, Bertacchini J,
Federico M, et al: The oral protein-kinase C beta inhibitor
enzastaurin (LY317615) suppresses signalling through the AKT
pathway, inhibits proliferation and induces apoptosis in multiple
myeloma cell lines. Leuk Lymphoma. 49:1374–1383. 2008. View Article : Google Scholar : PubMed/NCBI
|
|
49
|
Caunt CJ and McArdle CA: ERK
phosphorylation and nuclear accumulation: Insights from single-cell
imaging. Biochem Soc Trans. 40:224–229. 2012. View Article : Google Scholar : PubMed/NCBI
|
|
50
|
Yang P and Roy SK: A novel mechanism of
FSH regulation of DNA synthesis in the granulosa cells of hamster
preantral follicles: Involvement of a protein kinase C-mediated MAP
kinase 3/1 self-activation loop. Biol Reprod. 75:149–157. 2006.
View Article : Google Scholar : PubMed/NCBI
|
|
51
|
Winnicki K, Zabka A, Bernasinska J,
Matczak K and Maszewski J: Immunolocalization of dually
phosphorylated MAPKs in dividing root meristem cells of Vicia faba,
Pisum sativum, Lupinus luteus and Lycopersicon esculentum. Plant
Cell Rep. 34:905–917. 2015. View Article : Google Scholar : PubMed/NCBI
|
|
52
|
Hiraga S, Alvino GM, Chang F, Lian HY,
Sridhar A, Kubota T, Brewer BJ, Weinreich M, Raghuraman MK and
Donaldson AD: Rif1 controls DNA replication by directing protein
phosphatase 1 to reverse Cdc7-mediated phosphorylation of the MCM
complex. Genes Dev. 28:372–383. 2014. View Article : Google Scholar : PubMed/NCBI
|
|
53
|
Yamada M, Watanabe K, Mistrik M, Vesela E,
Protivankova I, Mailand N, Lee M, Masai H, Lukas J and Bartek J:
ATR-Chk1-APC/CCdh1-dependent stabilization of Cdc7-ASK (Dbf4)
kinase is required for DNA lesion bypass under replication stress.
Genes Dev. 27:2459–2472. 2013. View Article : Google Scholar : PubMed/NCBI
|
|
54
|
Zhao Y, Zhang Y, Song HB, Wu F, Wang XL,
Sun SC, Cui TX and Tang DQ: Proteomic analysis revealed the altered
kidney protein profile of a Cyld knockout mouse model. Genet Mol
Res. 14:5970–5978. 2015. View Article : Google Scholar : PubMed/NCBI
|
|
55
|
Pizzatti L, Sa LA, de Souza JM, Bisch PM
and Abdelhay E: Altered protein profile in chronic myeloid leukemia
chronic phase identified by a comparative proteomic study. Biochim
Biophys Acta. 1764:929–942. 2006. View Article : Google Scholar : PubMed/NCBI
|
|
56
|
Ezkurdia I, del Pozo A, Frankish A,
Rodriguez JM, Harrow J, Ashman K, Valencia A and Tress ML:
Comparative proteomics reveals a significant bias toward
alternative protein isoforms with conserved structure and function.
Mol Biol Evol. 29:2265–2283. 2012. View Article : Google Scholar : PubMed/NCBI
|