Introduction
Atherosclerosis is a major cause of coronary artery
disease, which is a leading cause of mortality in numerous
countries (1). The presence of B
lymphocytes during inflammatory infiltration in humans (2,3) and
mouse models (4,5) has led to the investigation of their
importance in atherosclerosis. However, the association between B
cells and atherogenesis remains controversial. T-independent B
cells (B1 cells) have atheroprotective properties (6,7),
whereas T-dependent B cells (B2 cells) exhibit pro-atherogenic
activity (8,9). The activation of B cells requires two
signals. The first signal is the binding of an antigen to the B
cell antigen receptor (BCR) expressed on the surface of B cells. If
the antigen is thymus-independent, B cells can stimulate the second
signal directly. However, thymus-dependent antigens require an
interaction between T cells and B cells for the second signal to be
initiated (10). B1 and B2 cells
constitute the two predominant B cell types, and are considered to
be part of the innate and adaptive immune systems, respectively
(11). B1 cells are a minor group
of B cells that produce natural antibodies against common microbial
epitopes and self-determinants. By contrast, B2 cells are
considered to be the conventional B lymphocytes, requiring signals
from T helper cells to recognize specific antigens, and to produce
and regulate antibody-mediated humoral immunity (12,13).
In the present study, the expression levels of a
range of B cell-associated genes involved in B cell activation were
examined. Human cDNA microarray analysis was used to detect the
variations in gene expression levels at different stages of B cell
activation and in subsets of peripheral blood mononuclear cells
(PBMCs) isolated from patients with AMI and stable angina (SA), as
well as healthy controls. The in vitro study was designed to
investigate differential gene expression levels in B cells, and
analyze the differences in humoral immunity in patients with AMI
and SA.
Patients and methods
Patient information
The current study consisted of 3 groups of subjects:
20 patients with AMI, 20 patients with SA and 20 healthy
volunteers. The baseline demographic data are presented in Table I. The patients with AMI were
admitted to a Coronary Care Unit of Tongji Hospital (Shanghai,
China), <12 h after the onset of symptoms between January and
June 2013. The AMI group included 18 male and 2 female patients
aged 58±12 years [mean ± standard deviation (SD)]. All patients
with AMI were diagnosed on the basis of previously described
criteria (14). Briefly, selected
subjects exhibited a rise in cardiac biomarker parameters
(preferably cardiac troponin) with at least one value above the
99th percentile reference limit and with at least one of the
following features: i) Symptoms of ischemia; ii) new or presumed
new significant ST-segment-T wave changes or new left bundle branch
block; iii) development of pathological Q waves in the
electrocardiograph; iv) imaging evidence of new loss of viable
myocardium or new regional wall motion abnormality; and v)
identification of an intracoronary thrombus by angiography.
 | Table IBaseline demographic data in AMI, SA
and control groups. |
Table I
Baseline demographic data in AMI, SA
and control groups.
| Patient
characteristic | AMI | SA | Control | P-value
|
|---|
| All groups | AMI vs. SA |
|---|
| Age, years | 57.8±11.9 | 63.6±9.9 | 28.8±3.3 | 0.000 | 0.251 |
| Gender
(male/female), n | 18/2 | 18/2 | 17/3 | 0.853 | 1.000 |
| Body mass index,
kg/m2 | 23.6±2.6 | 22.8±2.7 | 21.3±1.8 | 0.102 | 0.560 |
| Smoking history,
n/day | 13.6±12.2 | 9.8±10.3 | 0±0 | 0.000 | 0.648 |
| Systolic blood
pressure, mmHg | 128.6±15.3 | 123.0±12.1 | 120.8±7.2 | 0.115 | 0.501 |
| Diastolic blood
pressure, mmHg | 67.0±8.0 | 73.0±8.0 | 71.6±3.2 | 0.017 | 0.064 |
| LDL-C, mmol/l | 2.5±1.0 | 2.1±0.8 | 2.9±0.5 | 0.327 | 0.548 |
| Triglycerides,
mmol/l | 1.6±1.1 | 1.5±1.4 | 1.2±0.4 | 0.730 | 0.762 |
| HDL-C, mmol/l | 0.8±0.7 | 0.9±0.2 | 1.3±0.2 | 0.000 | 0.803 |
| Fasting blood
glucose, mmol/l | 5.4±0.9 | 5.0±0.8 | 4.9±0.5 | 0.610 | 0.082 |
In the SA group, 18 male and 2 female patients of
age 64±10 years (mean ± SD) with exclusively effort-associated
angina were analyzed. Each patient exhibited positive exercise
stress test results and at least one coronary stenosis was detected
during angiography (>70% reduction of lumen diameter). There was
no significant difference between AMI and SA patients (Table I) regarding age, gender, smoking
status, body mass index, systolic blood pressure, diastolic blood
pressure, low-density lipoprotein cholesterol, high-density
lipoprotein cholesterol, triglycerides or fasting glucose.
The control group consisted of 17 male and 3 female
healthy volunteers of age 29±3 years (mean ± SD), recruited during
the same time period as patients with AMI and SA. Family histories,
physical examination, electrocardiograph, chest radiography and
routine chemical analysis demonstrated that the controls had no
evidence of coronary heart disease.
SA group candidates were outpatients with risk
factors of cardiovascular disease and verified by
electrocardiogram, cardio angiography or treadmill exercise test.
The control candidates were individuals living in nearby
communities without any risk factors or history of cardiovascular
diseases. The exclusion criteria for the three groups were venous
thrombosis, hematological disorders, acute or chronic inflammatory
diseases, intake of hormones or immunosuppressors and
malignancy.
The study protocol was approved by the ethics
committee of Tongji University (Shanghai, China) and informed
consent forms were obtained.
Microarray gene expression analysis
A Human Gene Expression Microarray kit was purchased
from Agilent Technologies, Inc. (cat no. G4112F; Santa Clara, CA,
USA). The microarray was composed of >41,000 genes or
transcripts, including 19,596 targeted Entrez gene RNAs. The
sequence information used in the microarrays was derived from the
latest databases of RefSeq (www.ncbi.nlm.nih.gov/refseq), GoldenPath (genome.ucsc.edu/index.html), Ensembl (www.ensembl.org) and Unigene (www.ncbi.nlm.nih.gov/unigene). The functions of
>70% of the genes in the microarray had been previously
established. All patients were subjected to the microarray
analysis.
Total RNA isolation
Peripheral blood samples (5 ml) were collected from
patients with AMI and SA in PAXgene tubes (BD Biosciences, San
Jose, CA, USA) immediately after admission. The control group blood
samples were collected from nearby communities during the same
period as AMI/SA blood collection in the hospital. Briefly, the
leukocytes were isolated through density gradient centrifugation
with Ficoll solution (Sigma Aldrich, St. Louis, MO, USA) and the
remaining red blood cells were destroyed with erythrocyte lysis
buffer (Qiagen GmbH, Hilden, Germany). Total RNA was extracted and
purified using a PAXgene Blood RNA kit (cat no. 762174; Qiagen
GmbH), according to the manufacturer's protocol. RNA integrity
number (RIN) was measured to analyze RNA integration using an
Agilent Bioanalyzer 2100 (Agilent Technologies, Inc.). Samples were
considered to be high quality when RIN was ≥7.0 and 28S/18S was
≥1.7.
RNA amplification and labeling
Total RNA was amplified and labeled with Cy3 using a
by Low Input Quick Amp Labeling kit, one-color (cat no. 5190-2305;
Agilent Technologies, Inc.) according to the manufacturer's
protocol. Labeled cRNA was purified using an RNeasy Mini kit (cat
no. 74106, Qiagen GmbH).
Microarray hybridization
Each microarray slide was hybridized with 1.65
µg Cy3-labeled cRNA using a Gene Expression Hybridization
kit (cat no. 5188-5242) in a hybridization oven (cat no. G2545A) at
37°C, both purchased from Agilent Technologies, Inc., according to
the manufacturer's protocol. After 17 h of hybridization, the
slides were washed in staining dishes (cat no. 121; Thermo Fisher
Scientific, Inc., Waltham, MA, USA) with a Gene Expression Wash
Buffer kit (cat no. 5188-5327; Agilent Technologies, Inc.),
according to the manufacturer's protocol.
Microarray scanning and data
acquisition
The microarray slides were scanned with an Agilent
Microarray Scanner (cat no. G2565CA; Agilent Technologies, Inc.)
using the default settings (dye channel, green; scan resolution, 3
µm; 20 bit). Data were extracted using Feature Extraction
software (version 10.7; Agilent Technologies, Inc.). Raw data were
normalized using the Quantile algorithm function of Gene Spring
software (version 11.0; Agilent Technologies, Inc.).
Reverse transcription-quantitative
polymerase chain reaction (RT-qPCR)
The spots on the microarray were randomly selected
and their mRNA expression levels were confirmed by RT-qPCR.
Briefly, reverse transcription was performed using the iScript
reverse transcription supermix kit (Bio-Rad Laboratories, Inc.,
Hercules, CA, USA; cat. no. 1708841). The Ambion TURBO DNA-free
DNase treatment kit (Thermo Fisher Scientific, Inc., Waltham, MA,
USA; cat. no. AM1907) was utilized to remove contaminating DNA from
RNA preparations according to the manufacturer's instructions.
Real-time PCR was performed on a CFX96 Touch Real-time PCR
detection system (Bio-Rad Laboratories, Inc.; cat. no. 1855195)
using the iQ SYBR Green Supermix, (Bio-Rad Laboratories, Inc.; cat.
no. 1708880) according to the manufacturer's instructions. The
cycling conditions for RT-qPCR were as follows: 95°C for 30 sec,
95°C for 5 sec, 60°C for 5 sec and plate read, 40 cycles at 95°C
for 30 sec, melting curve at 65–95°C, increment 0.5°C for 5 sec and
plate read. Of the genes with differential expression levels, three
were randomly selected, and these genes and a reference gene
(GAPDH) were subjected to RT-qPCR. The relative expression levels
were indicated as the expression of the target genes normalized to
the expression of GAPDH (2−ΔΔCq). The melting curve and
the 2−ΔΔCq method (15)
were used to detect differences in gene expression levels among the
three groups. The results from RT-qPCR were consistent with the
microarray analysis (data not shown).
Statistical analysis
Values are expressed as the mean ± SD. A one-way
analysis of variance (ANOVA) was used to examine differences
between the groups. Pair-wise group comparisons following ANOVA
were performed using Tukey's multiple comparison tests. Data were
analyzed using SPSS version 17.0 (SPSS, Inc., Chicago, IL, USA).
P<0.05 was considered to indicate a statistically significant
difference.
Results
mRNA expression levels of genes
associated with BCR
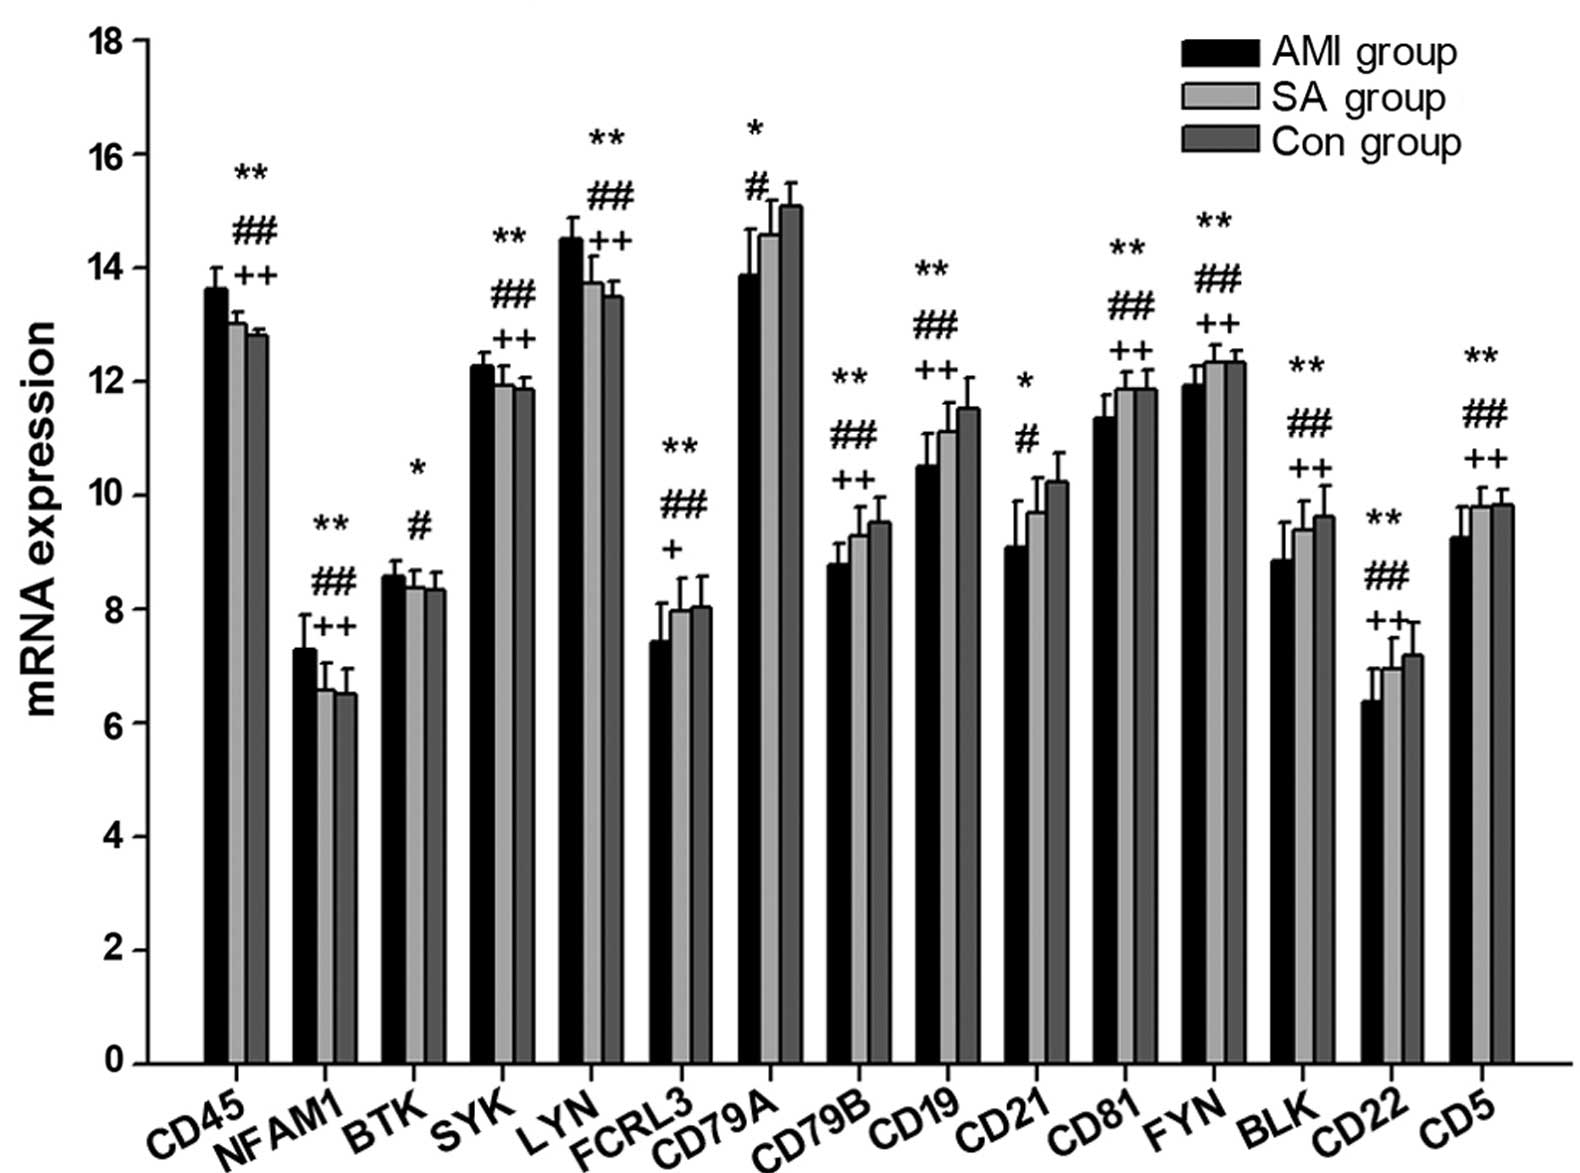
The present study measured the expression levels of
22 genes associated with the BCR in patients with AMI and SA, as
well as controls subjects (Table
II; Fig. 1). In PBMCs from the
three groups, the expression levels of 15 genes were statistically
different (P<0.05): CD45, NFAM1, BTK, SYK, LYN, FCRL3, CD79A,
CD79B, CD19, CD21, CD81, FYN, BLK, CD22 and CD5. Compared with the
control subjects, the gene expression levels of CD45, NFAM1, BTK,
SYK, and LYN were significantly upregulated (P<0.05), whereas
CD79A, CD21 (P<0.05), FCRL3, CD79B, CD19, CD81, FYN, BLK, CD22
and CD5 (P<0.01) mRNA expression were downregulated in the AMI
group. In PBMCs from AMI patients, the expression of CD45, NFAM1,
SYN and LYN were statistically increased (P<0.01), whereas
FCRL3, CD79B, CD19, CD81, FYN, BLK, CD22 and CD5 expression were
significantly reduced (P<0.05) compared with the levels in PBMCs
from the SA group. There were no significant differences in
BCR-associated mRNA expression levels between the SA and control
group.
| Table IIExpression of genes associated with B
cell antigen receptor in B cell activation. |
Table II
Expression of genes associated with B
cell antigen receptor in B cell activation.
| Gene ID | Gene
expressiona
| P-value
|
|---|
| AMI | SA | Control | All groups | AMI vs.
control | AMI vs. SA | SA vs. control |
|---|
| BLK | 8.85±0.66 | 9.39±0.52 | 9.64±0.54 | 0.000 | 0.000 | 0.009 | 0.359 |
| BLNK | 6.31±0.37 | 6.50±0.55 | 6.63±0.43 | 0.086 | 0.072 | 0.364 | 0.655 |
| BTK | 8.58±0.26 | 8.38±0.31 | 8.33±0.32 | 0.027 | 0.029 | 0.102 | 0.846 |
| NFAM1 | 7.29±0.60 | 6.59±0.46 | 6.51±0.44 | 0.000 | 0.000 | 0.000 | 0.873 |
| LYN | 14.52±0.36 | 13.74±0.45 | 13.49±0.28 | 0.000 | 0.000 | 0.000 | 0.099 |
| CD5 | 9.26±0.52 | 9.80±0.34 | 9.82±0.29 | 0.000 | 0.000 | 0.000 | 0.984 |
| CD19 | 10.49±0.59 | 11.12±0.51 | 11.53±0.55 | 0.000 | 0.000 | 0.002 | 0.057 |
| CD21 | 9.09±1.73 | 9.69±1.35 | 10.23±1.00 | 0.042 | 0.032 | 0.372 | 0.436 |
| CD45 | 13.63±0.75 | 13.01±0.48 | 12.81±0.20 | 0.000 | 0.000 | 0.001 | 0.233 |
| CD22 | 6.38±0.55 | 6.93±0.57 | 7.17±0.60 | 0.000 | 0.000 | 0.009 | 0.517 |
| CD79A | 13.87±1.67 | 14.59±1.21 | 15.08±0.77 | 0.014 | 0.020 | 0.339 | 0.347 |
| CD79B | 8.76±0.39 | 9.29±0.52 | 9.51±0.44 | 0.000 | 0.000 | 0.001 | 0.293 |
| CD81 | 11.34±0.41 | 11.84±0.33 | 11.87±0.33 | 0.000 | 0.000 | 0.000 | 0.962 |
| FYN | 11.94±0.33 | 12.33±0.32 | 12.34±0.22 | 0.000 | 0.000 | 0.000 | 0.099 |
| FCRL1 | 7.08±0.42 | 7.33±0.56 | 7.35±0.53 | 0.188 | 0.230 | 0.276 | 0.993 |
| FCRL2 | 7.60±0.38 | 7.80±0.49 | 8.00±0.49 | 0.180 | 0.154 | 0.670 | 0.566 |
| FCRL3 | 7.43±0.68 | 7.96±0.59 | 8.04±0.52 | 0.004 | 0.006 | 0.020 | 0.892 |
| FCRL4 | 2.66±1.15 | 2.70±0.81 | 2.81±1.15 | 0.901 | 0.899 | 0.993 | 0.944 |
| FCRL5 | 5.39±0.82 | 5.57±0.68 | 5.64±0.81 | 0.607 | 0.597 | 0.765 | 0.960 |
| LAX | 5.85±0.55 | 6.12±0.70 | 5.90±0.63 | 0.365 | 0.982 | 0.390 | 0.493 |
| PIR | 3.12±1.01 | 2.47±0.51 | 2.69±0.53 | 0.106 | 0.054 | 0.273 | 0.456 |
| SYK | 12.26±0.25 | 11.94±0.31 | 11.87±0.21 | 0.000 | 0.000 | 0.001 | 0.802 |
mRNA expression levels of genes
associated with B1 cells
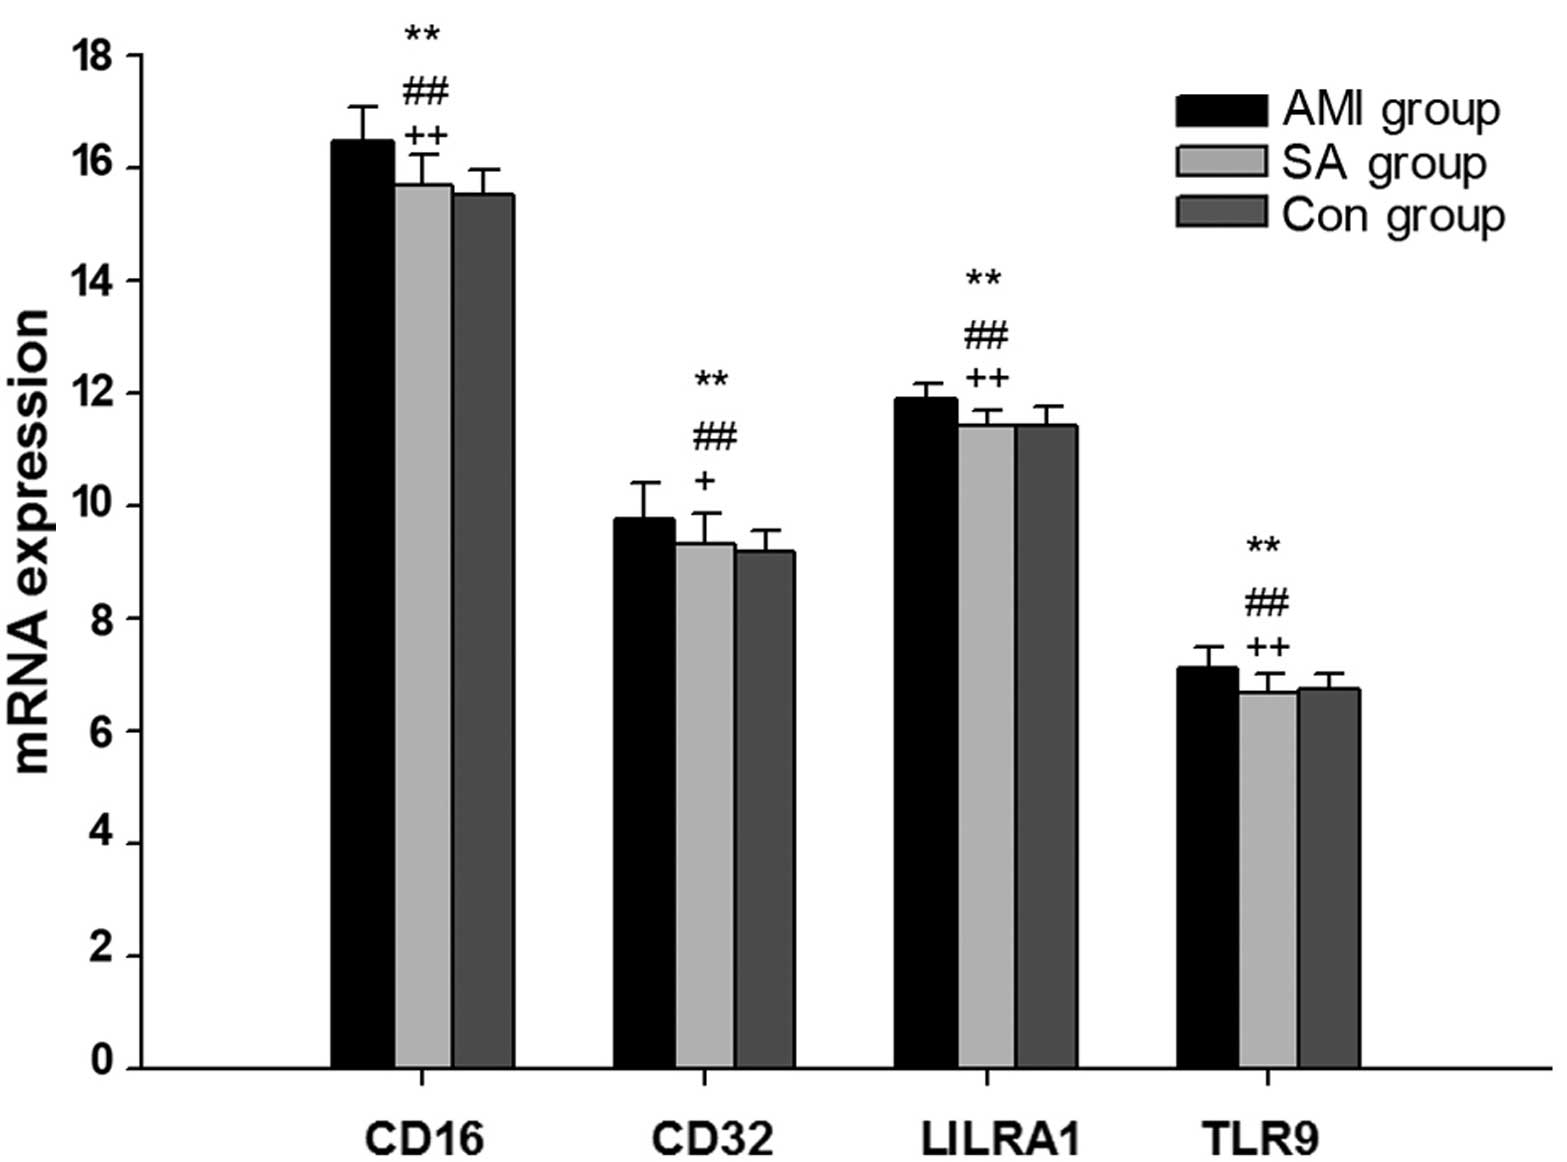
The present study measured the expression levels of
7 genes associated with B1 cell activation in PBMCs from the AMI,
SA and control groups (Table
III; Fig. 2). In separate
comparisons, CD16, CD32, LILRA1 and TLR9 mRNA levels were
significantly increased in patients with AMI compared with SA and
control patients (P<0.05). There was no statistical difference
in the expression levels of genes associated with T1 cell
activation between patients with SA and the control group.
| Table IIIExpression of genes associated with
T-independent B cell activation. |
Table III
Expression of genes associated with
T-independent B cell activation.
| Gene ID | Gene
expressiona
| P-value
|
|---|
| AMI | SA | Control | All groups | AMI vs.
control | AMI vs. SA | SA vs. control |
|---|
| SLAMF8 | 7.90±0.40 | 7.98±0.45 | 7.65±0.45 | 0.058 | 0.163 | 0.832 | 0.052 |
| UBD | 2.63±0.47 | 2.48±0.35 | 2.35±0.25 | 0.061 | 0.072 | 0.578 | 0.518 |
| CD16 | 16.48±0.60 | 15.70±0.56 | 15.50±0.43 | 0.000 | 0.000 | 0.000 | 0.580 |
| CD32 | 9.76±0.65 | 9.34±0.53 | 9.20±0.35 | 0.004 | 0.006 | 0.033 | 0.708 |
| CD180 | 6.82±0.40 | 6.81±0.33 | 6.87±0.41 | 0.884 | 0.928 | 0.994 | 0.884 |
| LILRA1 | 11.90±0.25 | 11.40±0.26 | 11.40±0.34 | 0.000 | 0.000 | 0.000 | 0.999 |
| TLR9 | 7.14±0.36 | 6.71±0.32 | 6.75±0.26 | 0.000 | 0.001 | 0.000 | 0.890 |
mRNA expression levels of genes
associated with B2 cells
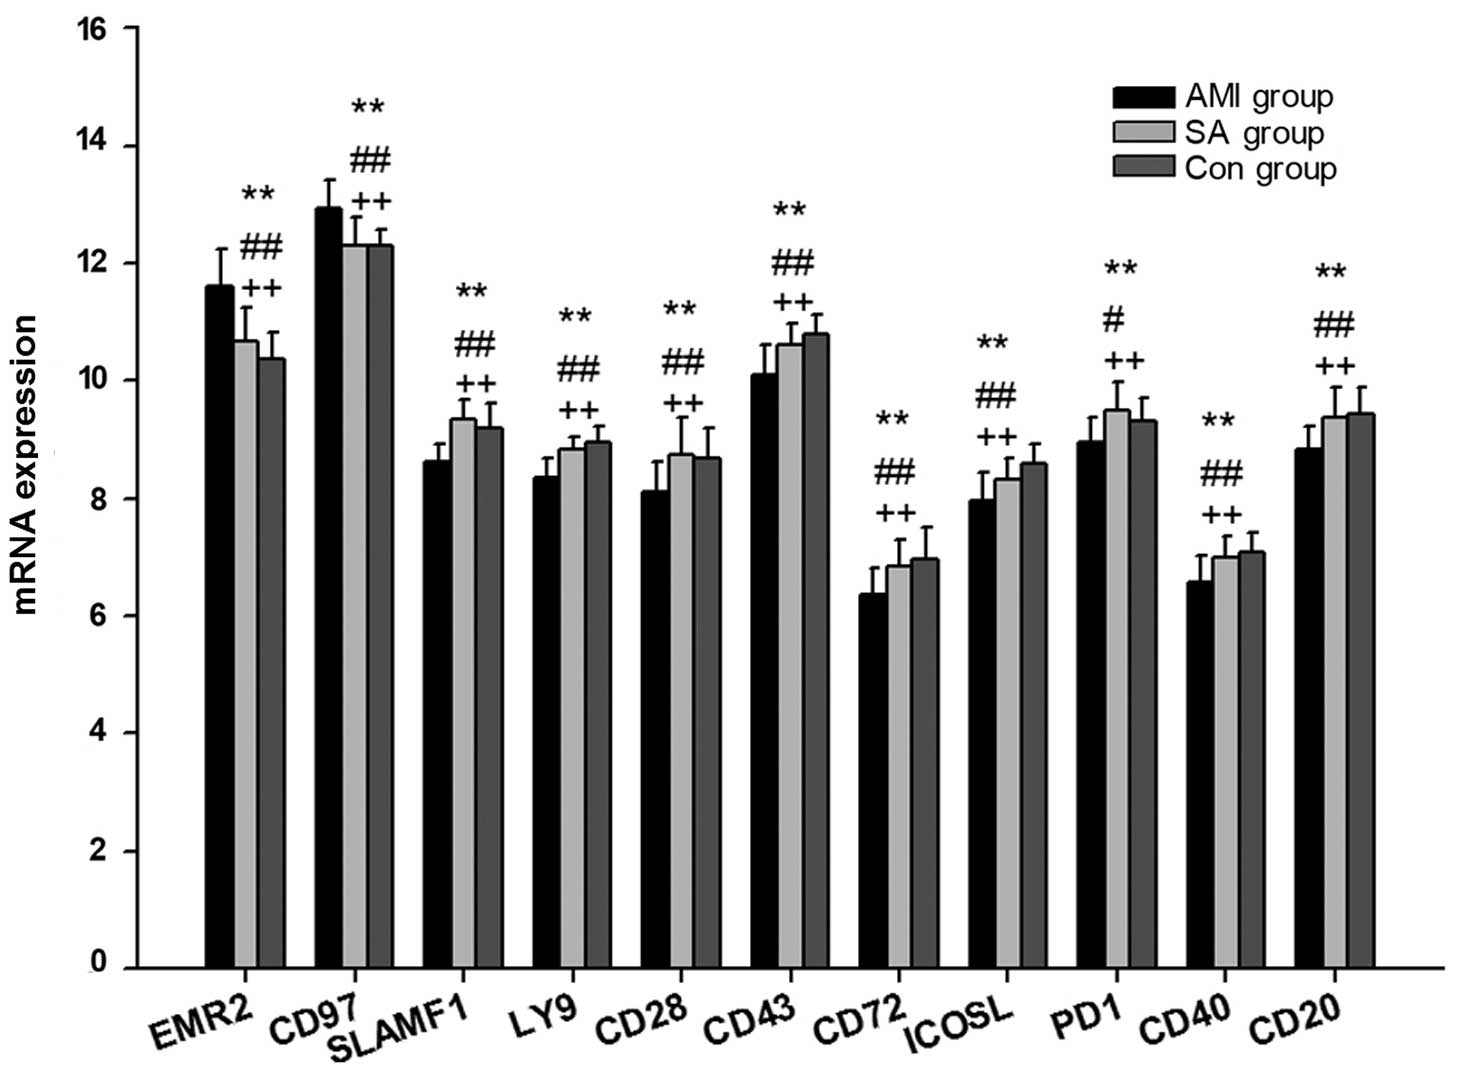
The expression levels of 20 genes associated with B2
cell activation were examined in PBMCs from patients with AMI and
SA, as well as control subjects (Table IV; Fig. 3). In PBMCs from the three groups,
the expression levels of the following 11 genes were statistically
different (P<0.05): EMR2, CD97, SLAMF1, LY9, CD28, CD43, CD72,
ICOSL, PD1, CD40 and CD20. The mRNA expression levels of EMR2 and
CD97 were significantly upregulated (P<0.01), whereas SLAMF1,
LY9, CD28, CD43, CD72, ICOSL, PD1, CD40 and CD20 mRNAs were
significantly downregulated (P<0.05), in the AMI group compared
with the SA and control groups. There was no significant difference
in the mRNA expression levels of genes associated with B2 cell
activation between the SA and control groups.
| Table IVExpression of genes associated with
T-dependent B cell activation. |
Table IV
Expression of genes associated with
T-dependent B cell activation.
| Gene ID | Gene
expressiona
| P-value
|
|---|
| AMI | SA | Control | All groups | AMI vs.
control | AMI vs. SA | SA vs. control |
|---|
| ICOSL | 7.96±0.48 | 8.32±0.35 | 8.59±0.34 | 0.000 | 0.000 | 0.005 | 0.092 |
| BTLA | 6.57±0.63 | 6.64±0.66 | 6.48±0.57 | 0.726 | 0.904 | 0.926 | 0.704 |
| CD20 | 8.83±0.40 | 9.37±0.53 | 9.45±0.40 | 0.000 | 0.000 | 0.001 | 0.852 |
| CD28 | 8.12±0.49 | 8.75±0.64 | 8.69±0.40 | 0.001 | 0.002 | 0.005 | 0.926 |
| CD37 | 12.20±0.27 | 12.30±0.26 | 12.38±0.20 | 0.214 | 0.249 | 0.317 | 0.988 |
| CD40 | 6.56±0.45 | 6.99±0.38 | 7.07±0.30 | 0.000 | 0.000 | 0.003 | 0.789 |
| CD43 | 10.00±0.51 | 10.60±0.34 | 10.70±0.30 | 0.000 | 0.000 | 0.000 | 0.425 |
| CD72 | 6.35±0.45 | 6.84±0.47 | 6.97±0.50 | 0.000 | 0.000 | 0.007 | 0.667 |
| CD80 | 5.20±1.25 | 5.26±1.31 | 5.73±1.00 | 0.308 | 0.340 | 0.986 | 0.425 |
| CD86 | 6.64±0.61 | 6.94±0.43 | 6.87±0.50 | 0.165 | 0.335 | 0.167 | 0.911 |
| CD97 | 12.9±0.49 | 12.3±0.48 | 12.30±0.20 | 0.000 | 0.000 | 0.001 | 1.000 |
| CD226 | 8.68±0.48 | 8.87±0.27 | 8.80±0.40 | 0.300 | 0.589 | 0.275 | 0.839 |
| CD276 | 2.05±0.10 | 2.24±0.30 | 2.41±0.30 | 0.120 | 0.213 | 0.145 | 0.976 |
| LY9 | 8.35±0.34 | 8.84±0.20 | 8.94±0.28 | 0.000 | 0.000 | 0.000 | 0.507 |
| CTLA4 | 4.68±0.46 | 4.89±0.34 | 4.76±0.26 | 0.201 | 0.760 | 0.178 | 0.521 |
| EMR2 | 11.62±0.61 | 10.60±0.58 | 10.30±0.46 | 0.000 | 0.000 | 0.000 | 0.175 |
| TNFSF4 | 7.26±0.56 | 6.79±0.53 | 7.05±0.59 | 0.051 | 0.324 | 0.053 | 0.324 |
| TNFSF9 | 3.88±0.87 | 3.20±0.88 | 3.47±0.65 | 0.054 | 0.136 | 0.930 | 0.063 |
| PD1 | 8.96±0.41 | 9.49±0.49 | 9.30±0.40 | 0.001 | 0.042 | 0.001 | 0.469 |
| SLAMF1 | 8.62±0.31 | 9.36±0.32 | 9.20±0.43 | 0.000 | 0.000 | 0.000 | 0.336 |
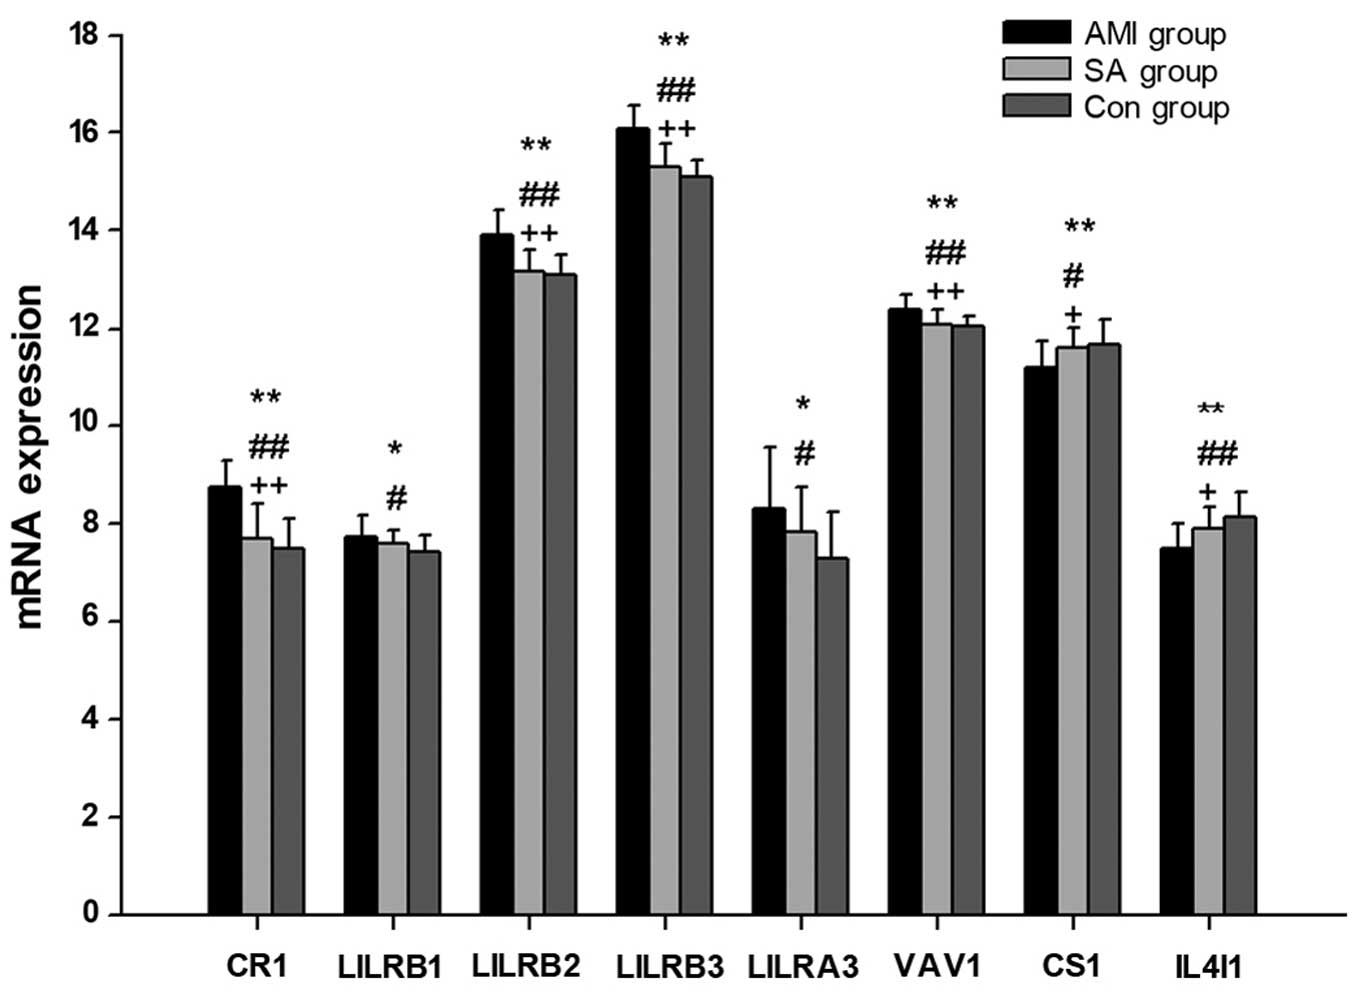
mRNA expression levels of regulatory
genes associated with B cell activation
In PBMCs from the AMI, SA and control groups, the
expression levels of 11 regulatory genes associated with B cell
activation were examined (Table V;
Fig. 4), 8 of which exhibited
significant differences between all groups (P<0.05). In patients
with AMI, the expression levels of LILRB1, LILRA3 (P<0.05), CR1,
LILRB2, LILRB3 and VAV1 (P<0.01) were significantly increased,
whereas the expression of CS1 and IL4I1 were significantly reduced
(P<0.05), compared with the levels in the control group. When
compared with the SA group patients, the mRNA levels of CR1,
LILRB2, LILRB3 and VAV1 were significantly upregulated in patients
with AMI (P<0.01), while CS1 and IL4I1 mRNAs were significantly
downregulated (P<0.05). There were no significant differences in
the gene expression levels of regulators of B cell activation
between patients with SA and control subjects.
| Table VGene expression of regulators
associated with B cell activation. |
Table V
Gene expression of regulators
associated with B cell activation.
| Gene ID | Gene
expressiona
| P-value
|
|---|
| AMI | SA | Control | All groups | AMI vs.
control | AMI vs. SA | SA vs. control |
|---|
| CR1 | 8.75±0.55 | 7.71±0.71 | 7.51±0.62 | 0.000 | 0.000 | 0.000 | 0.577 |
| BAFF | 10.35±0.38 | 10.00±0.45 | 9.78±0.29 | 0.070 | 0.059 | 0.111 | 0.055 |
| LILRB1 | 7.75±0.43 | 7.60±0.29 | 7.45±0.35 | 0.034 | 0.025 | 0.398 | 0.359 |
| LILRB2 | 13.93±0.5 | 13.10±0.43 | 13.09±0.39 | 0.000 | 0.000 | 0.000 | 0.879 |
| LILRB3 | 16.09±0.46 | 15.30±0.48 | 15.11±0.32 | 0.000 | 0.000 | 0.000 | 0.313 |
| LILRB4 | 5.66±0.58 | 5.28±0.62 | 5.55±0.60 | 0.132 | 0.830 | 0.123 | 0.343 |
| LILRA3 | 8.31±1.27 | 7.84±0.94 | 7.32±0.93 | 0.017 | 0.012 | 0.346 | 0.272 |
| LAIR1 | 9.79±0.34 | 9.81±0.29 | 9.85±0.22 | 0.819 | 0.817 | 0.988 | 0.890 |
| VAV1 | 12.41±0.30 | 12.00±0.31 | 12.03±0.21 | 0.000 | 0.000 | 0.001 | 0.893 |
| CS1 | 11.19±0.57 | 11.61±0.42 | 11.67±0.51 | 0.007 | 0.010 | 0.025 | 0.941 |
| IL4I1 | 7.50±0.50 | 7.92±0.44 | 8.16±0.51 | 0.000 | 0.000 | 0.022 | 0.276 |
Discussion
The BCR is composed of a membrane-bound
immunoglobulin (Ig) sheathed by an Igα/Igβ heterodimer. The
receptor is critical in mediating the development and activation of
B cells (16). Ig recognizes
antigens, and the induced signals are transmitted by Igα (CD79A)
and Igβ. It was previously reported that high CD45 expression may
reduce the expression of the BAFF and inhibit B cell survival
(17,18). Furthermore, in vivo studies
in mice indicated that overexpression of NFAM1 may severely impair
early B cell development (19,20).
LYN and FCRL3 appear to mediate positive and negative signaling
during B cell activation (21,22),
with a genetic ablation study indicating that LYN has an important
inhibitory role in B cell signaling (23). In addition, CD19, CD21, CD81 and
FYN are B cell co-receptors that enhance BCR signal transduction
(24–26). By contrast, the B cell specific
Src-family kinase, BLK, and CD5, which specifically bind the ligand
of B cell surface Ig, are dispensable during B cell development and
activation (27,28).
In patients with AMI, the expression levels of CD45,
NFAM1 and LYN were significantly increased, while CD79A, CD79B,
CD19, CD21, CD81, FYN, BLK and CD5 were significantly decreased
compared with the control group (Fig.
1). The results of the current study indicate that the
expression of mRNAs associated with BCR signals were downregulated
in patients with AMI, possibly leading to inhibition of B cell
activation and development. A comparison between SA patients and
the control group demonstrated no significant difference in the
mRNA levels of genes involved in BCR antigen recognition, which
indicates that there may be differential BCR antigen recognition
activity in patients with AMI and SA.
B1 cells are considered to function in the innate
response to infection by viruses and bacteria, and typically
demonstrate preferential responses to T cell-independent antigens
(10,12). Among the 7 B1 cell-associated genes
investigated, the expression levels of CD16, CD32, LILRA1 and TLR9
mRNAs were significantly upregulated in PBMCs from AMI patients
compared with the SA and control groups (Fig. 2). Previous studies have
demonstrated that Fc γ receptors CD16 and CD32 may influence the
growth and differentiation of B cells (29,30).
LILRA1 mRNA transcripts were detected in B cells and the LILRA1
protein has been observed to activate cells by associating with the
γ chain of Fc γ receptors (31,32).
Furthermore, previous studies demonstrated that human B cells were
activated by a TLR9 agonist (33,34).
It was therefore proposed that B1 cell activation is enhanced in
patients with AMI, suggesting that an innate-like immune response
occurs in AMI. However, there was no significant difference in B1
cell-associated gene expression between the SA patients and the
control group. Thus, the results suggest that B1 cell activity is
different in AMI and SA.
B2 cells are important in B cell-specific humoral
immunity (35). Among the 20 genes
examined, the mRNA expression levels of EMR2 and CD97 were
significantly upregulated in AMI patients compared with the SA and
control groups (Fig. 3). EMR2 and
CD97 are important for the interaction between T cells and B cells
(36). The SLAM family, including
SLAMF1 and LY9, together with CD28 and CD43, are essential in the
development and maturation of B cells, and the control of the
humoral immune response (37–39).
The ICOS-ICOSL and PD1-PDL pathways are important for the
stimulation of effector T cell and B2 cell responses (40–42).
The association between CD40 and CD40L, which are expressed on the
surface of activated T cells, promotes the activation of B cells
(43). CD20 is a B cell-specific
integral membrane protein that regulates B cell proliferation
(44). In the present study, the
levels of SLAMF1, LY9, CD28, CD43, ICOSL, PD1, CD40 and CD20 mRNAs
were lower in AMI patients compared with the control group
(Fig. 3). These results
demonstrate that the T cell-B cell interaction was weakened during
the B2 cell activation in AMI. No significant differences were
observed between the SA and control group patients, indicating that
the potential insufficiency of the humoral response only occurred
in the B2 subset during AMI.
Among the 11 regulatory genes associated with B cell
activation examined, the mRNA expression levels of CR1, LILRB2,
LILRB3, LILRA3 and VAV1 were significantly increased in AMI
patients compared with those in the SA and control groups (Fig. 4). CR1 is an inhibitor of
BCR-mediated B cell activation (45) and LILRB negatively regulates the
activation of antigen presenting cells (46,47).
Additionally, it has been previously demonstrated that mice lacking
VAV1 exhibit defects in B cell activation (48). Previous studies also observed that
CS1 promotes the proliferation of human B lymphocytes and increases
the expression of autocrine cytokines (20,49–51).
Thus, the results of the current study indicate that B cell
activation is inhibited in patients with AMI. Furthermore, there
was no significant difference in the mRNA levels of genes
associated with B cell activation between the SA and control
groups.
During the current study, standard gene testing
procedures and appropriate statistical analyses were performed
using randomly selected patients and controls, however, the study
was not without limitations. Notably, there was an age difference
between patients with AMI/SA and the control subjects. It is
unclear whether aging affected the humoral response or whether the
young control group had a normal immunity status compared with
AMI/SA patients. However, the current data indicates that there was
no significant difference in humoral immunity between patients with
SA and the control group. The second limitation was the enhanced B1
cell activation observed in patients with AMI. B1 cells are a minor
component of the total B cell population, which is a part of the
innate immune response and produces natural antibodies. Thus,
further in vitro studies are required to elucidate the
pathological mechanisms of antigen processing pathways in the B
cell system.
In conclusion, the statistical downregulation of
genes associated with the BCR, B2 cells and B cell regulators in
patients with AMI indicates that there is a weakened T cell-B cell
interaction, as well as reduced B2 cell activation and development,
during AMI. Notably, there were no statistical differences in the
expression levels of B cell-associated genes between the SA and
control groups, demonstrating that B2 cell dysfunction is only
observable in AMI and not in SA. B2 cells are considered to be the
conventional B lymphocytes, producing and regulating the
antibody-mediated humoral immunity (12,13).
Consequently, improving B2 cell-mediated humoral immunity may be
considered as a potential target for the treatment of patients with
AMI.
Acknowledgments
The present study was supported by the Shanghai
Traditional Chinese Medicine 3-Year Development Program (2014–2016;
grant no. ZY3-CCCX-3-3047).
Abbreviations:
|
BCR
|
B cell antigen receptor
|
|
AMI
|
acute myocardial infarction
|
|
PBMCs
|
peripheral blood mononuclear cells
|
|
SA
|
stable angina
|
|
Ig
|
immunoglobulin
|
References
|
1
|
Murray CJ, Vos T, Lozano R, Naghavi M,
Flaxman AD, Michaud C, Ezzati M, Shibuya K, Salomon JA, Abdalla S,
et al: Disability-adjusted life years (DALYs) for 291 diseases and
injuries in 21 regions, 1990–2010: A systematic analysis for the
Global Burden of Disease Study 2010. Lancet. 380:2197–2223. 2012.
View Article : Google Scholar : PubMed/NCBI
|
|
2
|
Kyaw T, Tay C, Khan A, Dumouchel V, Cao A,
To K, Kehry M, Dunn R, Agrotis A, et al: Conventional B2 B cell
depletion ameliorates whereas its adoptive transfer aggravates
atherosclerosis. J Immunol. 185:4410–4419. 2010. View Article : Google Scholar : PubMed/NCBI
|
|
3
|
Clement M, Guedj K, Andreata F, Morvan M,
Bey L, Khallou-Laschet J, Gaston AT, Delbosc S, Alsac JM, Bruneval
P, et al: Control of the T follicular helper-germinal center B-cell
axis by CD8+ regulatory T cells limits atherosclerosis
and tertiary lymphoid organ development. Circulation. 131:560–570.
2015. View Article : Google Scholar : PubMed/NCBI
|
|
4
|
Paigen B, Morrow A, Holmes PA, Mitchell D
and Williams A: Quantitative assessment of atherosclerotic lesions
in mice. Atherosclerosis. 68:231–240. 1987. View Article : Google Scholar : PubMed/NCBI
|
|
5
|
Thorp E, Cui D, Schrijvers DM, Kuriakose G
and Tabas I: Mertk receptor mutation reduces efferocytosis
efficiency and promotes apoptotic cell accumulation and plaque
necrosis in atherosclerotic lesions of apoe−/− mice. Arterioscler
Thromb Vasc Biol. 28:1421–1428. 2008. View Article : Google Scholar : PubMed/NCBI
|
|
6
|
Tsiantoulas D, Diehl CJ, Witztum JL and
Binder CJ: B cells and humoral immunity in atherosclerosis. Circ
Res. 114:1743–1756. 2014. View Article : Google Scholar : PubMed/NCBI
|
|
7
|
Kyaw T, Tay C, Krishnamurthi S, Kanellakis
P, Agrotis A, Tipping P, Bobik A and Toh BH: B1a B lymphocytes are
atheroprotective by secreting natural IgM that increases IgM
deposits and reduces necrotic cores in atherosclerotic lesions.
Circ Res. 109:830–840. 2011. View Article : Google Scholar : PubMed/NCBI
|
|
8
|
Kyaw T, Tay C, Hosseini H, Kanellakis P,
Gadowski T, MacKay F, Tipping P, Bobik A and Toh BH: Depletion of
B2 but not B1a B cells in BAFF receptor-deficient ApoE mice
attenuates atherosclerosis by potently ameliorating arterial
inflammation. PLoS One. 7:e293712012. View Article : Google Scholar : PubMed/NCBI
|
|
9
|
Ait-Oufella H, Herbin O, Bouaziz JD,
Binder CJ, Uyttenhove C, Laurans L, Taleb S, Van Vré E, Esposito B,
Vilar J, et al: B cell depletion reduces the development of
atherosclerosis in mice. J Exp Med. 207:1579–1587. 2010. View Article : Google Scholar : PubMed/NCBI
|
|
10
|
Janeway CA Jr, Travers P, Walport M and
Shlomchik MJ: Immunobiology. 5th edition. Garland Science; New
York: 2001
|
|
11
|
Sage AP and Mallat Z: Multiple potential
roles for B cells in atherosclerosis. Ann Med. 46:297–303. 2014.
View Article : Google Scholar : PubMed/NCBI
|
|
12
|
Cerutti A, Cols M and Puga I: Marginal
zone B cells: Virtues of innate-like antibody-producing
lymphocytes. Nat Rev Immunol. 13:118–132. 2013. View Article : Google Scholar : PubMed/NCBI
|
|
13
|
Tsiantoulas D, Sage AP, Mallat Z and
Binder CJ: Targeting B cells in atherosclerosis: Closing the gap
from bench to bedside. Arterioscler Thromb Vasc Biol. 35:296–302.
2015. View Article : Google Scholar
|
|
14
|
Thygesen K, Alpert JS, Jaffe AS, Simoons
ML, Chaitman BR and White HD: Joint ESC/ACCF/AHA/WHF Task Force for
Universal Definition of Myocardial Infarction: Third universal
definition of myocardial infarction. J Am Coll Cardiol.
60:1581–1598. 2012. View Article : Google Scholar : PubMed/NCBI
|
|
15
|
Livak KJ and Schmittgen TD: Analysis of
relative gene expression data using real-time quantitative PCR and
the 2(-Delta Delta C(T)) method. Methods. 25:402–408. 2001.
View Article : Google Scholar
|
|
16
|
Kurosaki T: Regulation of BCR signaling.
Mol Immunol. 48:1287–1291. 2011. View Article : Google Scholar : PubMed/NCBI
|
|
17
|
Huntington ND, Xu Y, Puthalakath H, Light
A, Willis SN, Strasser A and Tarlinton DM: CD45 links the B cell
receptor with cell survival and is required for the persistence of
germinal centers. Nat Immunol. 7:190–198. 2006. View Article : Google Scholar
|
|
18
|
Zikherman J, Doan K, Parameswaran R,
Raschke W and Weiss A: Quantitative differences in CD45 expression
unmask functions for CD45 in B-cell development, tolerance, and
survival. Proc Natl Acad Sci USA. 109:E3–E12. 2012. View Article : Google Scholar :
|
|
19
|
Ohtsuka M, Arase H, Takeuchi A, Yamasaki
S, Shiina R, Suenaga T, Sakurai D, Yokosuka T, Arase N, Iwashima M,
et al: NFAM1, an immunoreceptor tyrosine-based activation
motif-bearing molecule that regulates B cell development and
signaling. Proc Natl Acad Sci USA. 101:8126–8131. 2004. View Article : Google Scholar : PubMed/NCBI
|
|
20
|
Lv W, Duan Q, Wang L, Gong Z, Yang F and
Song Y: Expression of B-cell-associated genes in peripheral blood
mononuclear cells of patients with symptomatic pulmonary embolism.
Mol Med Rep. 11:2299–2305. 2015.
|
|
21
|
Scapini P, Pereira S, Zhang H and Lowell
CA: Multiple roles of Lyn kinase in myeloid cell signaling and
function. Immunol Rev. 228:23–40. 2009. View Article : Google Scholar : PubMed/NCBI
|
|
22
|
Li FJ, Schreeder DM, Li R, Wu J and Davis
RS: FCRL3 promotes TLR9-induced B-cell activation and suppresses
plasma cell differentiation. Eur J Immunol. 43:2980–2992. 2013.
View Article : Google Scholar : PubMed/NCBI
|
|
23
|
Stepanek O, Draber P, Drobek A, Horejsi V
and Brdicka T: Nonredundant roles of Src-family kinases and Syk in
the initiation of B-cell antigen receptor signaling. J Immunol.
190:1807–1818. 2013. View Article : Google Scholar : PubMed/NCBI
|
|
24
|
Barrington RA, Schneider TJ, Pitcher LA,
Mempel TR, Ma M, Barteneva NS and Carroll MC: Uncoupling CD21 and
CD19 of the B-cell coreceptor. Proc Natl Acad Sci USA.
106:14490–14495. 2009. View Article : Google Scholar : PubMed/NCBI
|
|
25
|
van Zelm MC, Smet J, Adams B, Mascart F,
Schandené L, Janssen F, Ferster A, Kuo CC, Levy S, van Dongen JJ
and van der Burg M: CD81 gene defect in humans disrupts CD19
complex formation and leads to antibody deficiency. J Clin Invest.
120:1265–1274. 2010. View
Article : Google Scholar : PubMed/NCBI
|
|
26
|
Barua D, Hlavacek WS and Lipniacki TA:
Computational model for early events in B cell antigen receptor
signaling: Analysis of the roles of Lyn and Fyn. J Immunol.
189:646–658. 2012. View Article : Google Scholar : PubMed/NCBI
|
|
27
|
Texido G, Su IH, Mecklenbräuker I, Saijo
K, Malek SN, Desiderio S, Rajewsky K and Tarakhovsky A: The
B-cell-specific Src-family kinase Blk is dispensable for B-cell
development and activation. Mol Cell Biol. 20:1227–1233. 2000.
View Article : Google Scholar : PubMed/NCBI
|
|
28
|
Pospisil R, Silverman GJ, Marti GE, Aruffo
A, Bowen MA and Mage RG: CD5 is A potential selecting ligand for
B-cell surface immunoglobulin: A possible role in maintenance and
selective expansion of normal and malignant B cells. Leuk Lymphoma.
36:353–365. 2000. View Article : Google Scholar : PubMed/NCBI
|
|
29
|
de Andres B, Mueller AL, Verbeek S, Sandor
M and Lynch RG: A regulatory role for Fcgamma receptors CD16 and
CD32 in the development of murine B cells. Blood. 92:2823–2829.
1998.PubMed/NCBI
|
|
30
|
Horejs-Hoeck J, Hren A, Mudde GC and
Woisetschläger M: Inhibition of immunoglobulin E synthesis through
Fc gammaRII (CD32) by a mechanism independent of B-cell receptor
co-cross-linking. Immunology. 115:407–415. 2005. View Article : Google Scholar : PubMed/NCBI
|
|
31
|
Tedla N, An H, Borges L, Vollmer-Conna U,
Bryant K, Geczy C and McNeil HP: Expression of activating and
inhibitory leukocyte immunoglobulin-like receptors in rheumatoid
synovium: Correlations to disease activity. Tissue Antigens.
77:305–316. 2011. View Article : Google Scholar : PubMed/NCBI
|
|
32
|
Fanger NA, Borges L and Cosman D: The
leukocyte immunoglobulin-like receptors (LIRs): A new family of
immune regulators. J Leukoc Biol. 66:231–236. 1999.PubMed/NCBI
|
|
33
|
Hanten JA, Vasilakos JP, Riter CL, Neys L,
Lipson KE, Alkan SS and Birmachu W: Comparison of human B cell
activation by TLR7 and TLR9 agonists. BMC Immunol. 9:392008.
View Article : Google Scholar : PubMed/NCBI
|
|
34
|
Yamazaki K, Yamazaki T, Taki S, Miyake K,
Hayashi T, Ochs HD and Agematsu K: Potentiation of TLR9 responses
for human naïve B-cell growth through RP105 signaling. Clin
Immunol. 135:125–136. 2010. View Article : Google Scholar : PubMed/NCBI
|
|
35
|
Hilgendorf I, Theurl I, Gerhardt LM,
Robbins CS, Weber GF, Gonen A, Iwamoto Y, Degousee N, Holderried
TA, Winter C, et al: Innate response activator B cells aggravate
atherosclerosis by stimulating T helper-1 adaptive immunity.
Circulation. 129:1677–1687. 2014. View Article : Google Scholar : PubMed/NCBI
|
|
36
|
Kwakkenbos MJ, Pouwels W, Matmati M,
Stacey M, Lin HH, Gordon S, van Lier RA and Hamann J: Expression of
the largest CD97 and EMR2 isoforms on leukocytes facilitates a
specific interaction with chondroitin sulfate on B cells. J Leukoc
Biol. 77:112–119. 2005.
|
|
37
|
De Salort J, Sintes J, Llinàs L,
Matesanz-Isabel J and Engel P: Expression of SLAM (CD150)
cell-surface receptors on human B-cell subsets: From pro-B to
plasma cells. Immunol Lett. 134:129–136. 2011. View Article : Google Scholar
|
|
38
|
Reiter R and Pfeffer K: Impaired germinal
centre formation and humoral immune response in the absence of CD28
and interleukin-4. Immunology. 106:222–228. 2002. View Article : Google Scholar : PubMed/NCBI
|
|
39
|
Galindo-Albarrán AO, Ramírez-Pliego O,
Labastida-Conde RG, Melchy-Pérez EI, Liquitaya-Montiel A,
Esquivel-Guadarrama FR, Rosas-Salgado G, Rosenstein Y and Santana
MA: CD43 signals prepare human T cells to receive cytokine
differentiation signals. J Cell Physiol. 229:172–180. 2014.
View Article : Google Scholar
|
|
40
|
Chen J, Wang F, Cai Q, Shen S, Chen Y, Hao
C and Sun J: A novel anti-human ICOSL monoclonal antibody that
enhances IgG production of B cells. Monoclon Antib Immunodiagn
Immunother. 32:125–131. 2013. View Article : Google Scholar : PubMed/NCBI
|
|
41
|
Greenwald RJ, Freeman GJ and Sharpe AH:
The B7 family revisited. Annu Rev Immunol. 23:515–548. 2005.
View Article : Google Scholar : PubMed/NCBI
|
|
42
|
Mak TW, Shahinian A, Yoshinaga SK, Wakeham
A, Boucher LM, Pintilie M, Duncan G, Gajewska BU, Gronski M,
Eriksson U, et al: Costimulation through the inducible costimulator
ligand is essential for both T helper and B cell functions in T
cell-dependent B cell responses. Nat Immunol. 4:765–772. 2003.
View Article : Google Scholar : PubMed/NCBI
|
|
43
|
Nadeau PJ, Roy A, Gervais-St-Amour C,
Marcotte MÈ, Dussault N and Néron S: Modulation of CD40-activated B
lymphocytes by N-acetylcysteine involves decreased phosphorylation
of STAT3. Mol Immunol. 49:582–592. 2012. View Article : Google Scholar
|
|
44
|
Uchida J, Lee Y, Hasegawa M, Liang Y,
Bradney A, Oliver JA, Bowen K, Steeber DA, Haas KM, Poe JC and
Tedder TF: Mouse CD20 expression and function. Int Immunol.
16:119–129. 2004. View Article : Google Scholar
|
|
45
|
Józsi M, Prechl J, Bajtay Z and Erdei A:
Complement receptor type 1 (CD35) mediates inhibitory signals in
human B lymphocytes. J Immunol. 168:2782–2788. 2002. View Article : Google Scholar : PubMed/NCBI
|
|
46
|
Young NT, Waller EC, Patel R, Roghanian A,
Austyn JM and Trowsdale J: The inhibitory receptor LILRB1 modulates
the differentiation and regulatory potential of human dendritic
cells. Blood. 111:3090–3096. 2008. View Article : Google Scholar
|
|
47
|
HoWangYin KY, Loustau M, Wu J, Alegre E,
Daouya M, Caumartin J, Sousa S, Horuzsko A, Carosella ED and
LeMaoult J: Multimeric structures of HLA-G isoforms function
through differential binding to LILRB receptors. Cell Mol Life Sci.
69:4041–4049. 2012. View Article : Google Scholar : PubMed/NCBI
|
|
48
|
Fujikawa K, Miletic AV, Alt FW, Faccio R,
Brown T, Hoog J, Fredericks J, Nishi S, Mildiner S, Moores SL, et
al: Vav1/2/3-null mice define an essential role for Vav family
proteins in lymphocyte development and activation but a
differential requirement in MAPK signaling in T and B cells. J Exp
Med. 198:1595–1608. 2003. View Article : Google Scholar : PubMed/NCBI
|
|
49
|
Lee JK, Mathew SO, Vaidya SV, Kumaresan PR
and Mathew PA: CS1 (CRACC, CD319) induces proliferation and
autocrine cytokine expression on human B lymphocytes. J Immunol.
179:4672–4678. 2007. View Article : Google Scholar : PubMed/NCBI
|
|
50
|
Kim JR, Mathew SO, Patel RK, Pertusi RM
and Mathew PA: Altered expression of signalling lymphocyte
activation molecule (SLAM) family receptors CS1 (CD319) and 2B4
(CD244) in patients with systemic lupus erythematosus. Clin Exp
Immunol. 160:348–358. 2010. View Article : Google Scholar : PubMed/NCBI
|
|
51
|
Hsi ED, Steinle R, Balasa B, Szmania S,
Draksharapu A, Shum BP, Huseni M, Powers D, Nanisetti A, Zhang Y,
et al: CS1, a potential new therapeutic antibody target for the
treatment of multiple myeloma. Clin Cancer Res. 14:2775–2784. 2008.
View Article : Google Scholar : PubMed/NCBI
|