Introduction
Head and neck squamous cell carcinoma (HNSCC), the
major histological type of head and neck cancer (90–95%), is the
sixth most common cancer type worldwide, with an incidence of
<600,000 cases per year (1,2).
More than 60% of HNSCC patients are already in the advanced stage
at the time-point of first diagnosis (3). Despite the advances in the treatments
for HNSCC, including surgical methods, chemoradiotherapy and the
introduction of targeted therapies, the overall survival has not
significantly improved in the last decades, with a five-year
survival rate of only 40–50% (10–30% for patients with stage IVa
and IVb tumors) (4,5). Therefore, it is urgently required to
thoroughly explore the molecular characteristics of HNSCC to
develop novel molecular-based targeted strategies for its
treatment.
Numerous recent studies have investigated the
biological characteristics of HNSCC. Certain genes, micro (mi)RNAs,
transcription factors (TFs) and signaling pathways, including XPA,
miR-504, EGR3 and the Notch signaling pathway, respectively, have
important roles in the genesis and development of HNSCC, and are
correlated to the prognosis of affected patients (6–8).
However, to date, a comprehensive and systemic analysis of
expression profiles in HNSCC has been lacking. The present study
used the high-throughput mRNA and miRNA expression data from
hundreds of HNSCC samples released by The Cancer Genome Atlas
(TCGA) database to identify differentially expressed genes (DEGs)
and miRNAs (DEMs) between human HNSCC and normal head and neck
tissues. Significant gene functions and signaling pathways in which
those DEGs are enriched were then determined. Finally, the
regulatory network among TFs, DEMs and DEGs was mapped. The present
study contributed to the current understanding of the molecular
basis of HNSCC and may aid in the development of novel means of
prevention, diagnosis and treatment.
Materials and methods
Data sources
Level 3 RNA-sequencing data from 43 normal samples
and 498 HNSCC samples, and level 3 miRNA-sequencing data from 45
normal samples and 513 HNSCC samples released by TCGA prior to July
1st, 2014 were all obtained from the TCGA data portal (https://tcga-data.nci.nih.gov/tcga/). As
published previously, the mature miRNAs and star miRNAs (3′ arms of
pre-miRNA) from each pre-miRNA in the miRNA sequencing data were
sorted and calculated according to their MIMAT serial number based
on miRbase V20.0 (http://www.mirbase.org), whereas stem-loop, precursor
or unannotated transcript data were not included in the present
analysis (9,10). Reads per kilobase of exon model per
million mapped reads (RPKM) and reads per million miRNA mapped
(RPM) values were used to represent mRNA and miRNA expression
levels, respectively (11). All
data were presented as the mean ± standard deviation.
Identification of DEGs and DEMs
TwoClassDif was used to identify DEGs and DEMs
between normal samples and HNSC samples as previously reported
(12,13). Briefly, Fold-change (Tumor/Normal)
was firstly used to filter DEGs and DEMs. Only genes with a
Fold-change (Tumor/Normal) of >2 or <0.5, and miRNAs with a
Fold-change (Tumor/Normal) of >2.5 or <0.4 progressed to next
stages. Subsequently, the DEGs and DEMs were further confirmed with
the t-test and random variance model (RVM)-modified t-test to
reduce statistical errors using SPSS for windows, version 20
(International Business Machines, Armonk, NY, USA). In the present
study, P<0.05 corrected by the false discovery rate (FDR) was
considered to indicate a statistically significant difference.
Gene ontology (GO) analysis
GO analysis was performed according to the GO
database (http://geneontology.org/) as
previously described (14,15). In brief, the χ2 test and
Fisher's exact test were used to test the significance level of
each function, and the FDR was calculated to correct statistical
errors derived from multiple tests. The significance threshold was
set at P<0.01 and FDR<0.05. The results were then classified
in a GO-map to further integrate the functional links between these
significant GO functions using Cytoscape v3.2.0 (http://cytoscape.org/).
Kyoto Encyclopedia of Genes and Genomes
(KEGG) analysis
KEGG analysis was performed as described previously
using the KEGG database (http://www.genome.jp/kegg/) (16–18).
The χ2 test and Fisher's exact test were also performed
to screen the significant pathways, and the P-value, FDR and
enrichment value were calculated as previously reported (17). Pathways with P<0.01 and
FDR<0.05 were considered as significant. Then, based on the
pathway associations in the KEGG database, the path network was
established to integrate the interactions among these significant
pathways using Cytoscape v3.2.0.
TF - miRNA - gene network analysis
First, the target genes of the DEMs were predicted
using Targetscan (http://www.targetscan.org/) and Miranda (http://www.microrna.org/) (19,20).
The intersections of predictions from the two databases were
matched to these DEGs to identify their regulatory targets.
To predict the TFs that regulate these DEGs and
DEMs, the DNA sequences of these genes and pre-miRNA near the
transcription start site area were acquired, including 1,000-bp
upstream and 200-bp downstream regions. Then, the Match™ algorithm
in the TRANSFAC database (http://www.gene-regulation.com/index2) was used to
search for TF binding sites in these regions. Two score values
generated in this algorithm, the core similarity score (CSS) and
the matrix similarity score (MSS), were then applied to evaluate
the forecast results (21–23). Based on these results, a TF - miRNA
- gene network was finally constructed using Cytoscape v3.2.0, to
summarize and illustrate the regulatory interactions among TFs,
DEMs and DEGs.
Results
Identification of DEGs and DEMs
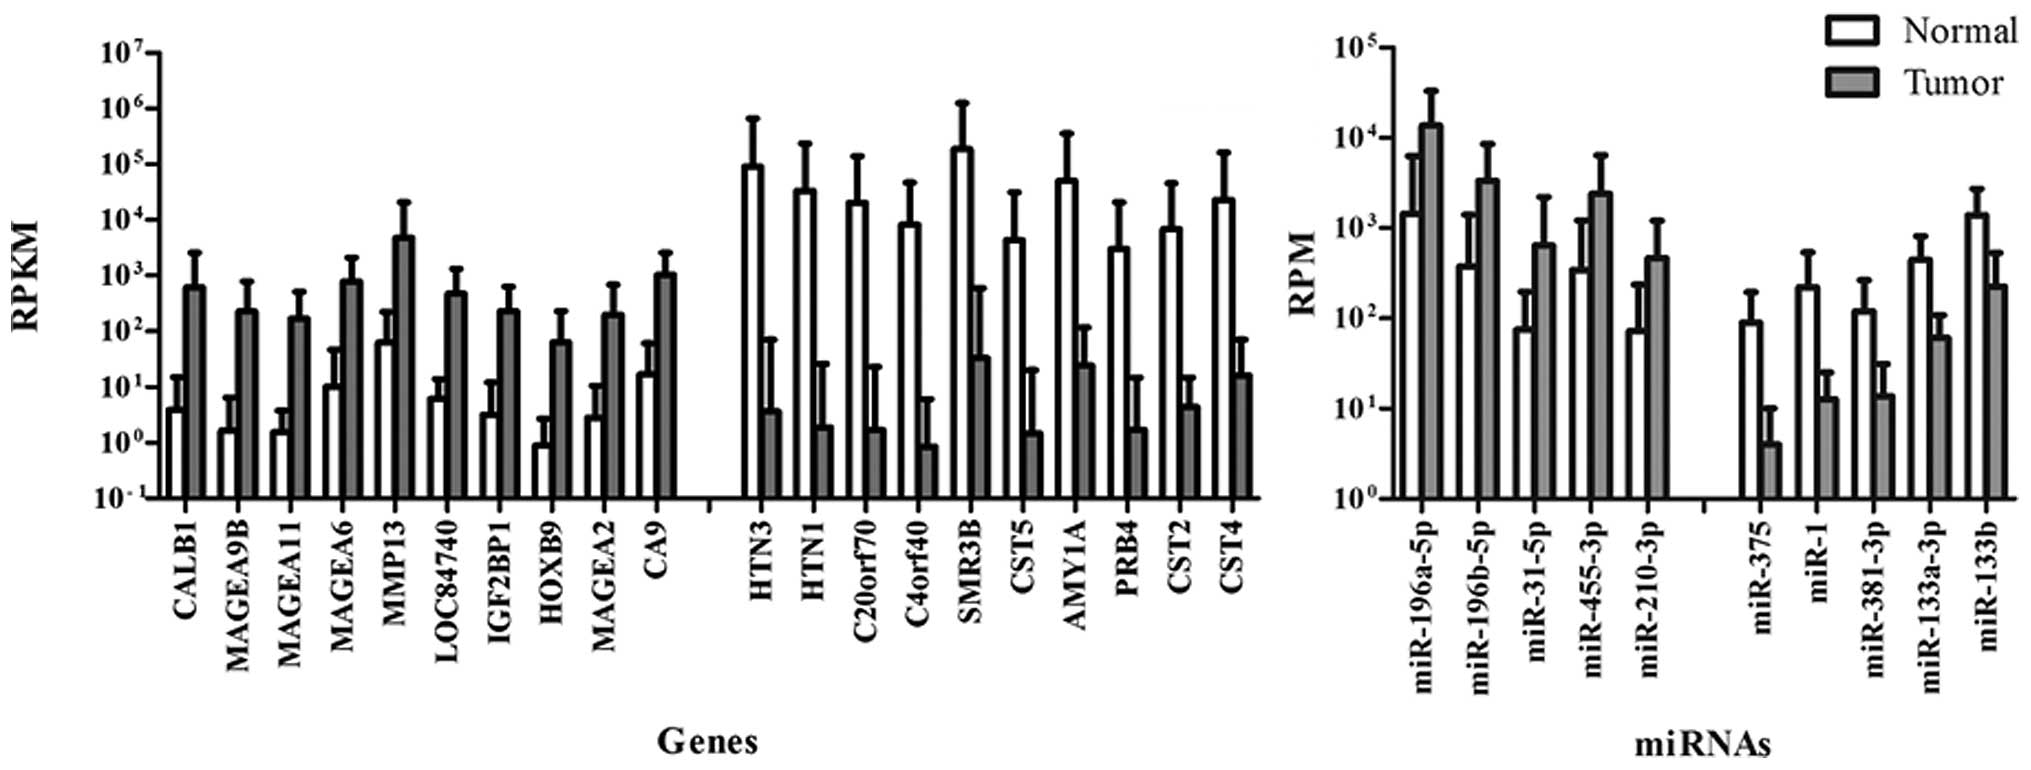
The present study identified 2,594 significant DEGs
(1,087 upregulated and 1,507 down-regulated), and 25 significant
DEMs (8 upregulated and 17 downregulated) in HNSCC compared with
normal control samples. The DEGs and DEMs with the greatest
fold-change are shown in Fig.
1.
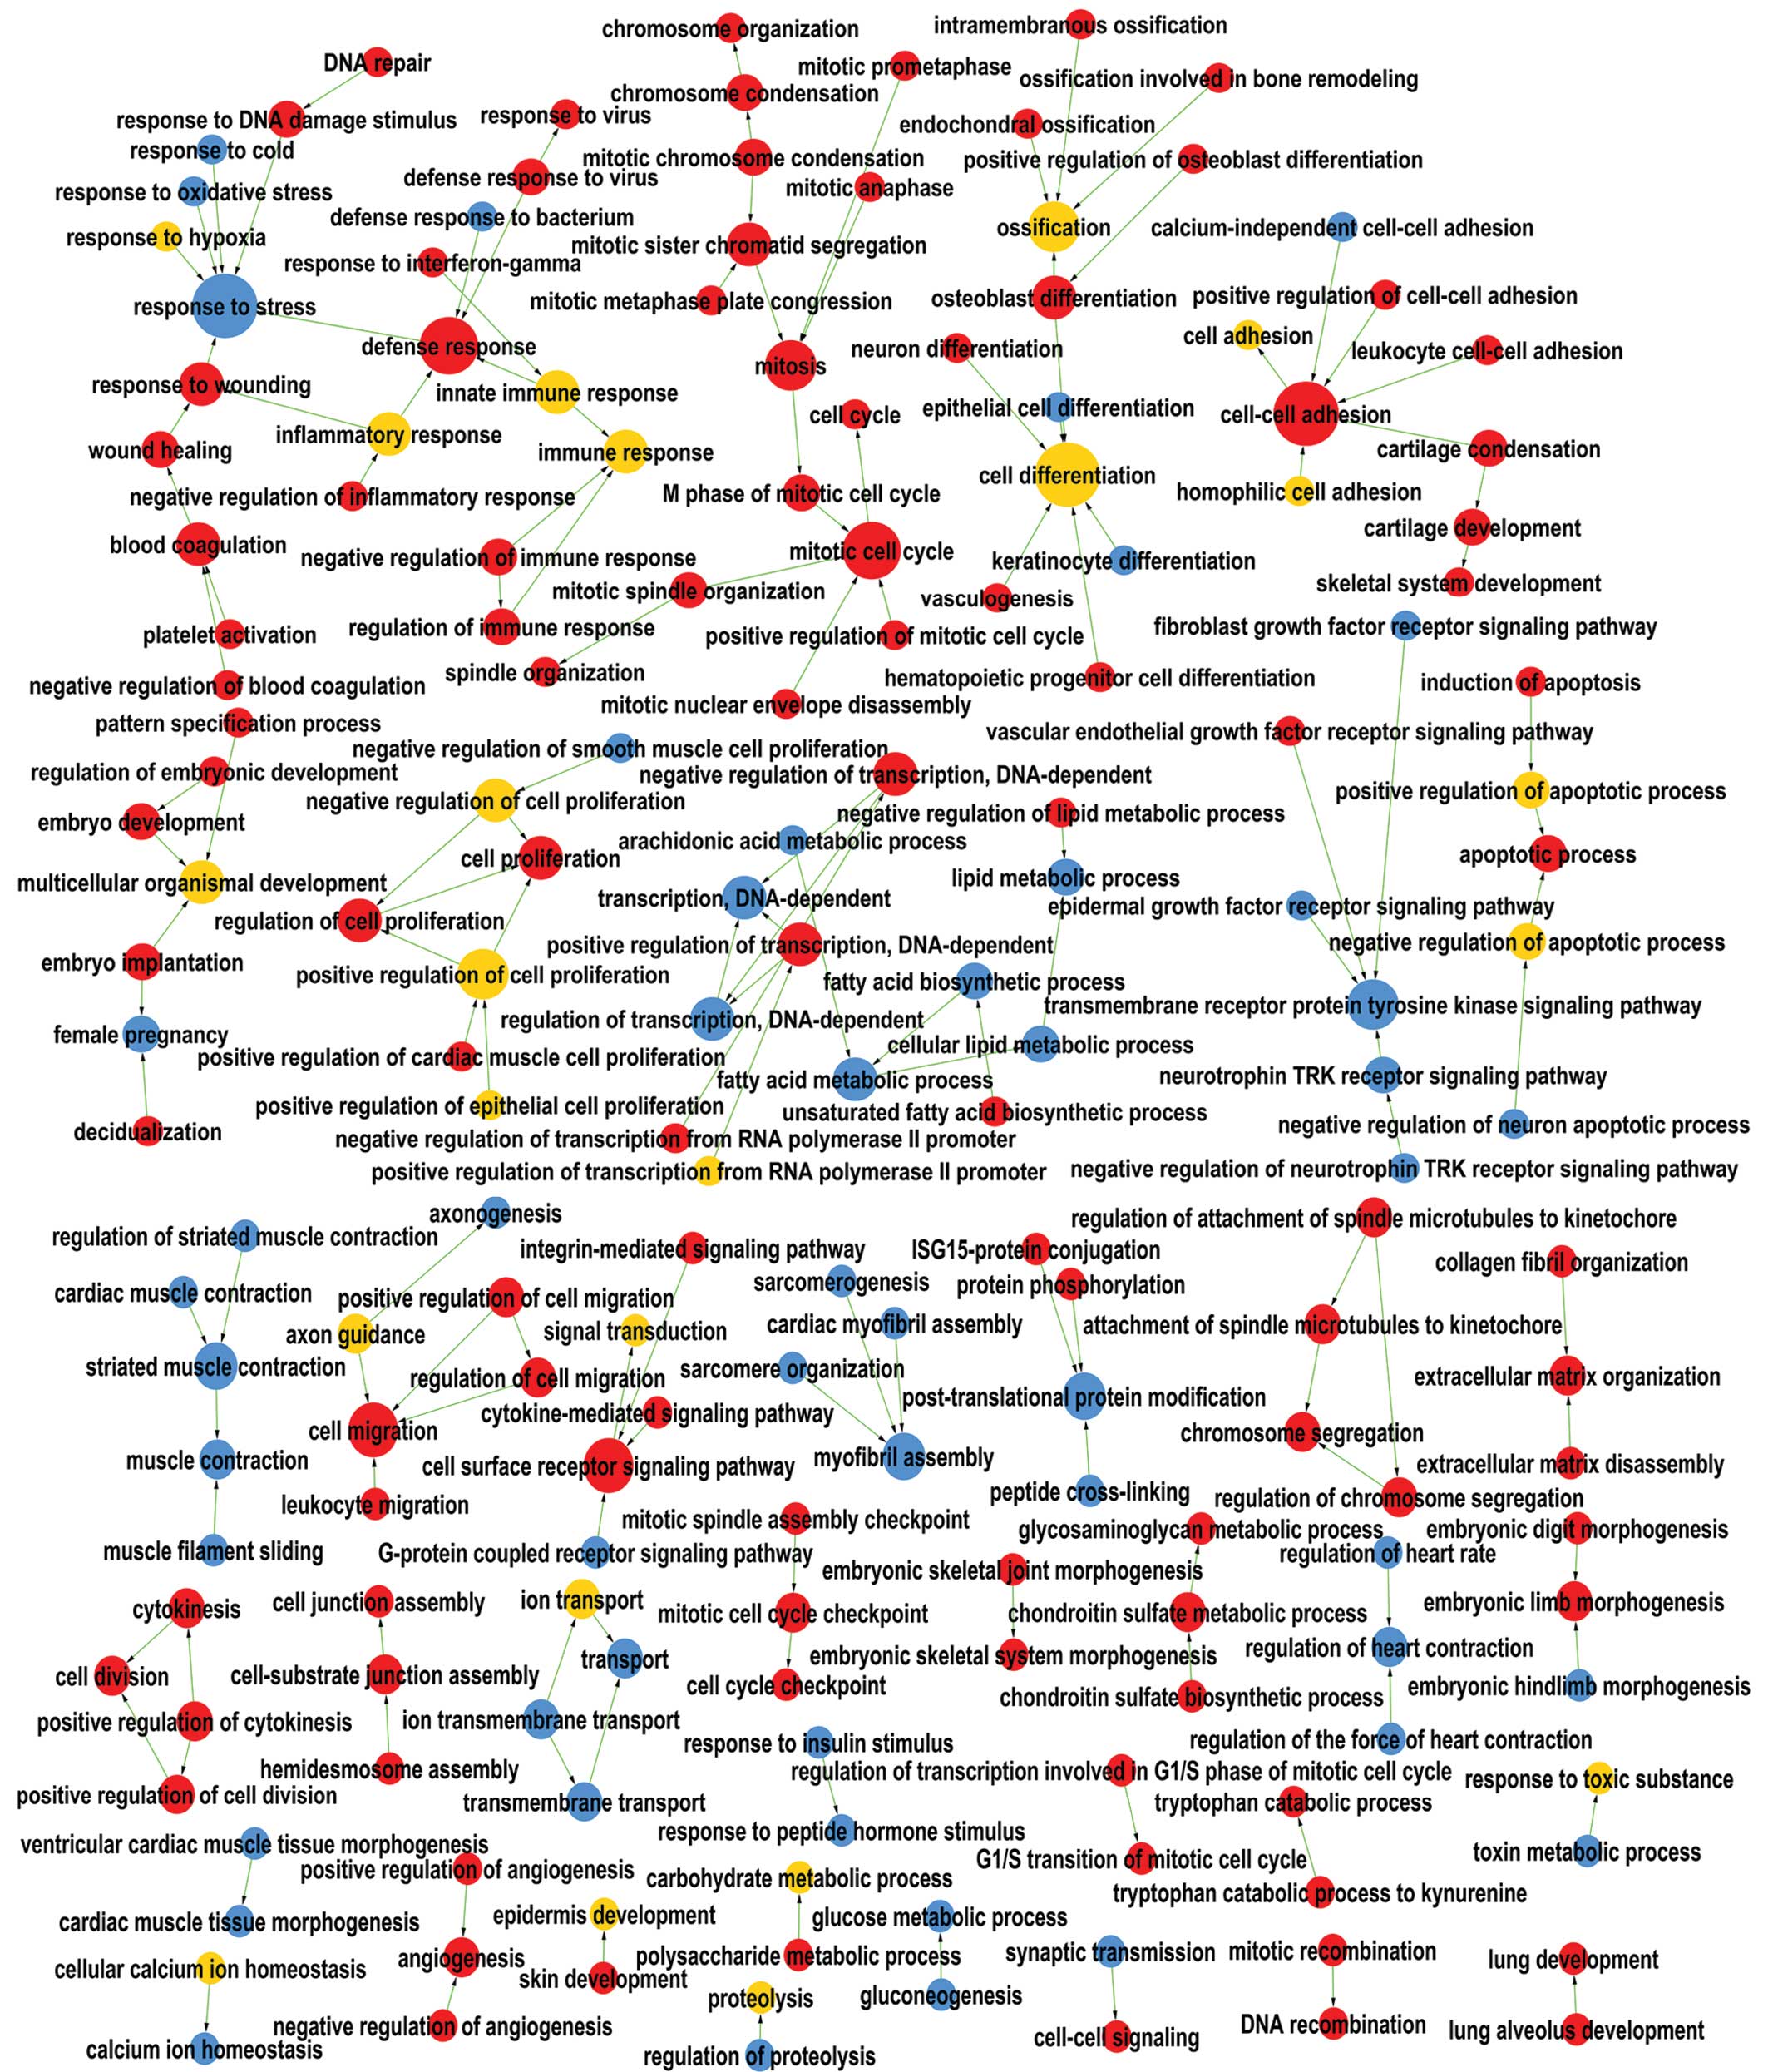
GO analysis results
GO analysis was performed to preliminarily summarize
the biological functions of the DEGs (Fig. 2).
The upregulated genes were mainly enriched in GO
terms including mitosis (GO:0007067), cell proliferation
(GO:0008283), cell division (GO 0051301) and the cell cycle
(GO:0007049), which are features accountable for the
overproliferation of HNSCC cells. They were also enriched in cell
migration (GO:0016477), extracellular matrix organization
(GO:0030198), cell-cell signaling (GO:0007267), angiogenesis
(GO:0001525) and vascular endothelial growth factor receptor
signaling pathway (GO:0048010), indicating the metastatic and
angiogenic capacities of HNSCC.
Downregulated genes were mainly involved in the
G-protein coupled receptor signaling pathway (GO:0007186),
epidermal growth factor receptor signaling pathway (GO:0007173),
transmembrane transport (GO:0055085) and glucose metabolic
processes (GO:0006006), which indicated the potential negative
effects of these GO terms in the genesis and development of
HNSCC.
Furthermore upregulated, as well as downregulated,
genes were significantly enriched in processes including cell
differentiation (GO:0030154), cell adhesion (GO:0007155), immune
response (GO:0006955) and ion transport (GO:0006811), suggesting
that intricate changes were likely to occur in these GOs during the
genesis of HNSCC.
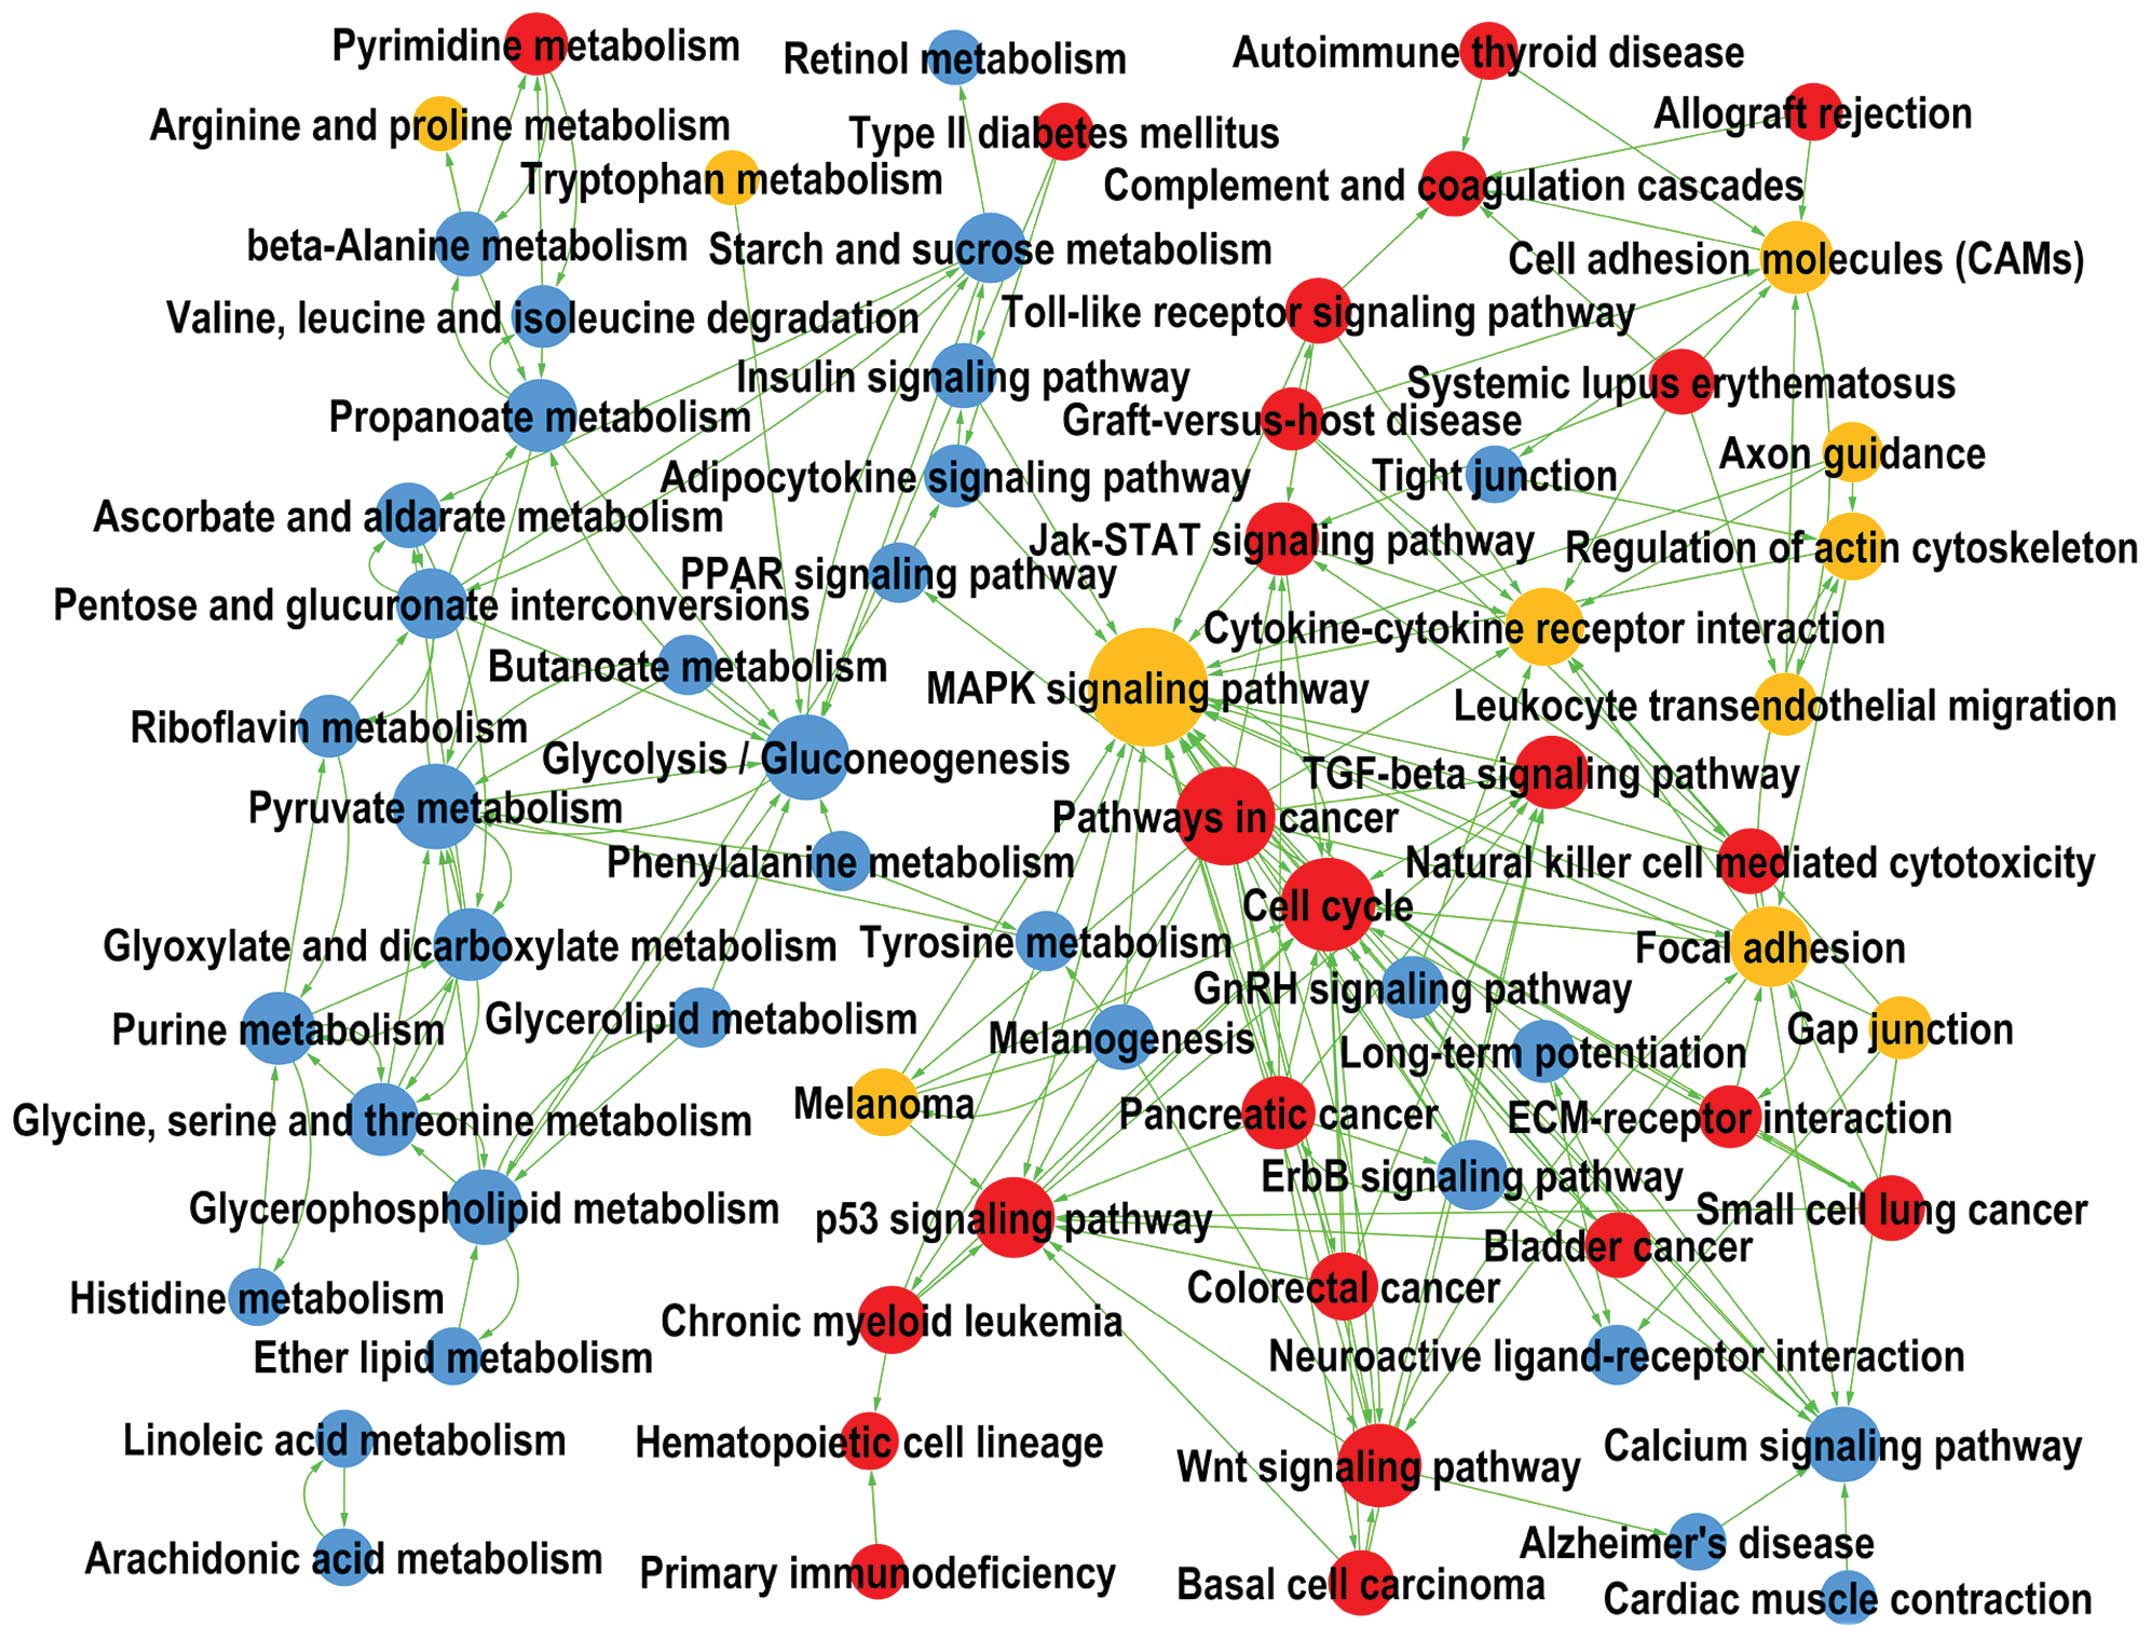
Aberrant pathways in HNSCC tissues
As displayed in Fig.
3, the upregulated genes in HNSCC were significantly enriched
in the cell cycle (Path ID: 4110), Wnt signaling pathway (Path ID:
04310), p53 signaling pathway (Path ID: 04115), Jak/STAT signaling
pathway (Path ID: 04630), TGF-β signaling pathway (Path ID: 04350),
Toll-like receptor signaling pathway (Path ID: 04620) and
extracellular matrix - receptor interaction (Path ID: 04512).
The downregulated genes mostly participated in the
calcium signaling pathway (Path ID: 04020), ErbB signaling pathway
(Path ID: 04012), GnRH signaling pathway (Path ID: 04912), pyruvate
metabolism (Path ID: 00620) and further small molecular metabolism
pathways, while the upregulated as well as downregulated genes were
enriched in pathways including the MAPK signaling pathway (Path ID:
4010) and cell adhesion molecules (Path ID: 04514).
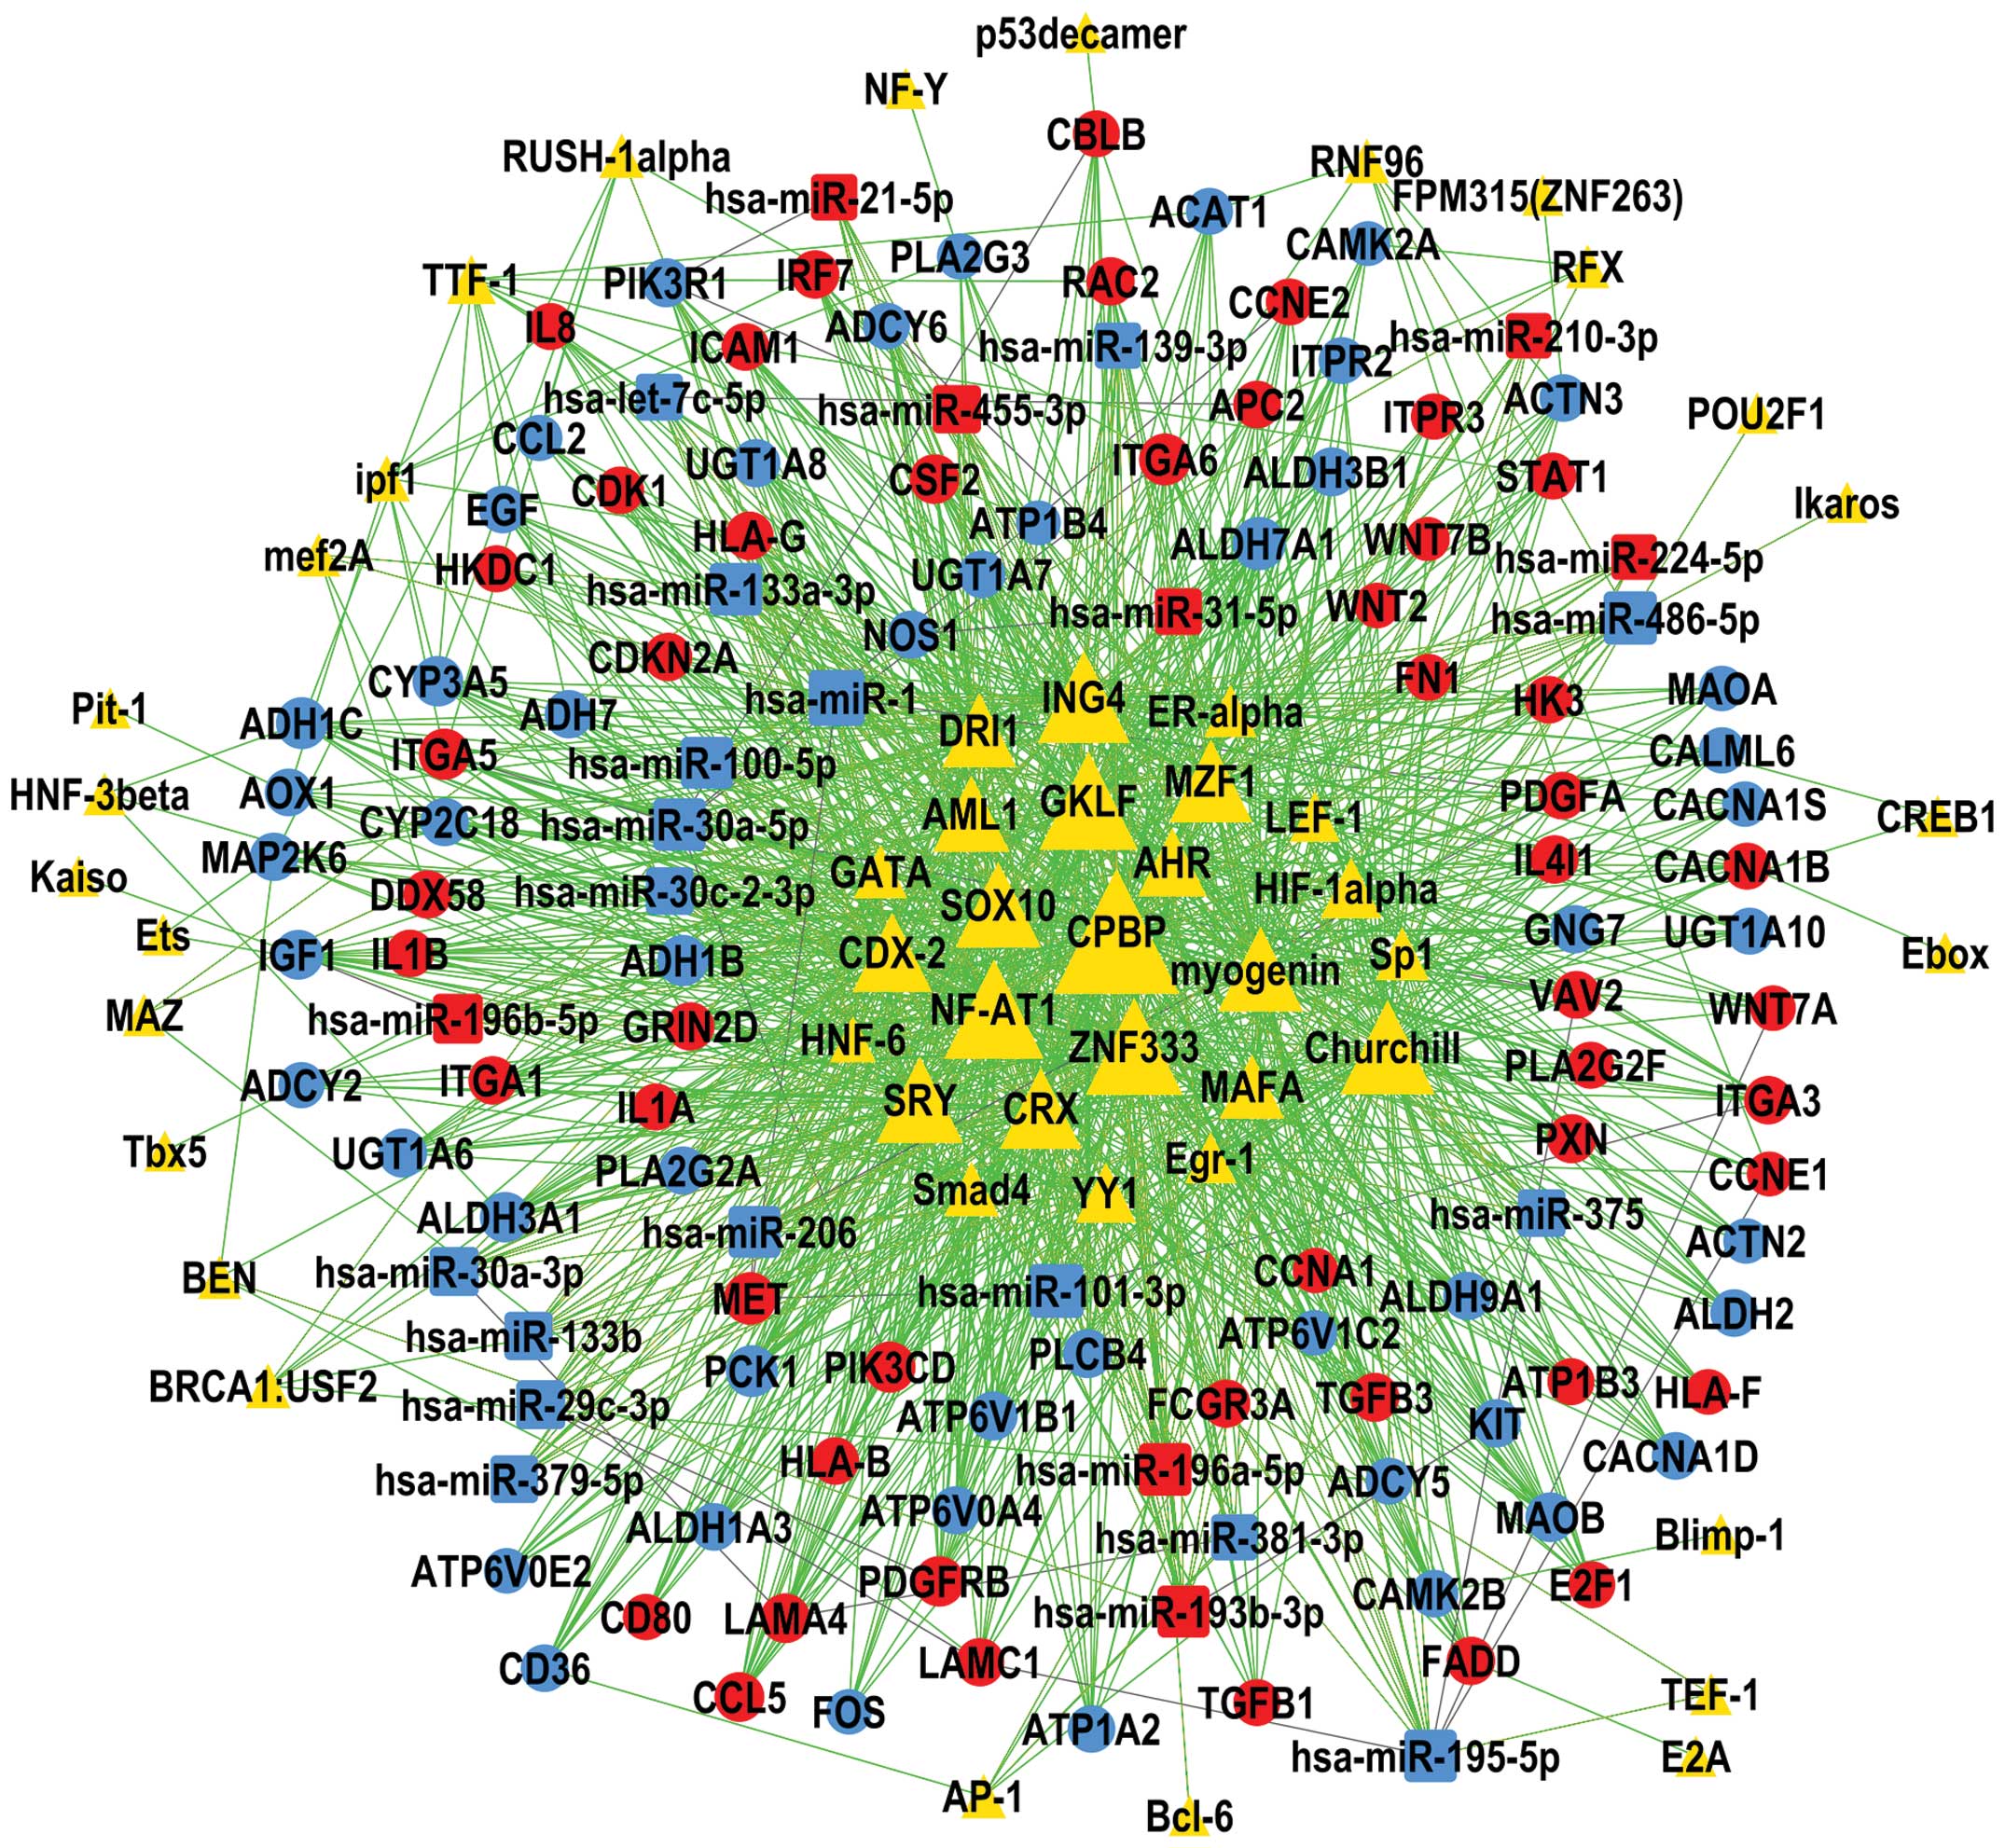
TF - miRNA - gene network
As shown in Fig. 4,
CPBP (also called KLF6) was located in the central hub of the TF -
miRNA - gene network and regulated the largest number of DEMs
(n=22) and genes (n=97) in HNSCC. This was followed by NF-AT1 (also
termed NFATC2), GKLF (also known as KLF4), ZNF333 and Churchill.
miR-1, miR-101-3p, miR-486-5p, miR-133a-3p and miR-195-5p were the
top-5 DEMs that regulated the highest number of DEGs. These
molecular regulators were indicated to have key roles in HNSCC.
Discussion
The present study identified 2,594 DEGs and 25 DEMs
in HNSCC based on gene and miRNA expression profiles of HNSCC
tissues compared with normal tissues. A large variety of DEMs,
including CALB1 and MAGEA9B, DEMs, including miR-196a-5p and
miR-196b-5p, in HNSCC were identified. Overexpression of CALB1 has
been previously reported to be inversely correlated with apoptosis
to be correlated with poor prognosis in other cancer types
(24,25). MAGEA9B and three other genes
belonging to the melanoma antigen family A (MAGEA) were among the
ten most strongly upregulated genes of the present study. This gene
family is highly expressed in early embryos and is associated with
reduced overall survival in numerous types of cancer (26–28).
However, the roles of the CALB1 and MAGEA gene families have been
rarely studied in HNSCC and require to be further investigated. As
the most strongly upregulated miRNAs in the present study,
miR-196a-5p and miR-196b-5p have been frequently reported to be
overexpressed in the blood of HNSCC patients and in HNSCC tissues
and to be associated with the prognosis and radio-response,
indicating their potential as promising diagnostic and prognostic
biomarkers as well as therapeutic targets (29–33).
Therefore, the potential of these DEGs and DEMs as biomarkers and
therapeutic targets deserve further investigation with regard to
their application in the early diagnosis, pathological
identification, treatment and monitoring of HNSCC.
To explore the main functional enrichment and
signaling pathways of these DEGs at the cellular level, GO and KEGG
pathway analyses were performed, respectively. GO functions and
pathways including mitosis and cell cycle as well as Wnt, JAK/STAT
and Toll-like receptor signaling pathways were markedly altered in
HNSCC compared with normal controls. The mutation, abnormal
expression and modification of these GOs and pathways have been
frequently reported in HNSCC and other cancer types (34–38).
In tumor cells, the normal energy metabolism of aerobic respiration
is replaced by glycolysis, which is harnessed for accumulating
intermediates of macromolecule biosynthesis, known as the 'Warburg
effect' (39–41). Along with this, the present study
revealed that the downregulated DEGs were significantly enriched in
gene functions and pathways associated with the metabolism of
glucose, pyruvate and numerous other small molecules. These results
suggested that these significant GOs and pathways are critical
drivers in the carcinogenesis and development of HNSCC, and so are
the DEGs that participate in these GOs and pathways. As shown in
the interaction networks, considerable cross-links exist among
these gene functions and pathways, and therapeutic targeting of one
of them may modulate others, indicating that several parts of the
network may be affected by targeting one component for the
treatment of HNSCC. The hub genes involved in the significant GO
and pathway networks might be applied as novel targets in HNSCC
therapeutic strategies.
There are two major ways in which cells generally
regulate gene expression; one is to regulate the transcription from
DNA to RNA via elements, such as TFs, while the other is to
regulate the stability of RNA via factors, such as miRNAs (42). Using the mRNA and corresponding
miRNA expression data released by TCGA, the present study
constructed the TF - miRNA - gene network in HNSCC. In this
network, CPBP, NF-AT1 and miR-1 were situated in the central hub,
indicating their marked importance in the regulatory net of HNSCC.
CPBP is a member of the Kruppel-like family of TFs, some of which
are implicated in carcinogenesis, acting in processes ranging from
cell proliferation and apoptosis to differentiation, migration and
pluripotency (43). NF-AT1 has a
central role in gene transcription during the immune response and
is associated with several tumor types, including glioblastoma and
human melanoma (44,45). However, the roles of these two TFs
in have remained elusive in HNSCC. As the second most downregulated
DEM, miR-1 has been reported to be a tumor suppressor miRNA
targeting transgelin 2, purine nucleoside phosphorylase,
fibronectin 1 and prothymosin alpha, and to accelerate apoptosis
and inhibit proliferation in HNSCC (46–49).
Further investigation on these TFs and miRNAs will enhance the
current understanding of the molecular mechanisms of HNSCC and help
to identify potential therapeutic targets for the treatment of
HNSCC.
Based on the mRNA and corresponding miRNA expression
data for hundreds of HNSCC samples, the present study identified
the DEGs and DEMs, and then investigated the GOs and pathways in
which the DEGs were significantly enriched. The regulatory links
among the DEMs and DEGs were determined and potential TFs, which
regulate these DEMs and DEGs were predicted to finally construct
the TF - miRNA - gene network. Additionally, the hub genes, TFs and
miRNAs may potentially be targeted by novel therapeutic strategies
in the future. To the best of our knowledge, the present study was
the first systematic bioinformatics analysis in HNSCC, and for the
first time, significantly altered GOs and pathways, as well as DEMs
and TFs were identified in HNSCC. The results of the present study
enhanced the current understanding of the molecular mechanisms
underlying HNSCC, and may provide a source for developing novel
strategies for its prevention, diagnosis and treatment.
Acknowledgments
The authors would like to thank the language editing
service, ICE-editing Co. for editing this manuscript. The present
study was supported by The Science and Technology Commission
Foundation of Shanghai (grant no. 12JC1402102).
References
|
1
|
Bose P, Brockton NT and Dort JC: Head and
neck cancer: From anatomy to biology. Int J Cancer. 133:2013–2023.
2013. View Article : Google Scholar : PubMed/NCBI
|
|
2
|
Parkin DM, Bray F, Ferlay J and Pisani P:
Global cancer statistics, 2002. CA Cancer J Clin. 55:74–108. 2005.
View Article : Google Scholar : PubMed/NCBI
|
|
3
|
Seiwert TY, Salama JK and Vokes EE: The
chemoradiation paradigm in head and neck cancer. Nat Clin Pract
Oncol. 4:156–171. 2007. View Article : Google Scholar : PubMed/NCBI
|
|
4
|
Hsieh JC, Lin HC, Huang CY, Hsu HL, Wu TM,
Lee CL, Chen MC, Wang HM and Tseng CP: Prognostic value of
circulating tumor cells with podoplanin expression in patients with
locally advanced or metastatic head and neck squamous cell
carcinoma. Head Neck. 37:1448–1455. 2015. View Article : Google Scholar
|
|
5
|
Vokes EE, Weichselbaum RR, Lippman SM and
Hong WK: Head and neck cancer. N Engl J Med. 328:184–194. 1993.
View Article : Google Scholar : PubMed/NCBI
|
|
6
|
Mazumder TH, Nath S, Nath N and Kumar M:
Head and neck squamous cell carcinoma: Prognosis using molecular
approach. Cent Eur J Biol. 9:593–613. 2014.
|
|
7
|
Kikkawa N, Kinoshita T, Nohata N, Hanazawa
T, Yamamoto N, Fukumoto I, Chiyomaru T, Enokida H, Nakagawa M,
Okamoto Y and Seki N: microRNA-504 inhibits cancer cell
proliferation via targeting CDK6 in hypopharyngeal squamous cell
carcinoma. Int J Oncol. 44:2085–2092. 2014.PubMed/NCBI
|
|
8
|
Brooks YS, Ostano P, Jo SH, Dai J, Getsios
S, Dziunycz P, Hofbauer GF, Cerveny K, Chiorino G, Lefort K and
Dotto GP: Multifactorial ERβ and NOTCH1 control of squamous
differentiation and cancer. J Clin Invest. 124:2260–2276. 2014.
View Article : Google Scholar : PubMed/NCBI
|
|
9
|
Zhan C, Yan L, Wang L, Jiang W, Zhang Y,
Xi J, Chen L, Jin Y, Qiao Y, Shi Y and Wang Q: Identification of
reference miRNAs in human tumors by TCGA miRNA-seq data. Biochem
Biophys Res Commun. 453:375–378. 2014. View Article : Google Scholar : PubMed/NCBI
|
|
10
|
Kozomara A and Griffiths-Jones S: miRBase:
Annotating high confidence microRNAs using deep sequencing data.
Nucleic Acids Res. 42(Database issue): D68–D73. 2014. View Article : Google Scholar :
|
|
11
|
Mortazavi A, Williams BA, McCue K,
Schaeffer L and Wold B: Mapping and quantifying mammalian
transcriptomes by RNA-Seq. Nat Methods. 5:621–628. 2008. View Article : Google Scholar : PubMed/NCBI
|
|
12
|
Clarke R, Ressom HW, Wang A, Xuan J, Liu
MC, Gehan EA and Wang Y: The properties of high-dimensional data
spaces: Implications for exploring gene and protein expression
data. Nat Rev Cancer. 8:37–49. 2008. View
Article : Google Scholar :
|
|
13
|
Wright GW and Simon RM: A random variance
model for detection of differential gene expression in small
microarray experiments. Bioinformatics. 19:2448–2455. 2003.
View Article : Google Scholar : PubMed/NCBI
|
|
14
|
Ashburner M, Ball CA, Blake JA, Botstein
D, Butler H, Cherry JM, Davis AP, Dolinski K, Dwight SS, Eppig JT,
et al: Gene ontology: Tool for the unification of biology. The Gene
Ontology Consortium. Nat Genet. 25:25–29. 2000. View Article : Google Scholar : PubMed/NCBI
|
|
15
|
Harwood CR and Moszer I: From gene
regulation to gene function: Regulatory networks in Bacillus
subtilis. Comp Funct Genomics. 3:37–41. 2002. View Article : Google Scholar
|
|
16
|
Yi M, Horton JD, Cohen JC, Hobbs HH and
Stephens RM: WholePathwayScope: A comprehensive pathway-based
analysis tool for high-throughput data. BMC Bioinformatics.
7:302006. View Article : Google Scholar : PubMed/NCBI
|
|
17
|
Kanehisa M, Goto S, Kawashima S, Okuno Y
and Hattori M: The KEGG resource for deciphering the genome.
Nucleic Acids Res. 32(Database issue): D277–D280. 2004. View Article : Google Scholar :
|
|
18
|
Draghici S, Khatri P, Tarca AL, Amin K,
Done A, Voichita C, Georgescu C and Romero R: A systems biology
approach for pathway level analysis. Genome Res. 17:1537–1545.
2007. View Article : Google Scholar : PubMed/NCBI
|
|
19
|
Garcia DM, Baek D, Shin C, Bell GW,
Grimson A and Bartel DP: Weak seed-pairing stability and high
target-site abundance decrease the proficiency of lsy-6 and other
microRNAs. Nat Struct Mol Biol. 18:1139–1146. 2011. View Article : Google Scholar : PubMed/NCBI
|
|
20
|
Betel D, Koppal A, Agius P, Sander C and
Leslie C: Comprehensive modeling of microRNA targets predicts
functional non-conserved and non-canonical sites. Genome Biol.
11:R902010. View Article : Google Scholar : PubMed/NCBI
|
|
21
|
Kel AE, Gössling E, Reuter I, Cheremushkin
E, Kel-Margoulis OV and Wingender E: MATCH: A tool for searching
transcription factor binding sites in DNA sequences. Nucleic Acids
Res. 31:3576–3579. 2003. View Article : Google Scholar : PubMed/NCBI
|
|
22
|
Prieto C, Risueño A, Fontanillo C and De
Las RJ: Human gene coexpression landscape: Confident network
derived from tissue transcriptomic profiles. PLoS One. 3:e39112008.
View Article : Google Scholar : PubMed/NCBI
|
|
23
|
Quandt K, Frech K, Karas H, Wingender E
and Werner T: MatInd and MatInspector: New fast and versatile tools
for detection of consensus matches in nucleotide sequence data.
Nucleic Acids Res. 23:4878–4884. 1995. View Article : Google Scholar : PubMed/NCBI
|
|
24
|
Jung EM, Choi KC and Jeung EB: Expression
of calbindin-D28k is inversely correlated with proapototic gene
expression in hydrogen peroxide-induced cell death in endometrial
cancer cells. Int J Oncol. 38:1059–1066. 2011.PubMed/NCBI
|
|
25
|
Sano M, Aoyagi K, Takahashi H, Kawamura T,
Mabuchi T, Igaki H, Tachimori Y, Kato H, Ochiai A, Honda H, et al:
Forkhead box A1 transcriptional pathway in KRT7-expressing
esophageal squamous cell carcinomas with extensive lymph node
metastasis. Int J Oncol. 36:321–330. 2010.PubMed/NCBI
|
|
26
|
Chen YT, Panarelli NC, Piotti KC and
Yantiss RK: Cancer-testis antigen expression in digestive tract
carcinomas: Frequent expression in esophageal squamous cell
carcinoma and its precursor lesions. Cancer Immunol Res. 2:480–486.
2014. View Article : Google Scholar : PubMed/NCBI
|
|
27
|
Madissoon E, Töhönen V, Vesterlund L,
Katayama S, Unneberg P, Inzunza J, Hovatta O and Kere J:
Differences in gene expression between mouse and human for
dynamically regulated genes in early embryo. PLoS One.
9:e1029492014. View Article : Google Scholar : PubMed/NCBI
|
|
28
|
Wong PP, Yeoh CC, Ahmad AS, Chelala C,
Gillett C, Speirs V, Jones JL and Hurst HC: Identification of MAGEA
antigens as causal players in the development of
tamoxifen-resistant breast cancer. Oncogene. 33:4579–4588. 2014.
View Article : Google Scholar : PubMed/NCBI
|
|
29
|
Liu CJ, Tsai MM, Tu HF, Lui MT, Cheng HW
and Lin SC: miR-196a overexpression and miR-196a2 gene polymorphism
are prognostic predictors of oral carcinomas. Ann Surg Oncol.
20(Suppl 3): S406–S414. 2013. View Article : Google Scholar
|
|
30
|
Lu YC, Chang JT, Huang YC, Huang CC, Chen
WH, Lee LY, Huang BS, Chen YJ, Li HF and Cheng AJ: Combined
determination of circulating miR-196a and miR-196b levels produces
high sensitivity and specificity for early detection of oral
cancer. Clin Biochem. 48:115–121. 2015. View Article : Google Scholar
|
|
31
|
Saito K, Inagaki K, Kamimoto T, Ito Y,
Sugita T, Nakajo S, Hirasawa A, Iwamaru A, Ishikura T, Hanaoka H,
et al: MicroRNA-196a is a putative diagnostic biomarker and
therapeutic target for laryngeal cancer. PLoS One. 8:e714802013.
View Article : Google Scholar : PubMed/NCBI
|
|
32
|
Severino P, Bruggemann H, Andreghetto FM,
Camps C, Klingbeil Mde F, de Pereira WO, Soares RM, Moyses R,
Wünsch-Filho V, Mathor MB, et al: MicroRNA expression profile in
head and neck cancer: HOX-cluster embedded microRNA-196a and
microRNA-10b dysregulation implicated in cell proliferation. BMC
Cancer. 13:5332013. View Article : Google Scholar : PubMed/NCBI
|
|
33
|
Suh YE, Raulf N, Gäken J, Lawler K, Urbano
TG, Bullenkamp J, Gobeil S, Huot J, Odell E and Tavassoli M:
MicroRNA-196a promotes an oncogenic effect in head and neck cancer
cells by suppressing annexin A1 and enhancing radioresistance. Int
J Cancer. 137:1021–1034. 2015. View Article : Google Scholar
|
|
34
|
Ilmarinen T, Hagstrom J, Haglund C,
Auvinen E, Leivo I, Pitkäranta A and Aaltonen LM: Low expression of
nuclear Toll-like receptor 4 in laryngeal papillomas transforming
into squamous cell carcinoma. Otolaryngol Head Neck Surg.
151:785–790. 2014. View Article : Google Scholar : PubMed/NCBI
|
|
35
|
Makinen LK, Atula T, Häyry V, Jouhi L,
Datta N, Lehtonen S, Ahmed A, Mäkitie AA, Haglund C and Hagström J:
Predictive role of toll-like receptors 2, 4 and 9 in oral tongue
squamous cell carcinoma. Oral Oncol. 51:96–102. 2015. View Article : Google Scholar
|
|
36
|
Paluszczak J, Sarbak J,
Kostrzewska-Poczekaj M, Kiwerska K, Jarmuż-Szymczak M, Grenman R,
Mielcarek-Kuchta D and Baer-Dubowska W: The negative regulators of
Wnt pathway-DACH1, DKK1 and WIF1 are methylated in oral and
oropharyngeal cancer and WIF1 methylation predicts shorter
survival. Tumour Biol. 36:2855–2861. 2015. View Article : Google Scholar
|
|
37
|
Schussel JL, Kalinke LP, Sassi LM, de
Oliveira BV, Pedruzzi PA, Olandoski M, Alvares LE, Garlet GP and
Trevilatto PC: Expression and epigenetic regulation of DACT1 and
DACT2 in oral squamous cell carcinoma. Cancer Biomark. 15:11–17.
2015.
|
|
38
|
Ting CM, Wong CK, Wong RN, Lo KW, Lee AW,
Tsao GS, Lung ML and Mak NK: Role of STAT3/5 and Bcl-2/xL in
2-methoxyestradiol-induced endoreduplication of nasopharyngeal
carcinoma cells. Mol Carcinog. 51:963–972. 2012. View Article : Google Scholar
|
|
39
|
Iqbal MA, Gupta V, Gopinath P, Mazurek S
and Bamezai RN: Pyruvate kinase M2 and cancer: An updated
assessment. Febs Lett. 588:2685–2692. 2014. View Article : Google Scholar : PubMed/NCBI
|
|
40
|
Upadhyay M, Samal J, Kandpal M, Singh OV
and Vivekanandan P: The Warburg effect: Insights from the past
decade. Pharmacol Ther. 137:318–330. 2013. View Article : Google Scholar
|
|
41
|
Zhan C, Shi Y, Lu C and Wang Q: Pyruvate
kinase M2 is highly correlated with the differentiation and the
prognosis of esophageal squamous cell cancer. Dis Esophagus.
26:746–753. 2013.PubMed/NCBI
|
|
42
|
Shi WY, Liu KD, Xu SG, Zhang JT, Yu LL, Xu
KQ and Zhang TF: Gene expression analysis of lung cancer. Eur Rev
Med Pharmacol Sci. 18:217–228. 2014.PubMed/NCBI
|
|
43
|
Limame R, Op de Beek K, Lardon F, De Wever
O and Pauwels P: Krüppel-like factors in cancer progression: Three
fingers on the steering wheel. Oncotarget. 5:29–48. 2014.PubMed/NCBI
|
|
44
|
Tie X, Han S, Meng L, Wang Y and Wu A:
NFAT1 is highly expressed in, and regulates the invasion of,
glioblastoma multiforme cells. PLoS One. 8:e660082013. View Article : Google Scholar : PubMed/NCBI
|
|
45
|
Braeuer RR, Zigler M, Kamiya T, Dobroff
AS, Huang L, Choi W, McConkey DJ, Shoshan E, Mobley AK, Song R, et
al: Galectin-3 contributes to melanoma growth and metastasis via
regulation of NFAT1 and autotaxin. Cancer Res. 72:5757–5766. 2012.
View Article : Google Scholar : PubMed/NCBI
|
|
46
|
Nohata N, Sone Y, Hanazawa T, Fuse M,
Kikkawa N, Yoshino H, Chiyomaru T, Kawakami K, Enokida H, Nakagawa
M, et al: miR-1 as a tumor suppressive microRNA targeting TAGLN2 in
head and neck squamous cell carcinoma. Oncotarget. 2:29–42.
2011.PubMed/NCBI
|
|
47
|
Nohata N, Hanazawa T, Kikkawa N, Sakurai
D, Sasaki K, Chiyomaru T, Kawakami K, Yoshino H, Enokida H,
Nakagawa M, et al: Identification of novel molecular targets
regulated by tumor suppressive miR-1/miR-133a in maxillary sinus
squamous cell carcinoma. Int J Oncol. 39:1099–1107. 2011.PubMed/NCBI
|
|
48
|
Wang F, Song G, Liu M, Li X and Tang H:
miRNA-1 targets fibronectin1 and suppresses the migration and
invasion of the HEp2 laryngeal squamous carcinoma cell line. FEBS
Lett. 585:3263–3269. 2011. View Article : Google Scholar : PubMed/NCBI
|
|
49
|
Wu CD, Kuo YS, Wu HC and Lin CT:
MicroRNA-1 induces apoptosis by targeting prothymosin alpha in
nasopharyngeal carcinoma cells. J Biomed Sci. 18:802011. View Article : Google Scholar : PubMed/NCBI
|