Introduction
The inflammatory response to a variety of systemic
infections results in sepsis in susceptible individuals, wherein
the mortality rate is an alarming 30–45%. Sepsis constitutes 17% of
all admissions to the intensive care unit, of which 45% of
admissions end in fatality (1).
Severe sepsis takes more lives than cardiovascular disease, breast,
colon/rectal, head and neck, throat and prostate cancer combined,
and the incidence of sepsis is rising by 1.5–8% annually (2–4),
despite advancements in critical care support and equipment. While
very little is known about the genetic susceptibility of an
individual, the risk of sepsis increases due to various
immunosuppressive procedures.
Several novel approaches in sepsis prophylaxis and
treatment are currently in progress (4). Certain clinical trials have provided
contrasting results. For example, when patients with sepsis were
treated with two different monoclonal antibodies against
endotoxin-HA-1A, a human antibody and E5, a murine antibody, no
change in mortality was observed in patients with gram negative
bacteremia (5). Animal models have
also provided conflicting results when compared with human studies
(6). Therefore, using an animal
sepsis model may not provide conclusive evidence for human
application. Immunological response to Gram-negative bacterial
lipopolysaccharide (LPS) predominantly involves their interaction
with Toll-like receptors (TLRs) and cluster of differentiation
(CD)14 receptors present on monocytes and macrophages, which
initiates the production of pro-inflammatory mediators, including
interleukin (IL)-6, IL-8 and tumor necrosis factor (TNF)-α. LPS
also induces the production of acute phase response proteins by the
liver. Among many known sepsis markers, serum procalcitonin (PCT)
is currently the only US Food and Drug Administration approved
biomarker for the diagnosis, and as an indicator, of the
progression of sepsis, though other acute phase reactants,
including C reactive protein (CRP) and serum amyloid A (SAA)
protein, are also in use. Several biomarkers are known to be
elevated in sepsis (7), although
the exact biochemical function and etiology of their overexpression
remain unknown. Host immunological response to sepsis is nuanced,
and varies in both innate and adaptive responses, which makes
diagnosis and therapy a challenge for individuals at risk of
mortality.
The diagnosis of sepsis and evaluation of its
severity is complicated by the highly variable and non-specific
nature of the signs and symptoms of sepsis (8). Early diagnosis and prediction of the
severity of sepsis is very important, thereby increasing the
possibility of starting timely and specific treatment (9,10).
Previous studies have shown gender-based variation in the pattern
of expression of acute phase proteins and sepsis-associated
mortality (11), wherein mutually
opposing observations have been made, which make adjustments with
concurrent data while generalizing observations (12). A previous study involving elderly
patients revealed that sepsis mortality was independent of gender;
however, this was correlated with elevated 17 β-estradiol in both
genders, with elevated progesterone in males and elevated
testosterone in females (13). An
increased risk of acquiring sepsis in surgery patients with higher
TNF-α levels due to polymorphism in the NcoI region of the
TNFB gene has been reported (14,15).
However, a generalization in this regard requires study of a larger
cohort. Recent advances in understanding sepsis involve various
sepsis models to diagnose susceptibility towards sepsis, however, a
clear correlation requires a broader and deeper analysis of sepsis
response proteins. To address the issue, Kalenka et al
(16) analyzed the serum proteome
of sepsis patients and successfully identified differences between
the proteome of survivors (S) and non-survivors (NS) at the end of
28 days from the onset of sepsis (16). Similarly, Su et al (17) studied urinary proteomics of sepsis
patients during the 28 days from the onset of sepsis (17). These studies have made significant
contributions to the understanding of serum protein dynamics to
assess the differential changes associated with S and NS of sepsis.
The present study is a prospective observational longitudinal
study, where serum proteome dynamics from early until late stages
of sepsis were analyzed in S and NS, from the onset of sepsis as
indicated by PCT levels.
Since sepsis has a higher incidence in males, and
females appear to differ in responses due to hormonal variations,
the present study used adult human male samples for homogeneity.
The goal of the present study was to target differentially
expressed proteins while comparing S and NS, which may be useful,
particularly in the early stages to devise strategies to improve
chances of patient survival. The present study focused on serum
proteome profiles at different phases of sepsis in Indian adult
male patients suffering with bacterial sepsis, particularly K.
pneumoniae, to eliminate further possibility of heterogeneity
in sampling, which may assist with understanding changes in serum
acute phase proteins under given conditions, and can be later used
to monitor and devise methods of patient-specific sepsis
management.
Materials and methods
Patients and samples
Blood samples from adult male patients (n=12; S and
NS =6 each) diagnosed with sepsis were procured from Global
Hospitals (Lakdi-ka-pul Hyderabad, India; Table I). The patients were carefully
monitored up until mortality at day 20–28, and samples were
collected daily from the day of clinical diagnosis (onset) until
recovery, in the case of S, and 24 h prior to mortality in the case
of NS. Criteria for selection of male patients showing signs of
severe sepsis or septic shock (endotoxemia) were based on patient
serum PCT levels and acute physiology and chronic health evaluation
II (APACHE II) scores (Table I).
APACHE II is a severity-of-disease classification system (18), one of several ICU scoring systems.
It is applied within 24 h of the admission of a patient to an
intensive care unit: An integer score from 0 to 71 is computed
based on several measurements; higher scores correspond to more
severe disease and a higher risk of death. The APACHE II scoring
system has been widely accepted as a measure of illness severity;
it has been demonstrated to accurately stratify risk of death in a
wide range of disease states, and in different clinical settings
(19). Blood samples from healthy
males (n=6) were collected with their consent as reference
controls. Serum was isolated from blood samples of both patients
and healthy controls for further analysis. Whole blood was
collected separately from the identical male patients (S=6; NS=6)
at early stages (within 24 h of sepsis diagnosis) in EDTA-K3
containing tubes for RNA extraction and reverse
transcription-quantitative polymerase chain reaction (RT-qPCR)
analysis. Exclusion criteria for sample selection were being
<18-years-old and >75-years-old, patients who were lost at
follow-up, patients with previous medical history of
anti-inflammatory drug treatment, chemotherapy and glucocorticoid
therapy. Burns patients, subjects with liver diseases,
cardiovascular diseases and organ transplant recipients were not
enrolled. Samples from each individual patient were collected with
the informed consent of the patient or family, and the present
study was approved by the institutional ethical committee.
 | Table IClinical characteristics of sepsis
subjects. |
Table I
Clinical characteristics of sepsis
subjects.
| Characteristic | Patient details
|
|---|
| Survivor (n=6) | Non-survivor
(n=6) |
|---|
| Age | 50±2 | 71±2 |
| Gender | Male | Male |
| Median white blood
cell count/mm3 | 14,380 | 1,850 |
| Median serum
procalcitonin | 3.99±2 | 2.58±2 |
| APACHE II
(median) | 26 | 30 |
| Pathogens detected
in culture (median) | K.p | K.p |
Two dimensional electrophoresis
Serum samples for each day from the onset of sepsis
until the recovery/death of each patient (n=6) and individual
controls (n=6) were subjected to Albumin depletion, according to
the manufacturer's protocol (Aurum™ Affi-Gel® Blue mini
kits and columns; Bio-Rad Laboratories, Inc., Hercules, CA, USA).
Complete albumin depletion was confirmed by 10% sodium dodecyl
sulfate-polyacrylamide gel electrophoresis (SDS-PAGE). The
albumin-depleted elutes were subsequently diluted with ice-cold
acetone and subjected to acetone precipitation at 15,000 × g at 4°C
for 10 min. The pellets obtained were washed with 1 ml acetone and
allowed to air-dry. The pellets were subsequently resuspended in 75
μl rehydration sample buffer, containing 4 M urea, 2% CHAPS,
1 mM dithiothreitol, 0.2% Biolyte, 3/10 ampholytes (Bio-Rad
laboratories, Inc.) and traces of Bromophenol blue dye. Once the
pellets were completely dissolved in rehydration sample buffer, the
total protein content in resuspended sample was estimated using
Bradford protein assay (Sigma-Aldrich, St. Louis, MO, USA). A total
of 500 μg protein was applied to 11 cm (pH 3–10) immobilized
pH gradient (IPG) strips (Bio-Rad Laboratories, Inc.) and
isoelectric focusing was performed using a Protean IEF unit,
according to the manufacturers protocol (Bio-Rad Laboratories,
Inc.). The IPG strips were subsequently separated by 9–14% gradient
SDS-PAGE at 16 mA for the stacking gel and 24 mA for the resolving
gel. Following electrophoresis, the gels were fixed in a solution
of 50% methanol and 10% glacial acetic acid for 1 h and were
subsequently stained with colloidal Coomassie blue stain for image
analysis.
Image analysis
The gel images were analyzed using Image Master 2D
Platinum software (version 7.0; GE Healthcare Bio-Sciences,
Pittsburgh, PA, USA). Control gels of healthy subjects (n=6) were
analyzed individually and normalized to be used as the reference
gel. The daily sample for S and NS was analyzed in duplicate to
identify spots with percentage volume variation. Duplicates of each
day were combined to give a single representative gel and analyzed
again to increase the reproducibility and reduce the error rate of
analysis. The spots were compared for percentage volume
variations.
In-gel trypsin digestion
The spots of interest were excised and washed with a
1:1 ratio of 50 mM ammonium bicarbonate and acetonitrile for 15
min. Following two separate washes with ammonium bicarbonate and
acetonitrile, a final wash was performed with acetonitrile until
the gel pieces were opaque. The acetonitrile was discarded and the
gel pieces were vacuum-dried. Diluted trypsin was added to the gel
pieces and incubated for 1 h at room temperature. The excess
trypsin was removed and the pieces were incubated overnight with 25
mM ammonium bicarbonate at 37°C. The digested extract was collected
and vacuum centrifuged to concentrate the extract, which was
subsequently used for matrix-assisted laser desorption
ionization-time of flight (MALDI-TOF; Bruker Daltonics, Leipzig,
Germany) analysis.
MALDI-TOF analysis
An α-cyano-4-hydroxycinnamic acid (HCCA) matrix (5
mg/ml) was prepared in 70% acetonitrile and 30% 0.1%
trifluoroacetic acid. The trypsin-digested extract was subsequently
mixed with HCCA matrix in a 1:1 ratio and ~2 μl
matrix-sample mix was spotted onto an anchor chip and ground steel
plate (Bruker Daltonics). Once dried, the plates were loaded onto a
MALDI TOF-mass spectrometer (MS; Bruker Daltonics) at the Central
Facilities for Research and Development (Osmania University,
Hyderabad, India). Spectra were obtained in the reflectron mode
(mass range, 500–3,000 Da; 20 keV accelerating voltage; averaging
500 laser shots/spectrum) using a Bruker Autoflex III MALDI-TOF/TOF
spectrometer (Bruker Daltonics). The spectra were analyzed with
Flex Analysis software (version 3.3; Bruker Daltonics) and Biotools
software (version 3.2; Bruker Daltonics), with the following
parameters: Signal-to-noise threshold, 6; mass exclusion tolerance,
0.75 m/z; maximal number of peaks, 100; quality factor threshold,
50; monoisotopic peaks (Adduct: H). Matrix and/or auto-proteolytic
trypsin peaks, or known contaminant ions were excluded.
Bioinformatics data mining was performed using the Mascot platform
(http://www.matrixscience.com). The
resulting peptide mass lists were queried in the Swiss Port 2013_02
database (539,165 sequences; 191,456,931 residues). The following
criteria were used for search parameters: Taxonomy, Homo
sapiens (human); significant protein Molecular Weight Search
score at P<0.05, 1 missed cleavage site allowed; 1+peptide
charges allowed; trypsin as enzyme; 80–100 ppm as precursor
tolerance; carboxy-methylation of Cys as global modification and
oxidation of methionine as variable modification. The protein score
was calculated as −10×Log (P), where P is the probability that the
observed match is a random event. A protein score of ≥56 was
considered statistically significant (P<0.05). Further analysis
and function-based classification of the identified proteins were
performed using the protein centre software version 3.10 (Thermo
Fisher Scientific, Inc., Waltham, MA, USA).
Statistical analysis
Comparisons between groups (S and NS sepsis
patients) were performed using either a paired Student's t-test
and/or a Mann Whitney U test, using GraphPad Prism (version 6.05;
GraphPad Software,. Inc., San Diego, CA, USA). The expression
factors (EFs) are expressed as the mean ± standard error of the
mean. P≤0.05 was considered to indicate a statistically significant
difference.
RT-qPCR analysis
Blood samples from sepsis patients were obtained and
the total RNA was extracted using Total RNA spin columns (Yeastern
Biotech, Co., Ltd., Taipei, Taiwan) and treated with RNase-free
DNase (Macherey-Nagel, Inc., Düren, Germany). A total of ~5
μg RNA was reverse-transcribed using oligo (dT) primers and
reverse transcriptase (Thermo Fisher Scientific, Inc.). qPCR was
performed on the cDNA samples (2 μl) using Faststart
universal SYBR Green master (Roche Diagnostics, Indianapolis, IN,
USA) with 10 pmol forward and reverse primers of six protein genes
obtained employing Primer Depot (Table II). Melting temperatures were set
as per primer sets used with rest of the PCR conditions. Gene
expression was calculated using the 2−ΔΔCq method, where
β-actin gene was used as the reference housekeeping gene.
| Table IIList of primer sequences for
analyzing mRNA levels in patients with sepsis. |
Table II
List of primer sequences for
analyzing mRNA levels in patients with sepsis.
| Gene | Right primer
(5′-3′) | Left primer
(5′-3′) |
|---|
| Haptoglobin |
CATAGCCATGTGCAATCTCG |
AGAGGCAAGACCAACCAAGA |
| S100A9 |
TCAGCATGATGAACTCCTCG |
GGAATTCAAAGAGCTGGTGC |
| Transthyretin |
AGCCGTGGTGGAATAGGAG |
CTTACTGGAAGGCACTTGGC |
| Serum amyloid
A |
CCCTTTTGGCAGCATCATAG |
AGCCGAAGCTTCTTTTCGTT |
| α 1
antitrypsin |
ACGAGACAGAAGACGGCATT |
ATATTCACCAGCAGCCTCCC |
| Orosomucoid 1 |
CCTCCTCCTGTTTCCTCTCC |
AGACGACCAAGGAGCAACTG |
| Interleukin 6 |
CTGCAGCCACTGGTTCTGT |
CCAGAGCTGTGCAGATGAGT |
| Toll-like receptor
4 |
GCCTCAGGGGATTAAAGCTC |
GCCTCAGGGGATTAAAGCTC |
| Interleukin 10 |
GCCACCCTGATGTCTCAGTT |
GTGGAGCAGGTGAAGAATGC |
|
Prepronociceptin |
GAGACTGAGCAGCAGCAGGT |
TATGCTGGTGTGGCTGAGAA |
Results
Identification of differentially
expressed proteins in S and NS of sepsis
Albumin-depleted serum samples from sepsis patients
were separated by 2D gel electrophoresis and 2D gel image analysis
was performed (Fig. 1). Protein
spots representing specific proteins exhibiting an increased or
decreased percentage volume and intensity were matched to the
corresponding spot in the reference gel (control serum). The
proteins exhibiting differential volume percentage with respect to
patients with sepsis were then matched between S and NS from the
day of onset until recovery/mortality. Approximately 300 spots were
analyzed in each gel. The analysis resulted in the identification
of 30 differentially expressed spots between S and NS.
Identification of the spots by MALDI-TOF demonstrated 12 spots with
a significant MS/MS score (Table
III). Since normalized relative volumes of a spot (%) are
independent of variations due to protein loading and staining, the
average of the normalized volume percentage of each spot for n=6
patients in each group and n=6 controls were used to calculate the
EF of differentially expressed proteins. The NS:S ratio was
calculated to demonstrate the fold-change in protein expression in
NS compared with S from onset (day of diagnosis) until
recovery/mortality, and early stages of sepsis 24 h-day 3 (Table IV). Haptoglobin (Hp; spot 229,
P<0.012; α1 antitrypsin (A1AT), orosomucoid 1/α1 acid
glycoprotein (ORM1) and S100A9 (P<0.004), and serum amyloid A
(SAA) exhibited a ≥1.5 fold increase, whereas transthyretin (TTR)
(spot 237, P<0.03; and Hp (spot 401, P<0.005) exhibited a ≥1
fold decrease, from the early stages until mortality in NS
(Fig. 2).
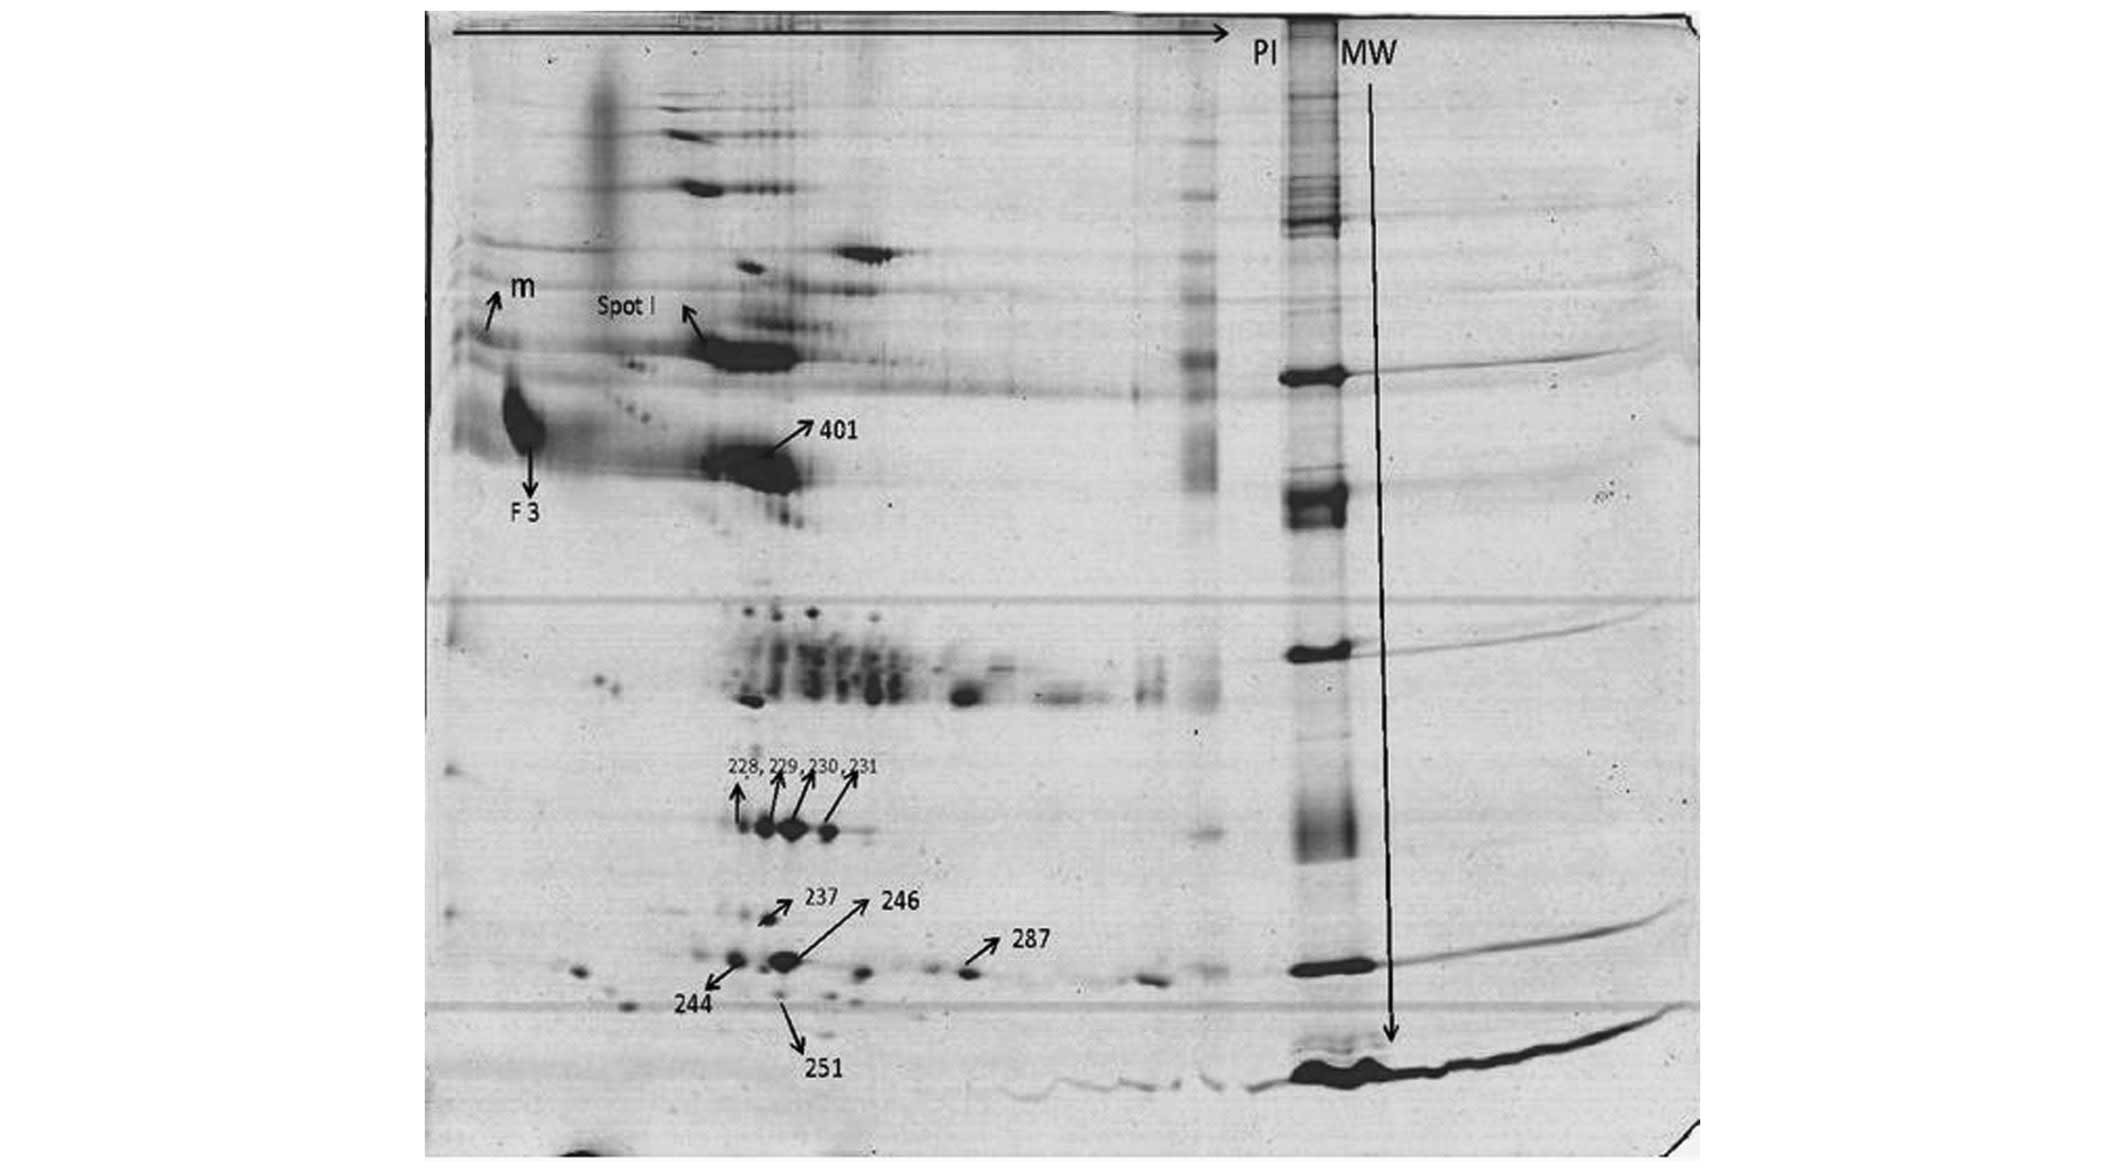 | Figure 1A representative 2D gel image of
albumin-depleted serum proteins from patients with sepsis.
Albumin-depleted serum samples from patients with sepsis were
separated by 2D electrophoresis. The proteins, resolved by
isoelectric focusing using 11 cm, 3–10 pH range immobilized pH
gradient strips, were separated by gradient sodium dodecyl
sulfate-polyacrylamide gel electrophoresis (10–14%). The gels were
stained with Coomassie Brilliant Blue (G250) and analyzed by Image
master 2D Platinum. The spots revealed to have differential spot
volumes, as highlighted in the image, in survivors compared with
the non-survivors were identified by matrix-assisted laser
desorption ionization-time of flight. Spot I, α1 antitrypsin;
401/228/229/230/231, haptoglobin; F3, α1 acid glycoprotein 1;
237/244, transthyretin; 246, S100A9; 287, hemoglobin subunit β;
251, serum amyloid A. |
| Table IIIMALDI-TOF analysis of proteins
differentially expressed in sepsis survivors and non-survivors. |
Table III
MALDI-TOF analysis of proteins
differentially expressed in sepsis survivors and non-survivors.
| Spot ID | Protein
identified | pI | Mol. Wt. (kDa) | Mascot score | Accession number
and IDa | Attributes
(half-life) |
|---|
| F3 | α1 acid
glycoprotein | 4.9 | 49 | 65 | P02763 | Acute phase
protein, elevated in inflammation (5 days) |
| 237 | Transthyretin
(prealbumin) | 5.5 | 15 | 66 | P02766,
TTHY_HUMAN | Negative acute
phase protein (12–24 h) |
| 246 | S100A9 | 5.7 | 13 | 70 | P06702,
S10A9_HUMAN | Prominent role in
the regulation of inflammatory processes and immune response (5
h) |
| 287 | Hemoglobin subunit
β | 7.6 | 14 | 59 | P68871,
HBB_HUMAN | Coagulation and
complement pathway |
| 401 | Haptoglobin | 5.8 | 45 | 63 | P00738,
HPT_HUMAN | Acute phase protein
(3.5–5 days unbound; 30 min bound) |
| 228 | Haptoglobin | 5.2 | 23 | 67 | | |
| 229 | Haptoglobin | 5.3 | 23 | 56 | | |
| 230 | Haptoglobin | 5.9 | 23 | 82 | | |
| 231 | Haptoglobin | 6.0 | 23 | 62 | | |
| Spot I | α 1
antitrypsin/SERPINA1 | 5.3 | 46 | 96 | P01009,
A1AT_HUMAN | Acute phase protein
(4.5 days) |
| M | α1 antitrypsin | 3.5 | 46 | 91 | | |
| 252 | Serum amyloid
A | 6.3 | 11 | 79 | P0DJI8
SAA1_HUMAN | Positive acute
phase protein (90 min) |
| Table IVExpression factors of differentially
expressed proteins identified in sepsis survivors and non-survivors
from onset until recovery or fatality. |
Table IV
Expression factors of differentially
expressed proteins identified in sepsis survivors and non-survivors
from onset until recovery or fatality.
| Spot ID | Protein identified
(early stages) | NS:S ratio (onset
until recovery or death) | NS:S ratio | P-value |
|---|
| 401 | Haptoglobin | 0.62 | 0.53 | 0.005a |
| 229 | Haptoglobin | 0.39 | 0.51 | 0.012b |
| I | α 1
antitrypsin/SERPINA1 | 0.92 | 1.03 | 0.87 |
| F3 | Orosomucoid 1 | 0.69 | 1.05 | 0.72 |
| 246 | S100A9 | 1.36 | 1.68 | 0.004a |
| 237 | Transthyretin | 3.96 | 2.03 | 0.03b |
| 244 | Transthyretin | 1.05 | 1.48 | 0.01b |
| 251 | Serum amyloid
A | 0.69 | 0.99 | 0.76 |
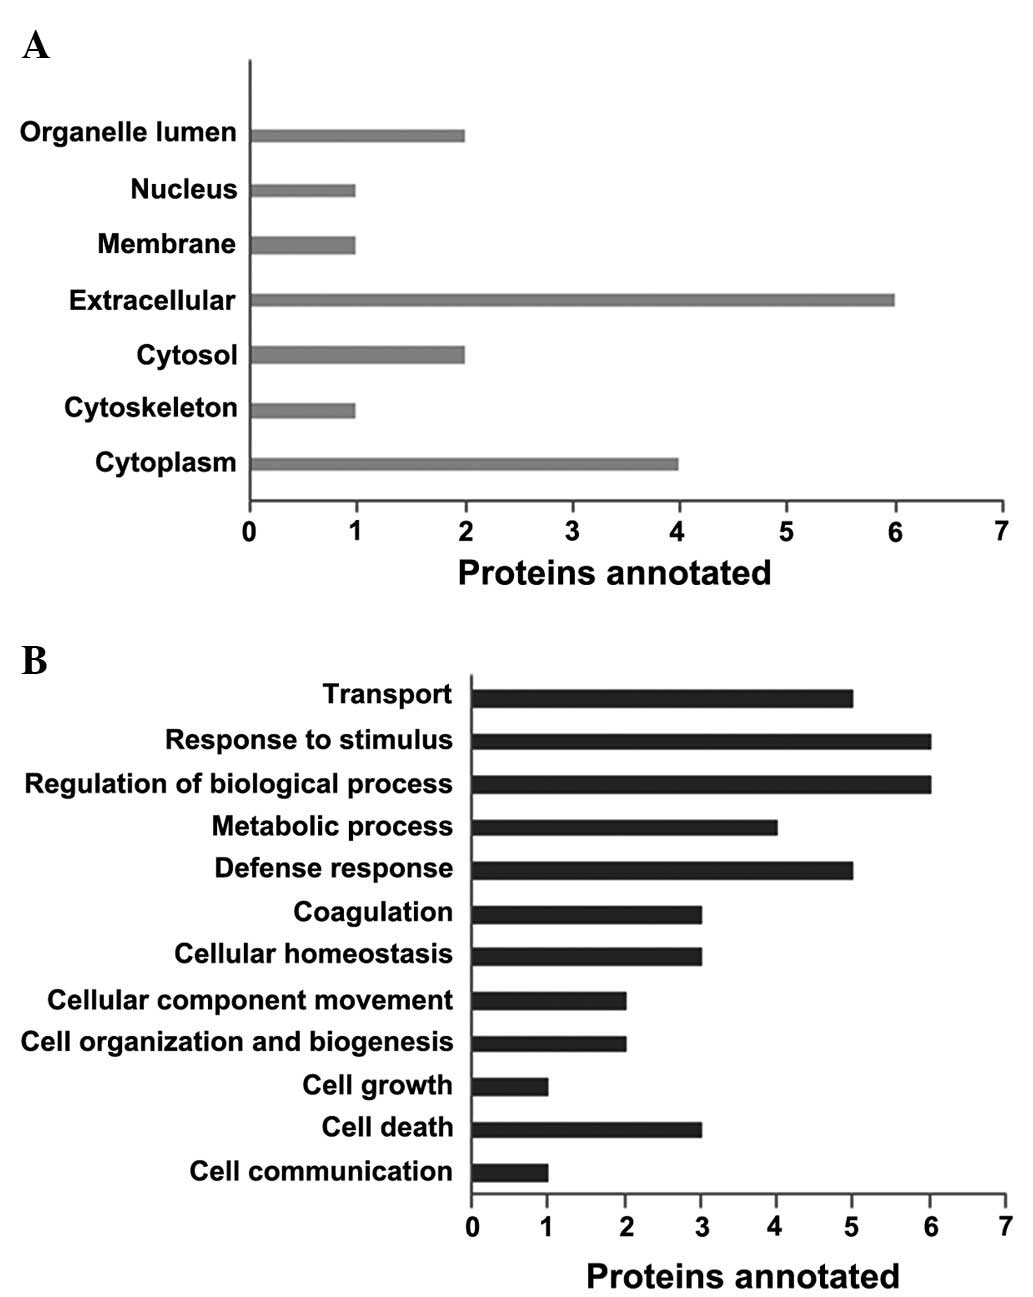
Biological function and protein network
analysis
Cellular and biological functions of the six
differentially expressed proteins were analyzed, where gene
ontology slim analysis data of differentially expressed proteins in
sepsis were obtained using mappings from the gene ontology (GO)
consortium website (http://geneontology.org), shown in (Fig. 3). These proteins were identified to
possess mostly cytoplasmic (23.5%) and extracellular functions
(35.2%). Their biological functions predominantly involved the
regulation of biological processes (14.6%), response to stimulus
(14.6%), defence response (12.1%) and transport (12.1%). The
present study sought to identify any possible network interactions
between identified proteins using GeneMANIA 3.1.2.6 software
(http://www.genemania.org) at the genomic and
proteomic level, where GO based weighting was applied to detect
maximum connectivity between the input genes, based on their
biological process, molecular function and cellular component-based
function. All six proteins, S100A9, SAA, Hp, TTR, SERPINA1, and
ORM, were shown to be interacting closely in a protein interaction
network, indicating co-expression of 91.34% and co-localization of
8.66%, where expression was calculated as the Pearson correlation
coefficient (Fig. 4).
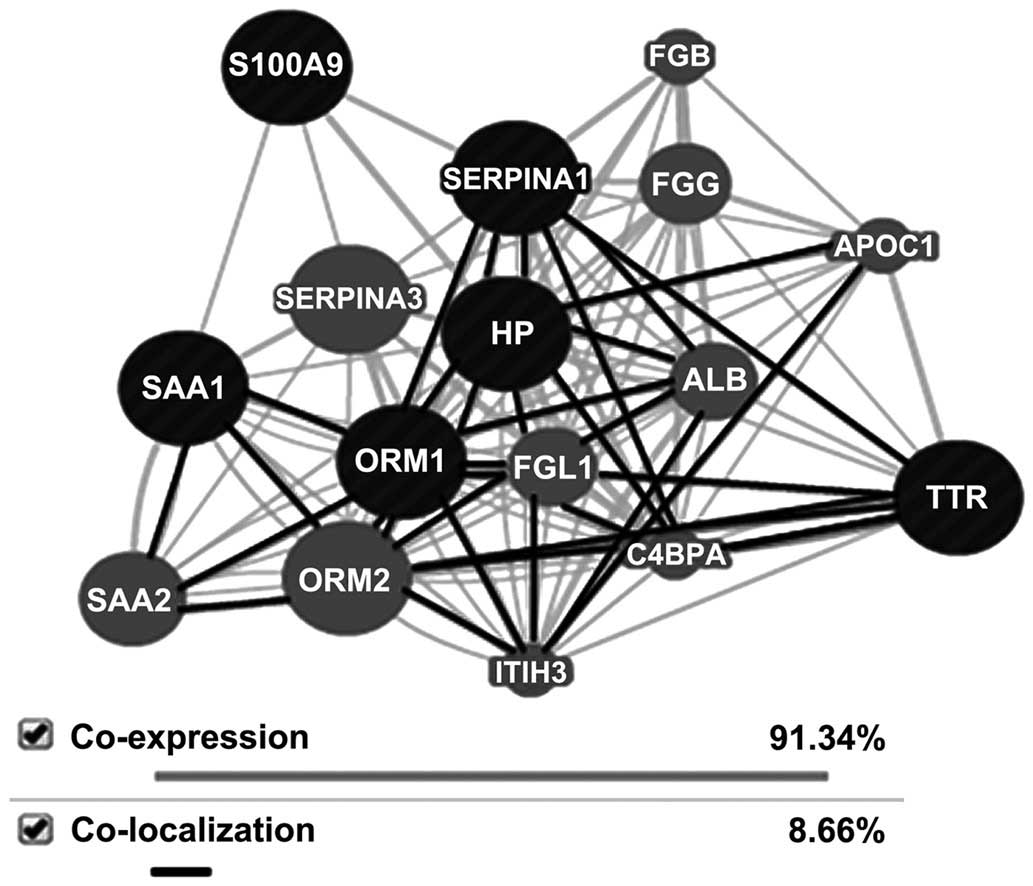 | Figure 4Network interaction between
identified proteins as analyzed by GeneMANIA 3.1.2.6 software. Any
possible network interaction between the differentially expressed
proteins, serum amyloid A, transthyretin, haptoglobin, α-1 acid
glycoprotein, α-1 antitrypsin and S100A9, in sepsis at the genomic
and proteomic level was assessed. Grey = co-expression; dark =
co-localization. AIAT, α 1 antitrypsin; ALB, albumin; APOC1,
apolipoprotein C1; C4BPA, complement component 4 binding protein;
FGB, fibrinogen β chain; FGG, fibrinogen γ chain; FGL1,
fibrinogen-like 1; HP, haptoglobin; ITIH3, inter-α (glubulin)
inhibitor H3; ORM, orosomucoid 1; SAA, serum amyloid A; SERPINA, α1
acid glycoprotein; TTR, transthyretin. |
Analysis of mRNA expression levels
RT-qPCR analysis of the mRNA isolated from whole
blood of six patients revealed a ≥2 fold increase in mRNA
expression levels (NS:S fold change) of acute phase proteins,
S100A9 (2.13), TTR (2.86), SAA (1.84), A1AT (1.4), ORM1 (1.68;
P≤0.05) and inflammatory markers, interleukin (IL)-6 (2.5), IL-10
(1.70), prepronociceptin (PPN; 1.6; all P≤0.0001 during early
stages). By contrast, Hp (0.59) and Toll-like receptor 4 TLR4
(0.30) exhibited decreased levels during early stages in NS
(Figs. 5 and 6). Hp (protein, 0.59; mRNA, 0.62; P≤0.05)
and TTR (protein, 3.9; mRNA, 2.86; P≤0.05) showed a correlation
between protein and mRNA expression levels during the early stages,
whereas the other genes exhibited no significant correlation.
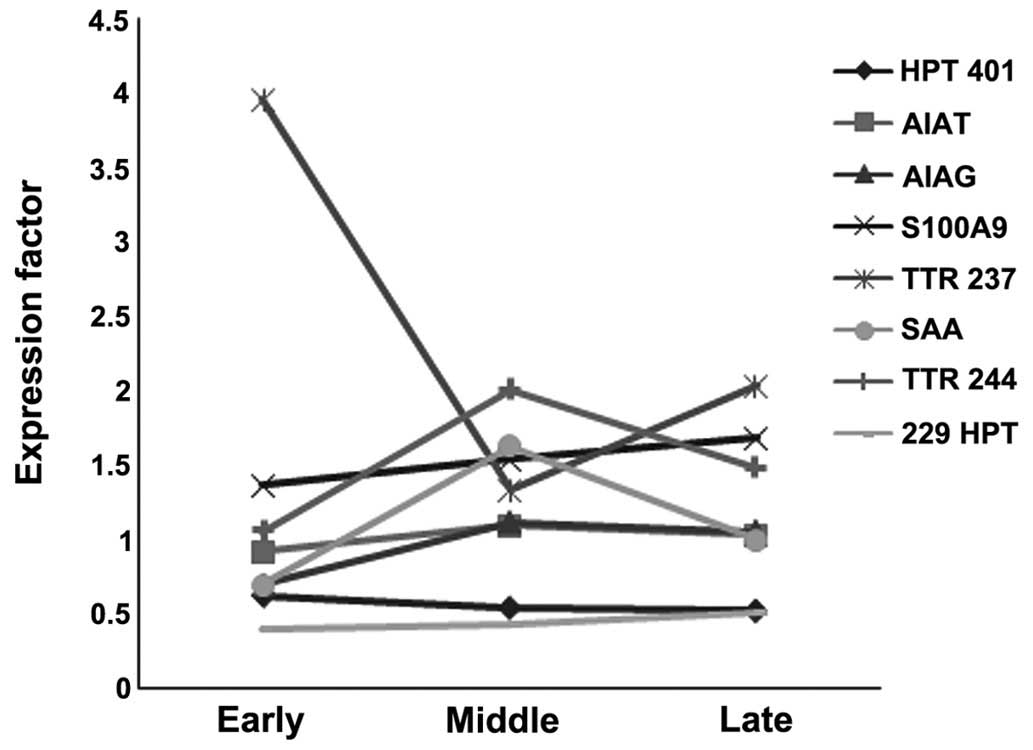
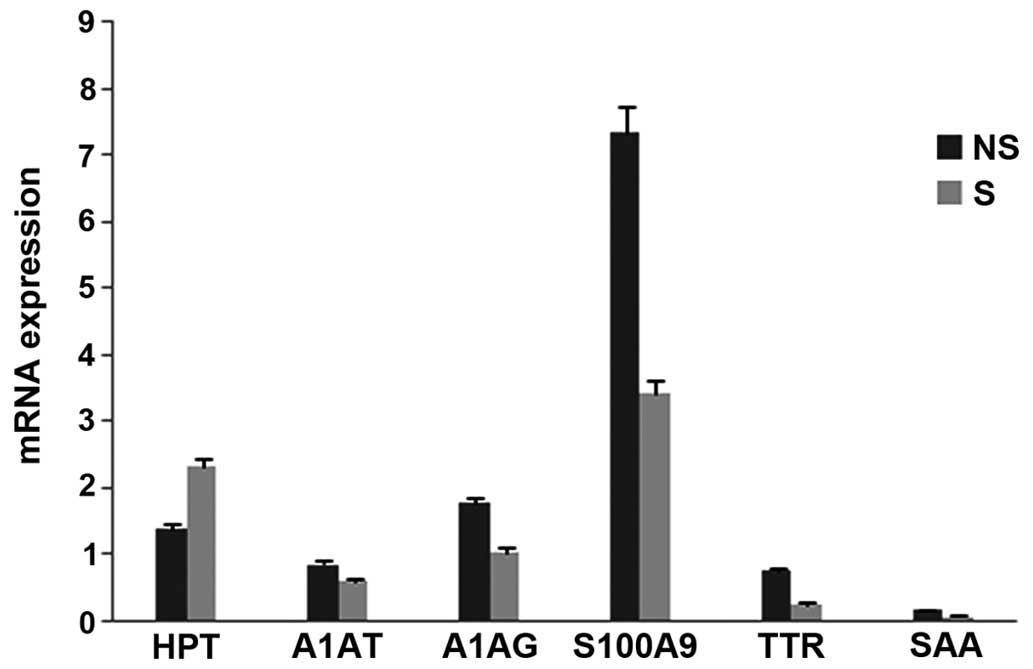 | Figure 5Graph representing changes in whole
blood mRNA levels of acute phase proteins in early stages of sepsis
in NS and S. Whole blood mRNA expression levels for six
differentially expressed proteins were determined in the blood
samples of S and NS by reverse transcription-quantitative
polymerase chain reaction. The data are represented as mean of the
2−ΔΔCq values and the mRNA levels are expressed as the
NS:S ratio (fold change) of acute phase proteins, S100A9 (2.13),
TTR (2.86), SAA (1.84), A1AT (1.4), ORM1 (1.68). (P≤0.05, vs.
control blood from a healthy donor). NS, non-survivors; S,
survivors; HPT, haptoglobin; AIAT, α 1 antitrypsin; AIAG, α1 acid
glycoprotein; TTR, transthyretin, SAA, serum amyloid A. |
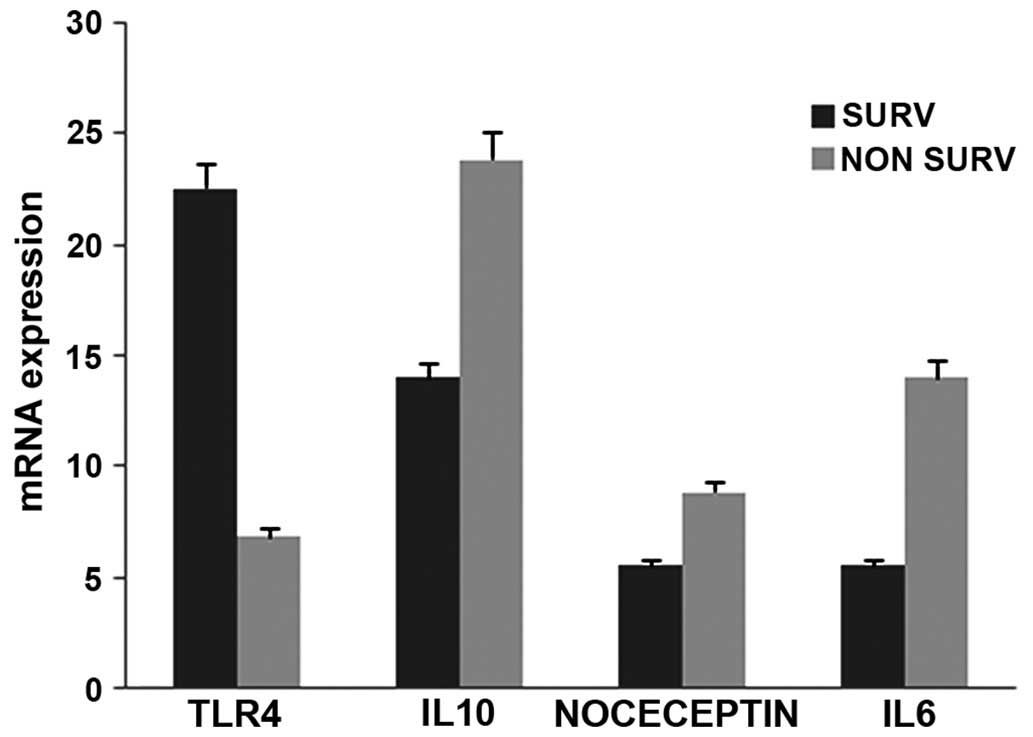 | Figure 6Graph representing changes in whole
blood mRNA levels of inflammatory markers in early stages of sepsis
in NS and S. Whole blood mRNA expression levels for six
differentially expressed proteins were measured in the blood
samples of S and NS by reverse transcription-quantitative
polymerase chain reaction. The data are represented as mean of the
2−ΔΔCq values and the mRNA levels are expressed as the
NS:S ratio (fold change) of the inflammatory markers, TLR4 (0.30),
IL-6 (2.5), IL-10 (1.70), NOCECEPTIN (1.6). P<0.0001, vs.
control blood from healthy donor. S (SURV), survivor; NS (Non
Surv), non-survivor; TLR4, Toll-like receptor 4; HPT, haptoglobin;
AIAT, α 1 antitrypsin; AIAG, α1 acid glycoprotein; TTR,
transthyretin, SAA, serum amyloid A; NOCICEPTIN,
prepronociceptin. |
Discussion
An emphasis on the identification of differentially
expressed proteins during the early stages of sepsis is useful in
identification of marker(s) for predicting potential NS. The ratio
of male patients admitted with bacterial sepsis dominated female
patients during the present study; hence, the present study was
focused on an assessment of the serum protein profiles of male
patients with severe bacterial sepsis. Currently, CRP and PCT are
the only approved biomarkers used to monitor the progression of
sepsis. PCT has a better profile as an early diagnostic marker for
detection of bacteremia. Effectiveness of PCT in differentiating
between Gram-positive and Gram-negative sepsis remains unclear
(20–23). Previous studies suggested that,
although PCT values showed a significant difference between S and
NS (24), only APACHE II and male
gender were shown to be independent predictors of mortality due to
sepsis (25). Also, in the present
study, it was observed that the PCT values revealed almost no
variation in S and NS, even in the early stages (Table I). The main objective of the
present study was to identify an early marker to diagnose
susceptibility of a sepsis patient to mortality.
To pursue this objective, the present study first
separated daily serum samples from sepsis patients by
two-dimensional gel electrophoresis and compared protein profiles
of S and NS. A total of 12 differentially expressed proteins were
identified from the sera of sepsis patients taken from the onset
until recovery/death, where Hp was observed in 5/12 spots, A1AT in
3/12 spots and TTR in 2/12 spots. The six differentially expressed
proteins identified in the present study were grouped based on
their family and function, as follows: i) α1 globulins, including
A1AT, ORM1, SAA; ii) α2 globulins, including pre-albumin, TTR, Hp;
iii) Danger-associated molecular
patterns/Alarmins-Calgranulin/S100A9.
The majority of the differentially expressed
proteins identified in the present study are components of
inflammatory processes and the immune response, as demonstrated in
protein centre analysis data utilizing the GO database (http://www.geneontology.org) and Kyoto encyclopedia of
Genes and Genomes pathway (http://www.genome.jp/kegg/pathway.html). All the six
proteins are known to be involved in the host defence response and
regulation of inflammatory processes (Fig. 3) (26,27).
Further analysis using the GeneMANIA 3.1.2.6 software database
(http://www.genemania.org) revealed close
interactions between S100A9, SAA, Hp, TTR, SERPINA1 and ORM1 at the
genomic and proteomic level (Fig.
4). Delayed increase of proteins, including S100A9, SERPINA1,
TTR, SAA and Hp, during the early stages of sepsis in NS indicated
their potential role in sepsis survival (Fig. 2). Drug metabolism and drug delivery
are critical in sepsis treatment. The present study demonstrated
that decreased expression of drug binding proteins, including
α1-acid glycoprotein, is correlated with the severity of
sepsis.
Acute phase response leads to an increase in serum
globular proteins, which are grouped into α1 globulins, α2
globulins, β-globulins secreted by the liver, and γ globulins. The
pattern of expression of α1 and α2 globulins in the present study
indicated their possible role in the early stages of sepsis in male
patients (Fig. 2). SAA is a
precursor for amyloid A, generally shown to have an
immunomodulatory effect and to be important for binding to
Gram-negative bacteria, thereby facilitating their uptake by
macrophages and neutrophils (28,29).
In the present study, low SAA levels were observed in more NS
during early sepsis compared with S. The general trend was observed
as a rise during the middle stages and gradual decrease towards
recovery or death in sepsis. Similar results have been reported
previously, where SAA levels rise within 24 h following infection
and then tend to decrease slowly (30). However, the present study observed
that SAA levels remained slightly higher in NS, even during the
late stages of sepsis, when compared with S. Although certain
studies suggest that SAA is a more sensitive marker for
inflammatory disease (31),
further investigations on its role in larger cohort-based studies
would provide more insights in understanding the role of SAA as a
potential marker in evaluating the severity of sepsis.
A1AT has anti-proteolytic activity and is known to
inhibit particular serine proteases, which increase during
inflammation. This protein serves a prominent role in the
complement and coagulation pathways. The present study observed an
overall rise in A1AT in NS compared with S from the onset until the
recovery/mortality. NS exhibited a two-fold reduction in the
expression of A1AT levels during the early days of sepsis compared
with S. Elevated A1AT values are observed predominantly due to an
acute-phase reaction to infection and inflammation, suggesting that
increased protein degradation in NS leads to lower levels compared
with S.
α1 acid glycoprotein, identified originally as
orosomucoid (ORM), is a mucoprotein present in human plasma
belonging to the immunoglobin superfamily (32,33).
Elevated levels of ORM1 are a characteristic feature of
inflammatory responses (34,35).
The expression levels of ORM1 are known to be lower in sepsis
patients who are unable to recover (36). The present study observed
comparatively elevated ORM1 levels in S during early stages,
followed by a fall in levels during recovery, unlike NS, where the
levels gradually increased towards late stages of sepsis, mostly
being stable (prior to mortality). ORM1 may be superior to CRP in
terms of investigating the progress of sepsis, since increase in
plasma ORM1 levels are associated with an increased mortality rate
(36). Comparatively, an increase
in ORM1 levels, a basic drug binding protein, in S indicates that
drug delivery may play a critical role in sepsis survival during
the early stages.
Hp is an acute phase protein exhibiting an α2
glucoprotein structure. Plasma Hp levels are used in the diagnosis
of hemolytic events in addition to acute and chronic infections.
Although the majority of the previous reports have shown higher
levels of serum Hp in neonatal sepsis, due to its low specificity
and sensitivity, its application in clinical diagnosis remains
under investigation (37). It was
revealed that serum Hp levels are elevated in sepsis S during the
early stages of sepsis compared with NS.
TTR, also known as pre-albumin, is a
thyroxine-binding protein, which also aids in the transport of
vitamin A by forming a complex with retinol-binding protein
(38). The present study observed
elevated levels of TTR in NS during the early stages, followed by
its gradual decrease towards mortality. In the present study, TTR
levels remained higher from the middle until the end stages of
sepsis in S in contrast with NS, where the levels decreased from
the middle until the end stages, indicating that elevated levels of
TTR may be considered relevant in monitoring sepsis survival.
The pattern recognition receptors of the innate
immune response, which recognize endogenous mediators, are released
in response to injury, warning the host and are termed 'Alarmins'
or danger-associated molecular patterns. S100A9 or myeloid-related
protein 14, is an example of an alarmin which amplifies the
pro-inflammatory response through TLR4. S100A9 was observed to
increase during the early stages of sepsis and remained unchanged
during the middle to recovery stages in S, whereas NS exhibited
increased levels towards septic shock (39). Although the biological functions of
these proteins are not completely understood, they appear to depend
on interactions with receptor for advanced glycation end products
and TLR4. An increase in S100A9-like alarmins in serum act as
indicator of sepsis, and its delayed increase in NS may represent
the severity of sepsis.
Gene expression profiling to identify any possible
significant correlation between the mRNA and protein expression
levels of the six differentially expressed proteins was performed
using qPCR, where Hp and TTR exhibited a correlation between
protein and mRNA levels in the sepsis patients, while the other
four proteins showed no significant correlation. The comparison
signifies limited correlation between mRNA and protein expression
levels, which may be attributed to the varied half-lives of
proteins, the post-translational modifications involved in turning
mRNA into proteins (40,41) and, finally, differing experimental
conditions. All this may limit the correlation between mRNA and
protein expression levels. Several previous studies have
demonstrated that little or no correlation is established between
mRNA and protein levels (42,43).
Protein synthesis, degradation and also protein turnover may vary
significantly, depending on a number of different conditions
(44). Significant heterogeneity
is present, even within similarly functioning proteins (45). For example, the Hp genotype exists
in isoforms Hp1-1, Hp 2-1 and Hp 2-2, and their prevalence is
observed to vary according to geographic distribution;
additionally, Hp1-1, containing more αβ chains, was shown to bind
more hemoglobin compared with the other two types (46).
Proinflammatory cytokines, IL1-β, IL6 and TNF, and
anti-inflammatory cytokines, IL10, IL-1 receptor antagonists and
soluble TNF receptors, serve an important role in mediating sepsis.
IL-6 is a cytokine that is released by macrophages, endothelial
cells or fibroblasts, and appears to be the most efficient
stimulator of the production by the liver of the acute phase
proteins in response to IL-1 and/or TNF α. IL10 was reported to be
high in NS and a high IL-10:TNF-α ratio was associated with
mortality, indicating that the anti-inflammatory cytokine, IL-10,
is a predictor for severity and fatal outcome (47,48).
Increased IL-10 levels are also known to be associated with a
positive outcome in sepsis, and also as a good marker to study the
severity of sepsis, as suggested by studies based on murine models.
By contrast, IL-10 knockout mice revealed no difference in the
survival rate. In the present study, increased IL-10 and IL-6
expression was observed in NS of sepsis. This revealed no effect on
the outcome of the patient.
Nociceptin/orphanin FQ (N/OFQ) is a 17-amino-acid
opioid-associated peptide, which is produced from proteolytic
cleavage of PPN/orphanin FQ (PPN/OFQ). Activation of nociceptin-NOP
signaling is known to induce production of inflammatory mediators,
which leads to altered expression of cytokines. Human peripheral
blood mononuclear cells and polymorphonuclear leukocytes express
mRNA transcripts encoding both PPN/OFQ and the NOP (nociceptin
receptor). LPS binds its receptors CD14, TLR4 and myeloid
differentiation protein-2 on immune cells, and is known to rapidly
induce the mRNA expression of PPN/OFQ (49–51),
which is observed to be reversed on inhibiting TLR4. To determine
the relevance of TLR4 and PPN/OFQ in bacterial sepsis, in the
present study their mRNA expression levels in patient blood samples
were screened for in early sepsis. Compared with S, the expression
levels of TLR4 were four-fold lower in NS samples, whereas PPN/OFQ
levels were 0.38-fold higher in NS, possibly indicating increased
conversion of the precursor into N/OFQ. This observation confirms
previous findings, where Williams et al (52) identified higher nociceptin levels
in critically ill patients who underwent gastrointestinal
surgery.
Since Asians respond differently to most diseases
when compared with other races, a definite understanding of
immunological status and pathogenesis of sepsis in these
populations is indispensable. The present study provided a brief
insight into possible differential expression and correlation among
the proteins involved in sepsis in terms of survivability. It is
important to have a laboratory method which is rapid, specific and
sensitive enough to predict sepsis mortality at an early stage. A
biomarker-based algorithm (53)
would become predictive if a population-specific genetic marker,
which predisposes the patients to sepsis, is identified.
Acknowledgments
The present study was supported by an OU-DST-PURSE
programme grant [Project Sanction No. A-12 (category 2A)]. The
authors would like to thank Global Hospitals (Hyderabad, India) for
their support in the project. The authors would also like to thank
Professor Surya S Singh (Osmania University, Hyderabad, India), for
providing the logistic support for the study. University Grants
Commission (New Delhi, India), provided a fellowship to Ms. Swathi
Raju. M. Mr. Karthik Rajkumar has a project fellowship under the
OU-DST-PURSE programme. Finally, the authors would like to thank Dr
Manjula Bhanoori (Department of Biochemistry, Osmania University,
Hyderabad, India) for her valuable suggestions during manuscript
preparation.
Abbreviations:
|
APR
|
acute phase response
|
|
A1AT
|
α 1 antitrypsin
|
|
CRP
|
C reactive protein
|
|
CNTF
|
ciliary neurotrophic factor
|
|
DAMPs
|
damage associated molecular
patterns
|
|
GO
|
gene ontology
|
|
Hp
|
haptoglobin
|
|
HBB
|
hemoglobin β subunit
|
|
IL
|
interleukin
|
|
LPS
|
lipolysaccharide
|
|
MAP
|
kinase-mitogen activated protein
kinase
|
|
NS
|
non-survivor
|
|
ORM 1
|
orosomucoid 1
|
|
PAMPs
|
pathogen associated molecular
patterns
|
|
PCT
|
procalcitonin
|
|
S
|
survivor
|
|
SAA
|
serum amyloid A
|
|
SOFA
|
sequential organ failure assessment
score
|
|
TLRs
|
Toll-like receptors
|
|
TNF
|
tumour necrosis factor
|
|
TTR
|
transthyretin
|
References
|
1
|
Todi S: Sepsis: New horizons. Ind J Crit
Care Med. 14:1–2. 2010. View Article : Google Scholar
|
|
2
|
Angus DC, Linde-Zwirble WT, Lidicker J,
Clermont G, Carcillo J and Pinsky MR: Epidemiology of severe sepsis
in the United States: Analysis of incidence, outcome and associated
costs of care. Crit Care Med. 29:1303–1310. 2001. View Article : Google Scholar : PubMed/NCBI
|
|
3
|
Martin GS, Mannino DM, Eaton S and Moss M:
The epidemiology of sepsis in the United States from 1979 through
2000. New Eng J Med. 348:1546–1554. 2003. View Article : Google Scholar : PubMed/NCBI
|
|
4
|
Carvalho PR and Trotta Ede A: Advances in
sepsis diagnosis and treatment. J Pediatr (Rio J). 79(Suppl 2):
S195–S204. 2003. View Article : Google Scholar
|
|
5
|
Marra MN, Thornton MB, Snable JL, Wilde CG
and Scott RW: Endotoxin-binding and -neutralizing properties of
recombinant bactericidal/permeability-increasing protein and
monoclonal antibodies HA-1A and E5. Crit Care Med. 22:559–565.
1994. View Article : Google Scholar : PubMed/NCBI
|
|
6
|
Cohen J: Adjunctive therapy in sepsis: A
critical analysis of the clinical trial programme. Brit Med Bull.
55:212–225. 1999. View Article : Google Scholar
|
|
7
|
Riedemann NC, Guo RF and Ward PA: The
enigma of sepsis. J Clin Invest. 112:460–467. 2003. View Article : Google Scholar : PubMed/NCBI
|
|
8
|
Bone RC, Fisher CJ Jr, Clemmer TP, Slotman
GJ, Metz CA and Balk RA: Sepsis syndrome: A valid clinical entity.
Methylprednisolone severe sepsis study group. Crit Care Med.
17:389–393. 1989. View Article : Google Scholar : PubMed/NCBI
|
|
9
|
Kumar A, Roberts D, Wood KE, Light B,
Parrillo JE, Sharma S, Suppes R, Feinstein D, Zanotti S, Taiberg L,
et al: Duration of hypotension before initiation of effective
antimicrobial therapy is the critical determinant of survival in
human septic shock. Crit Care Med. 34:1589–1596. 2006. View Article : Google Scholar : PubMed/NCBI
|
|
10
|
Zambon M, Ceola M, Almeida-de-Castro R,
Gullo A and Vincent JL: Implementation of the surviving sepsis
campaign guidelines for severe sepsis and septic shock: We could go
faster. J Crit Care. 23:455–460. 2008. View Article : Google Scholar : PubMed/NCBI
|
|
11
|
Schröder J, Kahlke V, Staubach KH, Zabel P
and Stüber F: Gender differences in human sepsis. Arch Surg.
133:1200–1205. 1998. View Article : Google Scholar : PubMed/NCBI
|
|
12
|
Pietropaoli AP, Glance LG, Oakes D and
Fisher SG: Gender differences in mortality in patients with severe
sepsis and septic shock. Gender Med. 7:422–437. 2010. View Article : Google Scholar
|
|
13
|
Angstwurm MW, Gaertner R and Schopohl J:
Outcome in elderly patients with severe infection is influenced by
sex hormones but not gender. Crit Care Med. 33:2786–2793. 2005.
View Article : Google Scholar : PubMed/NCBI
|
|
14
|
Schröder J, Kahlke V, Book M and Stüber F:
Gender differences in sepsis: Genetically determined? Shock.
14:307–310; discussion 310–313. 2000. View Article : Google Scholar : PubMed/NCBI
|
|
15
|
Baghel K, Srivastava RN, Chandra A, Raj S,
Goel SK, Pant AB and Agrawal J: Tumor necrosis factor-β Nco1
polymorphism and susceptibility to sepsis following major elective
surgery. Surg Infect (Larchmt). 15:213–20. 2014. View Article : Google Scholar
|
|
16
|
Kalenka A, Feldmann RE Jr, Otero K, Maurer
MH, Waschke KF and Fiedler F: Changes in the serum proteome of
patients with sepsis and septic shock. Anesth Analg. 103:1522–1526.
2006. View Article : Google Scholar : PubMed/NCBI
|
|
17
|
Su L, Cao L, Zhou R, Jiang Z, Xiao K, Kong
W, Wang H, Deng J, Wen B, Tan F, et al: Identification of novel
biomarkers for sepsis prognosis via urinary proteomic analysis
using iTRAQ labeling and 2D-LC-MS/MS. PloS One. 8:e542372013.
View Article : Google Scholar : PubMed/NCBI
|
|
18
|
Knaus WA, Draper EA, Wagner DP and
Zimmerman JE: APACHE II: A severity of disease classification
system. Crit Care Med. 13:818–829. 1985. View Article : Google Scholar : PubMed/NCBI
|
|
19
|
Markgraf R, Deutschinoff G, Pientka L and
Scholten T: Comparison of acute physiology and chronic health
evaluations II and III and simplified acute physiology score II: A
prospective cohort study evaluating these methods to predict
outcome in a German interdisciplinary intensive care unit. Crit
Care Med. 28:26–33. 2000. View Article : Google Scholar : PubMed/NCBI
|
|
20
|
Wiersinga WJ, Leopold SJ, Cranendonk DR
and van der Poll T: Host innate immune responses to sepsis.
Virulence. 5:36–44. 2014. View Article : Google Scholar :
|
|
21
|
Becker KL, Snider R and Nylen ES:
Procalcitonin assay in systemic inflammation, infection and sepsis:
Clinical utility and limitations. Crit Care Med. 36:941–452. 2008.
View Article : Google Scholar : PubMed/NCBI
|
|
22
|
Sakr Y, Sponholz C, Tuche F, Brunkhorst F
and Reinhart K: The role of procalcitonin in febrile neutropenic
patients: Review of the literature. Infection. 36:396–407. 2008.
View Article : Google Scholar : PubMed/NCBI
|
|
23
|
Kim KE and Han JY: Evaluation of the
clinical performance of an automated procalcitonin assay for the
quantitative detection of bloodstream infection. Korean J Lab Med.
30:153–159. 2010. View Article : Google Scholar : PubMed/NCBI
|
|
24
|
Pettilü V, Hynninen M, Takkunen O, Kuusela
P and Valtonen M: Predictive value of procalcitonin and interleukin
6 in critically ill patients with suspected sepsis. Intensive Care
Med. 28:1220–1225. 2002. View Article : Google Scholar
|
|
25
|
Ruiz-Alvarez MJ, Garcia-Valdecasas S, De
Pablo R, Sanchez Garcia M, Coca C, Groeneveld TW, Roos A, Daha MR
and Arribas I: Diagnostic efficacy and prognostic value of serum
procalcitonin concentration in patients with suspected sepsis. J
Intens Care Med. 24:63–71. 2009. View Article : Google Scholar
|
|
26
|
Fischer CL, Gill C, Forrester MG and
Nakamura R: Quantitation of 'acute-phase proteins' postoperatively.
Value in detection and monitoring of complications. Am J Clin
Pathol. 66:840–846. 1976. View Article : Google Scholar : PubMed/NCBI
|
|
27
|
Gruys E, Toussaint MJ, Niewold TA and
Koopmans SJ: Acute phase reaction and acute phase proteins. J
Zhejiang Univ Sci B. 6:1045–1556. 2005. View Article : Google Scholar : PubMed/NCBI
|
|
28
|
Hari-Dass R, Shah C, Meyer DJ and Raynes
JG: Serum amyloid A protein binds to outer membrane protein A of
gram-negative bacteria. J Biol Chem. 280:18562–18567. 2005.
View Article : Google Scholar : PubMed/NCBI
|
|
29
|
Larson MA, Weber A, Weber AT and McDonald
TL: Differential expression and secretion of bovine serum amyloid
A3 (SAA3) by mammary epithelial cells stimulated with prolactin or
lipopolysaccharide. Vet Immunol Immunop. 107:255–264. 2005.
View Article : Google Scholar
|
|
30
|
Cicarelli LM, Perroni AG, Zugaib M, de
Albuquerque PB and Campa A: Maternal and cord blood levels of serum
amyloid A, C-reactive protein, tumor necrosis factor-alpha,
interleukin-1beta and interleukin-8 during and after delivery.
Mediat Inflamm. 2005:96–100. 2005. View Article : Google Scholar
|
|
31
|
Gabay C and Kushner I: Acute-phase
proteins and other systemic responses to inflammation. N Eng J Med.
340:448–454. 1999. View Article : Google Scholar
|
|
32
|
Weimer HE and Winzler RJ: Comparative
study of orosomucoid preparations from sera of six species of
mammals. Proc Soc Exp Biol Med. 90:458–60. 1955. View Article : Google Scholar : PubMed/NCBI
|
|
33
|
Whicher JT: BCR/IFCC reference material
for plasma proteins (CRM 470). Community bureau of reference.
International Federation of Clinical Chemistry. Clin Biochem.
31:459–465. 1998. View Article : Google Scholar : PubMed/NCBI
|
|
34
|
Dinarello CA: Cytokines as mediators in
the pathogenesis of septic shock. Curr Top Microbiol Immunol.
216:133–165. 1996.PubMed/NCBI
|
|
35
|
Henry OF, Blacher J, Verdavaine J,
Duviquet M and Safar ME: Alpha 1-acid glycoprotein is an
independent predictor of in-hospital death in the elderly. Age
Ageing. 32:37–42. 2003. View Article : Google Scholar : PubMed/NCBI
|
|
36
|
Barroso-Sousa R, Lobo RR, Mendonça PR,
Memória RR, Spiller F, Cunha FQ and Pazin-Filho A: Decreased levels
of alpha-1-acid glycoprotein are related to the mortality of septic
patients in the emergency department. Clinics (Sao Paulo).
68:1134–1139. 2013. View Article : Google Scholar
|
|
37
|
Langlois MR and Delanghe JR: Biological
and clinical significance of haptoglobin polymorphism in humans.
Clin Chem. 42:1589–600. 1996.PubMed/NCBI
|
|
38
|
Cynober L, Prugnaud O, Lioret N, Duchemin
C, Saizy R and Giboudeau J: Serum transthyretin levels in patients
with burn injury. Surgery. 109:640–644. 1991.PubMed/NCBI
|
|
39
|
Payen D, Lukaszewicz AC, Belikova I,
Faivre V, Gelin C, Russwurm S, Launay JM and Sevenet N: Gene
profiling in human blood leucocytes during recovery from septic
shock. Intens Care Med. 34:1371–1376. 2008. View Article : Google Scholar
|
|
40
|
Szallasi Z: Genetic network analysis in
light of massively parallel biological data acquisition. Pac Symp
Biocomput. 5–16. 1999.PubMed/NCBI
|
|
41
|
Cho RJ, Campbell MJ, Winzeler EA,
Steinmetz L, Conway A, Wodicka L, Wolfsberg TG, Gabrielian AE,
Landsman D, Lockhart DJ and Davis RW: A genome-wide transcriptional
analysis of the mitotic cell cycle. Mol Cell. 2:65–73. 1998.
View Article : Google Scholar : PubMed/NCBI
|
|
42
|
Lichtinghagen R, Musholt PB, Lein M, Römer
A, Rudolph B, Kristiansen G, Hauptmann S, Schnorr D, Loening SA and
Jung K: Different mRNA and protein expression of matrix
metalloproteinases 2 and 9 and tissue inhibitor of
metalloproteinases 1 in benign and malignant prostate tissue. Eur
Urol. 42:398–406. 2002. View Article : Google Scholar : PubMed/NCBI
|
|
43
|
Chen G, Gharib TG, Huang CC, Taylor JM,
Misek DE, Kardia SL, Giordano TJ, Iannettoni MD, Orringer MB,
Hanash SM and Beer DG: Discordant protein and mRNA expression in
lung adenocarcinomas. Mol Cell Proteomics. 1:304–313. 2002.
View Article : Google Scholar : PubMed/NCBI
|
|
44
|
Glickman MH and Ciechanover A: The
ubiquitin-proteasome proteolytic pathway: Destruction for the sake
of construction. Physiol Rev. 82:373–428. 2002. View Article : Google Scholar : PubMed/NCBI
|
|
45
|
Pratt JM, Petty J, Riba-Garcia I,
Robertson DH, Gaskell SJ, Oliver SG and Beynon RJ: Dynamics of
protein turnover, a missing dimension in proteomics. Mol Cell
Proteomics. 1:579–591. 2002. View Article : Google Scholar : PubMed/NCBI
|
|
46
|
Langlois MR and Delanghe JR: Biological
and clinical significance of haptoglobin polymorphism in humans.
Clin Chem. 42:1589–1600. 1996.PubMed/NCBI
|
|
47
|
Gogos CA, Drosou E, Bassaris HP and
Skoutelis A: Pro-versus anti-inflammatory cytokine profile in
patients with severe Sepsis: A marker for prognosis and future
therapeutic options. J Infect Dis. 181:176–180. 2000. View Article : Google Scholar
|
|
48
|
Wang CH, Gee MJ, Yang C and Su YC: A new
model for outcome prediction in intra-abdominal sepsis by the
linear discriminant function analysis of IL-6 and IL-10 at
different heart rates. J Surg Res. 132:46–51. 2006. View Article : Google Scholar
|
|
49
|
Acosta C and Davies A: Bacterial
lipopolysaccharide regulates nociceptin expression in sensory
neurons. J Neurosci Res. 86:1077–1086. 2008. View Article : Google Scholar
|
|
50
|
Andoh T, Itoh M and Kuraishi Y: Nociceptin
gene expression in rat dorsal root ganglia induced by peripheral
inflammation. Neuroreport. 8:2793–2796. 1997. View Article : Google Scholar : PubMed/NCBI
|
|
51
|
Itoh M, Takasaki I, Andoh T, Nojima H,
Tominaga M and Kuraishi Y: Induction by carrageenan inflammation of
prepronociceptin mRNA in VR1-immunoreactive neurons in rat dorsal
root ganglia. Neurosci Res. 40:227–233. 2001. View Article : Google Scholar : PubMed/NCBI
|
|
52
|
Williams JP, Thompson JP, Young SP, Gold
SJ, McDonald J, Rowbotham DJ and Lambert DG: Nociceptin and
urotensin-II concentrations in critically ill patients with sepsis.
Bri J Anaesth. 100:810–814. 2008. View Article : Google Scholar
|
|
53
|
Dellinger RP, Levy M, Rhodes A, Annane D,
Gerlach H, Opal SM, Sevransky JE, Sprung CL, Douglas IS, Jaeschke
R, et al: Surviving sepsis campaign: International guidelines for
management of severe sepsis and septic shock, 2012. Intens Care
Med. 39:165–228. 2012, 2013. View Article : Google Scholar
|