Introduction
Atherosclerosis (AS) of the carotid arteries is a
major cause of stroke and transient ischemic attack, which remains
the leading cause of mortality in China and is currently the most
common cause of mortality worldwide (1,2). The
symptoms of AS are not always detected by patients until
complications arise and the therapeutic methods to treat AS are
poor; therefore, it is particularly important to establish an
appropriate, rigorous and efficient detection strategy for
early-phase AS, in order to limit disease progression before it
results in clinical consequences (3). There are two prevalent methods for
diagnosing AS: Doppler ultrasound and computed tomographic
angiography (CTA), which have become the standard methods for
diagnosing AS (4,5). However, neither of these methods
identify the early asymptomatic pathological changes of AS and
ultrasound only assesses plaque in the carotid artery. Therefore,
it is paramount to develop non-invasive methods for diagnosing
high-risk, asymptomatic individuals before the onset of clinical
events or symptoms (6,7). Furthermore, data supporting the
routine use of Doppler ultrasound to screen for carotid stenosis in
an asymptomatic population is considered to be weak, as there is a
low overall prevalence of treatable AS in the general asymptomatic
population (8). It is widely
hypothesized that the next generation of screening tests will be
based on molecular biomarkers (9).
DNA methylation, a stable epigenetic mark, is a
non-traditional, heritable factor involved in gene transcription
regulation (10). DNA methylation
occurs at position 5′ of CpG dinucleotides; certain regions of DNA
are rich in CpG and are termed CpG islands (GCIs), which
predominantly locate in the promoter region (11). Changes in patterns of DNA
methylation may lead to inappropriate gene expression, and
contribute to the development and progression of disease (12). In addition, previous studies have
demonstrated aberrant DNA methylation in AS (13). Alterations in DNA methylation have
been identified as an early event in AS; Zhao et al
(14) found that aberrant
methylation may represent an early biomarker for AS, and
demonstrated clinical correlations with carotid intima-media
thickness (14). Current research
primarily focuses on the effect of DNA methylation leading to AS
and, to the best of our knowledge, there are few studies that
investigate the role of DNA methylation on the early diagnosis of
AS. Detection of DNA methylation, at candidate loci in AS, suggests
that AS-specific methylation changes could be applied
diagnostically. However, DNA methylation affects various factors,
including age, living environment, diet and other factors limit the
use of methylation changes for diagnosis. Previous studies have
shown that simultaneous measure various differentially methylated
loci may improve diagnostic use (15). Furthermore, a major limitation
towards further developments of DNA methylation in clinical use may
be that the majority of studies focus on single genes (16), whereas AS is associated with
multiple factors, including genetic and epigenetic alterations
(17). Measuring the methylation
of individual genes was not as specific or sensitive as using a
panel of epigenetic markers for the early detection of breast
cancer (18).
In the present study, DNA methylation was profiled
in AS and healthy groups of 300 patients using nested
methylation-specific polymerase chain reaction (PCR; NT-MSP). Based
in previous unpublished data, a biomarker panel capable of
differentiating AS patients from healthy individuals, irrespective
of AS histology, was identified. The present study provides insight
into AS etiology, presents validated tissue-based diagnostic
biomarkers, and supplies a framework for the development of DNA
methylation-based molecular diagnostics for AS detection in
patients.
Materials and methods
Ethics statement
The present study was reviewed and approved by the
Ethics Committee of General Hospital of Ningxia Medical University
(Yinchuan, China). Written informed consent was obtained from the
participants before the collection of any samples and the specimens
were irreversibly de-identified.
Inclusion and exclusion criteria
Patients with AS were diagnosed by Doppler
ultrasound examination of the carotid artery. The healthy control
group comprised of age- and gender-matched healthy individuals that
were not exhibiting AS risk factors. The exclusion criteria were as
follows: Individuals with moderate or severe valvular heart
disease, chronic renal failure or diabetes; smokers; obese
individuals; and those exhibiting disordered lipid metabolism.
NT-MSP analysis of DNA methylation
The following candidate genes formed the panel for
early detection of AS: ATP binding cassette subfamily A member 1
(ABCA1), acetyl-CoA acetyltransferase 1 (ACAT1),
peroxisome proliferator activated receptor α (PPARA),
platelet derived growth factor subunit B (PDGFB),
arachidonate 5-lipoxygenase (ALOX5), LDL receptor related
protein 1 (LRP1), lecithin-cholesterol acyltransferase
(LCAT), TIMP metallopeptidase inhibitor 1 (TIMP1),
matrix metallopeptidase 9 (MMP9), intercellular adhesion
molecule 1 (ICAM1), vascular endothelial growth factor A
(VEGFA) and nuclear factor of κ light polypeptide gene
enhancer in B-cells 1 (NFKB1). These genes contained CGIs,
were expressed in peripheral blood cells, and were correlated with
the occurrence and development of AS (19–24).
DNA methylation of these candidate genes was examined in two
independent test sets (total of 300 peripheral blood samples) and
genomic DNA was isolated from the peripheral blood mononuclear
cells using the Wizard Genomic DNA Purification kit (Promega
Corporation, Madison, WI, USA). An EZ DNA Methylation-Gold™ kit
(Zymo Research Corporation, Irvine, CA, USA) was used to detect the
DNA methylation patterns, and integrates the DNA denaturation and
bisulfite conversion processes into one step. The DNA was modified
by sodium bisulfite (Zymo Research Corporation, Irvine, CA, USA) in
which unmethylated cytosine residues were converted to thymine,
whereas methylated cytosine residues were retained as cytosine;
this difference was then utilized to specifically amplify either
methylated or unmethylated DNA. NT-MSP, which consists of a
two-step PCR amplification, was then used to detect methylation
(25). The first step of NT-MSP
uses an outer primer pair, which does not contain any CpGs. The
second step of PCR was conducted with conventional PCR primers
serving as inner primers. The primers for NT-MSP amplification were
designed according to the bioinformatics program, MethPrimer
(www.urogene.org/methprimer/index.html) and are
presented in Table I. PCR products
were gel purified with an agarose gel DNA fragment recovery kit,
according to the manufacturer's instructions, and were sequenced by
Invitrogen (Thermo Fisher Scientific, Inc., Waltham, MA, USA). To
reduce mispriming and to increase efficiency, touchdown (TD) PCR
was used for amplification. Samples were subjected to 30 cycles in
a TD program (94°C for 5 min, 94°C for 30 sec; 56°C for 30 sec and
72°C for 1 min, followed by a decrease of 0.5°C in the annealing
temperature every second cycle). After completion of the TD
program, 20 cycles were subsequently run (94°C for 30 sec, 56°C for
30 sec and 72°C for 60 sec), terminating with a 7-min extension at
72°C. The PCR products were separated by electrophoresis through a
2% agarose gel (Borunlaite Science & Technology, Beijing,
China) containing ethidium bromide (Tokyo Chemical Industry Co.,
Ltd., Shanghai, China) for 30 min at 100 V. The DNA bands were
visualized using ultraviolet light. The following formula was used:
Methylation %= methylation / (methylation + unmethylation)
×100%.
 | Table IPrimer sequences for DNA methylation
analysis. |
Table I
Primer sequences for DNA methylation
analysis.
| Gene | Primer sequence
(5′-3′)
|
|---|
| Forward | Reverse |
|---|
| ABCA1 | | |
| Outer |
GAAAGTAGGATTTAGAGGAAGTAAAT |
AATTCAATCACTCAACAAAAAACAC |
| Methylation |
AATTTTATTGGTGTTTTTGGTTGTC |
ATATCTTAAAATCCGCGATCTACG |
| Unmethylation |
AATTTTATTGGTGTTTTTGGTTGTT |
CAAATATCTTAAAATCCACAATCTA |
| ACAT1 | | |
| Outer |
AGGAAGATTTAGAGATTTAGAAGTAA |
TCAATAATCACTCAAACACACAA |
| Methylation |
TTAATTAGTTTGGTTTTTGGTCGTT |
CTTATATACCAAATGCGAACT |
| Unmethylation |
TTAATTATGTGTGTTTGGTTTTTTG |
TATCCAAATTAACCAAACTCCATA |
| PDGFB | | |
| Outer |
TTTTTTTGTTTTGAAATTTTGGTTAA |
CAAAATCCCAACAAAAATCTCC |
| Methylation |
TTTGGAAATTAATGATAAGTTAGGC |
AAGCATCATAAAAAAAACGCATC |
| Unmethylation |
TTGGAAATTAATGATAAGTTAGGTGA |
AAACATCATAAAAAAAACACATCA |
| ALOX5 | | |
| Outer |
TTATATTTTCGTCGTTTTACGTACG |
AATATAAAAAAAATTTCGCGCG |
| Methylation |
TATATTTTTGTTGTTTTATGTATGG |
AAATATAAAAAAAATTACACACT |
| Unmethylation |
AGATGTTATAGGGATTTTGTTGTTT |
TCTAAAACACAAAAACTCTCAAC |
| LRP1 | | |
| Outer |
TTTGTTGTTTAGGTTGGAGTGTAGT |
TAAAAAAATCACTTTTAAAAATTC |
| Methylation |
TGTTTAGGTTGGAGTGTAGTGGTAC |
AAAAAATCACTTTTCAAAATTCGA |
| Unmethylation |
TGTTTAGGTTGGAGTGTAGTGGTAT |
AAAAATCACTTTTCAAAATTCAAA |
| LCAT | | |
| Outer |
GAGTTTTTTGTTTTGTTTTGGTTTC |
AATCTTAATCAATCTATCTACCGC |
| Methylation |
GAGTTTTTTGTTTTGTTTTGGTTTT |
ATCTTAATCAATCCATCTACCACA |
| Unmethylation |
TTTGGTTGTTTTTTTGTATTATTTG |
TCAATCTTAATCAACTCATCTACC |
| TIMP1 | | |
| Outer |
TTTTTTTTAATGTTTATTTATTTATT |
CCAAACACTCACAATTTATCTCAC |
| Methylation |
TTAGGTAGTTTTTGTTTGAATTTCG |
ATAAATACCGTTCTTATTCCCGTT |
| Unmethylation |
TAGGTAGTTTTTGTTTGAATTTTGG |
ATAAATACCAATTCTTATTCCCATT |
| MMP9 | | |
| Outer |
GGTTATATAGTTGGAAATGGTAGAGT |
ATTCAAACAATTCTCTACCTCAAC |
| Methylation |
TTTTAAATATAGTTTATTGGGTCGG |
TTTAATAAAAATAAAATTTCACTA |
| Unmethylation |
TTTTTTAAATATAGTTTATTGGGTTGG |
AATAAAAATAAATTTCACTACATT |
| ICAM1 | | |
| Outer |
GTAAGAGTTTAGTGGAATTCGTTCG |
GAATCACTAACCATCCAAAAACG |
| Methylation |
TAAGAGTTTAGTGGAATTTGTTTGA |
AAATCACTAACCATCCAAAAACAC |
| Unmethylation |
TAAGAGTTTAGTGGAATTTGTTTGA |
CCTAAAACTTTCCTATTATAAAAC |
| VEGFA | | |
| Outer |
TAGTTAGAGTCGGGGTGTGTAGAC |
GAAAAACCGAACAAAAACGAA |
| Methylation |
TAGTTAGAGTTGGGGTGTGTAGATG |
AACAAAAAACCAACAAAAACAAA |
| Unmethylation |
GGAGTAAATTTTTTTTATTTTTTTT |
ATTGTGGTTTTTGGTTTAGTTTTG |
| PPARA | | |
| Outer |
AGTATAGTGGTATAGGGTATTGGTAG |
TAAAACTCTACAAAACAAAAAAAA |
| Methylation |
TAGTGGTAGGTATAGTTGGTAGCGG |
ACCAATAACGAAAATAAAAAAAC |
| Unmethylation |
TAGTGGTAGGTATAGTTGGTAGTGG |
CAATAACAAAATAAAAAAACACC |
| NFKB1 | | |
| Outer |
TATAGATGAGTTTTATTTATTTGGTA |
AAACTCTAACTCCTAACAAAAC |
| Methylation |
TTGATTGGGTTCGGTAGGC |
GCACTTCTAAAAAGCTATACGCC |
| Unmethylation |
TTATTGATTGGGTTTGGTAGGT |
CCCACACTTCTAACACTATACACC |
Reverse transcription-quantitative PCR
(RT-qPCR) for mRNA
The total RNA was extracted from the peripheral
blood mononuclear cells using Invitrogen TRIzol reagent (Thermo
Fisher Scientific, Inc.). Primer Premier 5 software was used to
design the primers (Table II).
The expression levels of candidate genes were normalized to those
of glyceraldehyde-3-phosphate dehydrogenase (GAPDH): Forward,
5′-AGAAGGCTGGGGCTCATTTG-3′, and reverse,
5′-AGGGGCCATCCACAGTCTTC-3′. RNA was reverse transcribed using the
PrimeScript Real-Time PCR reagent kit (Invitrogen; Thermo Fisher
Scientific, Inc.) according to the manufacturer's instructions.
Total RNA then underwent cDNA synthesis and PCR amplification using
the PrimeScript Real-Time PCR reagent kit according to the
manufacturer's instructions. The qPCR reaction was performed
following the manufacturer's instructions, as follows: Denaturation
at 94°C for 10 min, 50 cycles at 94°C for 15 sec, annealing at 53°C
for 30 sec and extension at 72°C for 30 sec. The RNA level of every
gene was acquired from the value of the quantitation cycle (Cq) of
the qPCR normalized to that of GAPDH using the following formula:
ΔCq = CqGAPDH − Cqgene. The final
results were expressed as the N-fold differences in the target gene
expression and was relative to the calibrator, termed
Ntarget, which was determined as follows:
Ntarget =2ΔCq(sample)−ΔCq(calibrator), where
ΔCq values of the calibrator and sample were determined
by subtracting the Cq value of the target gene from the Cq value of
GAPDH.
| Table IIPrimers used in quantitative
polymerase chain reaction for mRNA analysis. |
Table II
Primers used in quantitative
polymerase chain reaction for mRNA analysis.
| Gene | Primer | Sequence
(5′-3′) | Product size
(bp) |
|---|
| ACAT1 | Left |
ACGCTGCTGTAGAACCTATTGA | 116 |
| Right |
GGCTTCATTTACTTCCCACATT | |
| ABCA1 | Left |
ATCAAGGGCATCGTGTATGAG | 227 |
| Right |
AGGATTGTCACCACAGCAAAC | |
| PPARA | Left |
ATCACGGAACACGCTTTCAC | 100 |
| Right |
CGATGTTCAATGCTCCACTG | |
| TIMP1 | Left |
ATACTTCCACAGGTCCCACAAC | 194 |
| Right |
GGATGGATAAACAGGGAAACAC | |
| ALOX5 | Left |
AGTTCCAGCAAGGGAACATT | 204 |
| Right |
CATCCGAAGGGAGGAAAATAG | |
Statistical analysis
The patient characteristics were compared with those
of the control subjects using the χ2 test and the
independent-samples t-test was used to detect significantly
different methylation levels between the AS patients and matched
controls. Receiver-operating-characteristics (ROC) curves were
calculated to evaluate the diagnostic performance of different
marker combinations. Furthermore, sensitivity and specificity
analyses were performed to assess different marker combinations for
AS detection. P<0.05 was considered to indicate a statistically
significant difference.
Results
Doppler ultrasound of carotid artery
samples
All participants in the test and validation sets
were verified by Doppler ultrasound. Images of carotid arteries of
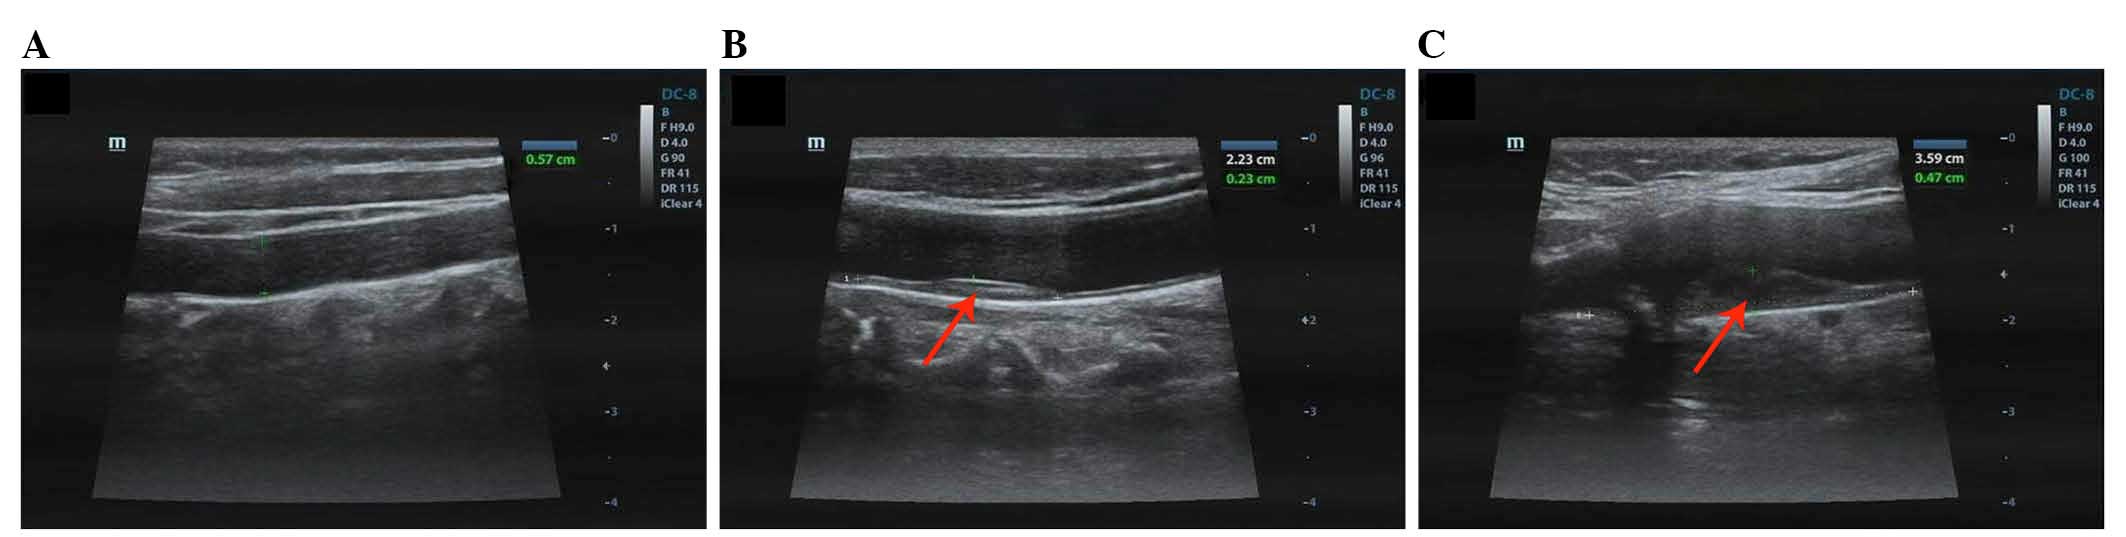
the healthy control subjects are presented in Fig. 1A, the samples demonstrate
intima-media with no plaques and normal blood flow. Conversely,
Doppler flow imaging of the patients with AS demonstrated anterior
wall filling defects in the carotid artery, as shown in Fig. 1B and C. Furthermore, the plaque
area was 0.23×2.23 cm in Fig. 1B
and 0.47×3.59 cm in Fig. 1C.
Subject recruitment and collection of
blood samples
A total of 300 peripheral blood samples were
assessed in this case-control study, which included samples from AS
patients and healthy control subjects. Between June 2011 and March
2012 150 patients and 150 healthy subjects (who had undergone
Doppler ultrasound) were enrolled from the General Hospital of
Ningxia Medical University for the test study. All participants
were human immunodeficiency virus-, hepatitis B virus-, and
hepatitis B virus-negative and did not exhibit inflammation or
liver and kidney diseases. Furthermore, they did not have any
previous history of cancer and were not pregnant. AS is often
accompanied by lipid abnormalities; in the present study, AS
patients demonstrated higher levels of the following factors: Total
cholesterol (TC; P=0.0082), total triglycerides (TG; P=0.0091),
high-density lipoprotein (HDL; P=0.0063), apolipoprotein A
(P=0.0895) and apolipoprotein B (P=0.0739) compared with the
matched control subjects, however, the low-density lipoprotein
(LDL) is decreased. The two groups were matched according to
gender, age, smoking habit and alcohol consumption; Table III presents the clinical profiles
of the patients.
| Table IIIDemographic characteristics of study
subjects. |
Table III
Demographic characteristics of study
subjects.
| Characteristic | Groups
| P-value |
|---|
| Matched control
(%) | AS (%) |
|---|
| Gender ratio
(male/female) | 70/80 | 60/90 | 0.1359 |
| Age (years) | | | |
| 30–40 | 63 | 18 | |
| 41–49 | 55 | 50 | 0.3791 |
| 51–60 | 32 | 87 | |
| Alcohol | 25 | 45 | 0.2852 |
| Smoking | 48 | 55 | 0.5721 |
| Total
triglyceride | 6 (4) | 66 (44) | 0.0091 |
| Total
cholesterol | 12 (8) | 39 (26) | 0.0082 |
| High-density
lipoprotein | 6 (4) | 88 (72) | 0.0063 |
| Low-density
lipoprotein | 45 (30) | 25 (41) | 0.0489 |
| Apolipoprotein
A | 81 (54) | 99 (66) | 0.0894 |
| Apolipoprotein
B | 24 (36) | 75 (51) | 0.0739 |
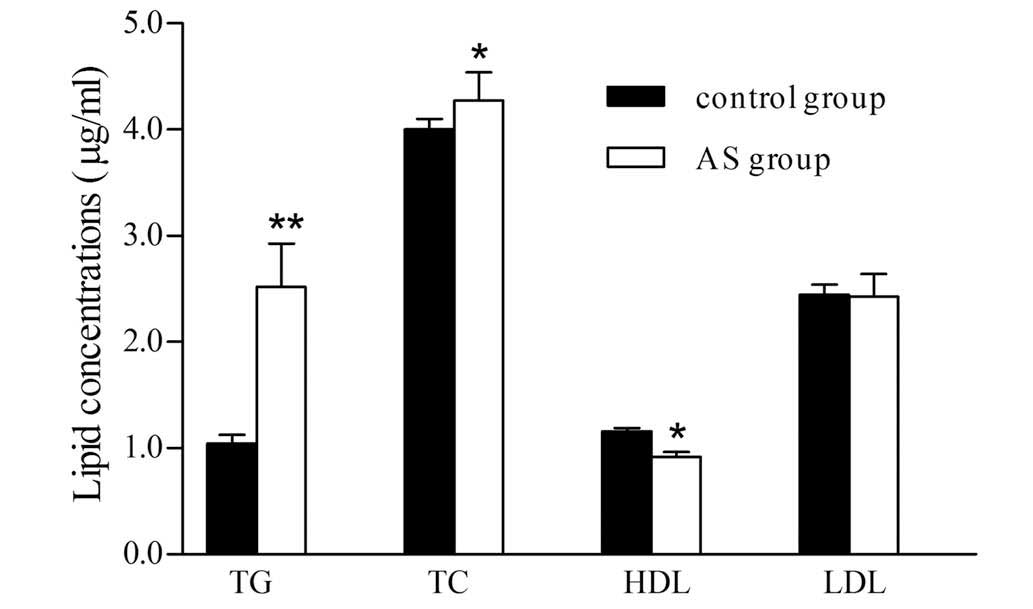
Blood lipid levels
The 300 samples were evaluated using an automatic
biochemical analyzer and the blood lipids levels are presented in
Fig. 2. Compared with the healthy
control group, the concentrations of TG and TC increased by 2.4-
and 1.2-fold, respectively in the AS patients (P<0.01 and
P<0.05), while, the HDL level was reduced by 43.8% in the AS
group (P<0.05).
Methylation frequencies of target genes
in the AS and matched control subjects in the test set
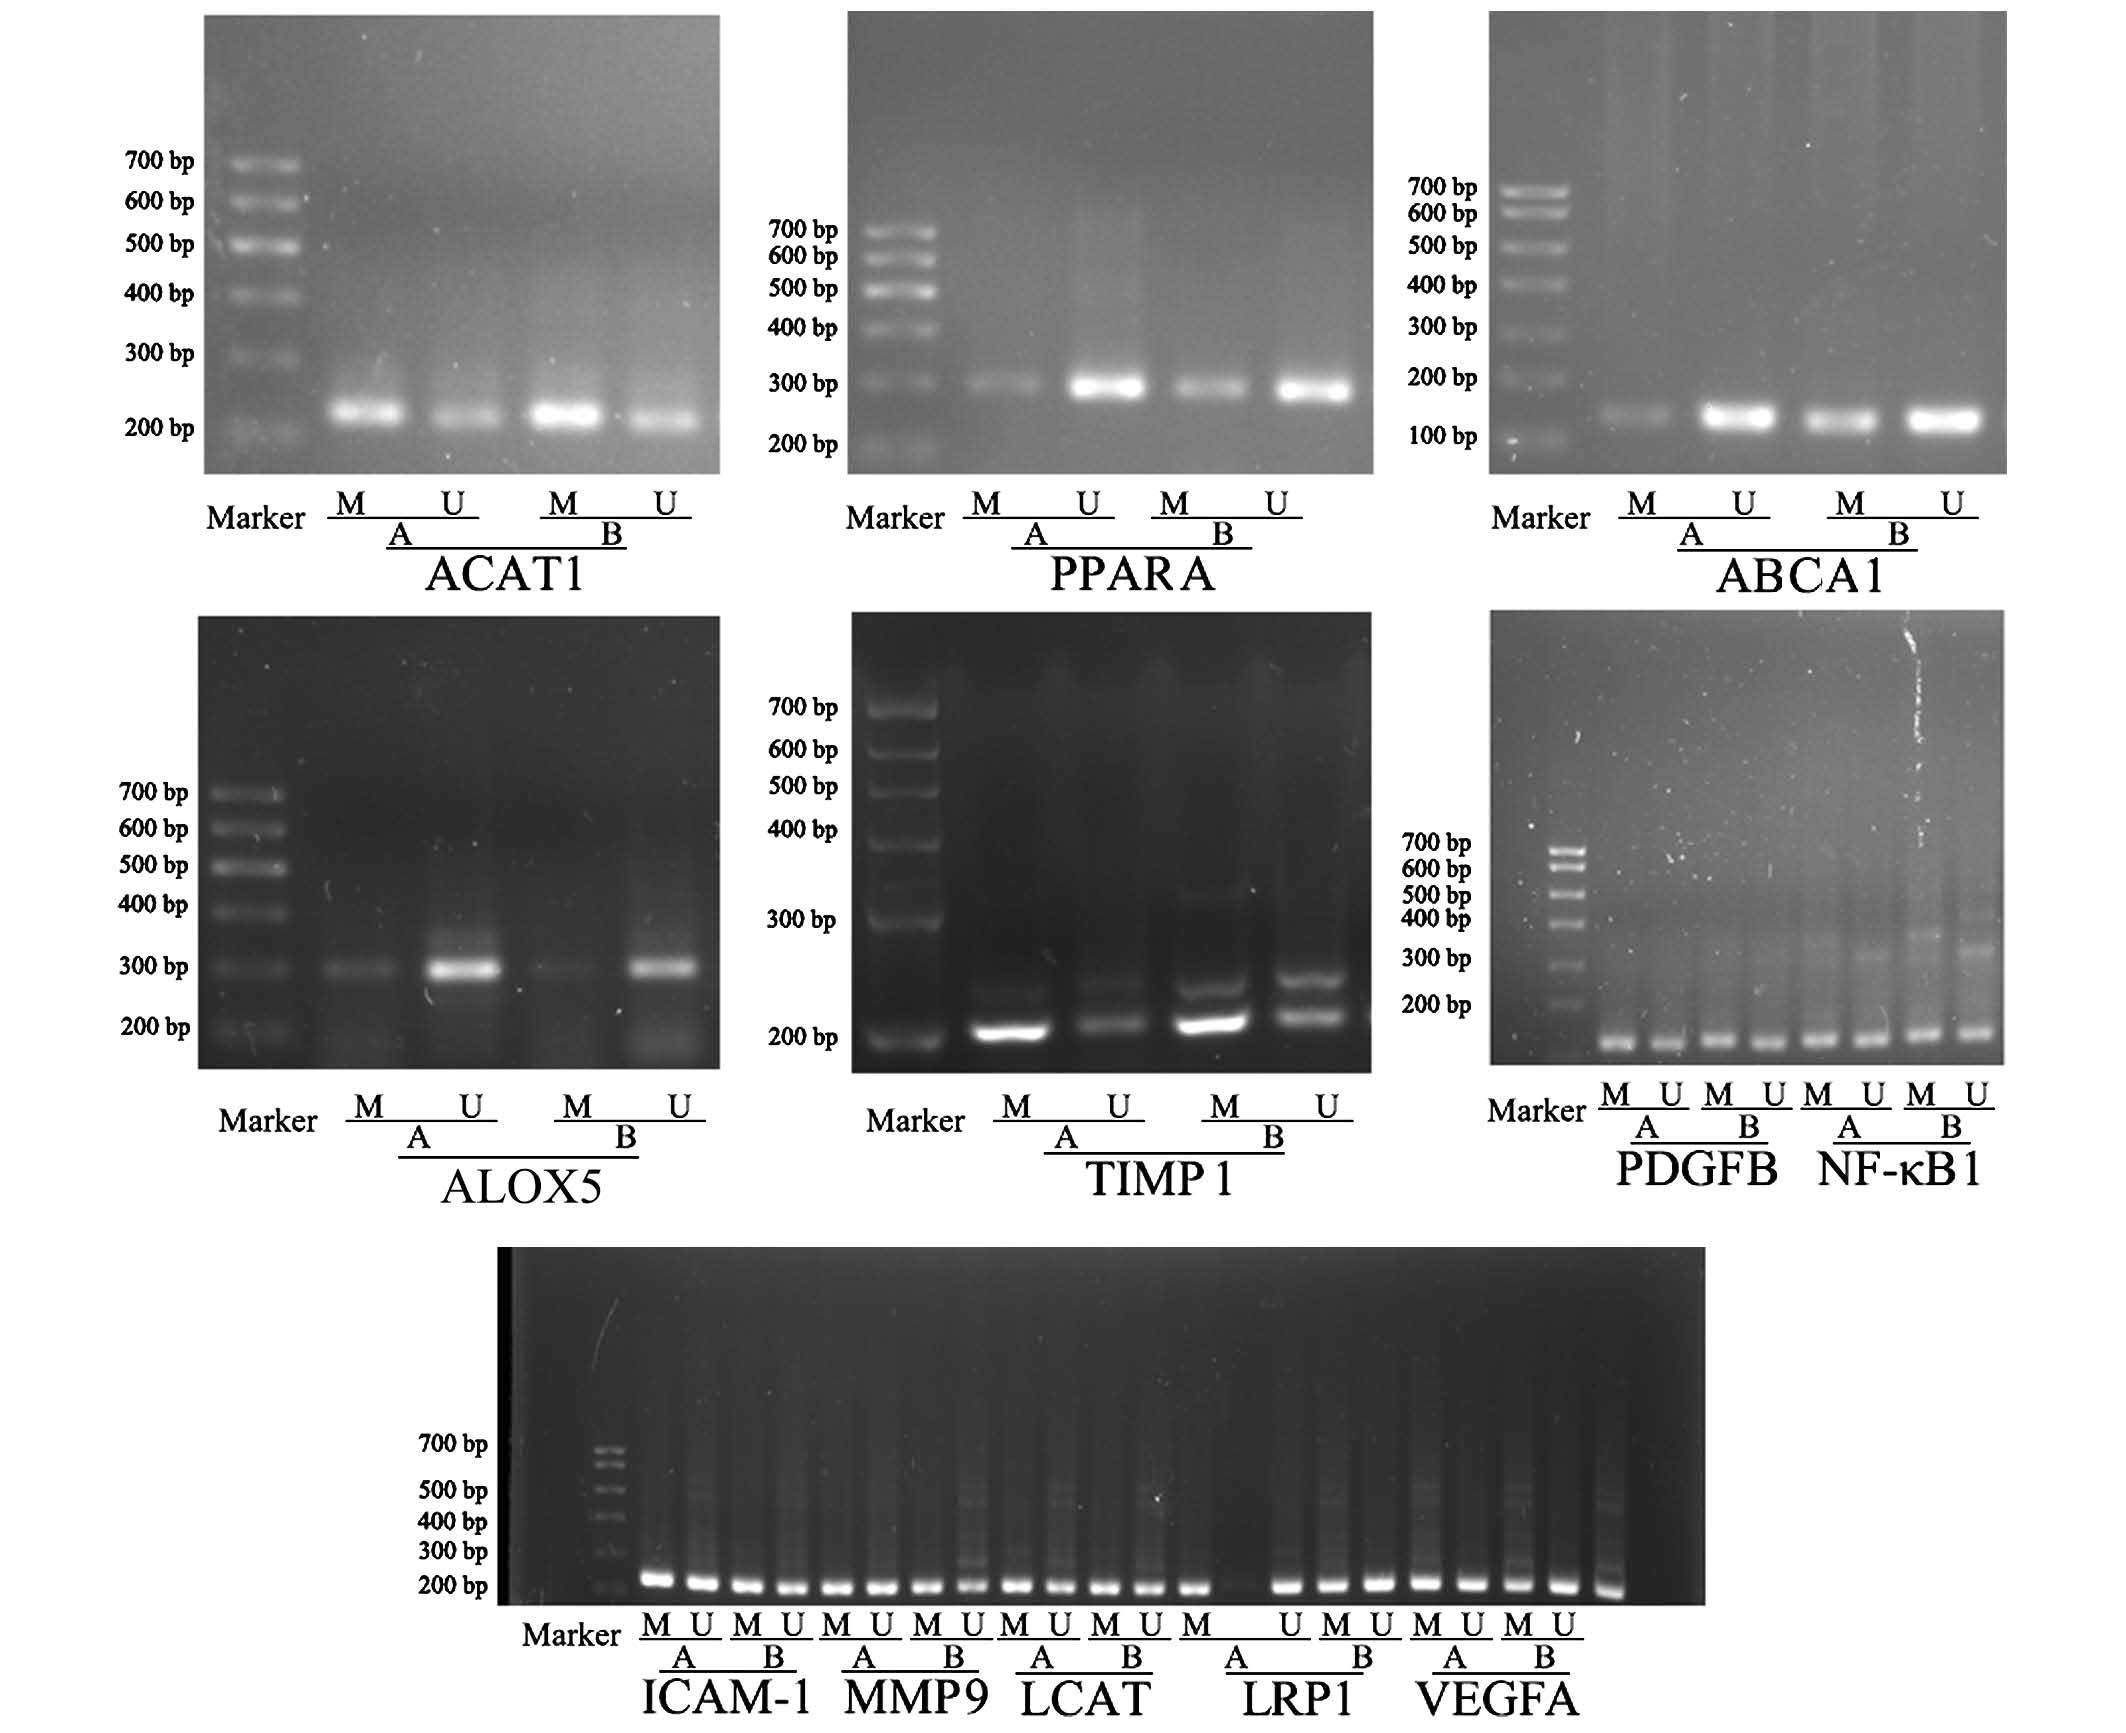
DNA methylation of ABCA1, ACAT1, PPARA, PDGFB,
ALOX5, LRP1, LCAT, TIMP1, MMP9, ICAM1, VEGFA and NFKB1
were initially assessed by NT-MSP (Fig. 3; Table IV). The figure demonstrates the
patterns of hyper- and hypomethylated genes in the AS patients and
matched control subjects. Methylation frequencies of ACAT1
(P<0.01), ALOX5 (P<0.05) and PPARA (P<0.05)
were decreased whereas TIMP1 (P<0.01) and ABCA1
(P<0.01) were significantly increased in AS compared the matched
controls. However, no statistically significant differences were
identified between the remaining genes (PDGFB, LRP1, LCAT, MMP9,
ICAM1, VEGFA and NFKB1) in the AS patients and matched
control subjects, thus, these genes were excluded. The methylation
of TIMP1, ACAT1 (P<0.01), ABCA1, ALOX5 and PPARA
were significantly different in AS; thus, these genes may be used
as a clinical tool for the early diagnosis of AS.
| Table IVMethylation levels of AS-associated
genes in the two groups. |
Table IV
Methylation levels of AS-associated
genes in the two groups.
| Gene | Healthy group | AS group | P-value |
|---|
| ACAT1 | 0.6103±0.01082 | 0.4357±0.02562 | 0.0024a |
| ICAM1 | 0.2812±0.02119 | 0.2530±0.02335 | 0.3722 |
| ALOX5 | 0.3091±0.01589 | 0.2770±0.00573 | 0.0325b |
| LRP1 | 0.6977±0.01104 | 0.6893±0.01261 | 0.6213 |
| MMP9 | 0.6246±0.02744 | 0.5585±0.02754 | 0.0944 |
| TIMP1 | 0.5103±0.00276 | 0.5924±0.00782 | 0.0031a |
| VEGFA | 0.5607±0.00841 | 0.5565±0.01386 | 0.8073 |
| PDGDB | 0.5493±0.01008 | 0.5217±0.01175 | 0.0812 |
| ABCA1 |
0.4855±0.006517 | 0.6708±0.01609 | 0.0011a |
| LCAT | 0.7087±0.01502 | 0.6827±0.01682 | 0.2544 |
| PPARA | 0.9944±0.00215 | 0.9786±0.00147 | 0.0266b |
| NFKB1 | 0.5709±0.01952 |
0.5631±0.007049 | 0.7090 |
Aberrant methylation profiles in AS
Among the 12 genes, the methylation frequencies of
five genes, TIMP1, ACAT1, ABCA1, ALOX5 and PPARA, were
significantly different between the AS patients and the matched
control subjects. ROC curves were constructed for each of the five
genes to classify AS patients and the matched control subjects. The
area under the curve (AUC) of the ROC curve for TIMP1 was
0.891 (P<0.0001), which was the largest among the five genes.
The sensitivity and specificity of TIMP1 were 78 and 84%,
respectively, in the diagnosis of AS (Table V). When used separately to diagnose
AS, the sensitivity of each gene ranged from 44 to 78% and the
specificity ranged from 60 to 84%, the AUC of the ROC curves for
the other four genes (ACAT1, ABCA1, ALOX5 and PPARA)
ranged from 0.547 to 0.830.
| Table VDiagnostic performance of five genes
in AS group versus the matched controls in the test set. |
Table V
Diagnostic performance of five genes
in AS group versus the matched controls in the test set.
| Gene | AS group
| Matched control
group
| AUC | PPV | NPV | P-value |
|---|
| Sensitivity
(%) | Pos./total | Specificity
(%) | Pos./total |
|---|
| TIMP1 | 78 | 117/150 | 84 | 24/150 | 0.891 | 0.83 | 0.79 | <0.0001 |
| ACAT1 | 68 | 102/150 | 84 | 24/150 | 0.830 | 0.81 | 0.72 | <0.0001 |
| ABCA1 | 62 | 90/150 | 78 | 33/150 | 0.711 | 0.74 | 0.67 | <0.0001 |
| ALOX5 | 48 | 72/150 | 60 | 60/150 | 0.547 | 0.55 | 0.54 |
0.0325 |
| PPARA | 44 | 66/150 | 72 | 42/150 | 0.535 | 0.61 | 0.56 |
0.0380 |
Combining various markers is a common strategy to
improve diagnostic sensitivity when investigating clinical
biomarkers. Based on the ROC curve for each gene, the most
sensitive for the diagnosis of AS was TIMP1, which was found
to be methylated in 117 of the 150 cases of AS patients, displaying
a sensitivity of 78%; TIMP1 was also identified in 126 of
the 150 cases of matched controls, displaying a specificity of 84%
(Table V). The more frequently
methylated gene was ACAT1 (68%; 102/150), followed by
ABCA1 (62%; 93/150), ALOX5 (48%; 72/150) and
PPARA (44%; 66/150). The AUC of ALOX5 (0.547) and
PPARA (0.535) was the smallest among the five genes, and the
methylation frequencies of ALOX5 and PPARA
demonstrated no significant difference between the AS and matched
control groups, ranging from 44 to 48% and from 60 to 72% in the in
AS and matched control groups, respectively. Three genes, TIMP1,
ACAT1 and ABCA1, were highly specifically methylated in
AS; therefore, these constituted the first combination (P<0.01),
which was the highest among the five genes for the diagnosis of AS.
According to this analysis, combinations of different markers were
examined to maximize specificity and sensitivity (Table VI). The combination of TIMP1,
ACAT1 improved the sensitivity to 84%, which is higher than
TIMP1 or ACAT1 alone, while the specificity dropped
to 78%. Using this method, a total of three panels of genes were
analyzed. The sensitivity and specificity of the three-gene panel
(TIMP1, ACAT1 and ABCA1) was 88 and 90%, respectively
and thus was identified to be the optimal combination of markers in
the present study.
| Table VIDiagnostic performance of different
panels in the AS and matched groups. |
Table VI
Diagnostic performance of different
panels in the AS and matched groups.
| Genes | AS group
| Matched control
group
| PPV | NPV |
|---|
| Sensitivity
(%) | Pos./total | Specificity
(%) | Pos./total |
|---|
| ACAT1,
TIMP1 | 84 | 126/150 | 78 | 33/150 | 0.79 | 0.81 |
| ABCA1,
TIMP1 | 76 | 114/150 | 94 |
9/150 | 0.93 | 0.80 |
| ACAT1,
ABCA1 | 76 | 114/150 | 74 | 39/150 | 0.75 | 0.76 |
| ACAT1, ABCA1,
TIMP1 | 88 | 132/150 | 90 | 15/150 | 0.90 | 0.88 |
Expression levels of TIMP1, ACAT1, ABCA1,
ALOX5 and PPARA in the AS and matched control groups
DNA methylation is often correlated with changes in
the accessibility of DNA to transcriptional activators, which is
crucial in the regulation of gene expression (26). RT-qPCR analysis of these five genes
(TIMP1, ACAT1, ABCA1, ALOX5 and PPARA) was performed
in the AS and matched control groups on samples of peripheral blood
for which total RNA was available. Compared with the healthy group,
the expression levels of PPARA, ALOX5 and ACAT1 were
increased by 3.94-, 3.38- and 1.54-fold in the AS group,
respectively (Table VII). These
data suggest that these AS-associated genes were markedly altered
in AS patents.
| Table VIIAS-associated gene mRNA expression in
the two groups. |
Table VII
AS-associated gene mRNA expression in
the two groups.
| Gene | Healthy group | AS group | P-value |
|---|
| ACAT1 | 0.1027±0.02326 | 0.1585±0.03378 | 0.0348a |
| ABCA1 | 0.4492±0.12360 | 0.1046±0.02010 | 0.0156a |
| ALOX5 |
0.07529±0.01171 | 0.2545±0.05715 | 0.0040b |
| TIMP1 | 0.1477±0.01251 |
0.05062±0.00502 | 0.0001b |
| PPARA | 0.0861±0.02322 |
0.33960±0.06839 | 0.0025b |
Analysis of sensitivity and specificity
of methylation profiles
The novel panel, consisting of the genes TIMP1,
ACAT1 and ABCA1, initially exhibited a combined
sensitivity of 88% for the AS group and specificity of 90% for the
matched control group, the performance of the novel panel was
higher when compared with that of the individual genes for the
detection of AS. The novel epigenetic (epi)-panel was compared with
the previously used Doppler ultrasound method to identify AS in the
validation data analysis. The validation set consisted of 100
samples that were also obtained from the General Hospital of
Ningxia Medical University, including 50 patients and 50 healthy
individuals, who had been excluded from the AS group via Doppler
ultrasound diagnosis.
To study the correlation between methylation levels
obtained by NT-MSP and Doppler ultrasound (which is a diagnostic
criteria for AS) samples of the validation set were reexamined by
qualitative NT-MSP. In order to increase the analytical sensitivity
and to yield a higher reproducibility, primer binding sites in the
test set and the validation set were located in the same genomic
promoter region. By contrasting Doppler ultrasound with TIMP1,
ACAT1 and ABCA1 promoter methylation, a significant,
positive correlation was identified. The combination of TIMP1,
ACAT1 and ABCA1 methylation revealed a sensitivity of
88% for the detection of AS and a specificity of 70% in healthy
subjects, respectively. The novel panel also revealed a coincidence
rate of 79%, which refers to consistency between the results of the
novel panel and the Doppler ultrasound.
Discussion
The incidence of AS is increasing and represents a
significant health issue, thus, there is a clear requirement for
the development of prognostic markers in AS to provide
risk-adjusted treatment and surveillance management. DNA
methylation biomarkers have obvious applications in diagnostics
(27). In the present study, the
performance of a blood-based PCR assay for methylated DNA of 12
potential biomarkers was determined in two independent test sets
with a total of 300 samples. The data confirmed the high
performance of certain previously identified DNA methylation
markers. Furthermore, the methylation frequencies of ACAT1,
ABCA1, PPARA, TIMP1 and ALOX5 of AS peripheral
blood were identified to be significantly changed when compared
with that of the matched controls, the novel epi-panel consisting
of TIMP1, ACAT1 and ABCA1 exhibited a higher
sensitivity and specificity than any of the individual
biomarkers.
These genes have previously been reported to be
significantly involved in preventing or promoting AS. Aberrant
methylation of ABCA1 and ACAT1 has been identified in
the progression of AS (28). In
addition, TIMP1 expression has been associated with a
negative prognosis in AS (29). To
the best of our knowledge the present study is the first to
demonstrate TIMP1 methylation in AS, and that methylation of
ACAT1 and ABCA1 has never previously been reported in
AS.
Methylation changes in AS are often heterogeneous
and, as yet, to the best of our knowledge, no single gene has been
identified to be methylated in every AS patient specimen.
Furthermore, in the majority of studies investigating methylation
levels of only single genes the sensitivity was low. Therefore, it
is considered to be advantageous to use a panel of genes for
disease screening procedures. As a result of the comparative
analysis, a biomarker panel with the best values for AS specificity
was defined first in a test set. TIMP1, ACAT1 and
ABCA1 proved to be candidate genes, showing a significant
specificity of the methylation pattern in the matched control and
AS groups. Furthermore, TIMP1, ACAT1 and ABCA1
methylation achieved 88% sensitivity, with a high specificity of
90% in the test set, this indicated that the panel had the
potential to perform as effectively, potentially more effectively,
than the single markers, indicating that the methylation of three
genes may be useful when screening high risk individuals.
In an independent validation set, promoter
methylation of the TIMP1, ACAT1 and ABCA1 combination
enabled significant discrimination of AS from various control
conditions. ROC analysis of three-gene panel methylation revealed a
sensitivity of 88% with a specificity of 70%. Combining these with
other detection methods may provide a robust epi-panel with a high
sensitivity for AS detection. Compared with ultrasound, a reliable
biomarker panel for the early detection of AS, revealed that the
coincidence rate was 79%; thus, TIMP1, ACAT1 and
ABCA1 methylation analyses may be used as a supplement to
mammography, which has a low sensitivity in the early detection of
AS.
In conclusion, methods for AS screening should be
easy to perform, non-invasive and provide a benefit to patients.
Blood-based biomarkers fulfill these three requirements.
Quantifying promoter methylation of AS-associated genes in
peripheral blood is a rapidly growing research topic for early AS
detection. In the current study, 12 potential biomarkers were
evaluated in two independent test sets, and promoter methylation of
the TIMP1, ACAT1 and ABCA1 gene combination exhibited
a high sensitivity and specificity in peripheral blood DNA from
patients with AS. It is proposed that such a blood-based screening
method would be convenient for the patient and reduce costs for
health care providers.
Acknowledgments
The present study was supported by grants from the
National Natural Science Foundation of China (grant nos. 81160044,
81260105, 81360073, 81200118 and 81260063).
References
|
1
|
Liapis CD, Bell PR, Mikhailidis D,
Sivenius J, Nicolaides A, Fernandes e Fernandes J, Biasi G and
Norgren L: ESVS Guidelines Collaborators: ESVS guidelines. Invasive
treatment for carotid stenosis: Indications, techniques. Eur J Vasc
Endovasc Surg. 37(4 Suppl): S1–S19. 2009. View Article : Google Scholar
|
|
2
|
Du J, Wasserman BA, Tong W, Chen S, Lai S,
Malhotra S and Lai H: Cholesterol is associated with the presence
of a lipid core in carotid plaque of asymptomatic,
young-to-middle-aged African Americans with and without HIV
infection and cocaine use residing in inner-city Baltimore, Md.,
USA. Cerebrovasc Dis. 33:295–301. 2012. View Article : Google Scholar : PubMed/NCBI
|
|
3
|
Almekkaway MK, Shehata IA and Ebbini ES:
Anatomical-based model for simulation of HIFU-induced lesions in
atherosclerotic plaques. Int J Hyperthermia. 31:433–442. 2015.
View Article : Google Scholar : PubMed/NCBI
|
|
4
|
Libby P: Managing the risk of
atherosclerosis: The role of high-density lipoprotein. Am J
Cardiol. 88:3N–8N. 2001.
|
|
5
|
Hollingworth W, Nathens AB, Kanne JP,
Crandall ML, Crummy TA, Hallam DK, Wang MC and Jarvik JG: The
diagnostic accuracy of computed tomography angiography for
traumatic or atherosclerotic lesions of the carotid and vertebral
arteries: A systematic review. Eur J Radiol. 48:88–102. 2003.
View Article : Google Scholar : PubMed/NCBI
|
|
6
|
Wong KS, Li H, Chan YL, Ahuja A, Lam WW,
Wong A and Kay R: Use of transcranial doppler ultrasound to predict
outcome in patients with intracranial large-artery occlusive
disease. Stroke. 31:2641–2647. 2000. View Article : Google Scholar : PubMed/NCBI
|
|
7
|
Dong C, Yoon W and Goldschmidt-Clermont
PJ: DNA methylation and atherosclerosis. J Nutr. 132(8 Suppl):
2406S–2409S. 2002.PubMed/NCBI
|
|
8
|
Grützmann R, Molnar B, Pilarsky C,
Habermann JK, Schlag PM, Saeger HD, Miehlke S, Stolz T, Model F,
Roblick UJ, et al: Sensitive detection of colorectal cancer in
peripheral blood by septin 9 DNA methylation assay. PloS One.
11:e37592008. View Article : Google Scholar
|
|
9
|
Majid MM, Mughal MK, DeMarco JK, Majid A,
Shamoun F and Abela GS: Symptomatic and asymptomatic carotid artery
plaque. Expert Rev Cardiovasc Ther. 9:1315–1330. 2011. View Article : Google Scholar : PubMed/NCBI
|
|
10
|
Mendelsohn AR and Larrick JW: The DNA
methylome as a biomarker for epigenetic instability and human
aging. Rejuvenation Res. 16:74–77. 2013. View Article : Google Scholar : PubMed/NCBI
|
|
11
|
Guay SP, Brisson D, Lamarche B, Marceau P,
Vohl MC, Gaudet D and Bouchard L: DNA methylation variations at
CETP and LPL gene promoter loci: New molecular biomarkers
associated with blood lipid profile variability. Atherosclerosis.
228:413–420. 2013. View Article : Google Scholar : PubMed/NCBI
|
|
12
|
Zhang Y, Zhao M, Sawalha AH, Richardson B
and Lu Q: Impaired DNA methylation and its mechanism s in CD4(+)T
cells of systemic lupus erythematosus. J Autoimmun. 41:92–99. 2013.
View Article : Google Scholar : PubMed/NCBI
|
|
13
|
Robertson KD and Jones PA: DNA
methylation: Past, present and future directions. Carcinogenesis.
21:461–467. 2000. View Article : Google Scholar : PubMed/NCBI
|
|
14
|
Zhao J, Forsberg CW, Goldberg J, Smith NL
and Vaccarino V: MAOA promoter methylation and susceptibility to
carotid atherosclerosis: Role of familial factors in a monozygotic
twin sample. BMC Med Genet. 13:1002012. View Article : Google Scholar : PubMed/NCBI
|
|
15
|
Lasseigne BN, Burwell TC, Patil MA, Absher
DM, Brooks JD and Myers RM: DNA methylation profiling reveals novel
diagnostic biomarkers in renal cell carcinoma. BMC Med. 12:2352014.
View Article : Google Scholar : PubMed/NCBI
|
|
16
|
Yu X, Ling W and Mi M: Relationship of
impairment induced by intracellular S-adenosylhomocysteine
accumulation with DNA methylation in human umbilical vein
endothelial cells treated with 3-deazaadenosine. Int J Exp Pathol.
90:638–648. 2009. View Article : Google Scholar : PubMed/NCBI
|
|
17
|
Dong C, Yoon W and Goldschmidt-Clermont
PJ: DNA methylation and atherosclerosis. J Nutr. 132(8 Suppl):
2406S–2409S. 2002.PubMed/NCBI
|
|
18
|
Van De Voorde V, Speeckaert R, Van Gestel
D, Bracke M, De Neve W, Delanghe J and Speeckaert M: DNA
methylation-based biomarkers in serum of patients with breast
cancer. Mutat Res. 751:304–325. 2012. View Article : Google Scholar : PubMed/NCBI
|
|
19
|
Ridker PM, Stampfer MJ and Rifai N: Novel
risk factors for systemic atherosclerosis: A comparison of
C-reactive protein, fibrinogen, homocysteine, lipoprotein(a) and
standard cholesterol screening as predictors of peripheral arterial
disease. JAMA. 285:2481–2485. 2001. View Article : Google Scholar : PubMed/NCBI
|
|
20
|
Attie AD, Kastelein JP and Hayden MR:
Pivotal role of ABCA1 in reverse cholesterol transport influencing
HDL levels and susceptibility to atherosclerosis. J Lipid Res.
42:1717–1726. 2001.PubMed/NCBI
|
|
21
|
Nissen SE, Tuzcu EM, Brewer HB, Sipahi I,
Nicholls SJ, Ganz P, Schoenhagen P, Waters DD, Pepine CJ, Crowe TD,
et al: Effect of ACAT inhibition on the progression of coronary
atherosclerosis. N Engl J Med. 354:1253–1263. 2006. View Article : Google Scholar : PubMed/NCBI
|
|
22
|
Shan W, Palkar PS, Murray IA, McDevitt E,
Kennett MJ, Kang BH, Isom HC, Perdew GH, Gonzalez FJ and Peters JM:
Ligand activation of peroxisome proliferator-activated receptor
beta/delta (PPARbeta/delta) attenuates carbon tetrachloride
hepatotoxicity by downregulating proinflammatory gene expression.
Toxicol Sci. 105:418–428. 2008. View Article : Google Scholar : PubMed/NCBI
|
|
23
|
Khovidhunkit W, Kim MS, Memon RA,
Shigenaga JK, Moser AH, Feingold KR and Grunfeld C: Effects of
infection and inflammation on lipid and lipoprotein metabolism
mechanisms and consequences to the host. J Lipid Res. 45:1169–1196.
2004. View Article : Google Scholar : PubMed/NCBI
|
|
24
|
Liang Y, Yang X, Ma L, Cai X, Wang L, Yang
C, Li G, Zhang M, Sun W and Jiang Y: Homocysteine-mediated
cholesterol efflux via ABCA1 and ACAT1 DNA methylationin THP-1
monocyte-derived foam cells. Acta Biochim Biophys Sin (Shanghai).
45:220–228. 2013. View Article : Google Scholar
|
|
25
|
Ma S, Zhang H, Sun W, Gong H, Wang Y, Ma
C, Wang J, Cao C, Yang X, Tian J, et al: Hyperhomocysteinemia
induces cardiac injury by up-regulation of p53-dependent Noxa and
Bax expression through the p53 DNA methylation in ApoE (−/−) mice.
Acta Biochim Biophys Sin (Shanghai). 45:391–400. 2013. View Article : Google Scholar
|
|
26
|
Frangogiannis NG, Smith CW and Entman ML:
The inflammatory response in myocardial infarction. Cardiovasc Res.
53:31–47. 2002. View Article : Google Scholar
|
|
27
|
Glöckner SC, Dhir M, Yi JM, McGarvey KE,
Van Neste L, Louwagie J, Chan TA, Kleeberger W, de Bruïne AP, Smits
KM, et al: Methylation of TFPI2 in stool DNA: A potential novel
biomarker for the detection of colorectal cancer. Cancer Res.
69:4691–4693. 2009. View Article : Google Scholar : PubMed/NCBI
|
|
28
|
Melotte V, Lentjes MH, van den Bosch SM,
Hellebrekers DM, de Hoon JP, Wouters KA, Daenen KL,
Partouns-Hendriks IE, Stessels F, Louwagie J, et al: N-Myc
downstream-regulated gene 4 (NDRG4): A candidate tumor suppressor
gene and potential biomarker for colorectal cancer. J Natl Cancer
Inst. 101:916–927. 2009. View Article : Google Scholar : PubMed/NCBI
|
|
29
|
Hoseini SM, Kalantari A, Afarideh M,
Noshad S, Behdadnia A, Nakhjavani M and Esteghamati A: Evaluation
of plasma MMP-8, MMP-9 and TIMP-1 identifies candidate
cardiometabolic risk marker in metabolic syndrome: Results from
double-blinded nested case-control study. Metabolism. 64:527–538.
2015. View Article : Google Scholar : PubMed/NCBI
|