Introduction
Acute coronary syndrome (ACS) covers the spectrum of
acute myocardial ischemia and/or necrosis that is commonly
secondary to reduced coronary blood flow. ACS also includes
unstable angina pectoris (UAP) and acute myocardial infarction
(AMI) (1–5). ACS is common in emergency rooms and
each year it is responsible for 1 million hospital admissions in
the USA and 2 million in Europe (5). Early diagnosis and intervention are
crucial in order to minimize the damage to the cardiac muscle
(1–5), as treatment may significantly reduce
mortality and improve long-term prognosis (6). For accurate ACS diagnosis, physical
examination, electrocardiography, radiologic studies and cardiac
biomarker tests are essential, and these also aid in guiding
treatment (1). Timely and
appropriate treatment for ACS includes cardiac catheterization and
primary percutaneous coronary intervention (7).
Since clinical presentation and echocardiography
findings are often nonspecific in patients with chest pain, cardiac
biomarkers, including cardiac troponin I (cTnI), creatine kinase MB
(CK-MB) mass and myoglobin (Myo) are often used for diagnosis
(8,9). Indeed, cTnI is the gold standard for
diagnosis of AMI (10), however,
serial testing is required as it is also frequently present in
patients with chronic but stable coronary artery disease and may be
detected in apparently healthy controls (11,12).
In addition, the timing of troponin measurement with respect to
symptom onset has an impact on the result (13,14).
Therefore, novel biomarkers with high sensitivity and specificity
for early diagnosis of AMI are urgently required to improve the
prognosis of patients with acute chest pain.
Notably, the role of microRNAs (miRNAs) in acute
myocardial infarction (AMI) has been previously investigated
(15,16). Levels of muscle-specific miR-1,
miR-133a and miR-499 in addition to cardiac-specific miR-208a were
significantly higher in plasma samples from patients with AMI
compared with controls (16,17).
Circulating miRNAs are readily detectable, relatively stable and
tissue-specific (14), making them
attractive biomarker candidates.
It was hypothesized that specific miRNAs may be
associated with AMI. The aim of the present study was to
comprehensively assess the miRNAs released into circulation during
AMI, and determine which may be used as biomarkers to detect and
monitor myocardial injury. In addition, miRNA expression levels
were compared with established biomarkers, including CK-MB, Myo and
cTnI.
Patients and methods
Study design and patients
Circulating miRNAs were profiled in 3 patients with
AMI and 3 healthy controls. These results were then validated by
profiling the same miRNAs in 5 additional patients with AMI and
healthy controls. The selected miRNAs were further assessed with a
larger sample size, including 230 consecutive patients with ACS and
79 healthy controls (normal electrocardiograms and no history of
cardiovascular diseases). Exclusion criteria were as follows: i)
Presence of chest pain for >3 h at admission; or ii) angiography
was not performed.
Plasma samples from patients were collected at the
TEDA International Cardiovascular Hospital Emergency Department
(Tianjin, China) between September 2011 and September 2013. Serial
blood samples were collected from individuals with AMI at 0–3, 3–6,
6–9, 9–12 and 12–24 h following admission. Diagnoses of ACS, UA,
AMI, ST-elevated myocardial infarction (STEMI) and non-ST-elevated
myocardial infarction (NSTEMI) were made according to international
standards (11–13). All participants underwent clinical
evaluation, including physical examination, 12-lead
electrocardiography and echocardiography examinations. Blind
diagnoses were made by two independent experienced cardiologists
unaware of the miR-30d-5p and miR-125b-5p data. Demographic and
diagnosis information was collected for each patient, including
age, gender, coronary risk factors (hypertension, diabetes
mellitus, hyperlipidemia and smoking), renal function and duration
of chest pain. The present study was approved by the TEDA
International Cardiovascular Hospital Ethics Committee (Tianjin,
China), and written informed consent was obtained from each
individual.
Sample preparation
Peripheral blood was centrifuged at 820 × g for 5
min at room temperature, and the resulting plasma samples were
transferred into new RNase/DNase-free Eppen-dorf tubes (Thermo
Fisher Scientific, Inc., Waltham, MA, USA), and stored at −80°C
until RNA extraction. Total plasma RNA was isolated and eluted in
100 µl RNase-free water using a mirVana PARIS kit (#1556,
Ambion; Thermo Fisher Scientific, Inc.), according to the
manufacturer's protocol.
miRNA array analysis
In order to assess the differential miRNA expression
in patients with AMI, miRNA expression profiling was performed with
plasma samples from patients with AMI (n=3) and healthy controls
(n=3) using the miRCURY LNA microRNA Array system (version 18.0;
Exiqon Inc., Woburn, MA, USA). Total RNA was prepared using TRIzol
(Invitrogen; Thermo Fisher Scientific, Waltham, MA, USA) and an
miRNeasy Mini kit (Qiagen GmbH, Venlo, Netherlands) according to
the manufacturers' protocol. RNA integrity was assessed by
electrophoresis on a 1.2% denaturing agarose gel at 120 V for 15
min. Intact total RNA was characterized by sharp 28S and 18S rRNA
bands (eukaryotic samples). All plasma RNA preparations were
quantified on a NanoDrop 1000 spectrophotometer (Thermo Fisher
Scientific, Inc.). Samples with absorbance (260/280) ratios >1.8
were considered to be optimal for microarray assays. RNA samples
were labeled with the miRCURY Hy3 Power labeling kit (Exiqon,
Vedbaek, Denmark) and hybridized on the miRCURY LNA microRNA Array
system. The slides were washed three times using a wash buffer kit
(Exiqon), then dried by centrifugation at 1.5 × g, for 5 min at
room temperature. Next, the slides were scanned on an Axon GenePix
4000B microarray scanner (Molecular Devices, LLC, Sunnyvale, CA,
USA). Scanned images were imported into the GenePix Pro software
(version 6.0; Molecular Devices, LLC) for grid alignment and data
extraction. Replicated miRNAs were averaged and miRNAs with
intensities ≥30 in all samples were selected for calculating the
normalization factor. Data were normalized using the Median
normalization (18). Significantly
differentially expressed miRNAs were identified through Volcano
Plot filtering. Hierarchical clustering was also performed to
indicate the various miRNA expression profiling among samples. The
threshold value for significance of miRNA upregulation or
downregulation was set at fold-change ≥2.0, with P<0.05
calculated by Student's t-test. The miRNAs selected for
investigation in the current study were further filtered based on
their expression levels, described in previously published data,
and their heart-specificity defined according to
umm.uni-heidelberg.deapps/zmf/mirwalk/disease.php (19).
Reverse transcription-quantitative
polymerase chain reaction (RT-qPCR)
Total RNA (5 µl) was reverse-transcribed
using the TaqMan microRNA Reverse Transcription kit (Applied
Biosystems; Thermo Fisher Scientific, Inc.) according to the
manufacturer's protocol. Prior to RT, RNA was eluted in
nuclease-free water in order to avoid DNA contamination.
Temperatures used for RT were 16°C for 30 min, 42°C for 30 min, and
85°C for 5 min. The primer sequences used were obtained from
Invitrogen (Thermo Fisher Scientific, Inc.) and are described in
Table I. Subsequently, 2.33
µl cDNA was used to assess miRNA expression by qPCR using
the TaqMan microRNA Assay kits (hsa-miR-125b-5p, assay id.
477885_mir; hsa-miR-136-5p, assay id. 478307_mir; hsa-miR-129-1-3p,
assay id. 480873_mir; hsa-miR-30d-5p, assay id. 478606_mir;
hsa-miR-27a-5p, assay id. 477998_mir; hsa-miR-1291, assay id.
478690_mir; cel-miR-39-3p, assay id. 478293_mir; Applied
Biosystems; Thermo Fisher Scientific, Inc.) on a Light Cycler 480
Real Time PCR System (Roche Diagnostics, Basel, Switzerland). All
reactions involved an initial denaturation step at 95°C for 10 min
followed by 40 cycles of 95°C for 15 sec, and 60°C for 60 sec. The
Cq value was defined as the number of PCR cycles
required for the fluorescence signal to exceed the detection
threshold value (20). Values were
normalized by spiking in 5 fmol/µl cel-miR-39-3p
(Invitrogen; Thermo Fisher Scientific, Inc.) in the patient samples
(21) from the cel-miR-39-3p
TaqMan MicroRNA Assay kit and ratios were derived as previously
proposed (22).
 | Table IPrimers used for reverse
transcription-quantitative polymerase chain reaction. |
Table I
Primers used for reverse
transcription-quantitative polymerase chain reaction.
| microRNAs | Forward (5′–3′) | Reverse (5′–3′) |
|---|
| hsa-miR-125b-5p |
GCTCCCTGAGACCCTAAC |
GTGCGTGTCGTGGAGTCG |
| hsa-miR-136-5p |
GGAACTCCATTTGTTTTGA |
CAGTGCGTGTCGTGGAGT |
| hsa-miR-129-1-3p |
GAAGCCCTTACCCCAAA | CAGTGCGTGTCGTGGA |
| hsa-miR-30d-5p |
GGTGTAAACATCCCCGAC |
CAGTGCGTGTCGTGGAG |
| hsa-miR-27a-5p |
GGAGGGCTTAGCTGCTTGT |
GTGCGTGTCGTGGAGTCG |
| hsa-miR-1291 |
TCGCCCTGACTGAAGACC |
CAGTGCGTGTCGTGGAGT |
Biochemical analyses
Peripheral blood was collected in tubes containing
EDTA and centrifuged at 820 × g for 5 min at room temperature. cTnI
and Myo levels were determined in plasma samples by
chemiluminescence immunoassays, using the accuTnI and Access
Myoglobin kits respectively from Beckman Coulter, Inc. (Brea, CA,
USA). CK-MB was assessed by a quantitative mass assay using the
Access CK-MB kit (Beckman Coulter, Inc.).
Study endpoint and follow-up
The study endpoint was defined as the occurrence of
cardiovascular death, myocardial infarction, hospitalization for
unstable angina, stroke, coronary revascularization procedures,
peripheral revascularization procedures or heart failure requiring
hospitalization (23). To avoid
multiple counting of patients with more than one event, each
patient contributed only once to the composite endpoint. Endpoints
or events were determined by reviewing the medical records or by
follow-up telephone interviews for up to 12 months following the
initial chest pain episode.
Statistical analysis
Statistical analysis was performed using SPSS
(version 13.0; SPSS, Inc., Chicago, IL, USA) and GraphPad Prism
(version 5.0; GraphPad Software, Inc., San Diego, CA, USA). The
normality of the data was assessed using Shapiro-Wilks test or
Kolmogorov-Smirnov test. Normally distributed data is expressed as
the mean ± standard error, and the differences between groups were
compared by one-way analysis of variance with Tukey's honest
significant difference test used for post-hoc analysis or
independent samples t-test. The normally distributed data has been
indicated in Table III. Data
that was not normally distributed was expressed as the median (min,
max) or median and interquartile range, and the differences between
groups were compared using the non-parametric Kruskal-Wallis
one-way analysis of variance. The differences between qualitative
categorical data groups were compared using the Pearson's
χ2 test. Receiver operating characteristic (ROC) curves
were established for discriminating AMI. Each cardiac biomarker was
examined, and ROC curves and optimal cut-off values were obtained.
In addition, the sensitivity, specificity, positive predictive
value and negative predictive value of the candidate biomarkers
were determined. The correlations of cardiac biomarkers with end
point events at 1-, 6-and 12-month follow-ups were evaluated by the
Kaplan-Meier, log-rank and Cox regression tests. Kaplan-Meier was
used to draw the Kaplan-Meier curves, and log-rank tests were used
to detect whether there were significant differences between the
Kaplan-Meier curves. Cox regression analysis was performed to
assess the risk factors involved in the prognosis of patients with
ACS Two-tailed P<0.05 was considered to indicate a statistically
significant difference.
| Table IIIClinical characteristics of the study
groups. |
Table III
Clinical characteristics of the study
groups.
| Characteristic | STEMI (n=98) | NSTEMI (n=74) | All AMI
(n=172) | UAP (n=58) | HC (n=79) | P1 | P2 |
|---|
| Gender, male (n,
%)d | 72 (73.5) | 50 (67.6) | 122 (70.9) | 34 (58.6) | 50(63.29) | 0.174 | 0.342 |
| Age (years) | 61 (20–81)a,b | 63 (29–91)b | 62 (20–91)b | 65.5
(35–85)b | 41 (21–68) | <0.001 | <0.001 |
| Smoking (n, %) | 71 (72.4)a–c | 33 (44.6)b | 104 (60.5)b | 22 (37.9)b | 0 (0.0) | <0.001 | <0.001 |
| Hypertension (n,
%) | 55 (56.1)a–c | 54 (73.0)b | 109 (63.4)a,b | 45 (77.6)b | 0 (0.0) | <0.001 | <0.001 |
| Diabetes (n,
%) | 25 (25.5)b | 26 (35.1)b | 51 (29.7)b | 20 (34.5)b | 0 (0.0) | <0.001 | <0.001 |
| Arrhythmia (n,
%) | 50 (51.0)b,c | 56 (75.7)a–b | 106 (61.6)b | 34 (58.6)b | 0 (0.0) | <0.001 | <0.001 |
| SBP (mmHg)d | 130
(70–220)b | 135
(92–210)b | 133
(70–220)b | 131.5
(95–195)b | 120 (90–180) | <0.001 | <0.001 |
| DBP (mmHg)d | 80 (40–140)b | 81 (55–107) | 80 (40–140) | 76.5 (51–110) | 80 (59–120) | 0.246 | 0.567 |
| Glu (mmol/l) | 8.3
(4.6–22.3)a–c | 7.2
(4.2–20.9)a,b | 7.8
(4.2–22.3)a,b | 6.0
(4.2–22.3)b | 4.9 (4.0–11.4) | <0.001 | <0.001 |
| TC (mmol/l) | 4.7
(2.9–7.5)a | 4.4
(1.3–7.4)b | 4.6
(1.3–7.5)a,b | 4.05
(2.7–6.3)b | 4.8 (0.6–6.5) | <0.001 | 0.031 |
| TG (mmol/l) | 1.55
(0.35–4.56)b | 1.28
(0.53–6.15) | 1.41
(0.35–6.15)b | 1.28
(0.58–4.2) | 1.13
(0.37–3.86) | 0.008 | 0.004 |
| HDL-C (mmol/l) | 0.98
(0.48–1.78)b | 0.97
(0.55–2.86)b | 0.98
(0.48–2.86)b | 1.08
(0.43–1.81)b | 1.32
(0.76–2.12) | <0.001 | <0.001 |
| LDL-C (mmol/l) | 3.04
(1.09–5.54)a | 2.95
(1.04–5.65)a | 3.01
(1.04–5.65)a | 2.49
(1.33–4.33)b | 3.11
(1.47–3.82) | 0.001 | 0.201 |
| UA
(µmol/l) | 352
(194–574)b,c | 324 (144–546) | 336 (1447–574) | 349 (192.625) | 309 (160–450) | 0.025 | 0.004 |
| CREA
(µmol/l) | 70.5
(39.0–138.0)a,b | 67.5
(40.0–215.0)a,b | 70 (39–215)a,b | 59.0
(40.0–68.0) | 63 (34–94) | 0.001 | 0.003 |
| eGFRd | 98.714
(43.453–191.629)a,b | 104.969
(26.412–190.978)a,b | 101.268
(26.412–191.629)a,b | 121.152
(35.745–180.456)b | 122.74
(69.22–238.25) | <0.001 | <0.001 |
| LVEF% | 55 (28–64)a,b | 58 (24–68)b | 56 (24–68)a,b | 59 (43–69)b | 64 (60–68) | <0.001 | <0.001 |
| CK-MBmass
(ng/ml) | 3.6
(0.4–302.0)a,c | 11.1
(1.3–302.0)a | 6.1
(0.4–302.0)a | 1.4 (0.4–8.4) | – | – | – |
| Myo (ng/ml) | 95.8
(4.5–1703.6)a | 59.7
(12.6–2325.1)a | 77.5
(4.5–2325.1)a | 23.7
(8.5–240.2) | – | – | – |
| cTnI (ng/ml) | 0.131
(0.000–102.000)a,c | 2.201
(0.027–50.837)a,b | 0.45
(0.00–102.00)a,b | 0.013
(0.000–1.020)b | 0.000
(0.000–0.011) | <0.001 | 0.001 |
| miR-125b-5p | 3.725
(0.949–1403.769)a,b | 4.679
(0.914–400.078)a,b | 4.378
(0.914–1403.769)a,b | 1.017
(0.040–8.939) | 1 | <0.001 | <0.001 |
| miR-30d-5p | 9.818
(1.365–11492.847)a,b | 8.286
(1.064–357.669)a,b | 8.692
(1.064–111492.847)a,b | 0.949
(0.053–11.518) | 1 | <0.001 | <0.001 |
Results
Patients and controls
Profiling of the circulating miRNAs was performed in
3 patients with AMI and 3 healthy controls. The results were then
assessed in a validation cohort of additional patients with AMI
(n=5) and healthy controls (n=5). Next, the study was extended to a
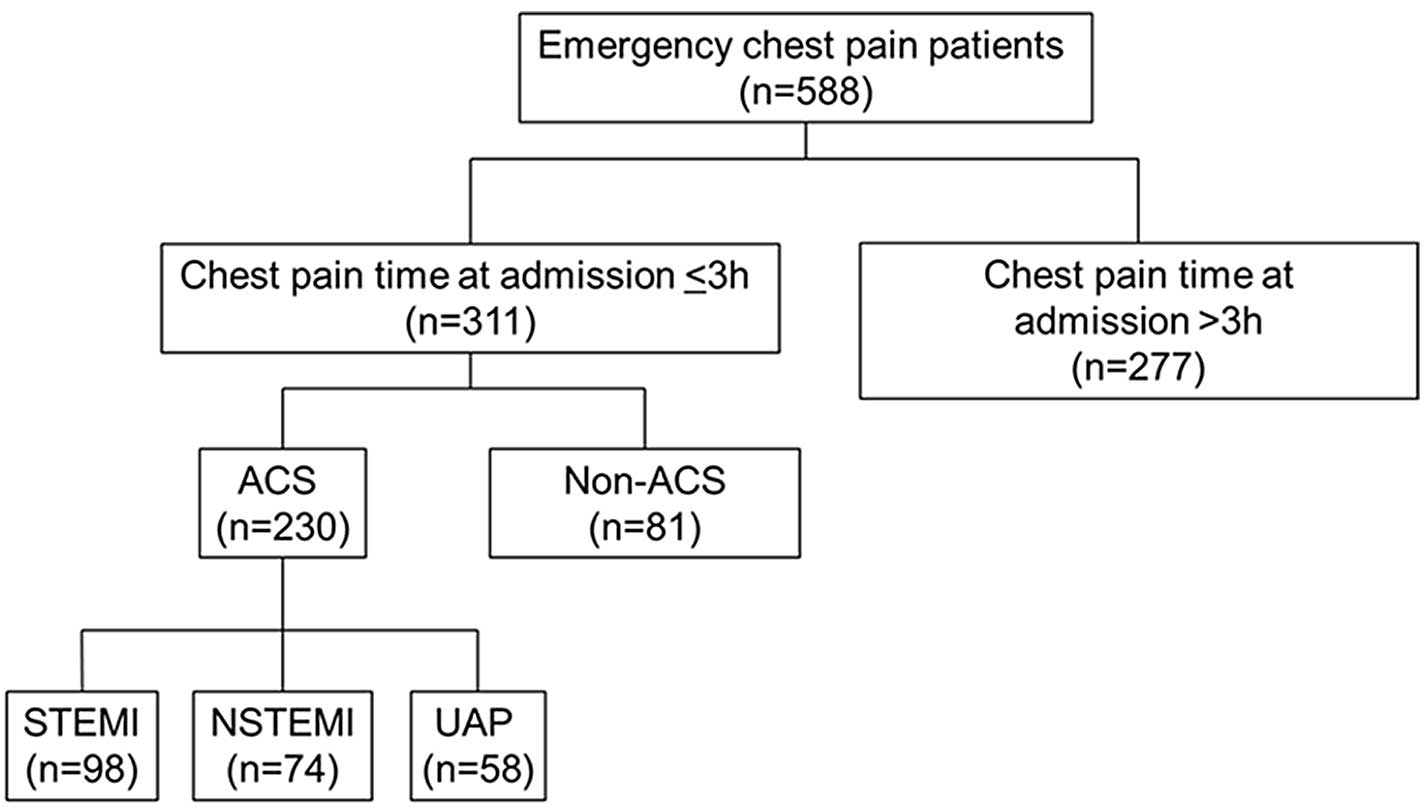
larger sample size (patients, n=230; controls, n=79). Fig. 1 presents the patients' flowchart.
Among 588 patients who were admitted for chest pain, 277 were
excluded, as the time between pain onset and admission was >3 h;
and 81 were excluded due to the cause of chest pain not being ACS.
Therefore, 230 patients were included (98 with STEMI, 74 with
NSTEMI and 58 with UAP). A total of 79 healthy controls were
recruited.
Detection of circulating miRNAs by
microarrays
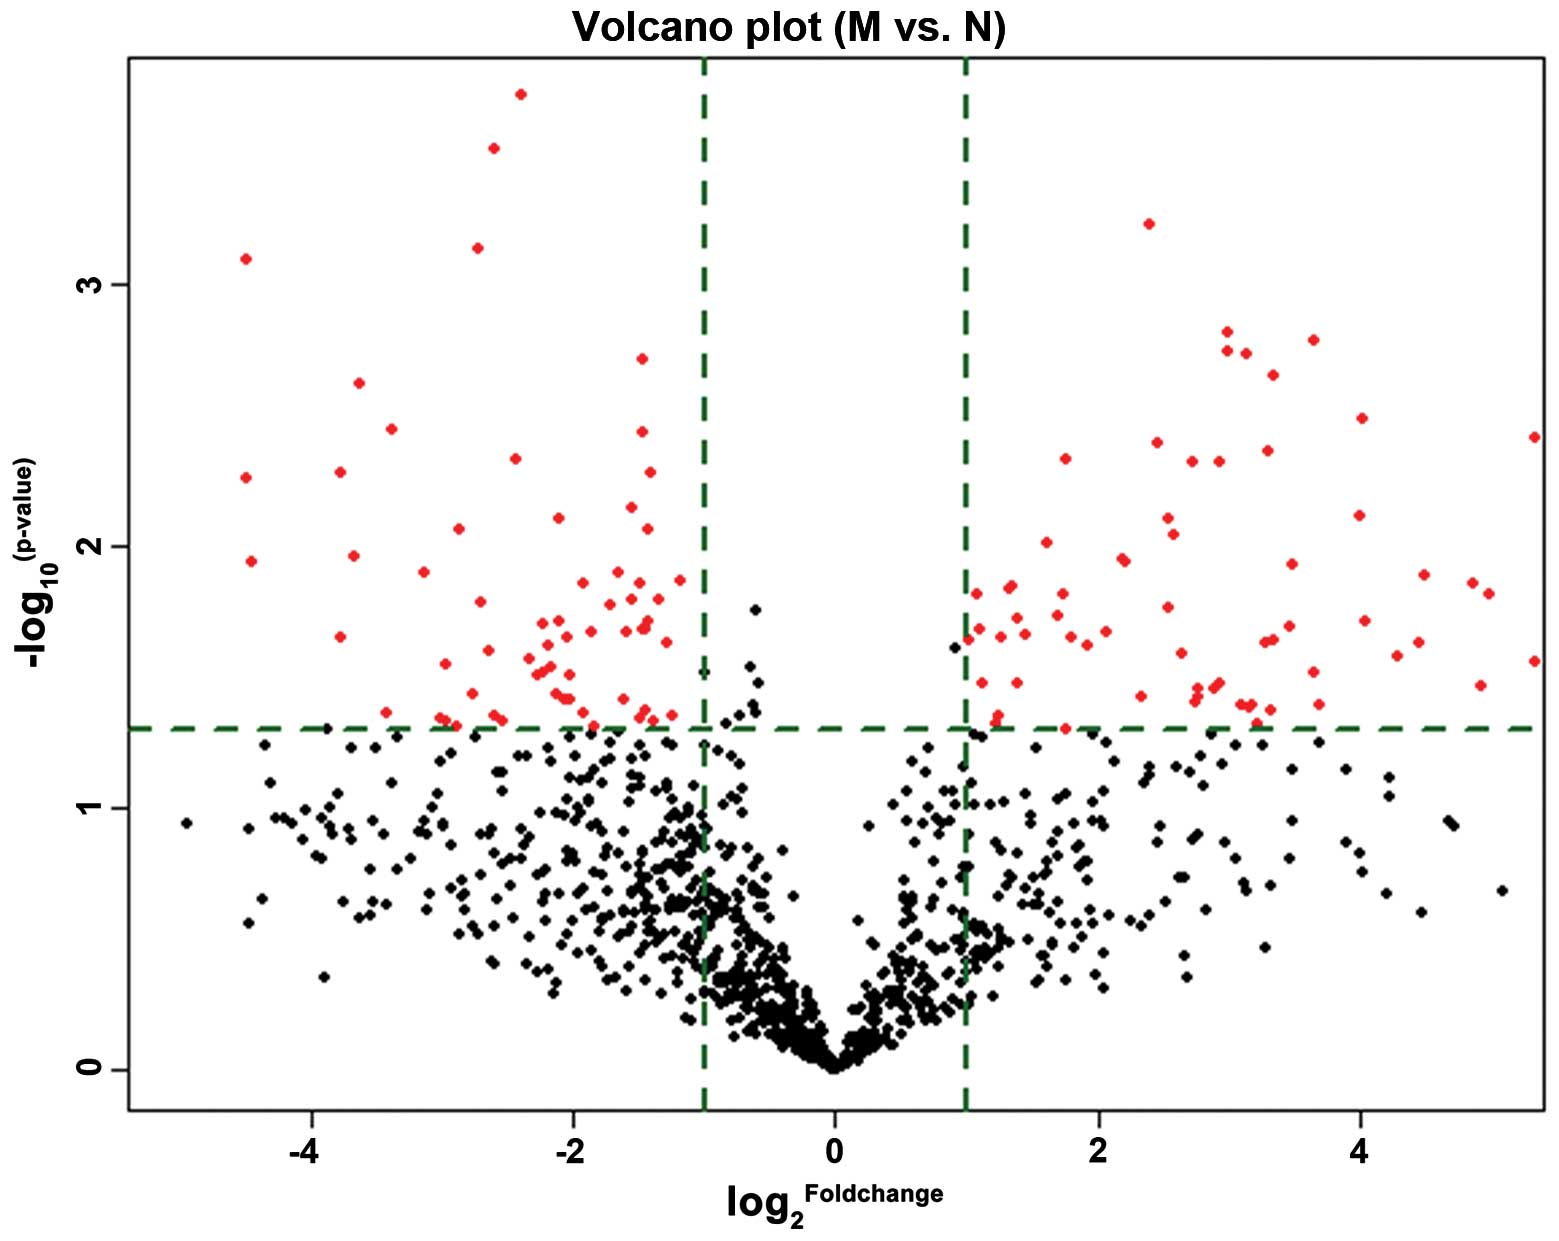
A total of 33 miRNAs were differentially expressed
in patients with AMI (n=3) and healthy controls (n=3) (Table II). Hierarchical clustering for
the 33 differentially expressed miRNAs is indicated by a volcano
plot (Fig. 2). Fig. 3 represents a heat map of these
miRNAs. As indicated by Table II,
a total of 27 miRNAs were upregulated and 6 were downregulated in
patients with AMI compared with healthy controls.
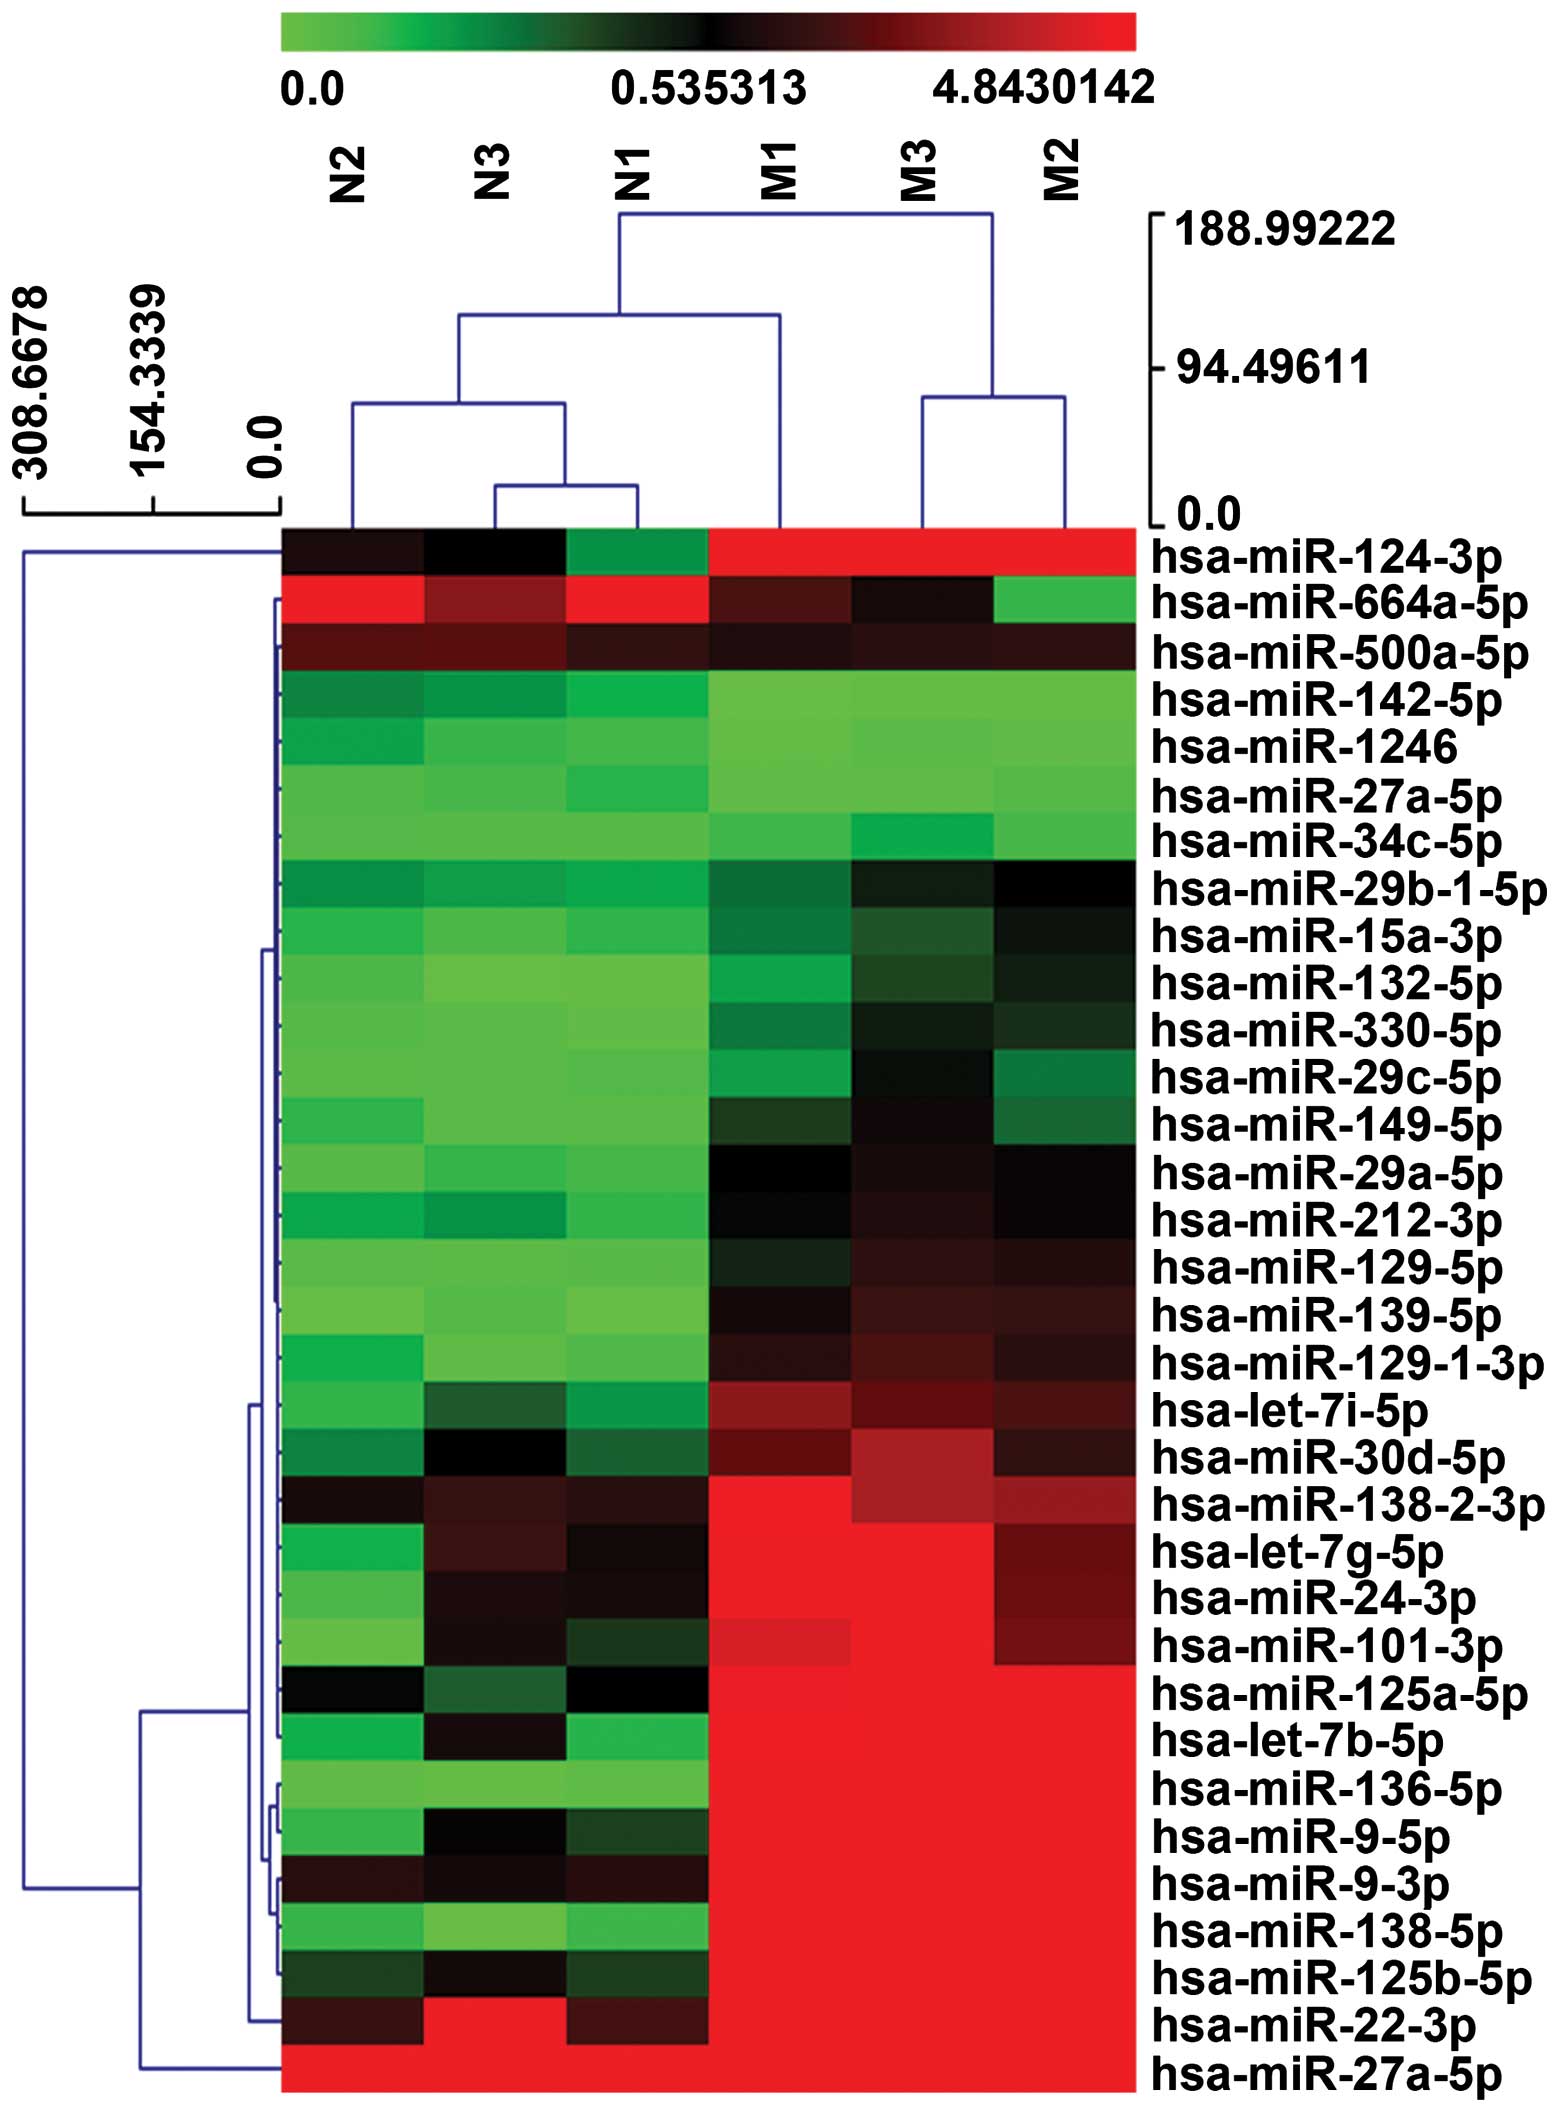 | Figure 3Profiling of circulating miRNAs in
patients with AMI and healthy controls. RNA was isolated from the
plasma of healthy controls (N1, N2, N3) and AMI patients (M1, M2,
M3). The heat map diagram represents the clustering of the 33
differentially expressed miRNAs. Red indicates higher expression,
and green low expression. Data is summarized in Table II. AMI, acute myocardial
infarction; M1, AMI patient 1; M2, AMI patient 2; M3, AMI patient
3; N1, healthy control 1; N2, healthy control 2; N3, healthy
control 3. |
| Table IIMicroRNAs were differentially
expressed in patients with AMI compared with healthy controls by
microarrays. |
Table II
MicroRNAs were differentially
expressed in patients with AMI compared with healthy controls by
microarrays.
| A, Upregulated |
|---|
|
|---|
| microRNAs | Fold-change | P-value |
|---|
| has-miR-24-3p | 7.563 | 0.034 |
| has-miR-29a-5p | 7.615 | 0.005 |
| has-miR-125b-5p | 40.002 | 0.004 |
| hsa-let-7b-5p | 16.004 | 0.008 |
| hsa-let-7g-5p | 5.058 | 0.038 |
|
hsa-miR-125a-5p | 12.485 | 0.002 |
| hsa-miR-149-5p | 6.772 | 0.035 |
| hsa-miR-330-5p | 9.886 | 0.004 |
| hsa-miR-101-3p | 9.706 | 0.024 |
| hsa-miR-34c-5p | 2.325 | 0.048 |
| hsa-miR-139-5p | 39.982 | 0.028 |
|
hsa-miR-29b-1-5p | 2.179 | 0.034 |
| hsa-miR-132-5p | 10.184 | 0.023 |
| hsa-miR-212-3p | 4.204 | 0.021 |
|
hsa-miR-129-1-3p | 16.264 | 0.003 |
| hsa-miR-138-5p | 249.663 | 0.010 |
| hsa-miR-9-5p | 31.712 | 0.016 |
| hsa-miR-30d-5p | 6.233 | 0.026 |
| hsa-miR-29c-5p | 6.756 | 0.038 |
|
hsa-miR-138-2-3p | 3.074 | 0.010 |
| hsa-miR-129-5p | 21.802 | 0.024 |
| hsa-miR-124-3p | 301.144 | 0.027 |
| hsa-let-7i-5p | 10.096 | 0.002 |
| hsa-miR-22-3p | 9.958 | 0.043 |
| hsa-miR-9-3p | 16.504 | 0.020 |
| hsa-miR-136-5p | 448.976 | 0.011 |
| hsa-miR-15a-3p | 3.325 | 0.015 |
| B,
Downregulated | | |
|---|
|
|---|
| microRNAs | Fold-change | P-value |
|---|
|
hsa-miR-500a-5p | 0.385 | 0.047 |
| hsa-miR-27a-5p | 0.046 | 0.012 |
| hsa-miR-142-5p | 0.200 | 0.027 |
|
hsa-miR-664a-5p | 0.212 | 0.020 |
| hsa-miR-1246 | 0.173 | 0.046 |
| hsa-miR-1291 | 0.033 | 0.116 |
Circulating miRNAs in the validation
cohort
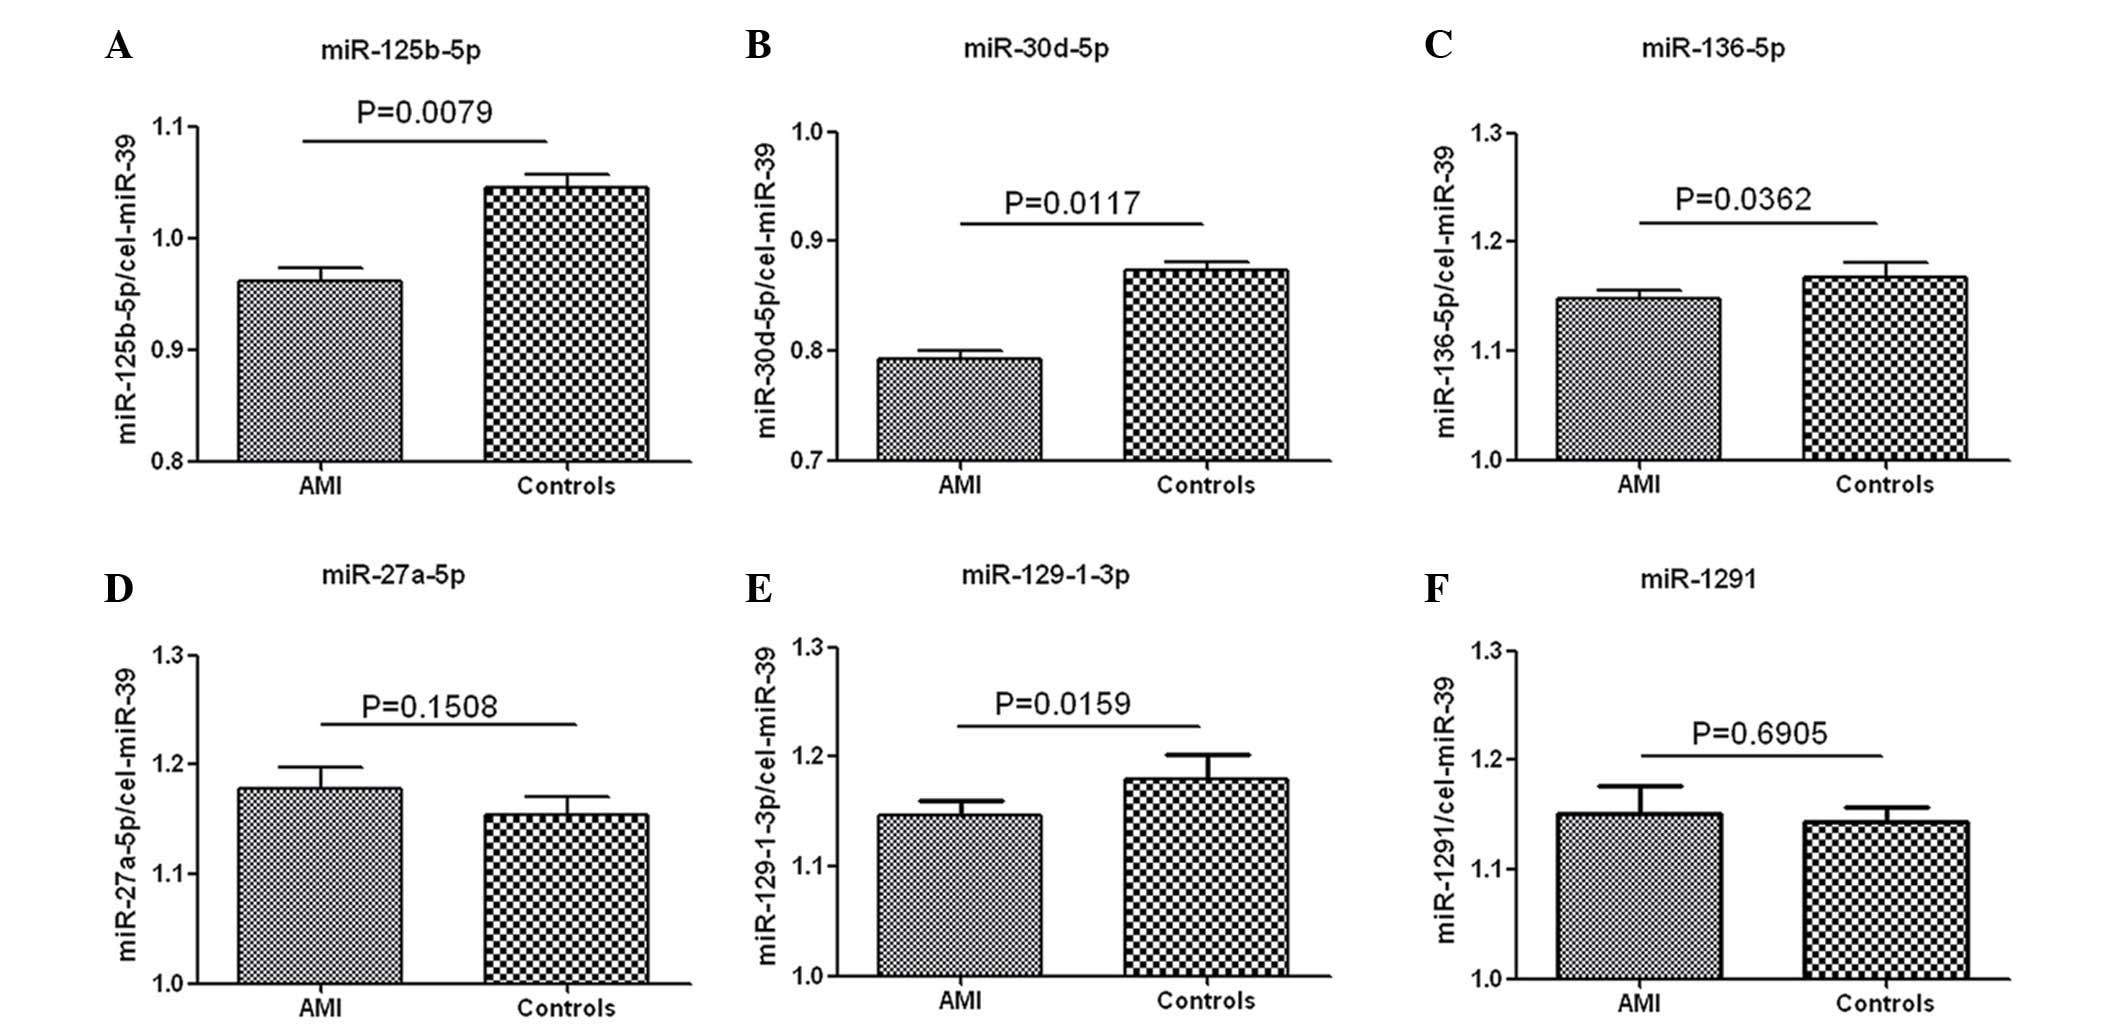
Among the 33 significantly differentially expressed
miRNAs in patients with AMI (n=3) and healthy controls (n=3), 4
upregulated (miR-125b-5p, miR-30d-5p, miR-136-5p, miR-129-1-3p) and
2 downregulated (miR-27a-5p and miR-1291) miRNAs were selected as
targets for further investigation based on previously published
data (14,23,24).
Their expression levels in samples from patients with AMI (n=5) and
healthy controls (n=5) were determined by RT-qPCR, with cel-miR-39
used as an internal control. As indicated in Fig. 4, fold-changes of miR-125b-5p,
miR-30d-5p, miR-136-5p and miR-129-1-3p were 4.46 (P=0.008), 4.29
(P=0.012), 1.42 (P=0.036) and 1.75 (P=0.016) while miR-27a-5p and
miR-1291 were 0.68 (P=0.151) and 0.93 (P=0.691), respectively.
According to the threshold value defined as fold-change ≥2.0 and
P<0.05, miR-125b-5p and miR-30d-5p were selected for further
investigation.
Clinical characteristics of the study
population
A total of 230 patients with ACS and 79 healthy
controls were assessed. Baseline characteristics of the ACS
patients at admission are provided in Table III. Gender distribution and
diastolic blood pressure were similar between the patients and the
healthy controls. However, compared with healthy controls, patients
with AMI and UAP were older, were more likely to be smokers, also
suffered from hypertension, diabetes and arrhythmia or had elevated
blood glucose, lipid, and uric acid levels, impaired renal
function, and decreased heart function (all P<0.05). In
addition, cTnI levels were higher in patients with AMI and UAP
compared with healthy controls (P<0.001).
Plasma miR-125b-5p and miR-30d-5p levels
in AMI, UAP and healthy control groups
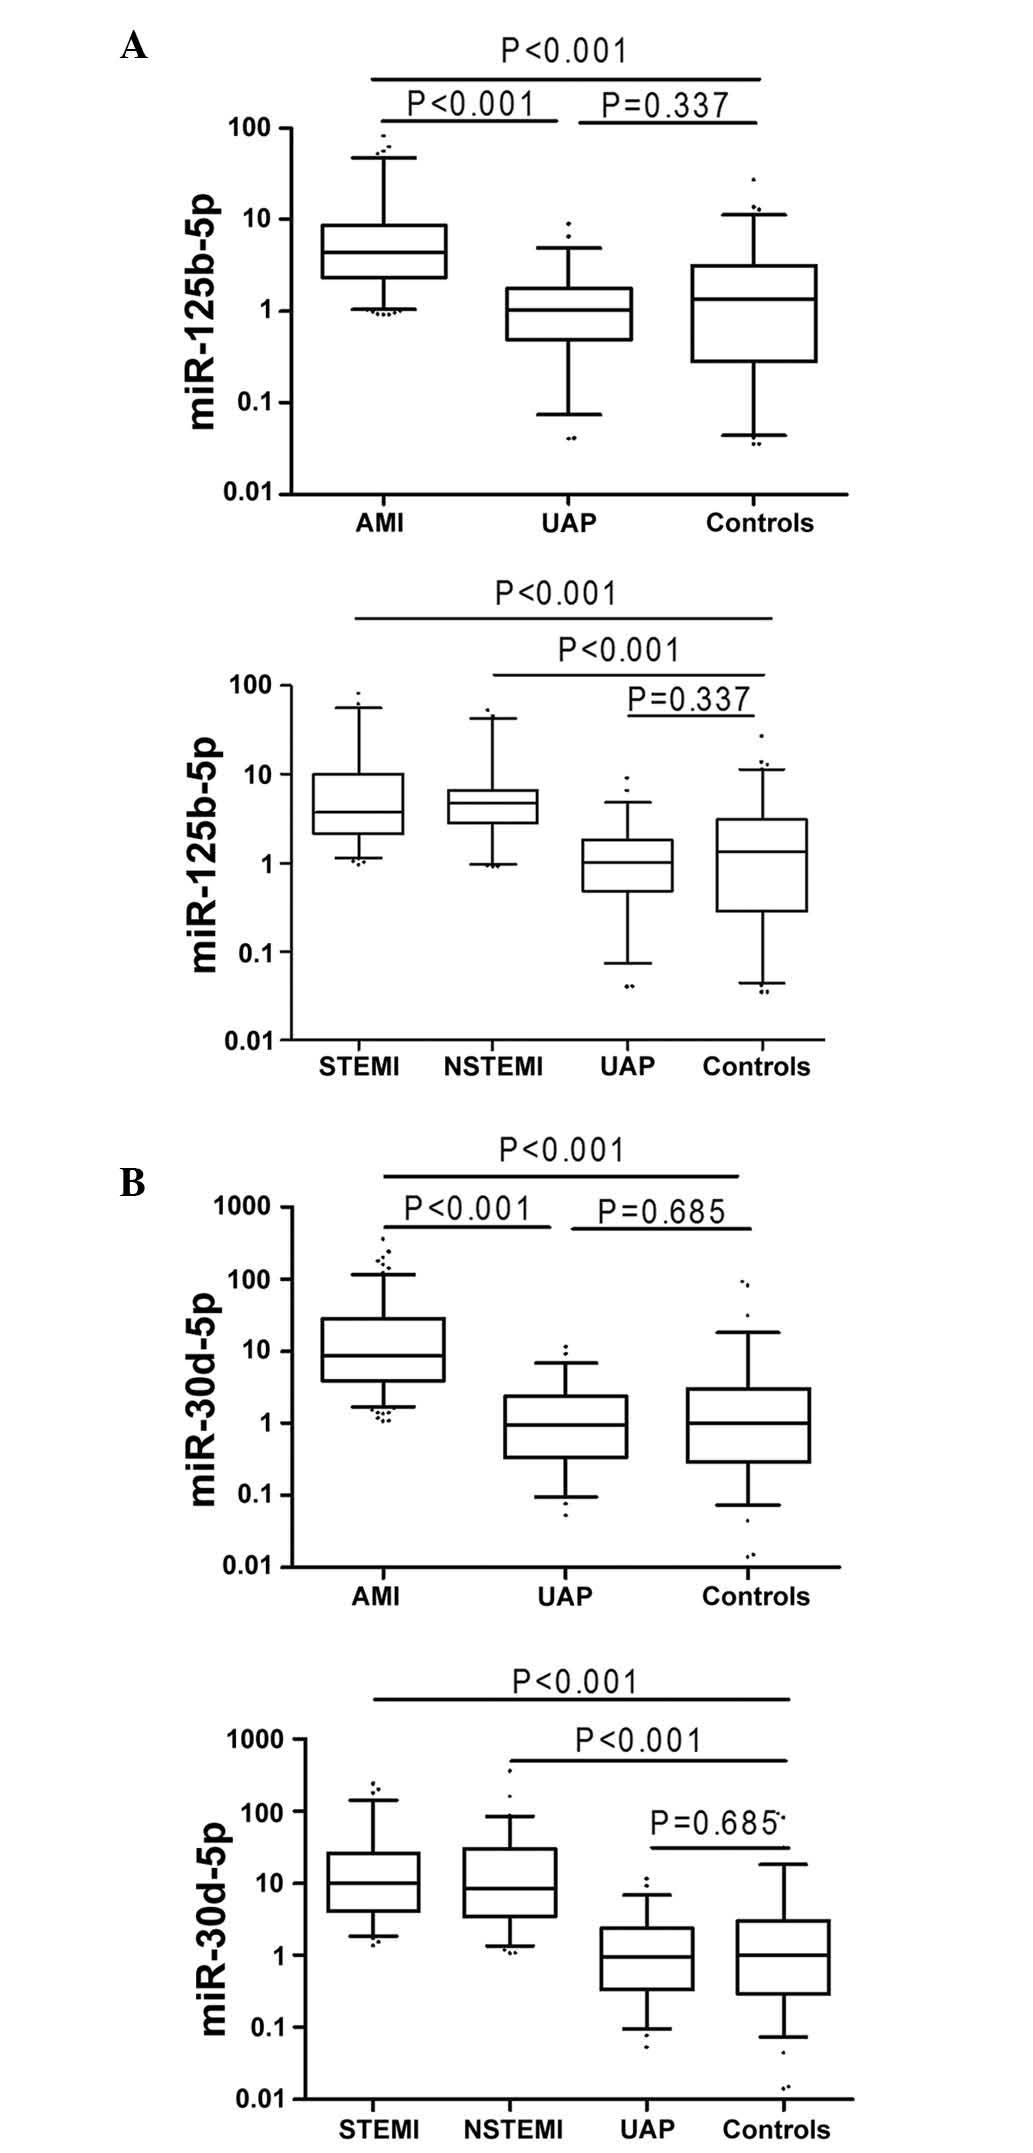
Plasma levels of miR-125b-5p and miR-30d-5p were
higher in patients with AMI compared with healthy controls (all
P<0.001; Fig. 5). Furthermore,
levels of miR-125b-5p and miR-30d-5p in plasma varied among the
following sub-groups: miR-125b-5p levels in the STEMI, NSTEMI and
UAP groups were 3.73, 4.68 and 1.02, while miR-30d-5p levels were
9.82, 8.29 and 0.95-fold higher than in healthy controls,
respectively (Fig. 5).
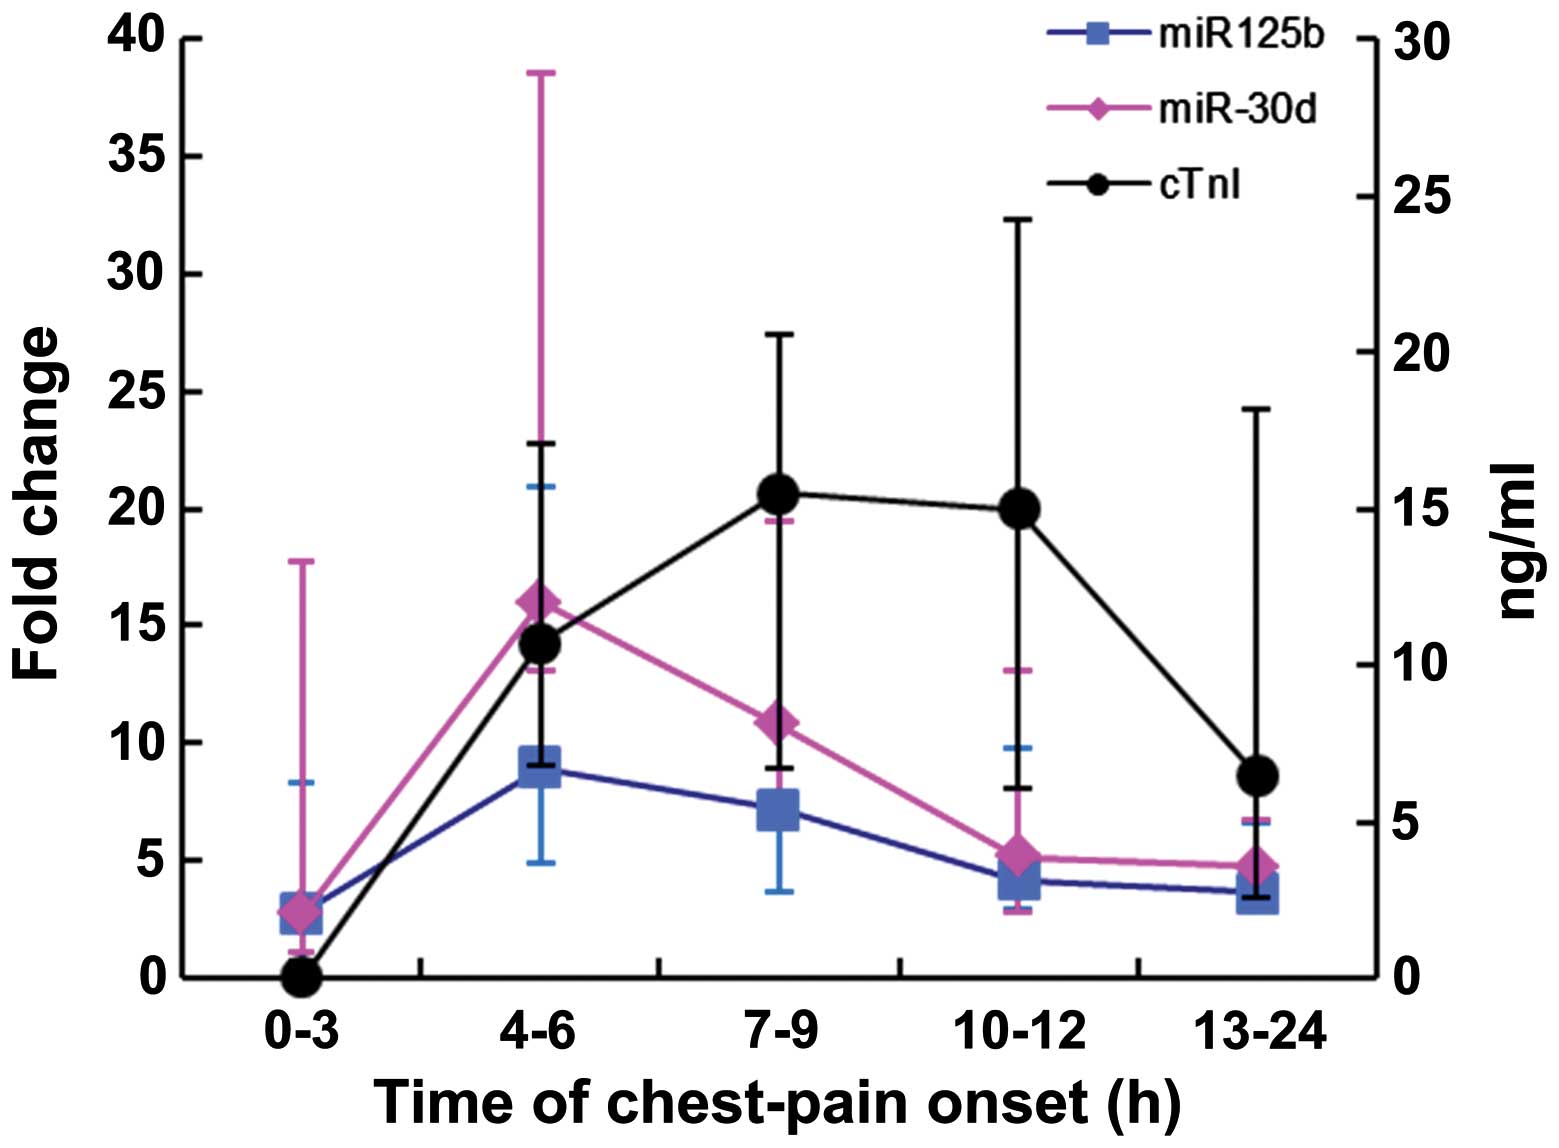
Changes of miR-125b-5p, miR-30d-5p and
cTnI levels at different time points following chest-pain onset in
AMI patients
As presented in Fig.
6, miR-125b-5p and miR-30d-5p were detected in AMI patients as
early as 3 h following chest pain onset. Notably, the expression
levels peaked at 3–6 h and then dropped following 9 h. Meanwhile,
cTnI peaked from 6–9 h and a decrease in levels followed at 12
h.
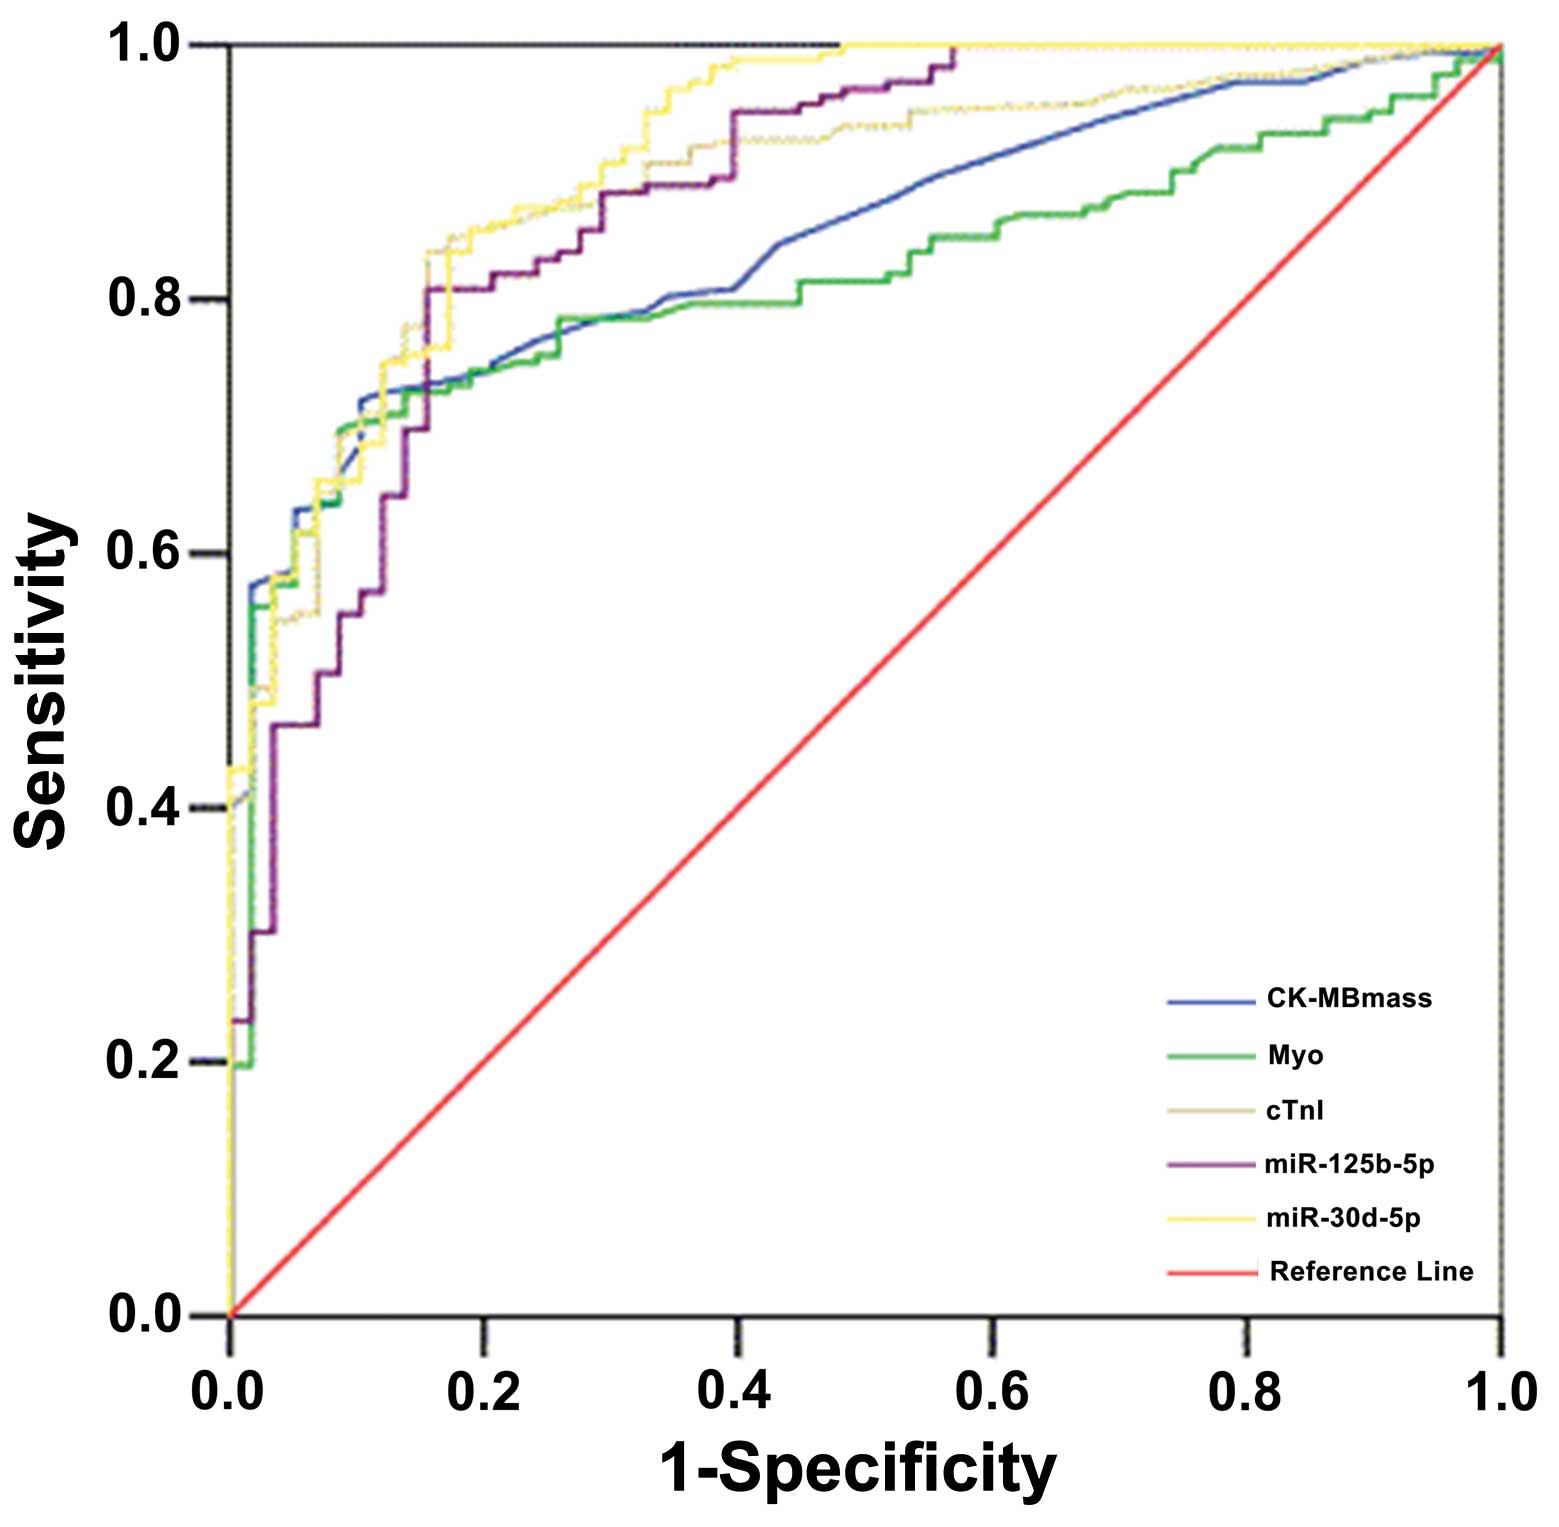
Specificity and sensitivity of
miR-125b-5p and miR-30d-5p as diagnostic biomarkers
ROC analysis was performed to assess whether
circulating miR-125b-5p and miR-30d-5p may be used as diagnostic
biomarkers for AMI. Fig. 7 and
Table IV indicates the ROC
analysis of CK-MB, Myo and cTnI. The higher area under the curve
(AUC) of miR-30d-5p may provide diagnostic information for patients
with AMI on admission, with the ability to distinguish AMI from
other diseases associated with chest pain. Based on these data,
miR-125b-5p is of a similar specificity and sensi tivity to cTnI;
however, miR-30d-5p exceeded the performance of cTnI. Therefore,
miR-125b-5p, and miR-30d-5p may be used to diagnose AMI in patients
admitted to the emergency room with symptoms of ACS.
| Table IVCardiac biomarkers on admission and
diagnostic values. |
Table IV
Cardiac biomarkers on admission and
diagnostic values.
| Variable | CK-MB (ng/ml) | Myo (ng/ml) | cTnI (ng/ml) | miR-125b-5p | miR-30d-5p |
|---|
| Cut-off value | 2.650 | 38.500 | 0.049 | 2.061 | 2.599 |
| Sensitivity (95%
CI) | 0.721
(0.686–0.802) | 0.698
(0.622–0.764) | 0.837
(0.772–0.887) | 0.808
(0.740–0.863) | 0.855
(0.791–0.902) |
| Specificity (95%
CI) | 0.897
(0.782–0.957) | 0.914
(0.803–0.968) | 0.845
(0.721–0.922) | 0.845
(0.721–0.922) | 0.810
(0.682–0.897) |
| PPV% (95% CI) | 95.385
(89.797–98.110) | 96.00
(90.447–98.518) | 94.118
(88.792–97.102) | 93.919
(88.427–97.004) | 93.038
(87.579–96.299) |
| NPV% (95% CI) | 52.00
(41.832–62.0130) | 50.476
(40.607–60.311) | 63.636
(51.827–74.074) | 59.756
(48.330–70.260) | 65.278
(53.056–75.857) |
| PLR (95% CI) | 6.969
(3.248–14.951) | 8.093
(3.481–18.815) | 5.395
(2.949–9.871) | 5.208
(2.844–9.536) | 4.506
(2.638–7.698) |
| NLR (95% CI) | 0.311
(0.244–0.397) | 0.331
(0.263–0.417) | 0.193
(0.136–0.272) | 0.227
(0.166–0.311) | 0.179
(0.124–0.260) |
| AUC (95% CI) | 0.848
(0.799–0.897) | 0.813
(0.758–0.869) | 0.889
(0.844–0.933) | 0.879
(0.826–0.931) | 0.915
(0.875–0.956) |
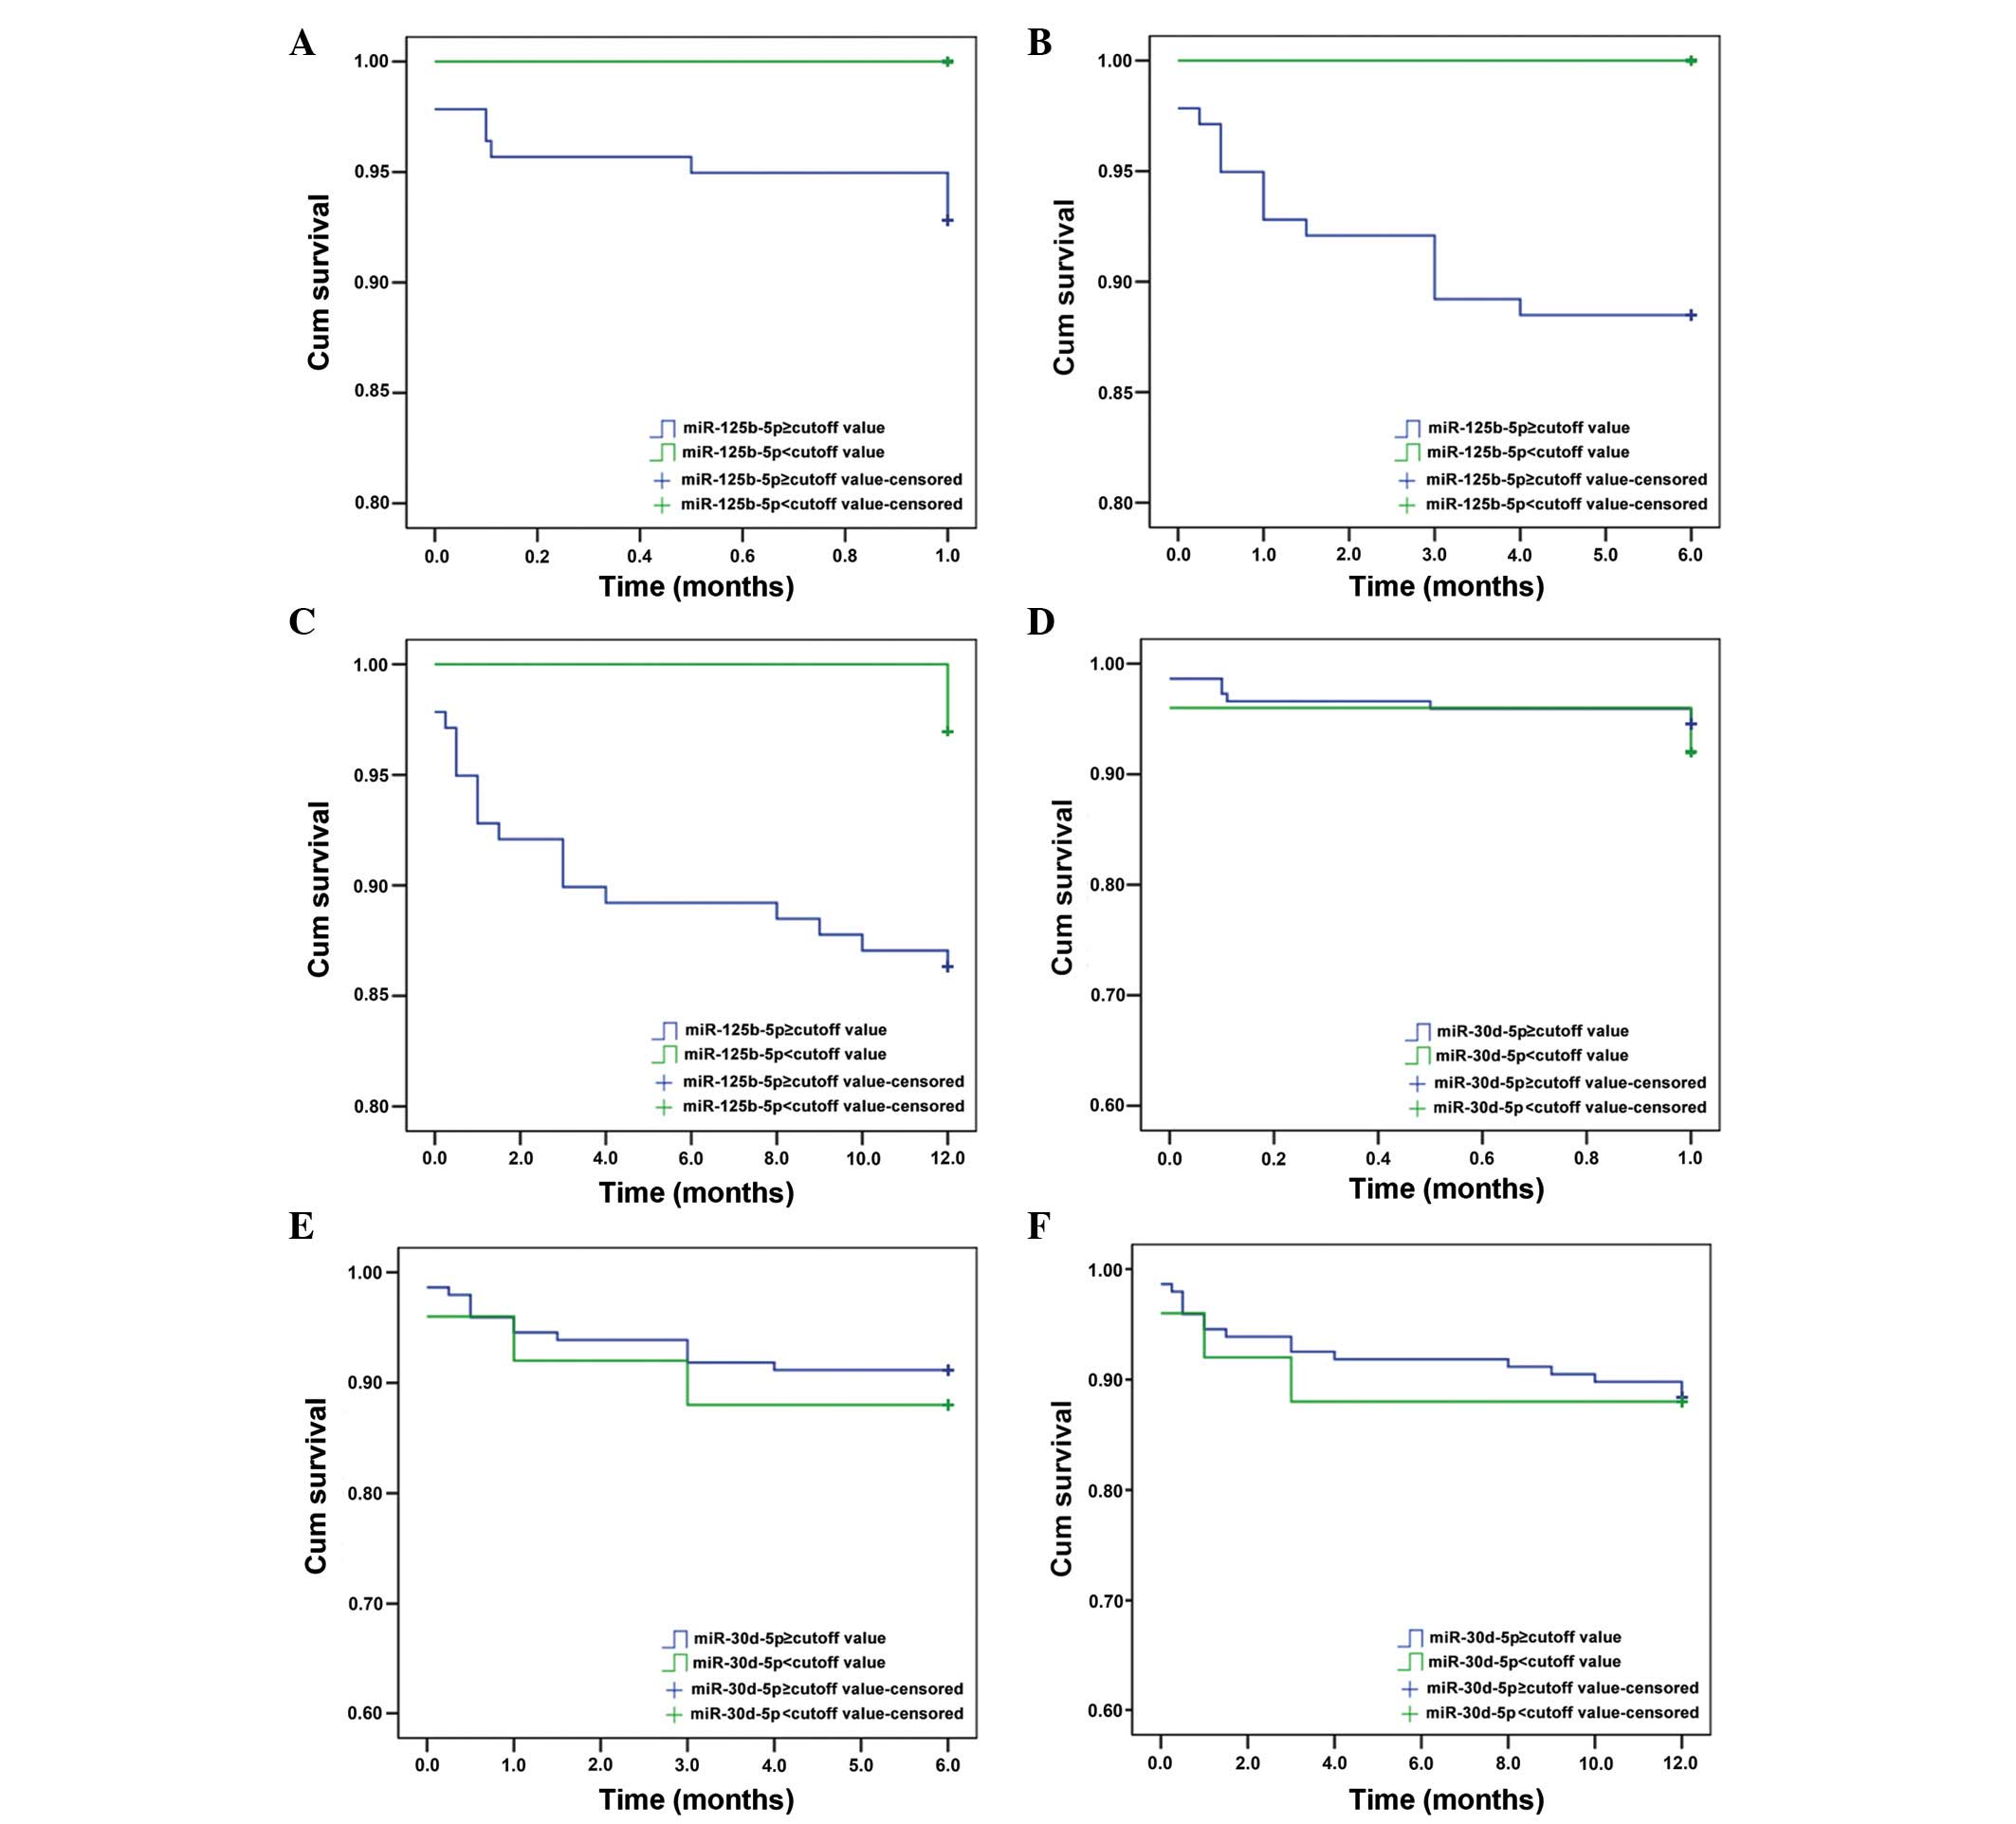
Prognostic value of miR-125b-5p and
miR-30d-5p
To further investigate the efficiency of miR-125b-5p
and miR-30d-5p as potential biomarkers of AMI, Kaplan-Meier
survival analysis was performed for patients with or without AMI.
Optimal cut-off values for miR-125b-5p and miR-30d-5p were
determined from the corresponding ROC curves to be 2.061 and 2.599,
respectively. Patients were then divided into positive (>cut-off
value) and negative (<cut-off value) groups. At 6 months, the
Kaplan-Meier curve predicted the miR-125b-5p-positive group to have
a lower cumulative survival rate than the negative group (P=0.045;
Fig. 8B), but there was no
significant difference for miR-30d-5p groups (Fig. 8).
Finally, Cox regression analysis was performed to
assess the risk factors involved in the prognosis of patients with
ACS. The levels of circulating miR-125b-5p and miR-30d-5p were not
significantly associated with the risk of endpoint events at 1, 6
and 12 months (Table V),
indicating that they may not reflect the prognosis in patients with
ACS.
| Table VCox regression analyses of MACE in
AMI patients. |
Table V
Cox regression analyses of MACE in
AMI patients.
| 1 month | 6 months | 12 months | | | | | | | |
|---|
| HR | P | 95% CI | HR | P | 95% CI | HR | P | 95% CI |
|---|
| Gender | 1.769 | 0.502 | 0.335–9.333 | 1.294 | 0.661 | 0.409–4.095 | 0.801 | 0.664 | 0.295–2.178 |
| Age | 1.000 | 0.997 | 0.946–1.057 | 1.030 | 0.221 | 0.982–1.081 | 1.023 | 0.305 | 0.979–1.069 |
| cTnI | 0.846 | 0.340 | 0.601–1.192 | 0.981 | 0.514 | 0.927–1.039 | 0.996 | 0.834 | 0.961–1.032 |
| miR-125b | 0.998 | 0.774 | 0.986–1.010 | 0.999 | 0.855 | 0.991–1.007 | 0.999 | 0.762 | 0.990–1.007 |
| miR-30d | 1.000 | 0.834 | 0.997–1.002 | 1.000 | 0.819 | 0.997–1.002 | 1.000 | 0.786 | 0.998–1.001 |
Discussion
The aim of the present study was to evaluate
circulating microRNAs and their suitability as AMI biomarkers in
patients with ACS. The results indicated that 33 miRNAs were
differentially expressed in patients with AMI and healthy controls.
Following validation based on previously published roles for these
miRNAs, six miRNAs were validated in an additional five patients
and healthy controls. Finally, miR-125b-5p and miR-30d-5p were
selected for a more detailed investigation with a larger sample
size. Plasma levels of miR-125b-5p and miR-30d-5p were higher in
patients with ACS compared with healthy controls (all P<0.001).
ROC curve analysis revealed miR-125b-5p and miR-30d-5p as
diagnostic predictors of AMI. Additionally, miR-30d-5p may have a
higher diagnostic value than cTnI. Patients with higher levels of
miR-125b-5p had poor prognosis compared with those with lower
levels.
In the present study, miR-125b-5p, miR-30d-5p,
miR-136-5p and miR-129-1-3p were upregulated, while miR-27a-5p and
miR-1291 were downregulated. These findings are supported by
previous studies demonstrating the involvement of circulating
microRNAs in AMI, including miR-486-3p, miR-150-3p, miR-126-3p,
miR-26a-5p, miR-191-5p, miR-133, miR-1291, miR-663b, miR-1,
miR-133a, miR-499 and miR-208a (15–18).
These miRNAs are associated with muscle tissues in general and more
specifically, cardiac muscle. Therefore, they were selected for
further validation. miR-125b-5p and miR-30d-5p were selected for
further investigation, and their expression was assessed in 230
patients with ACS and 79 healthy controls.
Routine biomarkers for AMI diagnosis include cTnI,
CK-MB mass and Myo (8,9). The sensitivity and specificity of
miR-125b-5p and miR-30d-5p was then compared with these existing
markers. ROC analysis yielded AUC of 0.848, 0.813, 0.889, 0.879 and
0.915, respectively, for CK-MB, Myo, cTnI, miR-125b-5p and
miR-30d-5p. The higher AUC of miR-30d-5p and miR-125b-5p may
provide diagnostic information for patients with AMI on admission,
with the ability to distinguish AMI from other diseases associated
with chest pain. Based on these data, miR-125b-5p is of a similar
specificity and sensitivity to cTnI; however, miR-30d-5p exceeded
the performance of cTnI. This suggests that miR-125b-5p, and
miR-30d-5p may be used for AMI diagnosis in patients admitted to
the emergency room with symptoms of ACS.
To determine the association between miR-125b-5p,
miR-30d-5p and cTnI and ACS onset, these markers were assessed in
patients with AMI at different times following the onset of chest
pain. Notably, miR-125b-5p and miR-30d-5p were detectable as early
as 3 h after the onset of chest-pain, and peaked at 3–6 h, prior to
decreasing at 9 h; meanwhile, cTnI peaked at 6–9 h and decreased
from 12 h. These results strongly suggest that the two miRNAs are
released earlier than cTnI. Therefore, these data highlight the
potential of the miRNAs as early biomarkers for myocardial injury
(25–27). Early diagnosis and treatment of AMI
significantly reduces mortality and improves long-term prognosis
(6) and the present findings
indicate that microRNAs may be superior to cTnI as AMI biomarkers,
despite similar AUC, sensitivity and specificity, thus may allow
for early diagnosis.
Despite an association between miR-125b-5p and
survival using Kaplan-Meier analyses, the present findings
indicated that miR-125b-5p and miR-30d-5p were not independently
associated with prognosis. The results suggest that miR-125b-5p and
miR-30d-5p may be used for the early diagnosis of AMI, but not for
prognosis. At present, the prognostic value of miRNAs is limited.
To the best of our knowledge, the current study is the first to
evaluate the prognostic value of miR-125b-5p in the emergency
department for patients with AMI.
Various limitations of the current study should be
addressed, including the following: i) This was a single-center
study, and the results may not be easily extrapolated to other
locations; ii) the kidneys are important in the clearance of
various molecules, and may affect the levels of miRNAs, thus making
a diagnosis inaccurate; iii) the areas of myocardial injury were
not systematically assessed in the patients sampled; and iv) the
follow-up period was short, thus there is a possibility that miRNAs
may be associated with long-term prognosis. However, further study
is required to address this issue.
The possible biological roles of circulatory
microRNAs following the onset of chest pain must be further
elucidated. However, considering the recent reports describing
cell-to-cell transport of miRNAs (28) and data describing miRNAs as
paracrine signaling molecules (29), it is possible that circulatory
miRNAs are not merely byproducts of myocardial necrosis, thus may
also have precise functions. This may point toward a
cardioprotective role for these miRNAs in the case of myocardial
infarction. These questions should be addressed thoroughly in
future studies.
In conclusion, the current study identified that
patients with AMI have distinct miRNA profiles compared with
healthy controls. In addition, miR-125b-5p and miR-30d-5p may be
used as potential early diagnostic biomarkers for AMI; however,
their prognostic value may be limited.
Acknowledgments
The present study was supported by a grant from the
Tianjin Natural Science Funds (grant no. 12JCYBJC17400), Tianjin
Binhai New Area Health Bureau (grant nos. 2011BHKZ003,
2013BWKY030), and Tianjin Health Bureau (grant no. 12KG139).
References
|
1
|
Kumar A and Cannon CP: Acute coronary
syndromes: Diagnosis and management, part I. Mayo Clin Proc.
84:917–938. 2009. View Article : Google Scholar : PubMed/NCBI
|
|
2
|
Anderson JL, Adams CD, Antman EM, Bridges
CR, Califf RM, Casey DE Jr, Chavey WE 2nd, Fesmire FM, Hochman JS,
Levin TN, et al: ACC/AHA 2007 guidelines for the management of
patients with unstable angina/non-ST-Elevation myocardial
infarction. J Am Coll Cardiol. 50:e1–e157. 2007. View Article : Google Scholar
|
|
3
|
Jneid H, Anderson JL, Wright RS, Adams CD,
Bridges CR, Casey DE Jr, Ettinger SM, Fesmire FM, Ganiats TG,
Lincoff AM, et al: 2012 ACCF/AHA focused update of the guideline
for the management of patients with unstable
angina/Non-ST-elevation myocardial infarction (updating the 2007
guideline and replacing the 2011 focused update. Circulation.
126:875–910. 2012. View Article : Google Scholar : PubMed/NCBI
|
|
4
|
Amsterdam EA, Wenger NK, Brindis RG, Casey
DE Jr, Ganiats G, Holmes DR Jr, Jaffe AS, Jneid H, Kelly RF, Kontos
MC, et al: 2014 AHA/ACC guideline for the management of patients
with non-ST-elevation acute coronary syndromes. J Am Coll Cardiol.
64:e139–228. 2014. View Article : Google Scholar : PubMed/NCBI
|
|
5
|
Braunwald E: Unstable angina and non-ST
elevation myocardial infarction. Am J Respir Crit Care Med.
185:924–932. 2012. View Article : Google Scholar
|
|
6
|
White HD and Chew DP: Acute myocardial
infarction. Lancet. 372:570–584. 2008. View Article : Google Scholar : PubMed/NCBI
|
|
7
|
Chieffo A, Buchanan GL, Mauri F, Mehilli
J, Vaquerizo B, Moynagh A, Mehran R and Morice MC: ACS and STEMI
treatment: Gender-related issues. EuroIntervention. 8(Suppl P):
P27–P35. 2012. View Article : Google Scholar : PubMed/NCBI
|
|
8
|
Bellbhudder U and Stanfliet JC: Clinicians
ignore best practice guidelines: Prospective audit of cardiac
injury marker ordering in patients with chest pain. S Afr Med J.
104:305–306. 2014. View Article : Google Scholar : PubMed/NCBI
|
|
9
|
Ozturk G, Tavil B, Ozguner M, Ginis Z,
Erden G, Tunc B, Azik MF, Uckan D and Delibas N: Evaluation of
Cardiac Markers in Children Undergoing Hematopoietic Stem Cell
Transplantation. J Clin Lab Anal. 29:259–262. 2015. View Article : Google Scholar
|
|
10
|
Jaffe AS, Ravkilde J, Roberts R, Naslund
U, Apple FS, Galvani M and Katus H: It's time for a change to a
troponin standard. Circulation. 102:1216–1220. 2000. View Article : Google Scholar : PubMed/NCBI
|
|
11
|
Omland T, de Lemos JA, Sabatine MS,
Christophi CA, Rice MM, Jablonski KA, Tjora S, Domanski MJ, Gersh
BJ, Rouleau JL, et al: Prevention of Events with Angiotensin
Converting Enzyme Inhibition (PEACE) Trial Investigators: A
sensitive cardiac troponin T assay in stable coronary artery
disease. N Engl J Med. 361:2538–2547. 2009. View Article : Google Scholar : PubMed/NCBI
|
|
12
|
Devaux Y, Vausort M, Goretti E, Nazarov
PV, Azuaje F, Gilson G, Corsten MF, Schroen B, Lair ML, Heymans S
and Wagner DR: Use of circulating microRNAs to diagnose acute
myocardial infarction. Clin Chem. 58:559–567. 2012. View Article : Google Scholar : PubMed/NCBI
|
|
13
|
Keller T, Zeller T, Peetz D, Tzikas S,
Roth A, Czyz E, Bickel C, Baldus S, Warnholtz A, Fröhlich M, et al:
Sensitive troponin I assay in early diagnosis of acute myocardial
infarction. N Engl J Med. 361:868–877. 2009. View Article : Google Scholar : PubMed/NCBI
|
|
14
|
Wang GK, Zhu JQ, Zhang JT, Li Q, Li Y, He
J, Qin YW and Jing Q: Circulating microRNA: A novel potential
biomarker for early diagnosis of acute myocardial infarction in
humans. Eur Heart J. 31:659–666. 2010. View Article : Google Scholar : PubMed/NCBI
|
|
15
|
Hsu A, Chen SJ, Chang YS, Chen HC and Chu
PH: Systemic approach to identify serum microRNAs as potential
biomarkers for acute myocardial infarction. BioMed Res Int.
2014:4186282014. View Article : Google Scholar : PubMed/NCBI
|
|
16
|
Peng L, Chun-guang Q, Bei-fang L, Xue-zhi
D, Zi-hao W, Yun-fu L, Yan-ping D, Yang-gui L, Wei-guo L, Tian-yong
H and Zhen-wen H: Clinical impact of circulating miR-133, miR-1291
and miR-663b in plasma of patients with acute myocardial
infarction. Diagn Pathol. 9:892014. View Article : Google Scholar : PubMed/NCBI
|
|
17
|
Hunter MP, Ismail N, Zhang X, Aguda BD,
Lee EJ, Yu L, Xiao T, Schafer J, Lee ML, Schmittgen TD, et al:
Detection of microRNA expression in human peripheral blood
microvesicles. PLoS One. 3:e36942008. View Article : Google Scholar : PubMed/NCBI
|
|
18
|
Hu SJ, Ren G, Liu JL, Zhao ZA, Yu YS, Su
RW, Ma XH, Ni H, Lei W and Yang ZM: MicroRNA expression and
regulation in mouse uterus during embryo implantation. J Biol Chem.
283:23473–23484. 2008. View Article : Google Scholar : PubMed/NCBI
|
|
19
|
Dweep H and Gretz N: miRWalk2.0: A
comprehensive atlas of microRNA-target interactions. Nat Methods.
12:6972015. View Article : Google Scholar : PubMed/NCBI
|
|
20
|
Schmittgen TD and Livak KJ: Analyzing
real-time PCR data by the comparative C(T) method. Nat Protoc.
3:1101–1108. 2008. View Article : Google Scholar : PubMed/NCBI
|
|
21
|
Fichtlscherer S1, De Rosa S, Fox H,
Schwietz T, Fischer A, Liebetrau C, Weber M, Hamm CW, Röxe T and
Müller-Ardogan M: et al Circulating microRNAs in patients with
coronary artery disease. Circ Res. 107:677–684. 2010. View Article : Google Scholar : PubMed/NCBI
|
|
22
|
Kroh EM, Parkin RK, Mitchell PS and Tewari
M: Analysis of circulating microRNA biomarkers in plasma and serum
using quantitative reverse transcription-PCR (qRT-PCR). Methods.
50:298–301. 2010. View Article : Google Scholar : PubMed/NCBI
|
|
23
|
Meder B, Keller A, Vogel B, Haas J,
Sedaghat-Hamedani F, Kayvanpour E, Just S, Borries A, Rudloff J,
Leidinger P, et al: MicroRNA signatures in total peripheral blood
as novel biomarkers for acute myocardial infarction. Basic Res
Cardiol. 106:13–23. 2011. View Article : Google Scholar
|
|
24
|
Bostjancic E, Zidar N and Glavac D:
MicroRNA microarray expression profiling in human myocardial
infarction. Dis Markers. 27:255–268. 2009. View Article : Google Scholar
|
|
25
|
Iguchi H, Kosaka N and Ochiya T: Secretory
microRNAs as a versatile communication tool. Commun Integr Biol.
3:478–481. 2010. View Article : Google Scholar : PubMed/NCBI
|
|
26
|
Zampetaki A, Willeit P, Drozdov I, Kiechl
S and Mayr M: Profiling of circulating microRNAs: From single
biomarkers to re-wired networks. Cardiovasc Res. 93:555–562. 2012.
View Article : Google Scholar :
|
|
27
|
Gidlöf O, Andersson P, van der Pals J,
Götberg M and Erlinge D: Cardiospecific microRNA plasma levels
correlate with troponin and cardiac function in patients with ST
elevation myocardial infarction, are selectively dependent on renal
elimination, and can be detected in urine samples. Cardiology.
118:217–226. 2011. View Article : Google Scholar : PubMed/NCBI
|
|
28
|
Valadi H, Ekström K, Bossios A, Sjöstrand
M, Lee JJ and Lötvall JO: Exosome-mediated transfer of mRNAs and
microRNAs is a novel mechanism of genetic exchange between cells.
Nat Cell Biol. 9:654–659. 2007. View
Article : Google Scholar : PubMed/NCBI
|
|
29
|
Zernecke A, Bidzhekov K, Noels H,
Shagdarsuren E, Gan L, Denecke B, Hristov M, Köppel T, Jahantigh
MN, Lutgens E, et al: Delivery of microRNA-126 by apoptotic bodies
induces CXCL12-dependent vascular protection. Sci Signal.
2:ra812009. View Article : Google Scholar : PubMed/NCBI
|