Introduction
Of all the workers exposed worldwide to man-made
sources of ionizing radiation, medical radiation workers represent
the largest group. Although the exposure levels in these subjects
are generally low and in any case below the regulatory limit of 20
mSv per year, diagnostic procedures used in nuclear medicine and
interventional cardiology/radiology can still represent a source of
relatively high occupational exposure (1,2).
In nuclear medicine the highest exposures occur
during the handling and administration to patients of fluorine-18
fluorodeoxyglucose (18F-FDG) for positron emission tomographic
(PET) imaging. In the medical application of X-rays, the highest
exposures are associated with interventional procedures in
interventional radiology/cardiology, necessitating fluoroscopy and
cinefluorographic examinations. The occupational dose of staff
working in interventional radiology/cardiology remains high despite
the wearing of lead aprons. Workers receive doses from scattered
radiation and the transmission of a small percentage of primary
x-rays through the apron, and additionally, part of the body is
unshielded. In interventional cardiology, the continuous
developments in catheter device technology and procedures enable
more challenging clinical indications to be handled. As a result,
the number of interventional procedures, in addition to their
complexity, increases together with the potential for
interventional operators to receive higher doses of ionizing
radiation (3). This raises some
concern as epidemiological studies have indicated that medical
radiation workers may show increased mortality due to leukemia and
other neoplasias (4).
Ionizing radiation is a potent mutagen and inducer
of chromosomal aberrations, which are correlated with genetic
alterations that may trigger the development of cancer. Chromosomal
damage in peripheral blood lymphocytes induced by ionizing
radiation can be assessed by cytogenetic techniques, such as the
dicentric assay and the micronucleus assay. Cytogenetic studies
performed on hospital workers occupationally exposed to low doses
of ionizing radiation have indicated that even in cases where the
levels of radiation received through occupational exposure were
under regulatory limits, as registered by personal dosimetry,
increased cytogenetic damage was observed, compared with the
non-exposed subjects. By using chromosomal damage as 'effect'
biomarker, cytogenetic biomonitoring provides important additional
information which complements physical dosimetry and enables better
evaluation of the health effects of radiation (1,2,4–7).
Although cytogenetic analysis of dicentric formation
is the gold standard for biological dosimetry, application of this
technique for the biomonitoring of relatively large groups of
radiation workers is not ideal, as dicentric analysis is complex,
time consuming and requires highly skilled personnel. By contrast,
the cytokinesis-block micronucleus (MN) assay is less laborious and
presents a viable alternative for large-scale screening. The only
disadvantage of this assay compared with the dicentric assay is the
high frequency of background spontaneous micronuclei, making this
technique less sensitive for the detection of low dose exposures
(detection limit of 0.2–0.3 Gy) (8). However, combination of the MN assay
with fluorescent in situ hybridisation (FISH) using a
pan-centromeric probe enables discrimination between
radiation-induced centromere-negative MN (MNCM−), resulting mainly
from acentric fragments, and spontaneous centromere-positive MN
(MNCM+), which predominantly contain lagging chromosomes. Scoring
of MNCM− has substantially increased the sensitivity of the
technique for the biomonitoring of radiation workers (4). Although the FISH-based MN-centromere
assay is more expensive and time consuming, new developments in
FISH technology and the availability of computerized cytogenetic
image analysis systems have overcome this problem. The
semi-automated MN-centromere assay recently optimized by our
research group combines high-speed MN analysis with a more accurate
assessment of radiation damage in the low dose range (0.05–0.1 Gy),
comparable to the dicentric assay. These characteristics of the
semi-automated MN-centromere assay are of special interest for
large-scale radiation exposure applications (9).
The aim of the present study was to perform a
cytogenetic analysis by means of the semi-automated MN-centromere
assay in the peripheral blood lymphocytes (PBL) of medical
radiation workers occupationally exposed to low doses of ionizing
radiation (below the regulatory limits). Two groups of medical
workers that receive the highest doses at their workplace were
selected: Nuclear medicine technologists (NMTs) involved in PET
applications and interventional cardiologists/radiologists. The MN
data obtained from these workers were compared with a group of
non-exposed, matched control individuals. The blood samples of the
control individuals were additionally used to construct a 'low
dose' (0–100 mGy) MN dose-response curve to evaluate the
sensitivity of the MN assay in the low dose range and its
suitability as bio-dosimeter in medical surveillance programs. For
both groups of radiation workers, physical dosimetry data were
collected for the interpretation of the MN data: Personal
equivalent dose Hp(10) values for
the nuclear medicine technicians and effective dose E values for
the interventional X-ray workers. The results from the present
study support the importance of cytogenetic analysis, in addition
to physical dosimetry, as a routine biomonitoring method in medical
radiation workers with the highest occupational radiation
burdens.
Materials and methods
Study population
For the present study two groups of medical
radiation workers were selected: 10 NMTs and 10 interventional
radiation workers (IRW). The NMT group was recruited from the
following hospitals: University Hospital St-Luc, Iris Hospitals
South, St-Anne St-Rémi Clinic (all Brussels, Belgium) and AZ St-Jan
(Bruges, Belgium). The IRW group consisted of cardiologists and
radiologists working in the following hospitals: Mont-Godinne
Clinic (Yvoir, Belgium), Brugmann University Hospital (Brussels,
Belgium), Hospital Oost-Limburg, Ghent University Hospital (Ghent,
Belgium) and St-Luc (Brussels, Belgium). Two control groups, one
for each category of exposed medical radiation workers
(CONNMT and CONIRW), were comprised of age-
and gender-matched individuals and included 19 subjects working in
the same hospitals, however, with no history of exposure to
ionizing radiation.
The study was approved by the ethics committee of
St-Luc Clinical University (Brussels, Belgium). All participants
were volunteers and each individual was provided with sufficient
information to give an informed consent. None of the participants
had undergone X-ray or isotope examinations during the previous 5
years, or had been exposed to other carcinogenic or mutagenic
agents at work. None of the participants had experienced major
medical problems or conditions during the previous 5 years. There
was one smoker in the exposed group and one in the control group.
The mean age of the NMT group, consisting of 4 males and 6 females,
was 46.4 years (range: 26–64) compared with 45.7 years (range:
31–62) for the corresponding control group. The mean age of the IRW
group (10 males) was 47.8 years (range: 41–60) compared with 47.5
years (range: 42–56) for the controls. The age of the participants
in the study ranged from 26–64 years. Heparinized blood samples
from the radiation workers and matched controls were taken by
venipuncture at the same time. Blood samples of the worker/control
pairs were collected and coded in the Occupational Medicine
Service, Centre de Services Interentreprises (CESI; University
Hospital St-Luc, Iris Hospitals South, St-Anne St-Rémi Clinic and
Mont-Godinne Clinic) and sent to the biodosimetry laboratory at
Ghent University (Ghent, Brussels) for cytogenetic analysis.
Dosimetry records
The occupational radiation doses received in the
years prior to the blood sampling performed in the present study
had been routinely monitored by film badge personal dosimetry. In
the case of nuclear medicine workers the dose estimates,
Hp(10), are based on the monthly
readings from personal dosimeters fixed at chest height to the
hospital apron of the workers. Determination of the radiation doses
of the IRWs was performed by double dosimetry to compensate for the
fact that part of the body is shielded by the lead apron and part
of the body remains unshielded. One dosimeter was worn underneath
the lead apron at chest or waist height, resulting in a dose under
the apron, Hp,u(10), and the
other is worn above the apron at chest height, resulting in a dose
above the apron, Hp,o(10). The
readings were combined to obtain the effective dose E using the
algorithm E=0.79 Hp,u(10) + 0.100
Hp,o(10) (10). This algorithm takes into account
organs and weighting factors from the International Commission on
Radiological Protection (11).
Personal dosimetry records for the 3 years preceding
the blood sampling were collected for each radiation worker
belonging to the study cohort. Dosimetry records older than 3 years
were not collected, as unstable chromosome aberrations such as
dicentrics and MN have an in vivo half-life of approximately
1 year. In addition, Thierens et al (12) reported that chromosomal damage
induced greater than 3 years ago had almost completely
disappeared.
Semi-automated MN centromere assay
Cell culture and MN-centromere
assay
The day of blood sampling, two 5 ml whole blood
cultures were set up per sample containing 0.3 ml blood in Roswell
Park Memorial Institute 1640 medium with L-glutamine and 25 mM
4-(2-hydroxyethyl)-1-piperazineethanesulfonic acid buffer (HEPES)
(Gibco; Thermo Fisher Scientific, Inc., Waltham, MA, USA)
supplemented with 10% fetal calf serum (Gibco; Thermo Fisher
Scientific, Inc.) and 100 µl phytohaemagglutinin (PHA; stock
solution 1 mg/ml) (Sigma-Aldrich, St Louis, MO, USA) used as a
mitogen. At 23 h later, cytochalasin B (6 µg/ml,
Sigma-Aldrich) was added to block cytokinesis. Cells were harvested
70 h following stimulation with PHA using a cold (4°C) hypotonic
shock with 0.075 M KCl (Merck Millipore, Darmstadt, Germany). This
was followed by fixation in a solution containing methanol, acetic
acid and ringer (0.9% NaCl) (4:1:5) and a further fixation in
methanol, acetic acid (4:1; Merck Millipore) for three times
(13). Cell suspensions were added
dropwise onto clean slides. All slides were prepared in duplicate
per culture and coded. For the analysis of centromere-negative MN,
slides were dehydrated in alcohol series (70–90–100% ethanol)
(Merck Millipore) and left to dry for 15 min prior to performing
FISH with a home-tailored probe based on PCR technology. The
details of the pan-centromeric probe production, dilution and
labelling [Nick Translation method, Spectrum Orange (SpOr)] have
been previously described in detail (9). For in situ hybridisation, 20
µl of the home-tailored probe was placed onto a coverslip
and applied to the slide. Probe and target DNAs were then denatured
at 76°C for 5 min and hybridised for 20 h at 38°C using a
ThermoBrite Temperature controlled slide processing system (Abbott
Molecular, Des Plaines, IL, USA). Following hybridisation, the
slides were placed in 2X saline sodium citrate (SSC) for 5 min to
allow detachment of the coverslip. Post-hybridisation washing was
performed in 0.4X SSC/0.1% Tween at 72°C (1 min) and in 2X SSC at
room temperature (5 min). Finally, the slides were mounted with
Vectashield containing 4′,6-diamidino-2-phenylindole (DAPI) (Vector
Laboratories, Inc., Burlingame, CA, USA).
Blood samples from 16 of the 19 control individuals
were used to set up an in vitro 'low-dose' dose-response
curve. For this, each blood sample was divided in four parts. One
part was used as a sham-irradiated control while the others were
exposed to 20, 50 and 100 mGy of 60Co γ-rays at a dose
rate of 0.1 Gy/min. For each dose point, two cultures were set up
and processed as described above for MN-centromere analysis.
Semi-automated MN-centromere
scoring
Microscopic analysis was conducted using a Metafer 4
platform (MetaSystems GmbH, Altlussheim, Germany) connected to a
motorized Zeiss AxioImager M1 microscope (Zeiss, Oberkochen,
Germany). Detailed information regarding the MSearch slide scanning
procedure, stage movement, focusing and image acquisition are
detailed in Willems et al (13) and Schunck et al (14).
First, automated MN scoring in binucleate (BN) cells
on DAPI-FISH stained slides was performed using a 10x objective, a
DAPI filter and the Msearch and MNScore modules of MetaSystems
(13). Secondly, all BN cells that
were detected by MSearch were visually checked in the image gallery
and BN cells with confirmed MN were marked for AutoCapt analysis.
With the AutoCapt image acquisition software, the marked cells were
relocated from the Metafer position list using a 40x objective and
image acquisition was performed with two colour channels (DAPI,
SpOr). The two colour images were shown on the display and in the
image gallery, and the MN were manually checked for the presence of
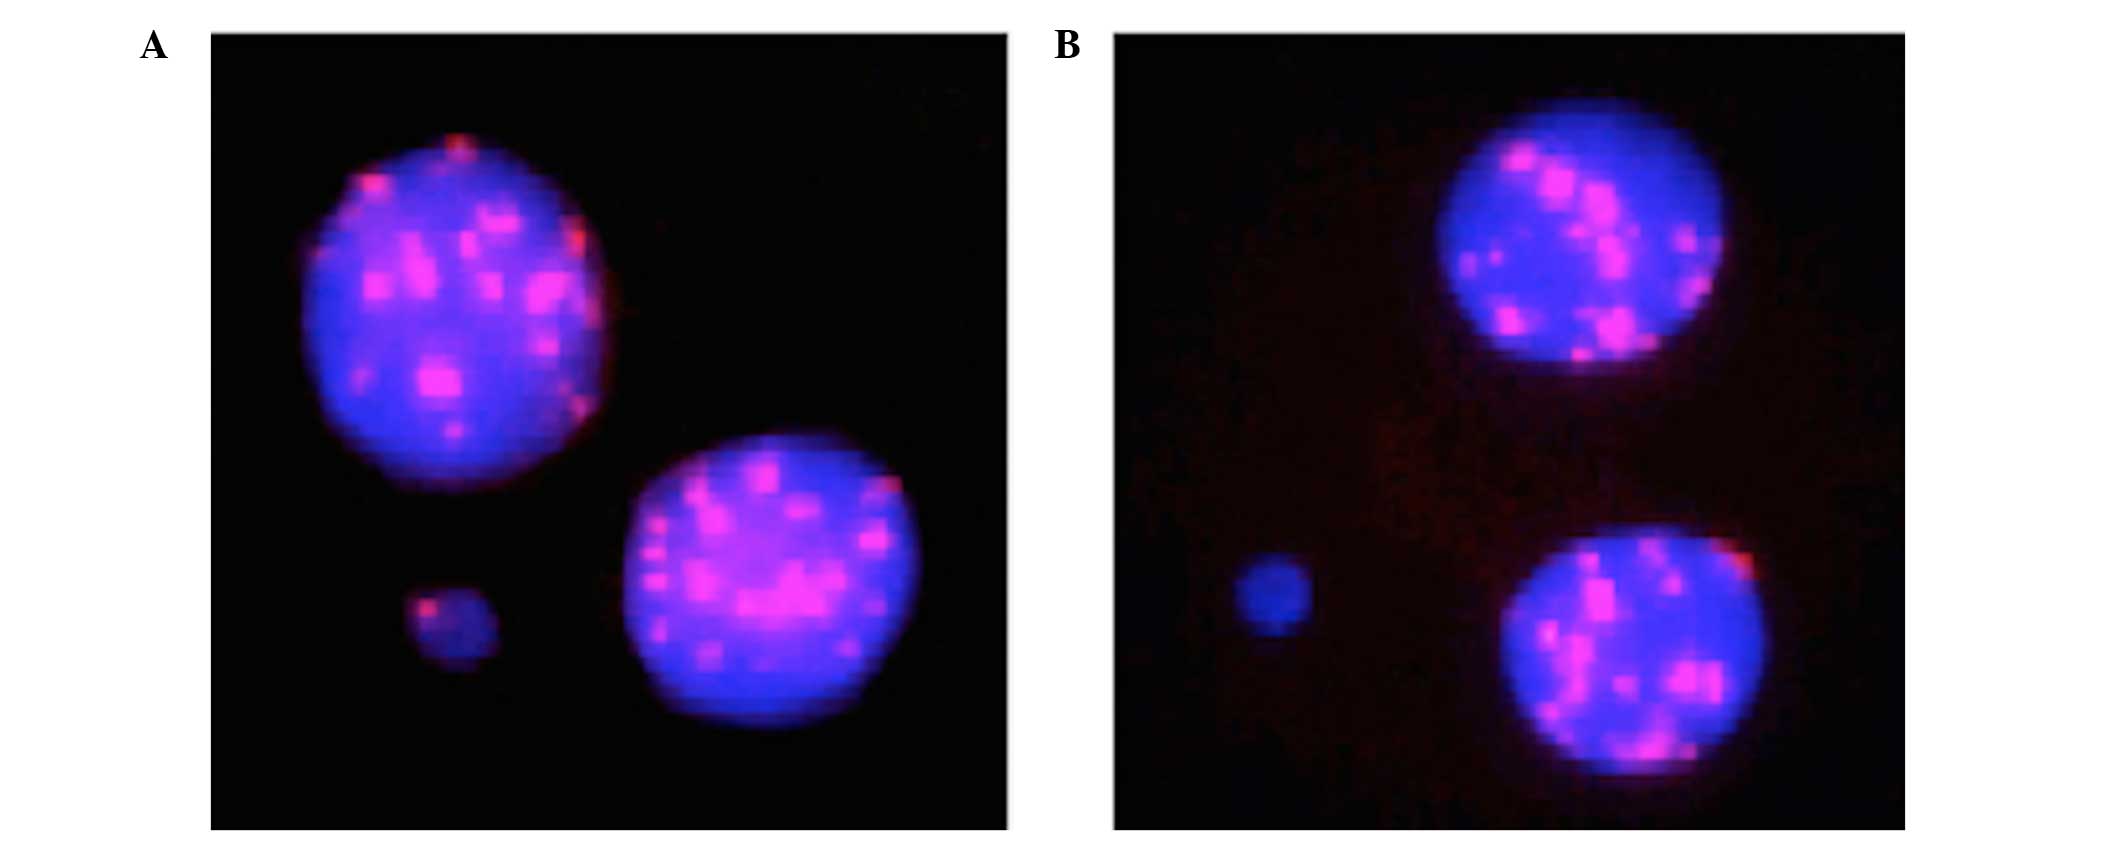
centromeres. Fig. 1 presents an
example of a BN cell with a centromere-positive MN (MNCM+)
containing a whole chromosome and a BN cell with a
centromere-negative MN (MNCM−) consisting of an acentric
fragment.
Semi-automated analysis of MN in FISH-DAPI stained
slides, as described above, was performed to score the total number
of MN (MN total), the number of MNCM− and MNCM+ in the
non-irradiated and irradiated samples from the workers and healthy
controls. Between 2,000 and 6,000 BN cells were scored per
condition.
Statistical analysis
All MN values are presented as the mean per 1,000 BN
cells ± standard error of the mean. The personal dosimetry data is
presented as the mean (mSv) ± standard deviation. Statistical
analysis of the data was performed using SPSS software, version
23.0 (IBM SPSS, Armonk, MY, USA). Differences in the MN yields
between in vitro doses were analysed by a Wilcoxon
signed-rank test (intra-group analysis). For difference in MN yield
between two or more groups the Wilcoxon rank-sum test and the
Kruskal-Wallis test were used, respectively. Agreement between
dose-response fits and experimental data was quantified by the
regression coefficient R2. P≤0.05 was considered to
indicate a statistically significant difference.
Results
In vitro MN dose response curves
Blood samples from the 16 healthy control
individuals (10 males, 6 females) were used to set up a
dose-response curve in the low dose region. The mean dose-response
data for MN total, MNCM− and MNCM+ are presented in Table I.
 | Table ITotal number of BN cells scored per
dose for the 16 control individuals together with the mean MN
scores and SEM for MN total (per 1,000 BN cells), MNCM− and
MNCM+. |
Table I
Total number of BN cells scored per
dose for the 16 control individuals together with the mean MN
scores and SEM for MN total (per 1,000 BN cells), MNCM− and
MNCM+.
| Dose (mGy) | Total BN | MN total | SEM | MNCM− (per 1,000 BN
cells) | SEM | MNCM− (%) | MNCM+ (per 1,000 BN
cells) | SEM | MNCM+ (%) |
|---|
| 0 | 52252 | 12.84 | 1.53 | 2.65 | 0.29 | 21 | 10.19 | 1.45 | 79 |
| 20 | 50301 | 13.74 | 1.22 | 3.30 | 0.31 | 24 | 10.44 | 1.19 | 76 |
| 50 | 49964 | 14.36 | 1.29 | 4.27 | 0.50 | 30 | 10.09 | 1.17 | 70 |
| 100 | 46945 | 18.18 | 1.17 | 6.68 | 0.50 | 37 | 11.50 | 1.05 | 63 |
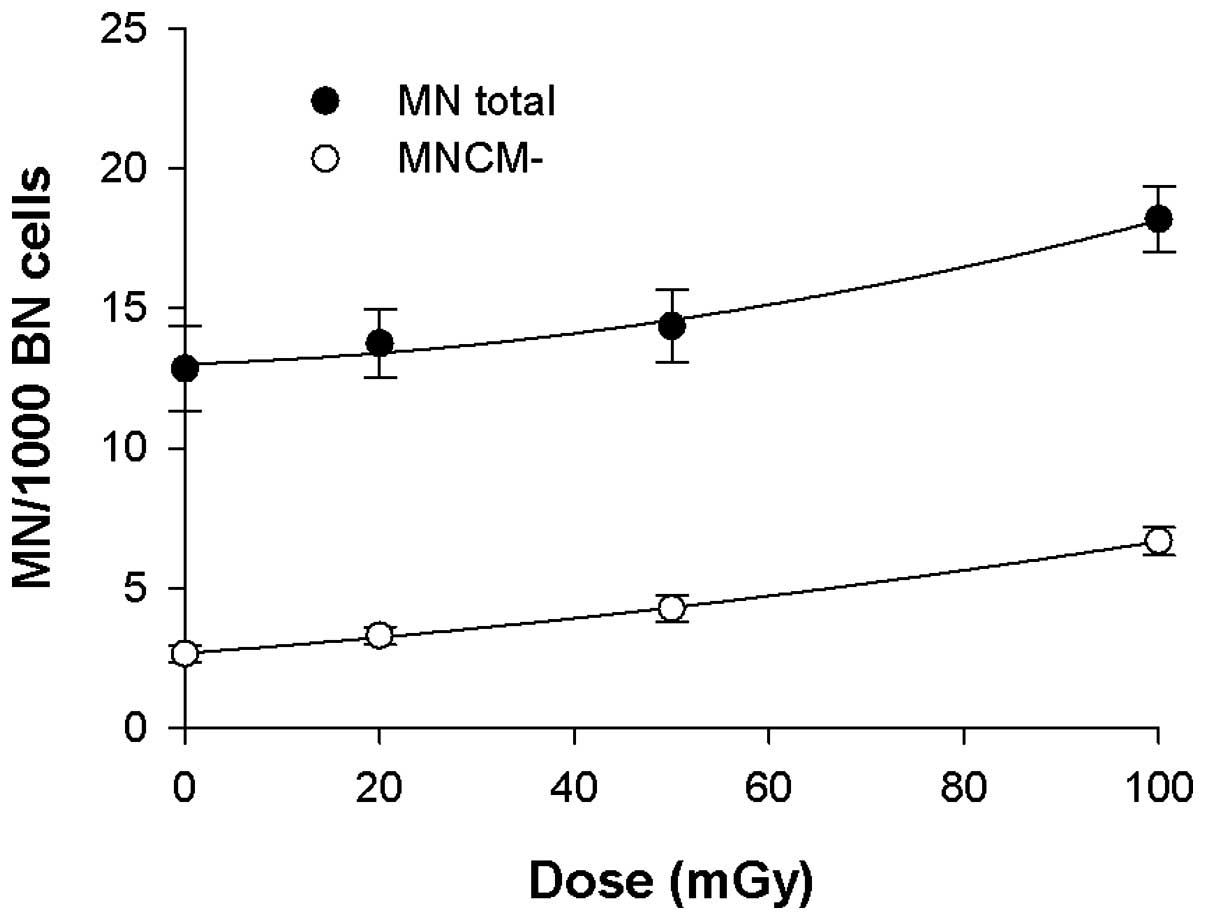
In Fig. 2, the
linear-quadratic dose-response curves (Y = c + aD bD2 in
which Y is the MN yield, c is the spontaneous MN count and D is the
dose in mGy) that were fitted through the mean MN total (MN total
=13.0 + 1.15×10⁻² D + 3.98×10⁻⁴
D2; R2= 0.988) and MNCM− values (MNCM− =2.68
+ 2.53×10⁻² D + 1.46×10⁻⁴ D2;
R2=0.999) are presented. Table I and Fig. 2 present an increase in the total
number of MN in the 0–100 mGy dose region, which may be attributed
to an increase in MNCM−.
The yield of MNCM+ remains constant up to 50 mGy,
with a slight increase at a dose of 100 mGy. Additionally, the
percentages of MNCM− and MNCM+ are presented in Table I and show that spontaneous MN are
predominantly centromere-positive (79%). With increasing doses, the
percentage of MNCM+ reduced while the percentage of MNCM−
increased, from 21% at 0 Gy to 37% at 100 mGy. A Wilcoxon
signed-rank test was used to determine from which dose threshold
significantly higher MN yields are obtained in our control group.
For MNCM− a significant increase (P=0.032) was observed between 0
and 50 mGy, while for MN total a significant increase (P=0.003) was
observed between 0 and 100 mGy. When MNCM− were analysed, a
significant increase was observed between 50 mGy and 100 mGy
(P=0.004).
MN data in medical radiation workers
compared with matched control individuals
A direct comparison of the mean values of MN total,
MNCM− and MNCM+ between the two groups of radiation workers (n=19)
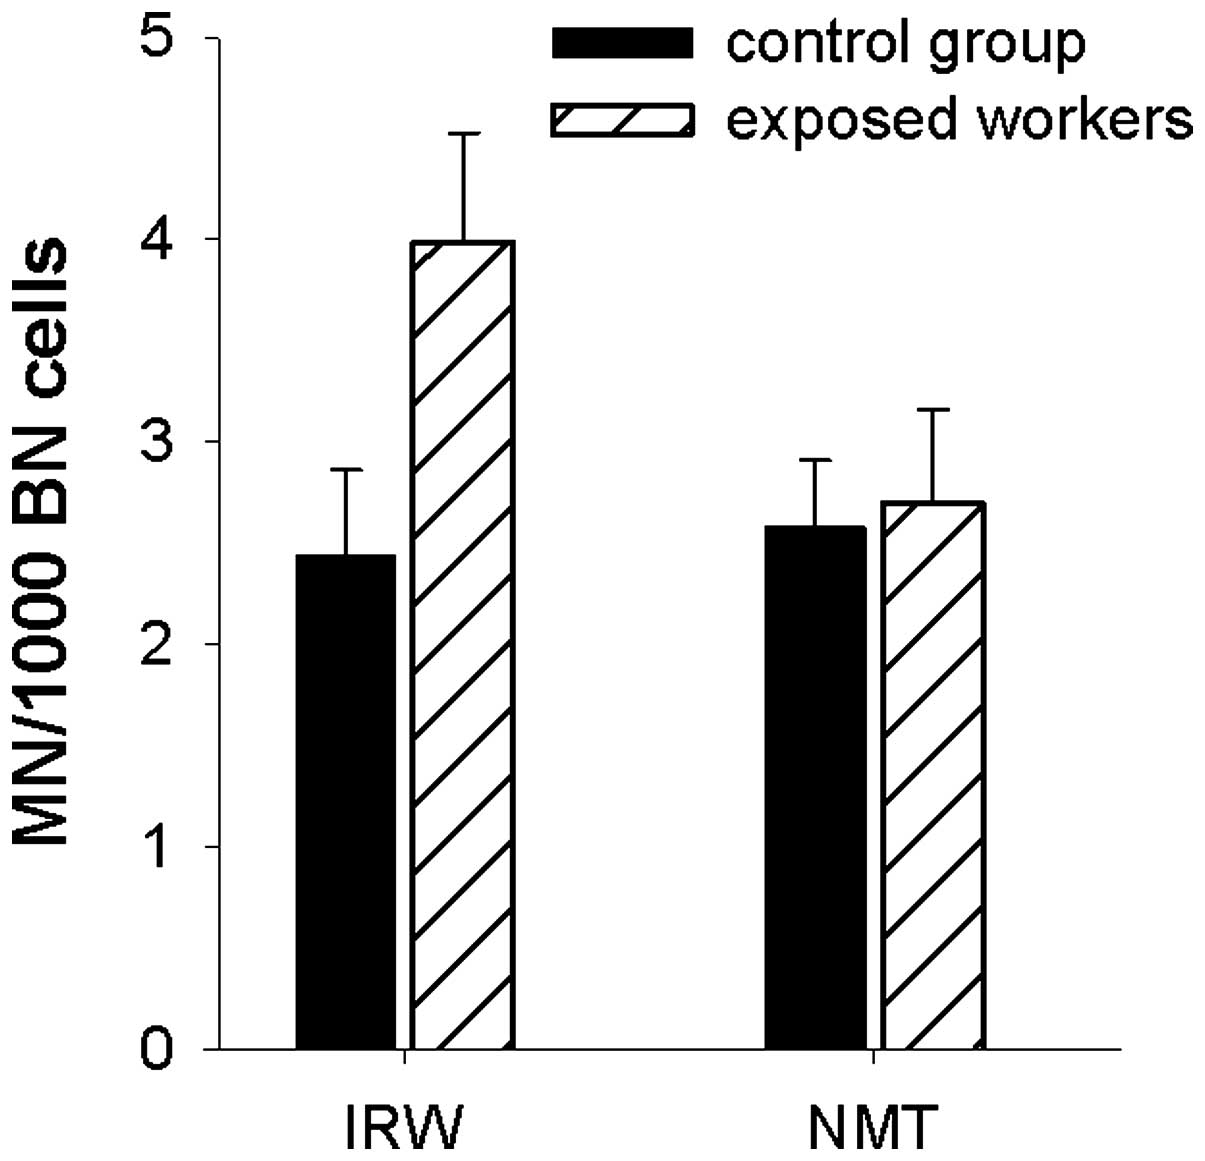
and their matched control groups (n=19) is presented in Table II. In addition, the MNCM− data are
presented graphically in Fig. 3.
The IRWs exhibited increased but not significant (P=0.06) total MN
yields, compared with their control group (CONIRW). With
regards to MNCM−, the difference in MN yield between both groups
was significant (P=0.05; Table
II,Fig. 3). As the individuals
in both groups are age− and gender-matched, an influence of these
variables in assessed MN scores may be ruled out. In the NMT group,
no differences in MN yields (MN total, MNCM−, MNCM+) were observed
in comparison with their matched control group (CONNMT)
(Table II,Fig. 3).
| Table IIMean MN yields for the groups of
exposed workers compared with the matched control groups. |
Table II
Mean MN yields for the groups of
exposed workers compared with the matched control groups.
| MN yields | All, n=19
| IRW, n=10
| NMT, n=9
|
|---|
| Exposed | CON | P-value | Exposed | CON | P-value | Exposed | CON | P-value |
|---|
| MN totala | 13.71 | 12.02 | 0.30 | 12.02 | 8.39 | 0.06 | 15.41 | 15.28 | 0.85 |
| MNCM-a | 3.34 (24) | 2.51 (21) | 0.15 | 3.99 (33) | 2.44 (29) | 0.05 | 2.70 (18) | 2.58 (17) | 0.68 |
| MNCM+a | 10.37 (76) | 9.51 (79) | 0.63 | 8.03 (67) | 5.95 (71) | 0.20 | 12.71 (82) | 12.70 (83) | 1.00 |
Comparison of the four populations (the IRW and NMT
groups with their corresponding control groups) using a
Kruskal-Wallis test indicated a significant difference in MN
(P=0.02) and MNCM+ (P=0.01), however, not in MNCM− (P=0.17).
Histogram analysis indicates that the significant differences are
predominantly associated with low MN and MNCM+ values in the IRW
control group.
Comparison of all radiation workers compared with
all the controls reveals only a small increase in the yield of MN
total in the radiation workers, with an increase in MNCM− scores
being more pronounced, however, not significant (P=0.15).
Personal dosimetry analysis
The data obtained from the personal dosimetry
records, the effective dose E for IRW and the personal dose
equivalent Hp(10) for NMT, are
presented in Table III. In this
table these dose parameters are given as cumulative doses for
periods of 12 and 36 months preceding the blood sampling. In
addition, the E and Hp(10) values
over 36 months corrected for the disappearance of MN are
additionally tabulated. To this end MN were assumed to disappear
with an in vivo half-life of 1 year (12).
| Table IIIPersonal dosimetry data for the IRW
and NMT groups presented as cumulative doses over periods of 12 and
36 months preceeding the blood sampling. |
Table III
Personal dosimetry data for the IRW
and NMT groups presented as cumulative doses over periods of 12 and
36 months preceeding the blood sampling.
| Group | Dose estimates | 12 months | 36 months | 36 months
(corrected) |
|---|
| IRW (n=10) | E (mSv) ± SD | 1.92±1.37 | 6.03±4.71 | 2.61±1.81 |
| NMT (n=9) | Hp(10) (mSv) ±
SD | 4.95±2.00 | 17.02±7.01 | 7.07±2.39 |
Table III
indicates that according to the personal dosimetry data, the NMT
group received a higher radiation burden compared with the IRW
group.
Comparison between biological and
physical dosimetry data
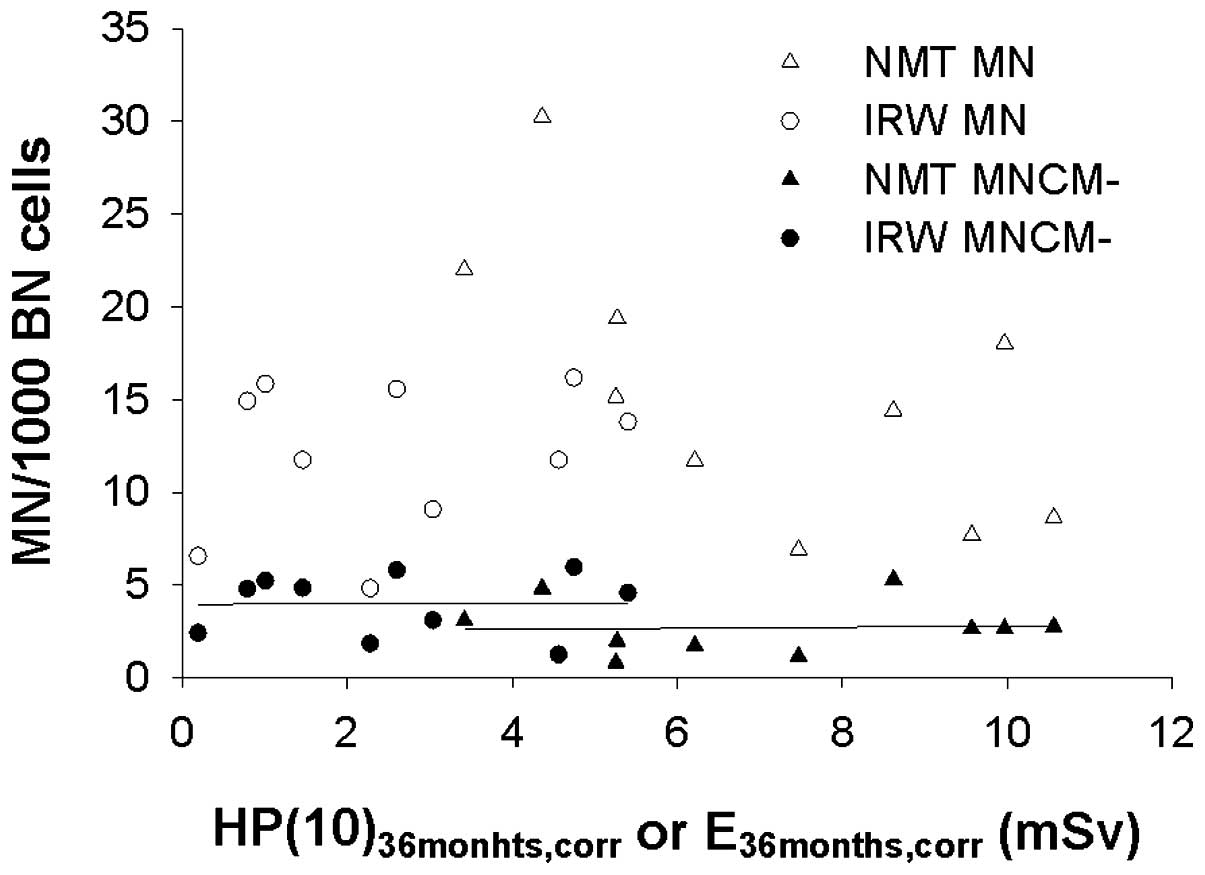
Fig. 4 presents an
overview of the individual data points of both groups of radiation
workers. Fig. 4 presents the MN
yields (MN total and MNCM−) as a function of the cumulative dose
over 36 months, corrected for the disappearance of MN with a
half-life of 1 year (corrected, 36 months). Fig. 4 indicates that the IRWs exhibited
higher chromosomal damage according to biological dosimetry
analysis using the MN-centromere assay, however, received a lower
radiation burden according to the personal dosimetry records.
Discussion
The first part of the present study aimed to improve
a semi-automated MN centromere assay for the biological dosimetry
of medical radiation workers exposed to low doses. Using a Wilcoxon
signed-rank test, it was demonstrated that for small group sizes of
about 10–15 individuals, the semi-automated MNCM− scoring enables
the discrimination between 0 Gy and 50 mGy, while with
semi-automated scoring of MN total a significant difference was
only observed between 0 Gy and 100 mGy. These results indicate that
MNCM− scoring markedly improved the detection capability of the
assay. In earlier in vitro studies using the MN-centromere
assay the lowest doses applied were 50 or 100 mGy, and the
detection limit reported ranged between 50 and 100 mGy (9,15,16).
In the present study, spontaneous MN, present in
non-irradiated samples, consisted mainly of MNCM+ (79%), with the
increase in MN following low-dose exposure attributed to an
increase in the number of MNCM−. These data are in line with a
previous study (9). Although the
MN-centromere assay is more labour-intensive compared with the
standard MN assay, the use of a home-tailored pan-centromeric probe
and a semi-automated scoring procedure, described here and in
Baeyens et al (9), keeps
the expense and scoring time reasonably low. This makes the assay
suitable for large-scale applications, such as for biomonitoring.
An automated procedure has additionally been developed for
dicentric analysis, which is the gold standard for biological
dosimetry. Though this procedure reduces the workload of the
dicentric assay, it additionally reduces its sensitivity. Further
investigation and validation is required before automated dicentric
scoring can be applied for biomonitoring purposes (17).
In the second part of the current study, the
semi-automated MN centromere assay was used to perform a direct
comparison between exposed radiation workers (IRW and NMT) and two
groups of matched controls (CONIRW and
CONNMT).
A first analysis of the total MN yields indicated
that there was no significant difference between the pooled exposed
workers and the pooled controls. Notably, a significant difference
was observed in MN and MNCM+ between the two exposed and control
groups applying the Kruskal-Wallis test, which may be attributed
predominantly to the lower number of MN and MNCM+ in the
CONIRW group. It should be noted that the IRW and
CONIRW groups consist only of males while the NMT and
CONNMT groups consist of 6 females and 4 males. When the
controls are divided into two groups according to gender, higher
numbers of MN total and MNCM+ per 1000 BN cells are observed in
females (females, MN total = 16.66, MNCM+ = 14.62; males, MN total
= 10.28, MNCM+ = 7.38). Conversely MNCM− are comparable between
these groups (2.04 vs. 2.90 MNCM−). These data confirm other
findings indicating that the centromere-positive subset of MN is
more susceptible to gender effects and is higher in females
compared with males. Age may additionally be a confounding factor,
and previous studies have reported that the increase of MN with age
is due to an increase in centromere-positive MN. In the present
study, the confounding effect of age on the MN yields may be
excluded, as the mean age in both the exposed and control groups
were comparable, as all worker/control pairs were age-matched. The
effects of age and gender on MNCM+ have been extensively described
in Baeyens et al (9). In
addition, it has been reported that the X-chromosome is often
involved in spontaneous chromosome loss (18).
As the majority of spontaneous MN are MNCM+, scoring
of only the MNCM− subset removes the 'background noise' represented
by MNCM+, and considerably lowers the detection threshold of the MN
assay for the in vivo biomonitoring of radiation workers
exposed to low radiation doses, according to their personal
dosimetry records. Using telomeric and centromeric FISH staining,
Lindberg et al (19)
demonstrated that the majority of the centromere-negative MN
harbour terminal acentric fragments, supporting the observation
that centromere-negative MN are a better indicator of
radiation-induced damage.
In a number of studies where the standard MN assay
was used to biomonitor radiation workers, heterogeneous and
contradictory results have been reported (2). Ropolo et al (2) state that the MN content is not the
sole factor responsible for the heterogeneity in the results. One
important factor is that in the majority of MN studies, mixed
populations of hospital staff are investigated. Only in few studies
(including the present), is the MN analysis performed in specific
groups of radiation workers, such as those working in nuclear
medicine and interventional cardiology, and who receive the highest
levels of exposures. Another important factor responsible for the
heterogeneous results of many studies is the way the personal
dosimetry data are used as an exposure parameter. In certain
studies, the estimated dose is based on personal dosimetry readings
during the previous 12 months, the previous 5–10 years or based on
the accumulated dose during the entire time of employment. Only in
few studies is a correction performed for the disappearance of MN.
In the current study, the personal doses registered during the
previous 12 or 36 months, with or without a correction for MN
disappearance were used as occupational exposure quantities.
Analysis of the centromere-negative MN in all
exposed workers compared with control individuals indicated an
increased number of MNCM− in the exposed group, however, this
increase was not significant (P=0.15). When the exposed group was
divided into two groups, based on the specific professional
activities, a significantly increased MNCM− number was observed in
the IRW group compared with their controls (P=0.05). A significant
increase of MNCM− scores was not observed in the NMT group,
indicating that the IRWs are exposed to higher levels of
occupational radiation compared with the NMT group. The higher
yield of MNCM− in the IRW group compared with the NMT group is
however, not in agreement with the personal dosimetry records of
both groups. Dose estimates for the IRW group are considerably
lower than in the NMT group. In the IRW group, the effective dose
E, deduced from double dosimetry readings, was used as the personal
dose. For this calculation an algorithm was applied, which takes
into account the organs and organ weighting factors of the ICRP 103
publication: E=0.79 Hp,u(10) +
0.100 Hp,o(10) (10). A number of studies have already
been published dealing with the α and β coefficients in the E=α
Hp,u(10) + β Hp,o(10) expression. An overview of these
coefficients indicates that the majority of algorithms adopt α
values close to 1 and β values in the range 0.07–0.10 (20,21).
Utilizing a different algorithm in the present study will not alter
the E values for the IRW group to a large extent.
The discrepancies observed between the physical dose
estimates and the biological effect in both groups of radiation
workers may indicate the limitations of physical dosimetry, in
particular in interventional radiology/cardiology. This has been
reported in previous studies (1,2,7).
Although in interventional radiology/cardiology, double dosimetry
practice is recommended and legally required in Belgium and other
countries, its application in daily practice is not granted. For
example, interventional radiologists/cardiologists do not always
wear their (or both) dosimeters during interventions performed at
different locations. Personal dosimeters are not always worn
correctly at the right position; hence they are not representative
of the exposure. In certain cases, dosimeters remain attached to
the apron, meaning the dose is no longer personal. In the current
study of interventional radiologists/cardiologists, no readings
were obtained for the dosimeters worn under the apron in 102 of 300
reading months, and for dosimeters worn above the apron in 46/270
reading months. Another consideration is that no consensus exists
on the most suitable algorithm to calculate the effective dose from
the two readings. The lower frequency of MNCM− observed in NMTs
compared with IRWs may be associated with the personal dosimetry
records in NMTs not wearing lead aprons and related to annihilation
photons, which are more representative of the real radiation burden
in these workers. Finally, it should be considered that the
cytogenetic effects are associated with the blood dose and not the
personal equivalent dose, Hp(10),
and the effective dose, E, quantities which serve as tools to
monitor radiation workers.
The present study demonstrates that a semi-automated
MN-centromere assay is suitable for large-scale low dose
biomonitoring. The observations of enhanced frequencies of
centromere-negative MN, representing chromosomal damage, in medical
radiation workers exposed to doses within the ICRP regulatory
limits, according to their personal dosimetry records, further
supports that chronic radiation exposure may be hazardous due to
enhanced genotoxicity. These results indicate that any suggestions
that the current dose limits are unnecessarily low and restrictive
and could be raised, should be rejected.
The present study strengthens the importance of
cytogenetic analysis performed together with physical dosimetry, as
a routine biomonitoring method for medical workers receiving the
highest occupational radiation burden. The disagreement between the
differences in personal dosimetry data and cytogenetic results of
the two groups of medical radiation workers may be associated with
the fact that the application of double dosimetry in the daily
practice of interventional X-ray workers is not evident, reducing
the reliability of the resulting effective doses.
Acknowledgments
The authors wish to thank Ms. Toke Thiron, Ms.
Virginie De Gelder, Ms. Johanna Aernoudt and Ms. Greet De Smet of
the Department of Basic Medical Sciences of Ghent University for
their excellent practical assistance, and additionally, the workers
and volunteers who participated in the current study. The present
study was funded by the CESI Scientific Fund Occupational Health
Service.
References
|
1
|
Zakeri F and Hirobe T: A cytogenetic
approach to the effects of low levels of ionizing radiations on
occupationally exposed individuals. Eur J Radiol. 73:191–195. 2010.
View Article : Google Scholar
|
|
2
|
Ropolo M, Balia C, Roggieri P, Lodi V,
Nucci MC, Violante FS, Silingardi P, Colacci A and Bolognesi C: The
micronucleus assay as a biological dosimeter in hospital workers
exposed to low doses of ionizing radiation. Mutat Res. 747:7–13.
2012. View Article : Google Scholar : PubMed/NCBI
|
|
3
|
Martin CJ, Sutton DG, West CM and Wright
EG: The radio-biology/radiation protection interface in healthcare.
J Radiol Prot. 29:A1–A20. 2009. View Article : Google Scholar
|
|
4
|
Thierens H, Vral A, Morthier R, Aousalah B
and De Ridder L: Cytogenetic monitoring of hospital workers
occupationally exposed to ionizing radiation using the micronucleus
centromere assay. Mutagenesis. 15:245–249. 2000. View Article : Google Scholar : PubMed/NCBI
|
|
5
|
Cardoso RS, Takahashi-Hyodo S, Peitl P Jr,
Ghilardi-Neto T and Sakamoto-Hojo ET: Evaluation of chromosomal
aberrations, micronuclei and sister chromatid exchanges in hospital
workers chronically exposed to ionizing radiation. Teratog Carcinog
Mutagen. 21:431–439. 2001. View
Article : Google Scholar
|
|
6
|
Dias FL, Antunes LM, Rezende PA, Carvalho
FE, Silva CM, Matheus JM, Oliveira JV Jr, Lopes GP, Pereira GA and
Balarin MA: Cytogenetic analysis in lymphocytes from workers
occupationally exposed to low levels of ionizing radiation. Environ
Toxicol Pharmacol. 23:228–233. 2007. View Article : Google Scholar : PubMed/NCBI
|
|
7
|
Montoro A, Rodríguez P, Almonacid M,
Villaescusa JI, Verdú G, Caballín MR, Barrios L and Barquinero JF:
Biological dosimetry in a group of radiologists by the analysis of
dicentrics and trans-locations. Radiat Res. 164:612–617. 2005.
View Article : Google Scholar : PubMed/NCBI
|
|
8
|
International Atomic Energy Agency (IAEA):
Emergency Preparedness and Response Biodosimetry 2011: Cytogenetic
Dosimetry: Applications in preparedness for a response to radiation
emergencies. IAEA; Vienna, Austria: 2011
|
|
9
|
Baeyens A, Swanson R, Herd O, Ainsbury E,
Mabhengu T, Willem P, Thierens H, Slabbert JP and Vral A: A
semi-automated micronucleus-centromere assay to assess low-dose
radiation exposure in human lymphocytes. Int J Radiat Biol.
87:923–931. 2011. View Article : Google Scholar : PubMed/NCBI
|
|
10
|
Von Boetticher H, Lachmund J and Hoffmann
W: An analytic approach to double dosimetry algorithms in
occupational dosimetry using energy dependent organ dose conversion
coefficients. Health Phys. 99:800–805. 2010. View Article : Google Scholar : PubMed/NCBI
|
|
11
|
International Commission on Radiological
Protection (ICRP): The 2007 Recommendations of the International
Commission on Radiological Protection. ICRP publication 103, Ann
ICRP. 37:2–4. 2007.
|
|
12
|
Thierens H, De Ruyck K, Vral A, de Gelder
V, Whitehouse CA, Tawn EJ and Boesman I: Cytogenetic biodosimetry
of an accidental exposure of a radiological worker using multiple
assays. Radiat Prot Dosimetry. 113:408–414. 2005. View Article : Google Scholar : PubMed/NCBI
|
|
13
|
Willems P, August L, Slabbert J, Romm H,
Oestreicher U, Thierens H and Vral A: Automated micronucleus (MN)
scoring for population triage in case of large scale radiation
events. Int J Radiat Biol. 86:2–11. 2010. View Article : Google Scholar : PubMed/NCBI
|
|
14
|
Schunck C, Johannes T, Varga D, Lörch T
and Plesch A: New developments in automated cytogenetic imaging:
Unattended scoring of dicentric chromosomes, micronuclei, single
cell gel electrophoresis, and fluorescence signals. Cytogenet
Genome Res. 104:383–389. 2004. View Article : Google Scholar : PubMed/NCBI
|
|
15
|
Wojcik A, Kowalska M, Bouzyk E,
Buraczewska I, Kobialko G, Jarocewicz N and Szumiel I: Validation
of the micro-nucleus-centromere assay for biological dosimetry. Gen
Mol Biol. 23:1083–1085. 2000. View Article : Google Scholar
|
|
16
|
Pala FS, Alkaya F, Tabakcioglu K, Tokatli
F, Uzal C, Parlar S and Algünes C: The effects of micronuclei with
whole chromosome on biological dose estimation. Turkish J Biol.
32:283–290. 2008.
|
|
17
|
Romm H, Ainsbury E, Barnard S, Barrios L,
Barquinero JF, Beinke C, Deperas M, Gregoire E, Koivistoinen A,
Lindholm C, et al: Automatic scoring of dicentric chromosomes as a
tool in large scale radiation accidents. Mutat Res. 756:174–183.
2013. View Article : Google Scholar : PubMed/NCBI
|
|
18
|
Norppa H and Falck GC: What do human
micronuclei contain? Mutagenesis. 18:221–233. 2003. View Article : Google Scholar : PubMed/NCBI
|
|
19
|
Lindberg HK, Falck GC, Järventaus H and
Norppa H: Characterization of chromosomes and chromosomal fragments
in human lymphocyte micronuclei by telomeric and centromeric FISH.
Mutagenesis. 23:371–376. 2008. View Article : Google Scholar : PubMed/NCBI
|
|
20
|
Järvinen H, Buls N, Clerinx P, Jansen J,
Miljanić S, Nikodemová D, Ranogajec-Komor M and d'Errico F:
Overview of double dosimetry procedures for the determination of
the effective dose to the interventional radiology staff. Radiat
Prot Dosimetry. 129:333–339. 2008. View Article : Google Scholar : PubMed/NCBI
|
|
21
|
Järvinen H, Buls N, Clerinx P, Miljanic S,
Nikodemová D, Ranogajec-Komor M, Struelens L and d'Errico F:
Comparison of double dosimetry algorithms for estimating the
effective dose in occupational dosimetry of interventional
radiology staff. Radiat Prot Dosimetry. 131:80–86. 2008. View Article : Google Scholar : PubMed/NCBI
|