Introduction
Ketamine, a clinical anesthesia, was first
synthesized in 1961 (1). Recently,
ketamine has become an increasingly popular recreational drug used
illicitly by people in clubs or the younger generation. Since the
first two clinical case reports about ketamine abuse-induced
urological sequelae were published in 2007 (2,3), it
has been well-known that long-term ketamine abuse causes side
effects that resemble ketamine-associated cystitis (KC), which is
associated with severe lower urinary tract symptoms, including
smaller bladder capacity, incontinence, dysuria, and hematuria, as
well as lower abdominal or suprapubic pain resulting from
neurological disorders (4).
To date, the underlying mechanisms of
ketamine-induced urinary toxicity remain to be completely
understood. However, several hypotheses on the association between
ketamine and urinary tract damage have been raised based on
clinical observations. The most straightforward and important one
points out that ketamine and its metabolites in the urine may have
a direct toxic effect on the bladder urothelium, leading to a
chronic inflammatory response and subsequent interstitial
cystitis-like symptoms (4). In
addition, numerous previous studies using rodents for investigating
the mechanisms of KC have been reported (5–11).
According to the outcome of these previous studies, certain
characteristics, such as submucosal infiltration of mononuclear
inflammatory cells (5,6) and gene expression, including
cyclooxygenase (COX)-2 and inducible nitric oxide synthase (iNOS)
(5,7), can link to submucosa inflammatory
environment caused by ketamine abuse in clinical cases. Other
evidence associated with detrusor over-activity comes from the
increase of adenosine triphosphate-evoked detrusor contraction and
P2X1 receptor protein observed in Meng et al (8). Alternatively, in Gu's rat model
(9), the phosphorylated transgelin
of the bladder smooth muscles was increased by ketamine treatment,
suggesting that transgelin may have a role in modulating bladder
detrusor contractility. Previously, an innovative technique using
TGF-β1 injection has also been successfully generated in a
reproducible rat model to assess urethral fibrosis (10).
In our previous microarray study, in which male
Balb/c mice received 30 mg/kg/day ketamine injection for 2 months,
the gene expression of keratin 14, which assembles with keratin 5
to form heterodimers and contribute to the intermediate filament
cytoskeleton, was found to markedly decrease in the urothelial
tissue (11). This result revealed
that the urothelial cells possibly suffered damage from ketamine
and likely progressed to a leaked barrier or denuded condition.
Therefore, based on the theory of urothelial pathogenesis, it is
reasonable to illustrate the effectiveness of intravesical therapy
with hyaluronic acid in ketamine-abused patients (12). However, in that study, hematoxylin
and eosin (HE) stain analysis revealed no histological difference
between the bladders of the control and ketamine-treated mice.
Therefore, in the design of the present study, enhanced ketamine
dosage (100 mg/kg/day) and prolonged injection period (20 weeks)
were administered for both male and female Balb/c mice in order to
search for advanced markers associated with the pathogenesis of
KC.
Materials and methods
Animals and ketamine treatment
Male and female (n=20 each) 6-week-old Balb/c mice
were purchased from the National Laboratory Animal Center (Taipei,
Taiwan). All animals were maintained at the qualified animal care
facility of Biotechnology and Health Hall in National Chiayi
University (Chiayi, Taiwan) for a 1 week period of acclimation. At
7 weeks of age, 10 male and 10 female mice were administered 100
mg/kg ketamine (Merial Laboratoire de Toulouse, Lyon, France) via
intraperitoneal injection daily for 20 weeks. A control group of 10
male and 10 female mice were injected with normal saline. All mice
were housed in polycarbonate cages, provided with food and water
ad libitum and maintained on a 12 h light-dark cycle at
22±2°C. The animal experiment was approved by the Institutional
Animal Care and Use Committee of National Chiayi University (no.
102029).
Detection of ketamine and its metabolites
in mice urine using gas chromatography-mass spectrometry
(GC-MS)
Urine was collected three days prior to the final
day of the 20th week. Ketamine and its metabolites were
excreted primarily by the kidney, with an elimination half-life of
around 2 h in rats (13). The
urine from six mice from each group was collected together during a
period of 30 min to 4 h following intraperitoneal injection to
analyze the concentration of ketamine and its metabolites
(norketamine and dehydronorketamine). The collected urine was first
filtered using the ultrafiltration Vivaspin 500 device (GE
Healthcare Life Sciences, Little Chalfont, UK) with 3 kDa molecular
weight cut off achieved by centrifuging at 9,700 × g at 4°C for 30
min. The concentration of ketamine and its metabolites were
determined using modified liquid-liquid [triethylamine:cyclohexane,
3:1 (v/v)] extraction, accompanied by GC-MS on a Shimadzu
GCMS-QP2010 system (14). The gas
chromatograph was equipped with a 30-m DB-5MS (J&W Scientific,
Folsom, CA, USA) capillary column with 250 µm I.D. and 0.25
µm film thickness. The injector temperature and GC-MS
interface temperature were maintained at 220 and 280°C,
respectively. The sample was delivered in splitless mode and the
helium carrier gas flow rate was 0.8 ml/min. The temperature of the
GC oven was set at 100°C for 0.5 min, then increased to 280°C at
25°C/min and held for 1 min.
Mouse voiding behavior analysis
This analysis was made one day prior to the final
day of the 20th week. Urinary voiding quantity and
interval were determined using the voided stain on paper (VSOP)
method (15). Briefly, the mice
were fed with 20 µl/g distilled water. Following waiting for
30 min, the mice were placed on a 25 cm wire-netted grid above a
filter paper (Advantec 185 mm; Tokyo Roshi Kaisha, Ltd., Tokyo,
Japan). Each mouse was restricted in a certain area matched to a
filter paper. Subsequently the voiding time and area were recorded
over 2 h. The recorded urine stains were scanned into image files
and the stained areas were calculated using the software ImageJ
v1.47 (National Institutes of Health, Bethesda, MA, USA). Each
voiding interval was calculated based on the time difference
between two near voiding episodes. The voiding interval of an
individual mouse was the mean of all voiding intervals within a 2 h
period.
Mice bladder collection, histological
stains and total RNA extraction
Following treatment for 20 weeks, the mice were
euthanized by carbon dioxide inhalation and the bladders were
removed. A total of 24 bladders (n=6/group) were fixed in 10%
neutral formalin for 24 h and then embedded in paraffin and cut
into 3 µm sections for preparation of slides used in
follow-up histological analysis, which includes HE stain for
microvascular location purposes, as well as Masson's trichrome
stain to identify collagen distribution. Following staining, these
tissue sections were subsequently examined by light microscopy.
Furthermore in each group, 2–4 urinary bladders were homogenized
individually and the total RNA was extracted using the TRIzol
reagent (Thermo Fisher Scientific, Inc., Waltham, MA, USA),
according to the manufacturer's instructions. The concentration and
purity of the RNA was measured using a NanoDrop 1000
spectrophotometer (Thermo Fisher Scientific, Inc.). Purity was
checked using the ratio of the OD260/OD280
and OD260/OD230. The quality of total RNA was
accessed using Agilent 2100 Bioanalyzer (Agilent Technologies,
Inc., Santa Clara, CA, USA).
Mouse oligonucleotide DNA microarray
The Mouse Whole Genome OneArray® v2
(Phalanx Biotech Group, Hsinchu, Taiwan) contains 27,307 DNA
oligonucleotide probes. Each probe is a 60-mer designed in the
sense direction. Among the probes, 26,423 probes correspond to the
annotated genes in RefSeq v42 (ftp://ftp.ncbi.nlm.nih.gov/refseq/release/release-catalog/archive/release42.files.installed)
and Ensembl v59 databases (ftp://ftp.ensembl.org/pub/release-59/fasta/mus_musculus/cdna/Mus_musculus.NCBIM37.59.cdna.all.fa.gz).
In addition, 884 control probes were also included. The detailed
descriptions of the gene array list are available from http://www.phalanx.com.tw/products/MOA.php.
Microarray analysis
Fluorescent aRNA targets were prepared from 1
µg total RNA samples using OneArray® Amino Allyl
aRNA Amplification kit (Phalanx Biotech Group) and Cy5 dye (GE
Healthcare Life Sciences). Fluorescent targets were hybridized to
the Mouse Whole Genome OneArray® with Phalanx
hybridization buffer using Phalanx Hybridization system. After 16 h
hybridization, non-specific binding targets were removed using
saline and sodium citrate buffer. The slides were scanned using a
DNA Microarray Scanner (Model G2505C; Agilent Technologies, Inc.).
The Cy5 fluorescent intensities of each spot were analyzed using
GenePix 4.1 software (Molecular Devices, LLC, Sunnyvale,. CA, USA).
Each single sample was at least assessed twice in terms of
technical or biological replicates under the reproducibility
>0.975. The signal intensity was loaded into Rosetta Resolver
system® (Rosetta Biosoftware, Seattle, WA, USA) for data
pre-processing and 75 percentile centering normalization was
applied. The errors of the sample were estimated by using the
error-weighted approach at the same time. The fold change and
P-value for pair-wise sample comparison were calculated for
evaluating differentially expressed genes (DEGs). The criteria with
log2|fold change|≥0.5 and P<0.05 were used for
further analysis.
Reverse transcription-quantitative
polymerase chain reaction (RT-qPCR) analysis
In the present study, two genes [Collagen α-1 (III)
chain (Col3a1) and Collagen α-2 (I) chain (Col1a2)] were
selectively targeted. Each reaction included 20 ng cDNA, 500 nM
forward and reverse primers, and 2X Fast SYBR Green PCR Master mix
(Applied Biosystems; Thermo Fisher Scientific, Inc.). A total of 10
µl reaction volumes were used for qPCR with the specific
primers listed as follows: Col1a2, forward: 5′-TGG CTT CTG ACT ATC
TTC CACAG-3′ and reverse: 5′-CAG TTC GTG TCA GCC TTGGT-3′; Col3a1,
forward: 5′-GCA ACG GTC ATA CTC ATT CACC-3′ and reverse: 5′-GTT CTG
ACC AGT TGA GGT AGTT-3′; Actb reference gene, forward:
5′-GTCCACCTTCCAGCAGATGT-3′ and reverse:
5′-CTCAGTAACAGTCCGCCTAGAA-3′. Each sample was tested in triplicate.
The Bio-Rad CFX Connect (Bio-Rad Laboratories, Inc., Hercules, CA,
USA) real-time PCR machine and Bio-Rad CFX Manager version 3.0
software (Bio-Rad Laboratories, Inc.) were used for the
experimental setup and data analysis. The qPCR data of the target
genes were normalized against the reference gene, Actb.
Gene pathway building
To interpret the biological functions of the DEGs
between the control and ketamine-treated groups, Gene Ontology (GO)
enrichment analysis was used to explore the functional
distribution. Additionally, the Kyoto Encyclopedia of Genes and
Genomes (KEGG) database was applied to analyze the DEGs to identify
essential pathways involved in the microarray data.
Statistical analysis
Statistical differences were analyzed using one-way
analysis of variance analysis, with the exception of the microarray
data. All statistics were calculated using SigmaPlot version 12.5
(Systat Software, Inc., San Jose, CA, USA). Data are presented as
the mean ± standard error of the mean with the exception of data in
Table I, which are expressed as
the mean ± standard deviation. P<0.05 was considered to indicate
a statistically significant difference.
 | Table IConcentration of ketamine and its
metabolites in mice urine. |
Table I
Concentration of ketamine and its
metabolites in mice urine.
| Gender | K (ppm) | NK (ppm) | deNK (ppm) |
|---|
| Female | 108±9.9 | 336±17.1 | 1,332±66.0 |
| Male | 173±9.1 | 599±8.4 | 1,286±13.7 |
Results
Effect of ketamine on mouse behavior and
body weight
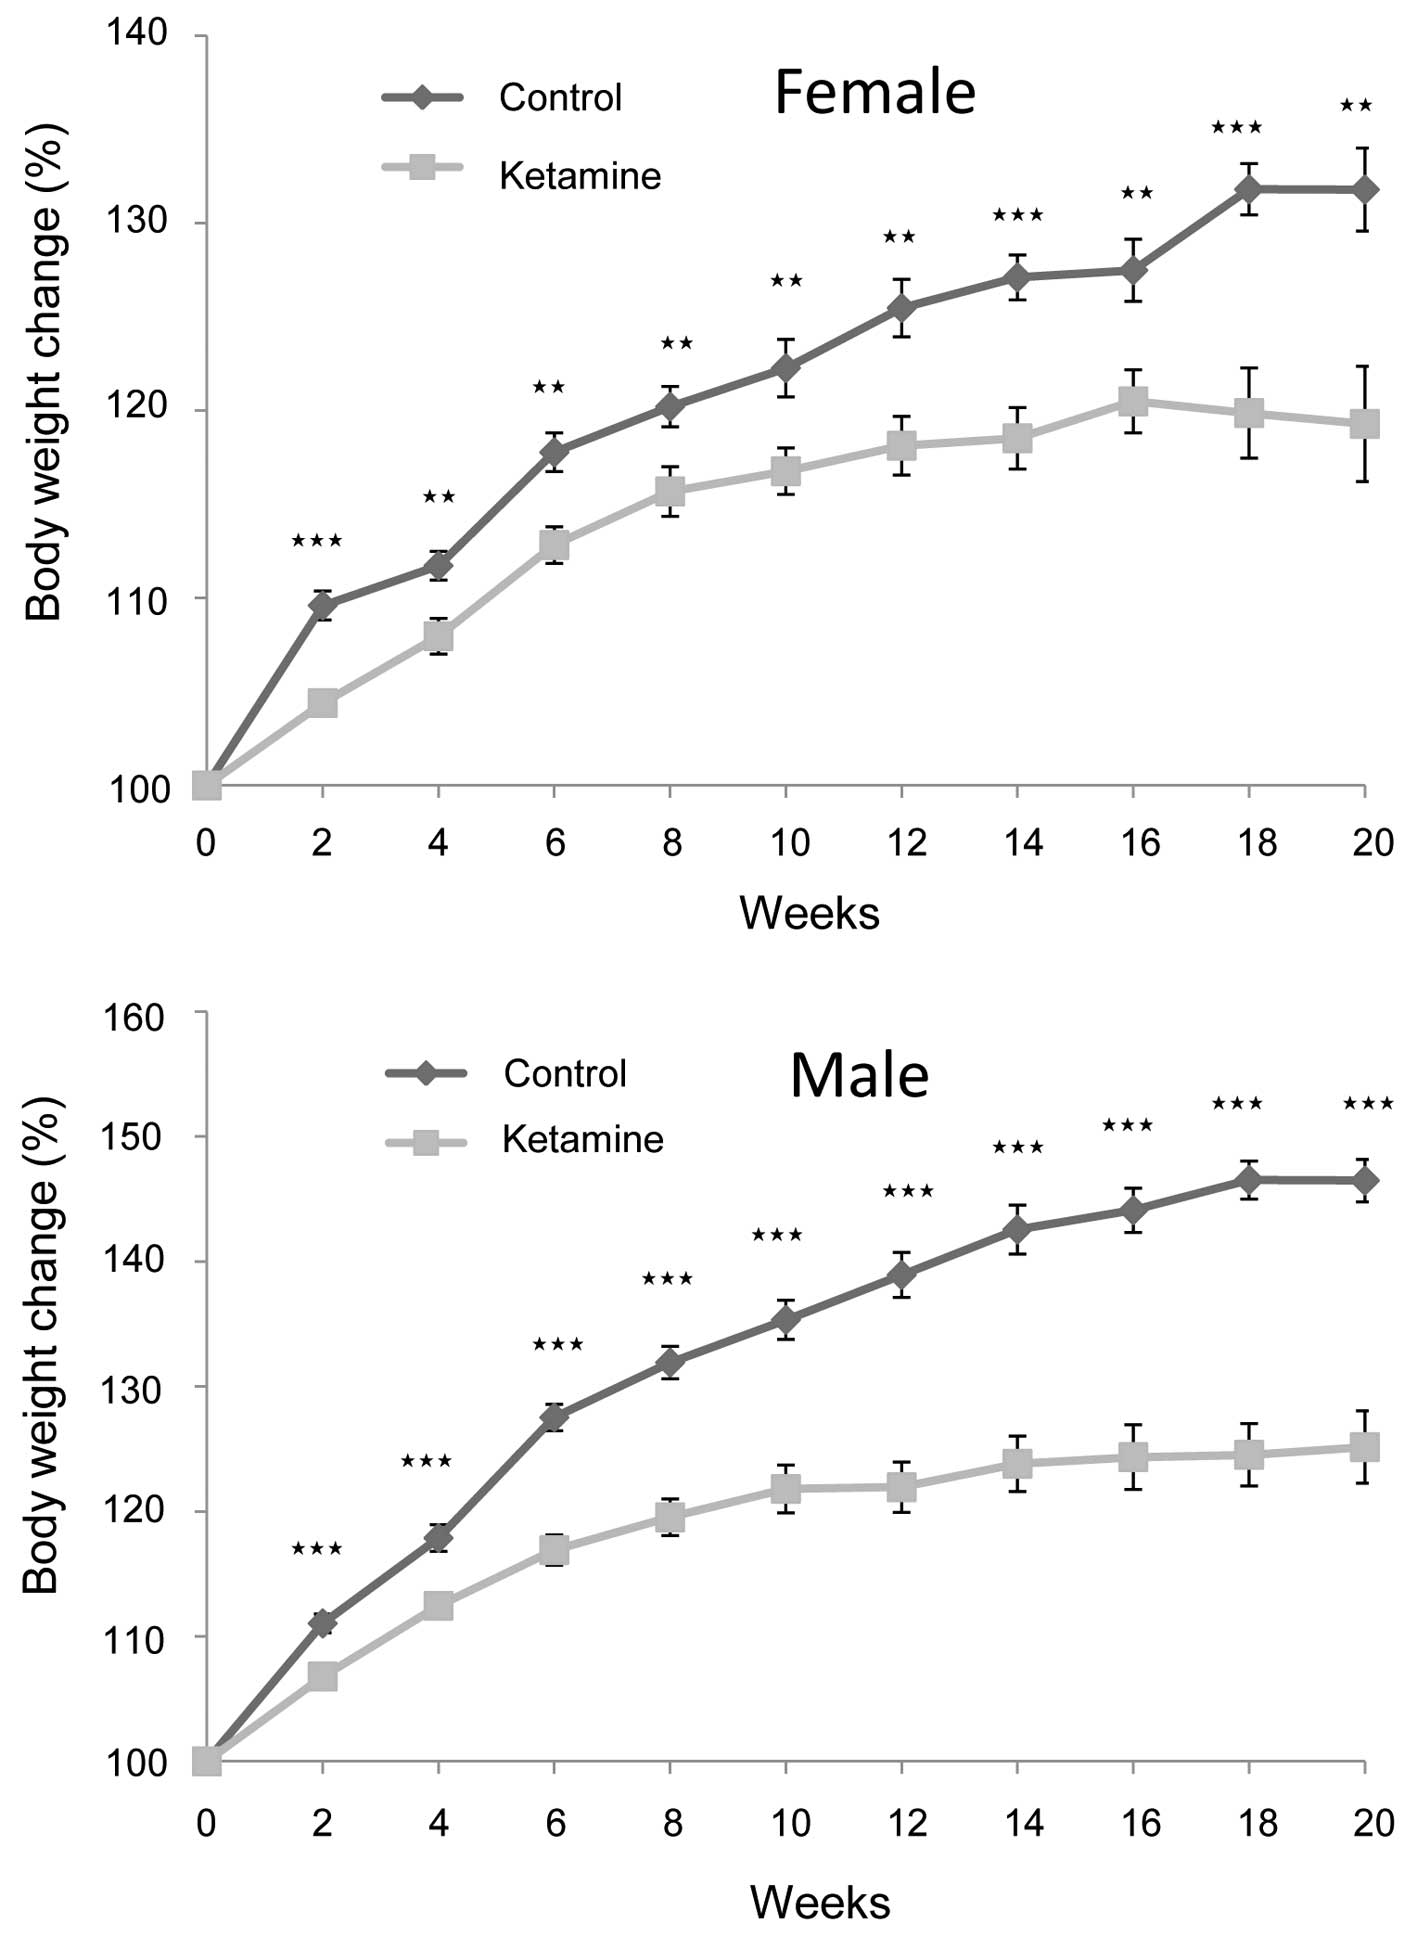
At the dosage of 100 mg/kg/day, it was found that
the mice at first displayed excitation within 1 min following
ketamine injection. They gradually turned into anesthetic status in
~2 min and lasted for ~30 min. In awakening from the anesthesia,
the mice first entered a semi-conscious state for ~10 min and then
became fully awake. The rate of weight gain of the ketamine-treated
mice became significantly slower following the second week compared
with that of the control mice. This trend continued for the
remaining period of the present study (Fig. 1). Additionally, male mice were more
obvious than female mice in this regard, indicating that ketamine
toxicity likely caused more severe physiological effects on the
male mice.
Ketamine concentration and its
metabolites in mice urine
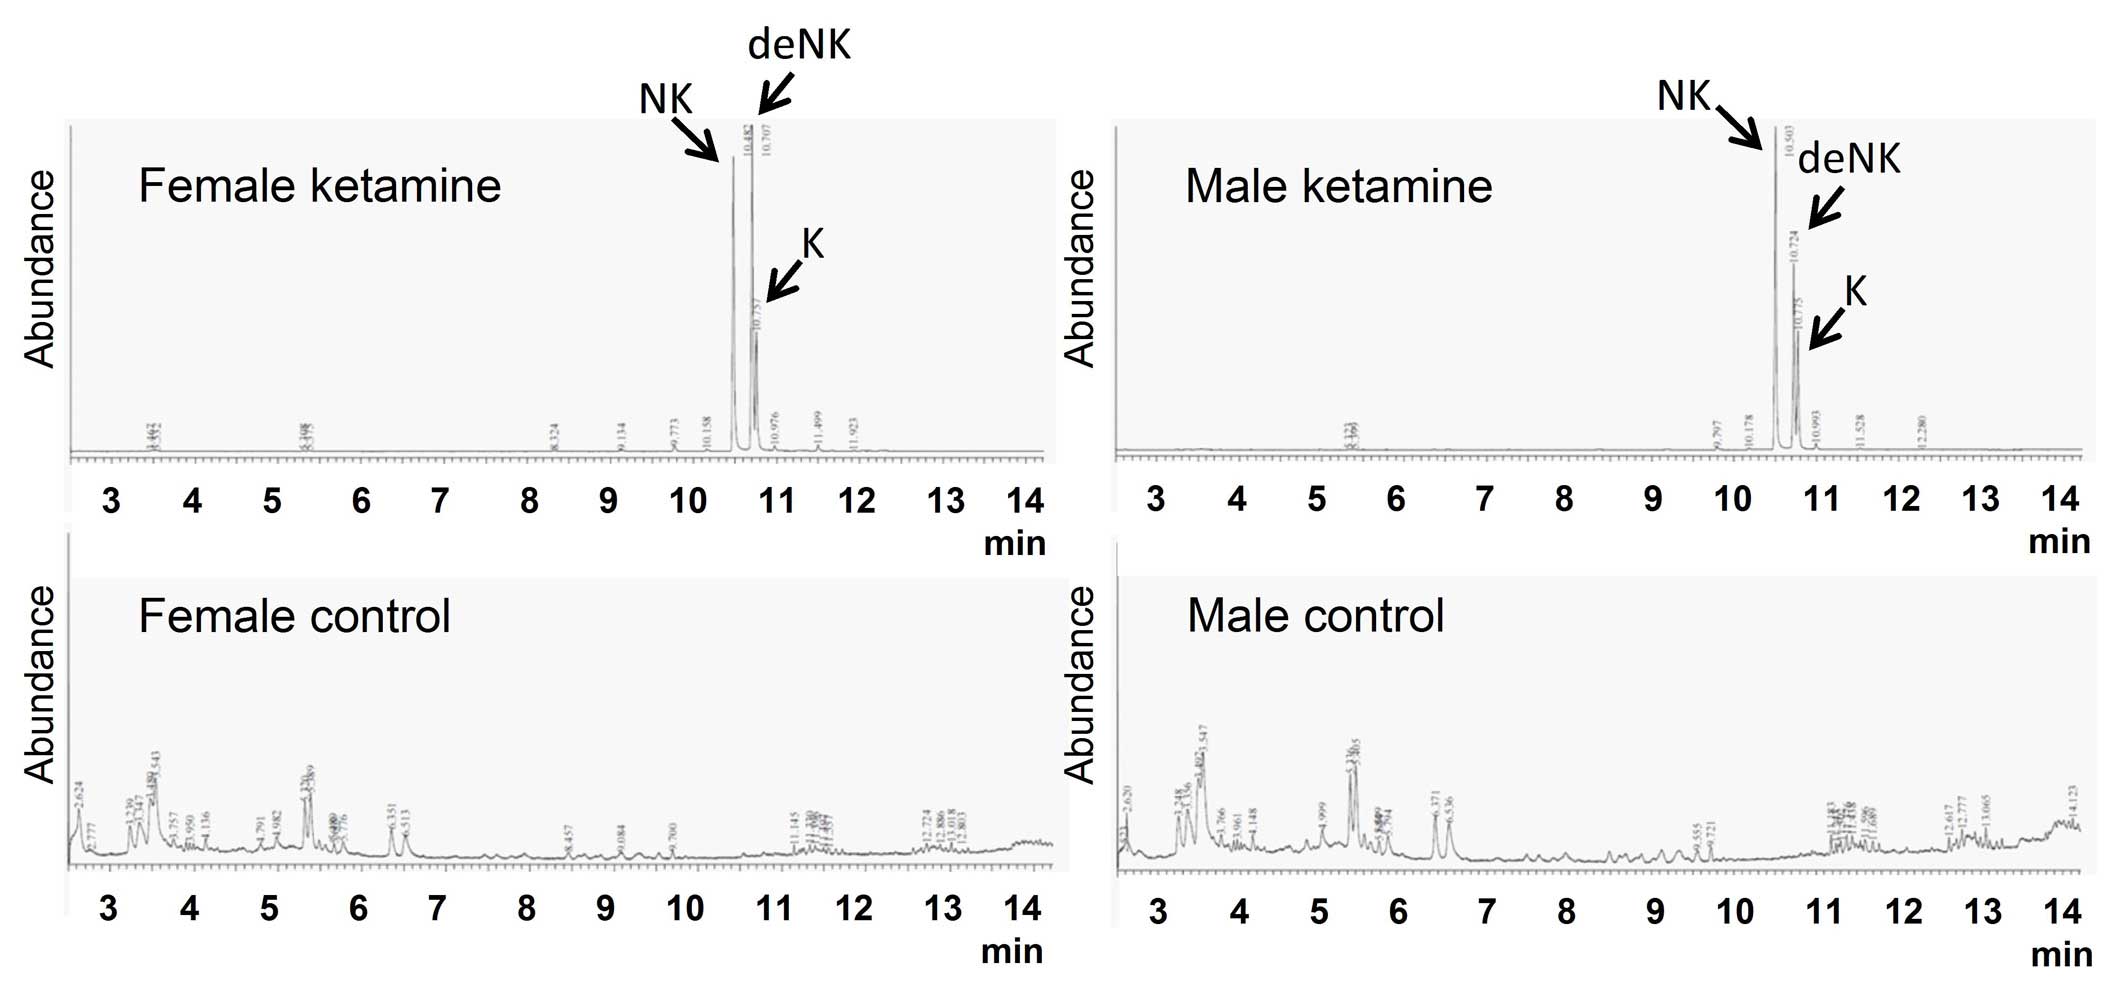
The concentrations of ketamine and ketamine
metabolites (norketamine and dehydronorketamine) in urine were
detected by GC-MS. These three types of urinary concentrations were
undetectable in the control groups (Fig. 2). Following calculation using three
individual standard curves, the concentrations of ketamine,
norketamine and dehydronorketamine in mice urine were determined
(Table I). The concentrations of
ketamine metabolites were markedly higher compared with the
original form of ketamine, which implied that the urinary toxic
effects of ketamine may result from the large quantities of
ketamine metabolites in the urine.
Effect of ketamine in the voiding
behavior of mice
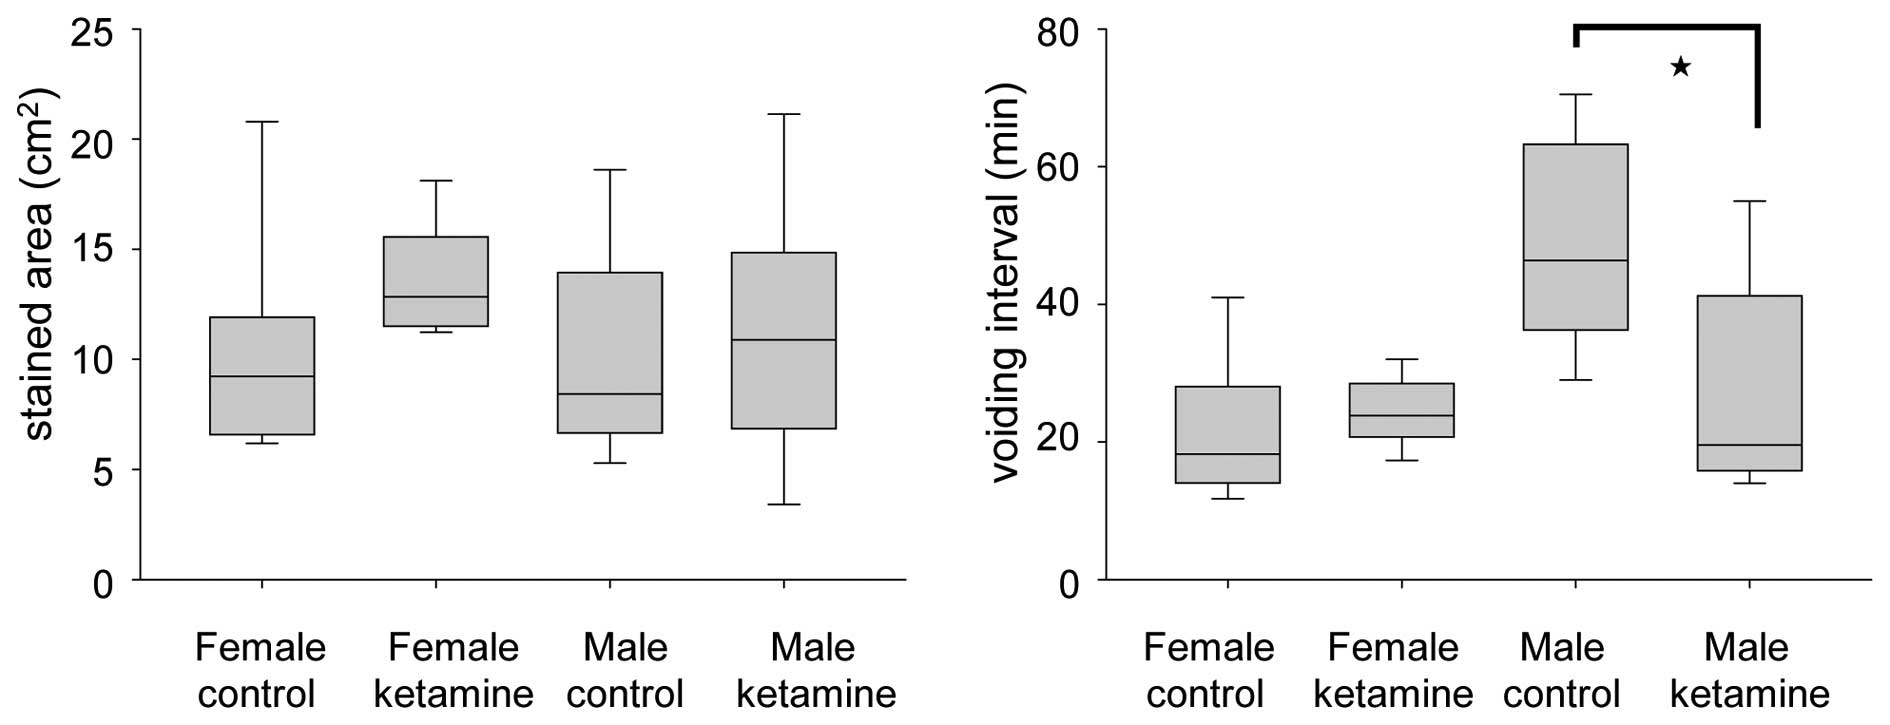
The voiding quantity and micturition interval were
recorded within 2 h using the VSOP method. At week 20, the voiding
interval of ketamine-treated male mice was found to be
significantly smaller compared with that of control male mice,
while no change was observed in the female group (Fig. 3). These results indicated that
ketamine toxicity may be more serious in male mice under long-term
ketamine influence. This phenomenon appeared consistent with the
weight loss of the ketamine-treated male mice, which was more
apparent compared with that of the ketamine-treated female
mice.
DEGs and pathways identified through
microarray analysis of mice bladder tissue
To determine the genes and pathways involved in
ketamine-induced toxicity on urinary bladder, the total RNA was
extracted from the bladders of the 20 week ketamine-treated mice
and of the control mice. The bladdes were subsequently analyzed on
the Mouse Whole Genome OneArray® v2 microarray chip
containing 27,307 probes. The whole microarray data has been
deposited in the GEO database (accession number, GSE68539). The
standard selection criteria used to identify the DEGs were
log2|fold change| ≥0.5 and P<0.05. The male and
female mice data were normalized respectively and were included
together to do the further calculation. Compared with the control
group, 44 upregulated DEGs and 70 downregulated DEGs were
identified for the ketamine-treated mice. To interpret the
biological functions of the DEGs, GO enrichment analysis, which
provides a common descriptive framework and functional annotation
of gene sets data, was performed to examine the functional
distributions and classification of the gene sets belonging to male
and female mice individually. The GO categories were separated into
three groups: Biological process, cellular component and molecular
function. The top 15 enriched GO terms of the three categories are
shown in Table II. The GO
enrichment analysis revealed that genes coding for signaling
transduction, likely concerned with the extracellular matrix (ECM)
components and cell membrane receptors, serve relevant roles. KEGG
pathway enrichment analysis was also performed to identify the
essential pathways. From the results, cytokine/chemokine- and ECM
function-associated information were much more prominent (Table III).
| Table IITop 15 enriched GO terms of DEGs. |
Table II
Top 15 enriched GO terms of DEGs.
Male mice
| Female mice
|
|---|
| Gene set name | No. genes | P-value | Gene set name | No. genes | P-value |
|---|
| Molecular
functions |
| Receptor
binding | 10 | 6.34E-06 | DNA binding | 15 | 3.29E-06 |
| Transmembrane
receptor activity | 10 | 1.55E-05 | Enzyme binding | 8 | 1.12E-05 |
| Purine
ribonucleotide binding | 7 | 3.29E-05 | Identical protein
binding | 10 | 1.42E-05 |
| Chemokine receptor
binding | 4 | 3.62E-05 | Receptor
binding | 11 | 1.62E-05 |
| Purine nucleotide
binding | 7 | 3.95E-05 | Phosphoric ester
hydrolase activity | 7 | 3.57E-05 |
| Receptor
activity | 11 | 5.12E-05 | Ion binding | 9 | 3.75E-05 |
| Transcription
repressor activity | 6 | 5.45E-05 | Cation binding | 8 | 4.07E-05 |
| Identical protein
binding | 8 | 5.73E-05 | Transcription
factor activity | 10 | 5.15E-05 |
| Nucleotide
binding | 7 | 5.76E-05 | Protein kinase
activity | 9 | 5.22E-05 |
| Adenyl
ribonucleotide binding | 6 | 8.03E-05 | Protein
homodimerization activity | 6 | 8.33E-05 |
| Enzyme regulator
activity | 8 | 8.74E-05 | Hormone
activity | 4 | 1.30E-04 |
| G protein coupled
receptor binding | 4 | 8.93E-05 | Phosphotransferase
activity alcohol group as acceptor | 9 | 1.73E-04 |
| Adenyl nucleotide
binding | 6 | 9.80E-05 | Receptor
activity | 12 | 1.91E-04 |
| Carbohydrate
binding | 4 | 2.73E-04 | Hydrolase activity
acting on ester bonds | 8 | 2.04E-04 |
| Glycosaminoglycan
binding | 3 | 4.27E-04 | Purine
ribonucleotide binding | 7 | 2.22E-04 |
| Biological
process |
| Signal
transduction | 39 | 2.71E-18 | Signal
transduction | 42 | 8.98E-16 |
| Muticellular
organismal development | 27 | 1.23E-13 | Multicellular
organismal development | 31 | 2.02E-13 |
| Response to
external stimulus | 14 | 1.10E-10 | Biopolymer
metabolic process | 38 | 1.30E-12 |
| Negative
regulation of biological process | 19 | 1.54E-10 | Positive regulation
of cellular process | 24 | 2.19E-12 |
| Cell cell
signaling | 15 | 3.25E-10 | Positive regulation
of biological process | 24 | 7.58E-12 |
| Negative
regulation of cellular process | 18 | 5.37E-10 | Negative regulation
of biological process | 23 | 1.96E-11 |
| System
development | 20 | 1.31E-09 | Negative regulation
of cellular process | 22 | 5.22E-11 |
| Anatomical
structure development | 21 | 3.69E-09 | Protein metabolic
process | 30 | 5.87E-11 |
| System
process | 16 | 3.85E-09 | System
development | 25 | 7.10E-11 |
| Intracellular
signaling cascade | 17 | 6.20E-09 | Anatomical
structure development | 27 | 8.01E-11 |
| Immune system
process | 12 | 2.70E-08 | Cellular protein
metabolic process | 28 | 1.42E-10 |
| Regulation of
biological quality | 13 | 4.21E-08 | Cellular
macromolecular metabolic process | 28 | 1.88E-10 |
| Behavior | 8 | 3.74E-07 | Regulation of
biological quality | 17 | 6.30E-10 |
| Second messenger
mediated signaling | 8 | 3.74E-07 | Cell
development | 19 | 1.94E-09 |
| Response to
stress | 13 | 3.82E-07 | Biopolymer
modification | 20 | 2.29E-09 |
| Cellular
component |
| Extracellular
region | 15 | 1.29E-09 | Membrane | 46 | 1.77E-15 |
| Membrane | 30 | 2.67E-09 | Cytoplasm | 47 | 4.46E-15 |
| Intrinsic to
membrane | 23 | 2.39E-08 | Membrane part | 36 | 1.94E-11 |
| Membrane part | 25 | 7.07E-08 | Plasma
membrane | 32 | 1.04E-10 |
| Integral to
membrane | 22 | 8.43E-08 | Cytoplasmic
part | 30 | 9.19E-10 |
| Plasma
membrane | 22 | 2.76E-07 | Integral to
membrane | 28 | 6.61E-09 |
| Extracellular
region part | 11 | 2.96E-07 | Intrinsic to
membrane | 28 | 8.80E-09 |
| Plasma membrane
part | 18 | 3.20E-06 | Extracellular
region | 15 | 7.94E-08 |
| Cytoplasm | 25 | 5.86E-06 | Plasma membrane
part | 24 | 1.12E-07 |
| Integral to plasma
membrane | 15 | 2.51E-05 | Intracellular
organelle part | 23 | 7.14E-07 |
| Intrinsic to
plasma membrane | 15 | 2.95E-05 | Organelle part | 23 | 7.67E-07 |
| Extracellular
space | 7 | 1.01E-04 | Macromolecular
complex | 19 | 3.79E-06 |
| Collagen | 3 | 1.31E-04 | Nucleus | 24 | 4.51E-06 |
| Cytoplasmic
part | 16 | 3.55E-04 | Extracellular
region | 11 | 5.85E-06 |
| Golgi
apparatus | 6 | 4.58E-04 | Nuclear part | 13 | 4.36E-05 |
| Table IIIEnriched KEGG pathway of DEGs. |
Table III
Enriched KEGG pathway of DEGs.
| KEGG pathway | No. genes | P-value |
|---|
| Male mice |
| Focal
adhesion | 7 | 1.52E-05 |
| MAPK
signaling | 7 | 9.17E-05 |
| Chemokine
signaling | 5 | 9.28E-04 |
| ECM receptor
interaction | 5 | 2.04E-05 |
| p53 signaling | 5 | 7.78E-06 |
| Vascular smooth
muscle contraction | 5 | 9.20E-05 |
| Prion disease | 4 | 1.06E-05 |
| TOLL-like receptor
signaling | 4 | 7.02E-04 |
| ABC
transporters | 3 | 6.84E-04 |
| Sphingolipid
metabolism | 3 | 5.16E-04 |
| Female mice |
| Cytokine-cytokine
receptor interaction | 10 | 1.27E-06 |
| Pathways in
cancer | 9 | 5.08E-05 |
| Dilated
cardiomyopathy | 7 | 4.78E-07 |
| MAPK
signaling | 7 | 4.58E-04 |
| Chemokine
signaling | 6 | 4.42E-04 |
| Endocytosis | 6 | 3.63E-04 |
| Arrhythmogenic
right ventricular |
|
Cardiomyopathy | 5 | 4.42E-05 |
| Hypertrophic
cardiomyopathy | 5 | 7.57E-05 |
| Oocyte
meiosis | 5 | 3.01E-04 |
| p53 signaling | 4 | 4.30E-04 |
Expression changes of genes associated
with fibrosis
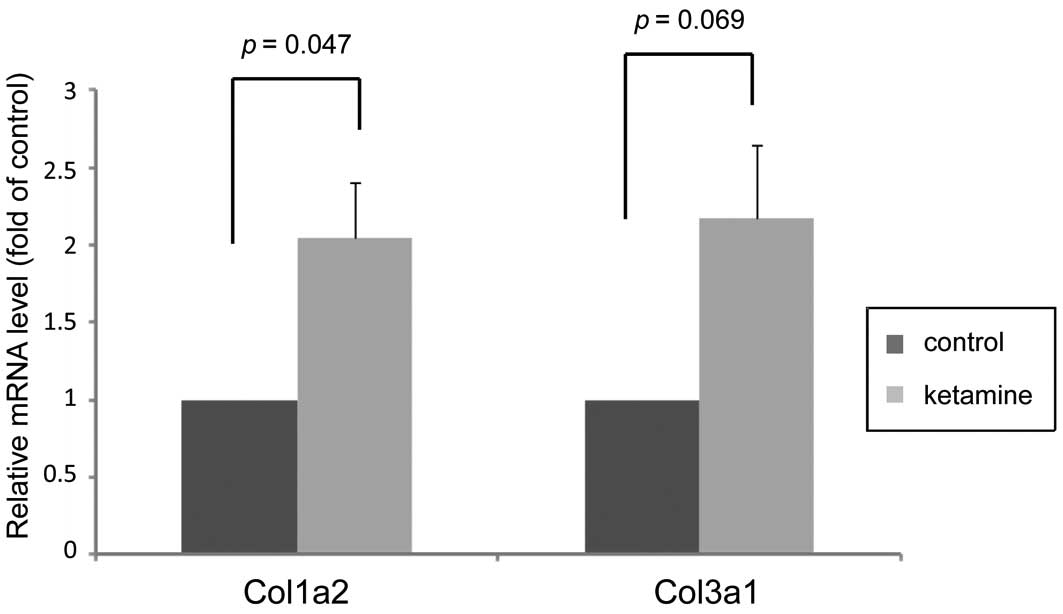
After checking the essential DEGs in detail, the
present study listed certain critical genes that are all associated
with connective tissue fibrogenesis (Table IV). Notably among them, two
collagen genes, Col3a1 and Col1a2 that encoded proteins highly
associated with bladder fibrotic diseases (16), were upregulated. Additionally, the
remaining genes obviously served as growth factors [e.g.
Amphiregulin (Areg)], cytokines/chemokine [e.g. C-C chemokine
receptor type (Ccr)2 and Chemokine (C-C motif) ligand (Ccl)7], or
that they serve a role in cell mobility [e.g. Collagen triple helix
repeat containing 1 (Cthrc1)], ECM remodeling [e.g. A
disintegrin-like and metallopeptidase with thrombospondin type 1
motif, (Adamts)1] or angiogenesis [e.g. Platelet/endothelial cell
adhesion molecule (Pecam)1 and endothelin 1], which were all
directly or indirectly involved in the progression of wound healing
and development into plausible chronic fibrosis. Taken together,
the presence of type I and III collagens accumulating together with
the DEGs in Table IV is highly
indicative of the tendency for fibrogenesis and may have a marked
association with the effects of ketamine. Furthermore, the
expression levels of Col3a1 and Col1a2 were confirmed by RT-qPCR,
which was consistent with the microarray data and revealed that
ketamine treatment increased their gene expression levels (Fig. 4).
| Table IVPotential DEGs involved in
fibrogenesis of ketamine-treated mice. |
Table IV
Potential DEGs involved in
fibrogenesis of ketamine-treated mice.
| Gene ID | Gene symbol | Official full
name | Fold change | P-value |
|---|
| 57266 | Cxcl14 | Chemokine (C-X-C
motif) ligand 14 | −0.787 | 9.49E-06 |
| 11687 | Alox15 | Arachidonate
15-lipoxygenase | −0.684 | 2.66E-03 |
| 59289 | Ccbp2 | Chemokine binding
protein 2 | −0.620 | 7.91E-05 |
| 12772 | Ccr2 | Chemokine (C-C
motif) receptor 2 | 0.939 | 1.05E-01 |
| 20306 | Ccl7 | Chemokine (C-C
motif) ligand 7 | 0.820 | 1.04E-01 |
| 12825 | Col3α1 | Collagen, type III,
α1 | 0.676 | 2.35E-03 |
| 11839 | Areg | Amphiregulin | 0.664 | 1.42E-02 |
| 12843 | Col1α2 | Collagen, type I,
α2 | 0.654 | 4.06E-04 |
| 68588 | Cthrc1 | Collagen triple
helix repeat containing 1 | 0.609 | 2.25E-02 |
| 13614 | Edn1 | Endothelin 1 | 0.595 | 1.04E-02 |
| 11504 | Adamts1 | A disintegrin-like
and metallopeptidase with thrombospondin type 1 motif, 1 | 0.548 | 5.84E-03 |
| 12832 | Col5α2 | Collagen, type V,
α2 | 0.521 | 2.43E-02 |
| 18613 | Pecam1 |
Platelet/endothelial cell adhesion
molecule 1 | 0.517 | 1.10E-02 |
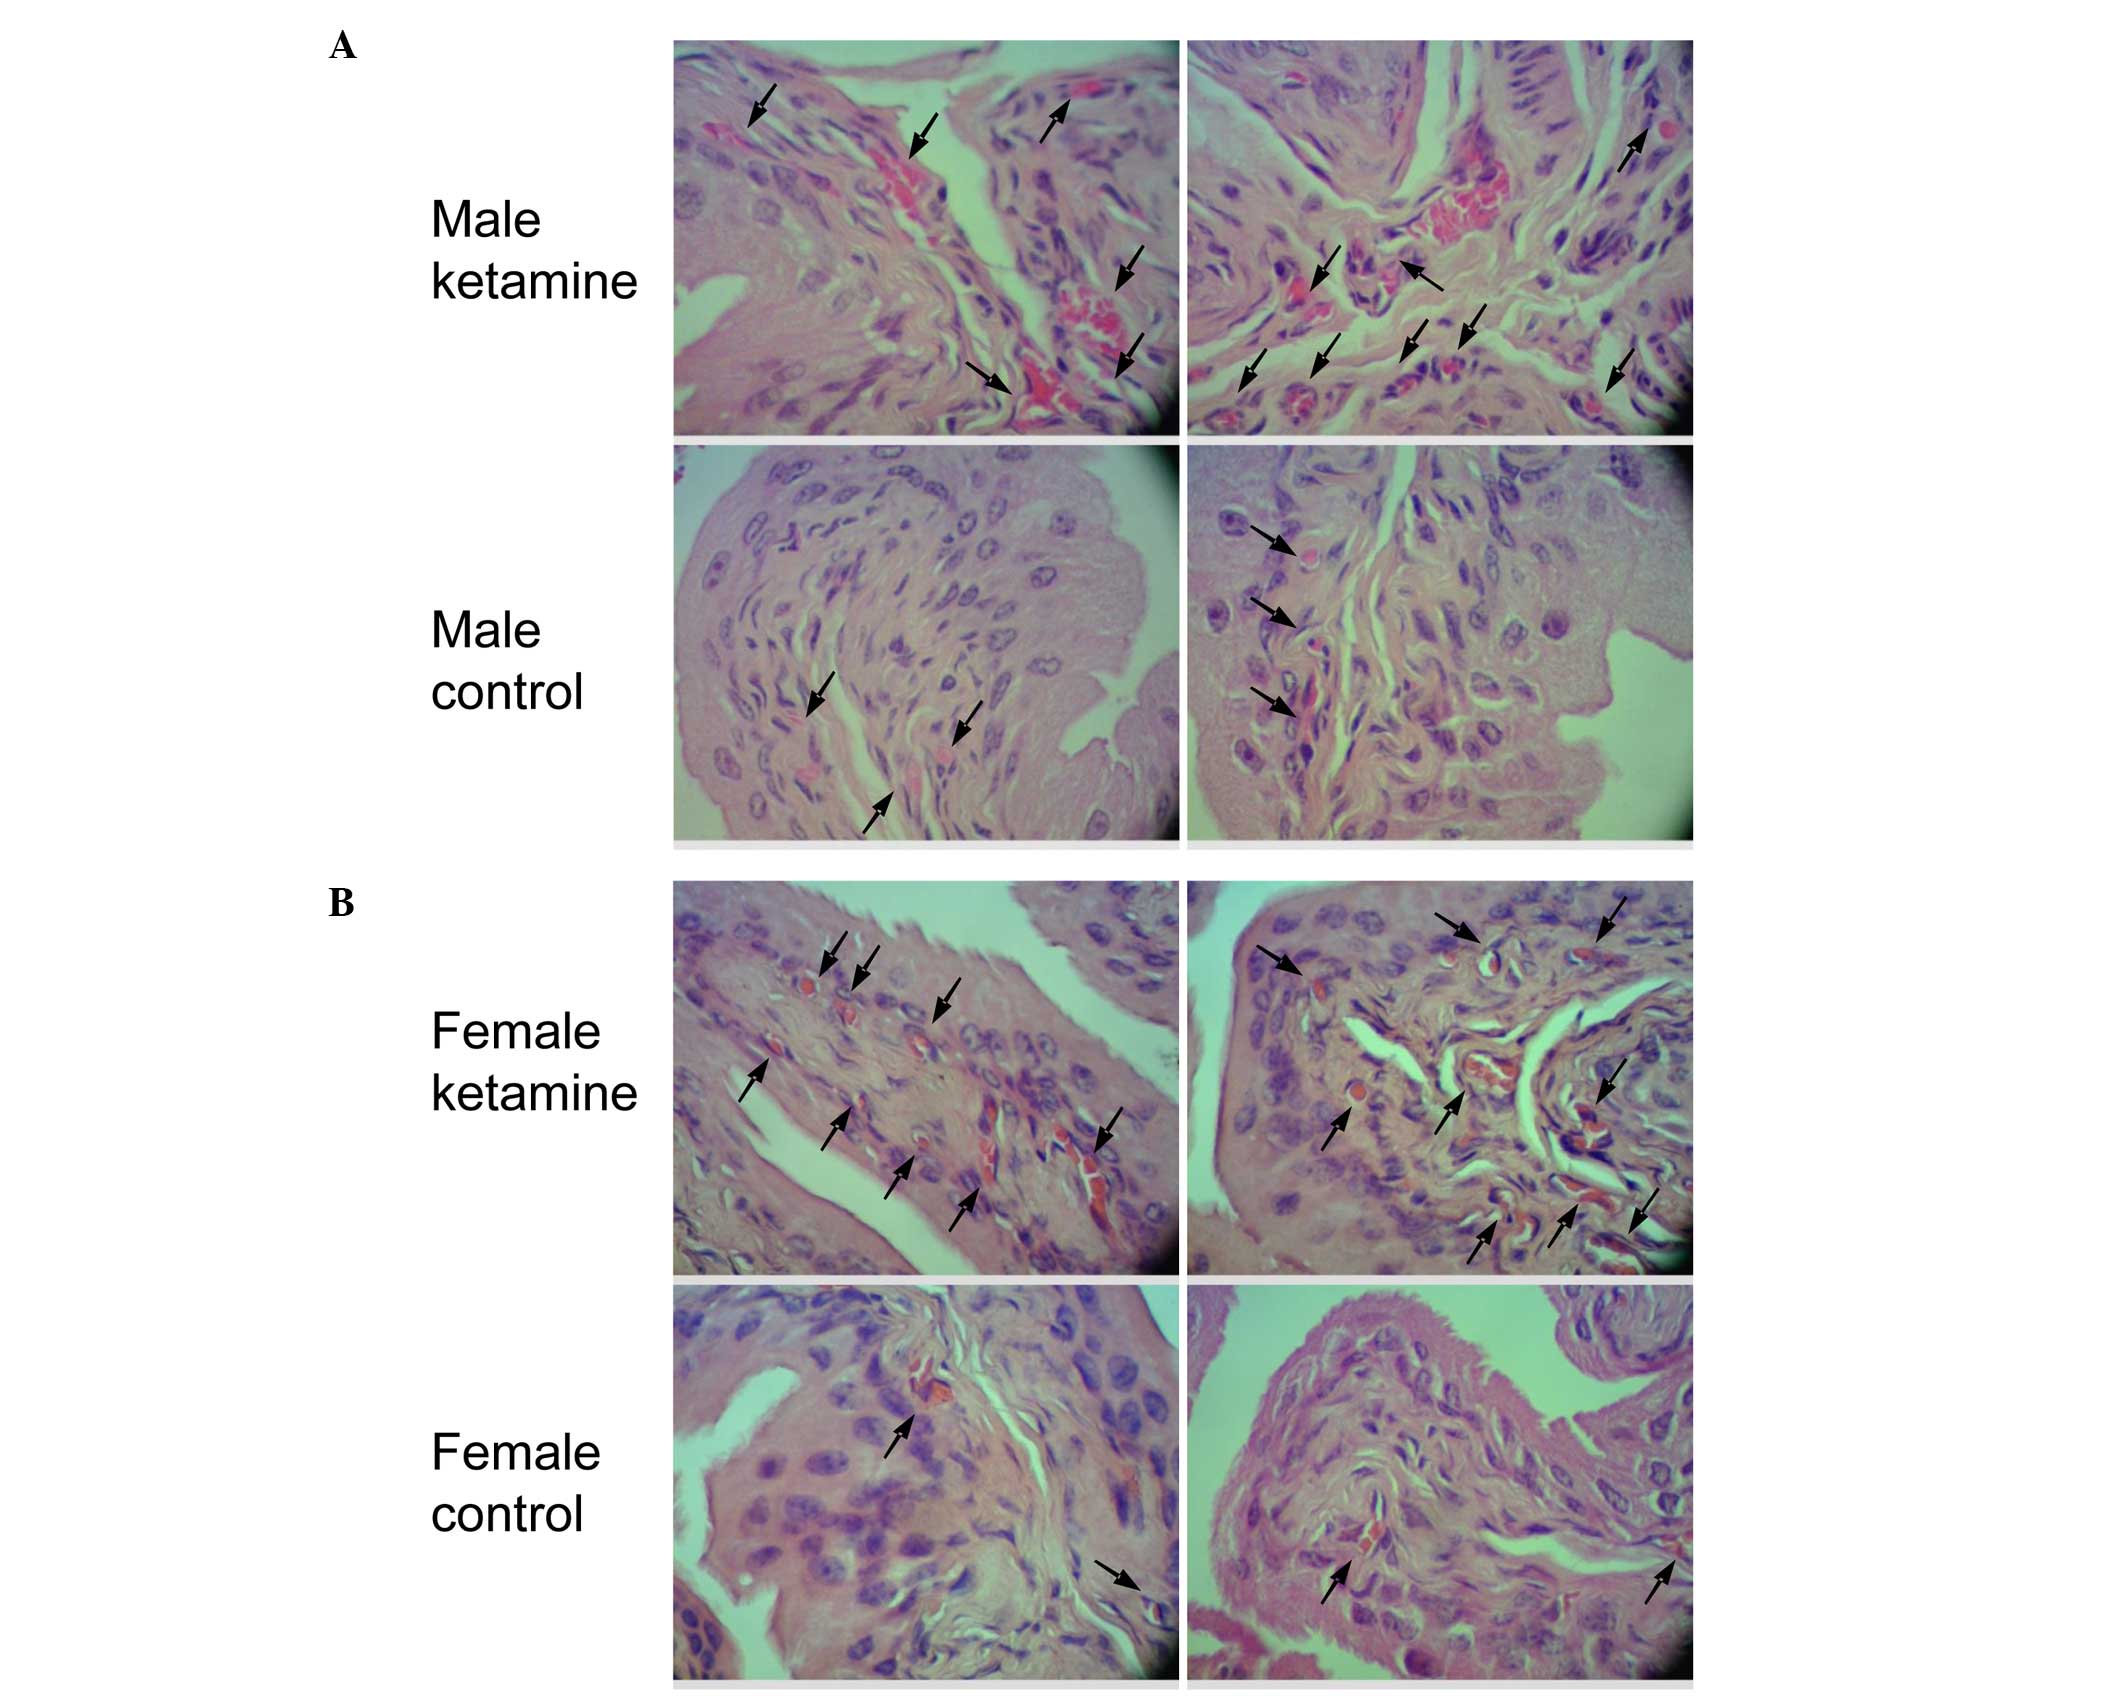
Effect of ketamine in bladder
angiogenesis and fibrosis by histopathological analysis
Since two angiogenesis-associated genes were found
to be upregulated in the result of microarray analysis, the bladder
HE stain was used to confirm the vessel distribution. When compared
with the control mice, the ketamine-injected mice exhibited
prominently denser blood vessel distribution in the submucosal
layer (Fig. 5). According to the
increase in blood vessel number, it fits with the biological
results of angiogenic factors found in the DEGs of the present
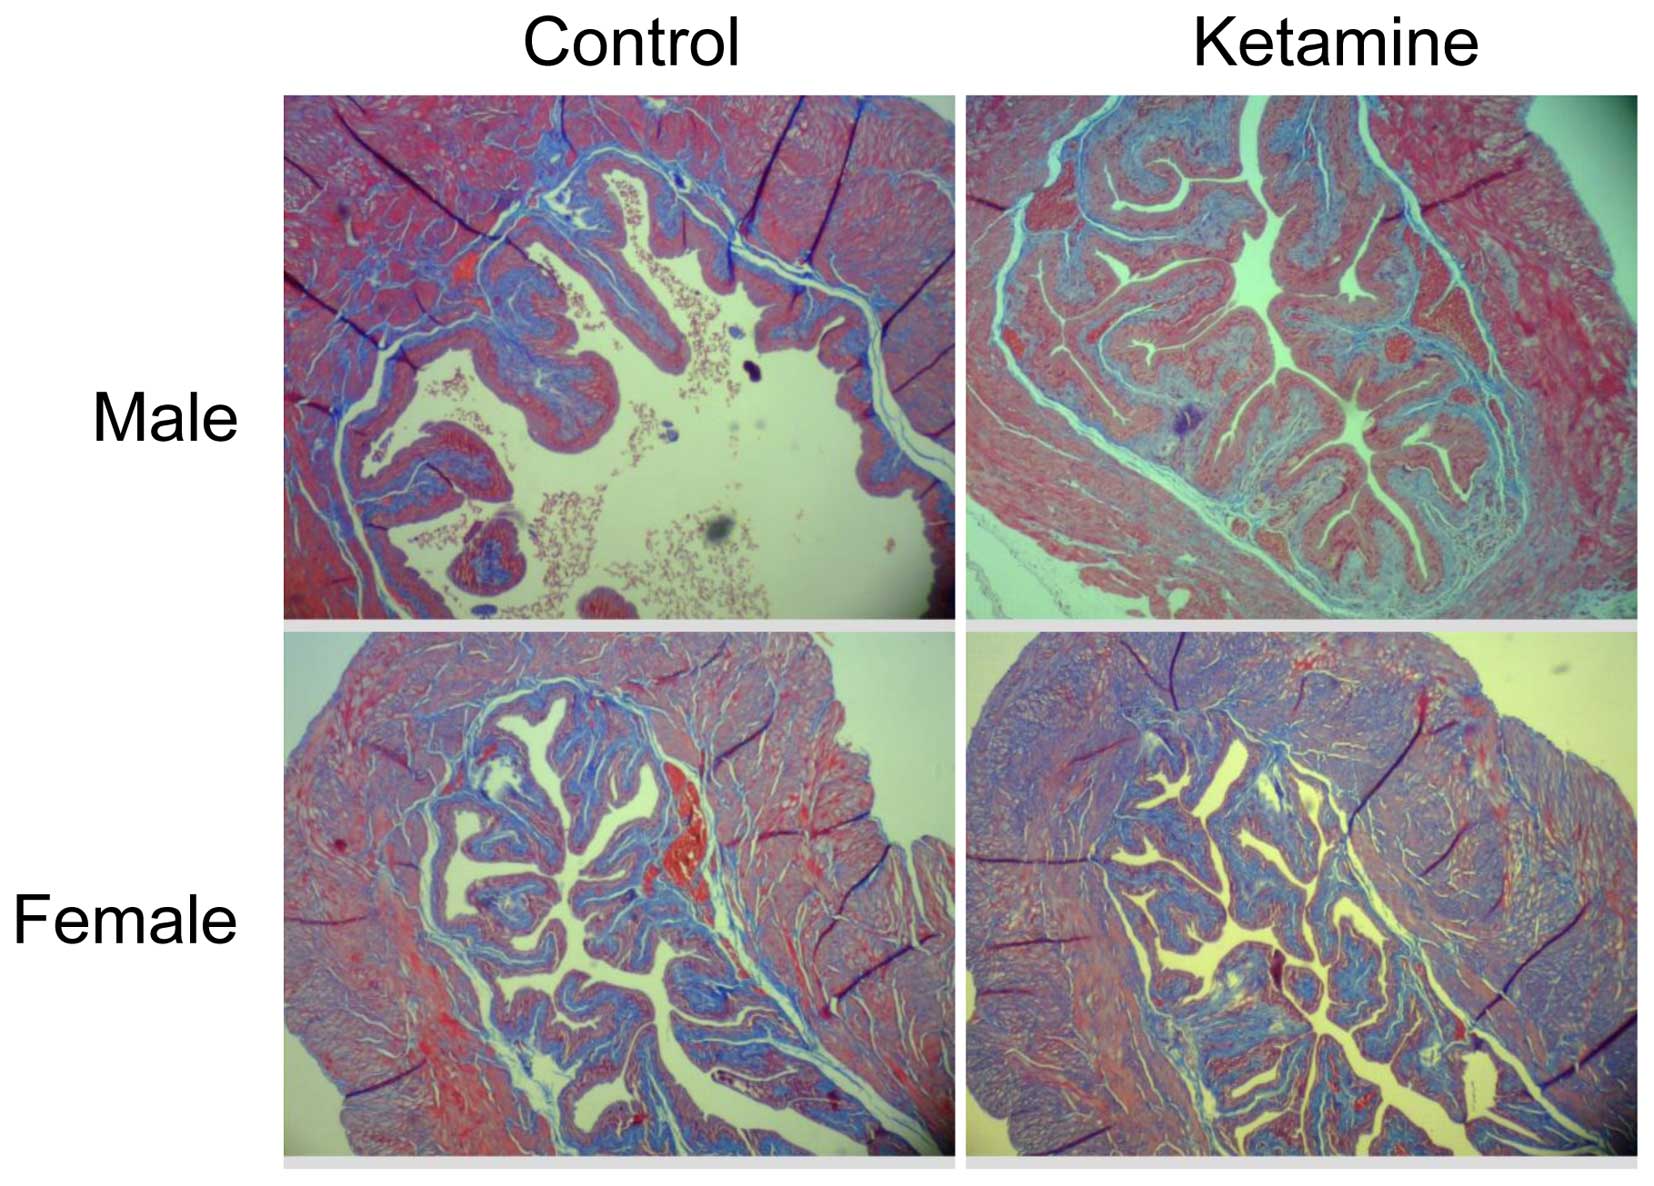
microarray data. The present study also verified the collagen
density by Masson's trichrome stain analysis (Fig. 6). However, it revealed no obvious
increase of collagen accumulation in the submucosa region between
the ketamine-treated with control groups due to the similar ratio
calculated using ImageJ from connective tissue area relative to
muscle tissue or urothelial layer area (data not shown). This
result indicated that the progression of fibrogenesis likely
remained at the initial stage.
Discussion
In the present study, a 20 week ketamine-injection
mouse model was used to characterize the effects of long-term
ketamine abuse on bladders by examining critical changes of gene
expression. The aim was to explore the mechanisms for clinical
management or therapeutic development. Through GC-MS
quantification, high concentrations of ketamine and its metabolites
were present in mice urine following injection (Table I and Fig. 2). In addition, after 2 weeks of
ketamine treatment, the body weight of the ketamine-treated group
was significantly lower compared with the control mice. This
phenomenon may result from reduced food consumption, similar to the
loss of appetite and weight shown in human abusers (17), as well as in animals (8). Additionally, the presence of
decreased body weight may likely reflect the physiological stress
suffered from ketamine treatment. Notably, the body weight loss and
voiding behavior change in the ketamine-treated male mice were more
obvious compared with that in female mice. This result may be
associated with the higher concentration of ketamine and
norketamine measured in the urine of male group (Table I). However, other factors related
to mouse gender, including the difference in hormone or metabolic
enzymes, may also serve a role and require future investigation. In
addition, from the microarray analysis, the most obvious clues come
from the upregulated type I (Col1a2) and III (Col3a1) collagens
(Table IV and Fig. 4), since their enriched
transcription has been considered sensitive markers of active
fibrogenesis (18,19). To date, the pathological cause of
fibrosis affected by ketamine toxicity remains to be completely
elucidated.
In general, fibrosis originates from an abnormal
wound healing process in which tissue repair is deregulated as a
result of excessive ECM accumulation. According to the classical
model of wound healing, the cellular course of events can be
divided into certain sequential, yet overlapping phases, including
inflammatory, proliferative and tissue remodeling stages (20,21).
During the proliferation phase in particular, if the production of
pro-inflammatory cytokines/chemokines and growth factors by
parenchymal cells is persistent, the ongoing ECM production will
eventually destroy the normal balance between collagen formation
and degradation (22). In this
context, it was revealed that several chemokines and corresponding
receptor, including Ccr2, Ccl7 and Ccbp2, were involved (Table IV). Ccr2 has been reported to
initiate the fibrotic environment in the liver and lung (23,24).
Similarly, overexpressed Ccl7 in fibroblasts also contributes to
excessive accumulation of the ECM (25). By contrast, Ccbp2 is hypothesized
to act as a chemokine scavenger to counteract the function of Ccl2
(26). Notably, the expression of
Ccbp2 simultaneously decreased in the present results. Additional
clues come from the increased expression of growth factor-like
molecule endothelin-1, since accumulating evidence has suggested
that endothelin-1 would result in fibrogenesis via an autocrine
loop (27), which drives
fibroblast activation, proliferation, as well as differentiation
into myofibroblasts thus leading to excessive collagen deposition
(28). Another pivotal
anti-fibrotic factor, Alox15, which is the key enzyme for the
synthesis of lipoxins, can counteract fibroblast activation and
experimental fibrosis (29).
Notably, in the present data, Alox15 remains on the negative
expression list.
Wound healing is a dynamic and complex process that
requires cooperative regulation of angiogenesis and cell migration
capacity (20). Angiogenesis is
essential in wound healing progression for the provision of oxygen
and nutrients to the associated fibroblasts and for the
transportation of blood-borne precursor cells to the healing area
(30). To this point, the
upregulation of Pecam1 (CD31) just happens to demonstrate the
abundant formation of blood vessels and correlates with the result
of the HE staining. By contrast, the lower expression of Cxcl14, a
potent inhibitor of angiogenesis based on its ability to inhibit
endothelial cell chemotaxis, is likely to facilitate
neovascularization as well (31).
Apart from them, two upregulated growth factor-like molecules, Areg
and Cthrc1 (Collagen triple helix repeat-containing protein 1),
also have the high potential to correlate with angiogenesis and
cell migration. For example, Cthrc1 can trigger Wnt signaling,
which in turn induces subsequent angiogenic program or promotes
migratory ability (32,33). Areg belongs to the epidermal growth
factor family and is able to mediate transforming growth
factor-β-induced pulmonary fibrosis (34). There is also evidence showing that
Areg stimulates cell proliferation and exerts a potent
anti-apoptotic effects on isolated fibrogenic cells (35). Another associated candidate in
Table IV, Adamts1, which encodes
a secreted and matrix-associated zinc metalloendopeptidase, was
found to promote shedding of the transmembrane precursors of Areg
and activation of the epidermal growth factor pathway (36). Taken together, the present findings
suggested that persistent activation of the aforementioned
chemokines and growth factors may drive urinary bladder
fibrogenesis through angiogenesis and cell migration.
In view of the aforementioned causes coupled to the
deregulated wound healing process and excessive mRNA level for
collagens, although no obvious occurrence of immune cells
infiltration was confirmed, as well as collagen proteins
accumulation, it was still concluded that the results of the DEGs
clearly demonstrated the existence of fibrogenic actions at an
early stage. These findings have important implications of the
molecular mechanisms underlying ketamine-induced urinary bladder
fibrosis and reveal novel targets for the future development of
effective therapies.
Abbreviations:
|
DEG
|
differentially expressed genes
|
|
GC-MS
|
gas chromatography-mass
spectrometry
|
|
GO
|
gene ontology
|
|
HE stain
|
hematoxylin and eosin stain
|
|
KEGG
|
Kyoto encyclopedia of genes and
genomes
|
|
MOA
|
mouse oligonucleotide DNA
microarray
|
|
VSOP
|
voided stain on paper
|
Acknowledgments
The present study was supported by grants from the
National Science Council of the Republic of China, Taiwan (no.
NSC101-2320-B-415-002-MY3) and from Chiayi Christian Hospital,
Taiwan (no. R102-17).
References
|
1
|
Domino EF, Chodoff P and Corssen G:
Pharmacologic Effects of Ci-581, a new dissociative anesthetic, in
man. Clin Pharmacol Ther. 6:279–291. 1965. View Article : Google Scholar : PubMed/NCBI
|
|
2
|
Shahani R, Streutker C, Dickson B and
Stewart RJ: Ketamine-associated ulcerative cystitis: A new clinical
entity. Urology. 69:810–812. 2007. View Article : Google Scholar : PubMed/NCBI
|
|
3
|
Chu PS, Kwok SC, Lam KM, Chu TY, Chan SW,
Man CW, Ma WK, Chui KL, Yiu MK, Chan YC, et al: 'Street
ketamine'-associated bladder dysfunction: A report of ten cases.
Hong Kong Med J. 13:311–313. 2007.PubMed/NCBI
|
|
4
|
Chu PS, Ma WK, Wong SC, Chu RW, Cheng CH,
Wong S, Tse JM, Lau FL, Yiu MK and Man CW: The destruction of the
lower urinary tract by ketamine abuse: A new syndrome? BJU Int.
102:1616–1622. 2008. View Article : Google Scholar : PubMed/NCBI
|
|
5
|
Chuang SM, Liu KM, Li YL, Jang MY, Lee HH,
Wu WJ, Chang WC, Levin RM and Juan YS: Dual involvements of
cyclooxygenase and nitric oxide synthase expressions in
ketamine-induced ulcerative cystitis in rat bladder. Neurourol
Urodyn. 32:1137–1143. 2013. View Article : Google Scholar : PubMed/NCBI
|
|
6
|
Yeung LY, Rudd JA, Lam WP, Mak YT and Yew
DT: Mice are prone to kidney pathology after prolonged ketamine
addiction. Toxicol Lett. 191:275–278. 2009. View Article : Google Scholar : PubMed/NCBI
|
|
7
|
Juan YS, Lee YL, Long CY, Wong JH, Jang
MY, Lu JH, Wu WJ, Huang YS, Chang WC and Chuang SM: Translocation
of NF-kB and expression of cyclooxygenase-2 are enhanced by
ketamine-induced ulcerative cystitis in rat bladder. Am J Pathol.
185:2269–2285. 2015. View Article : Google Scholar : PubMed/NCBI
|
|
8
|
Meng E, Chang HY, Chang SY, Sun GH, Yu DS
and Cha TL: Involvement of purinergic neurotransmission in ketamine
induced bladder dysfunction. J Urol. 186:1134–1141. 2011.
View Article : Google Scholar : PubMed/NCBI
|
|
9
|
Gu D, Huang J, Shan Z, Yin Y, Zheng S and
Wu P: Effects of long-term ketamine administration on rat bladder
protein levels: A proteomic investigation using two-dimensional
difference gel electrophoresis system. Int J Urol. 20:1024–1031.
2013.PubMed/NCBI
|
|
10
|
Sangkum P, Gokce A, Tan RB, Bouljihad M,
Kim H, Mandava SH, Saleem SN, Lasker GF, Yafi FA, Abd Elmageed ZY,
et al: Transforming growth factor-β1 induced urethral fibrosis in a
rat model. J Urol. 194:820–827. 2015. View Article : Google Scholar : PubMed/NCBI
|
|
11
|
Shen CH, Wang ST, Lee YR, Liu SY, Li YZ,
Wu JD, Chen YJ and Liu YW: Biological effect of ketamine in
urothelial cell lines and global gene expression analysis in the
bladders of ketamine-injected mice. Mol Med Rep. 11:887–895.
2015.
|
|
12
|
Tsai TH, Cha TL, Lin CM, Tsao CW, Tang SH,
Chuang FP, Wu ST, Sun GH, Yu DS and Chang SY: Ketamine-associated
bladder dysfunction. Int J Urol. 16:826–829. 2009. View Article : Google Scholar : PubMed/NCBI
|
|
13
|
Veilleux-Lemieux D, Castel A, Carrier D,
Beaudry F and Vachon P: Pharmacokinetics of ketamine and xylazine
in young and old Sprague-Dawley rats. J Am Assoc Lab Anim Sci.
52:567–570. 2013.PubMed/NCBI
|
|
14
|
Wu CH, Huang MH, Wang SM, Lin CC and Liu
RH: Gas chromatography-mass spectrometry analysis of ketamine and
its metabolites-a comparative study on the utilization of different
derivatization groups. J Chromatogr A. 1157:336–351. 2007.
View Article : Google Scholar : PubMed/NCBI
|
|
15
|
Sugino Y, Kanematsu A, Hayashi Y, Haga H,
Yoshimura N, Yoshimura K and Ogawa O: Voided stain on paper method
for analysis of mouse urination. Neurourol Urodyn. 27:548–552.
2008. View Article : Google Scholar : PubMed/NCBI
|
|
16
|
Deveaud CM, Macarak EJ, Kucich U, Ewalt
DH, Abrams WR and Howard PS: Molecular analysis of collagens in
bladder fibrosis. J Urol. 160:1518–1527. 1998. View Article : Google Scholar : PubMed/NCBI
|
|
17
|
Corazza O, Assi S and Schifano F: From
'Special K' to 'Special M': The evolution of the recreational use
of ketamine and methoxetamine. CNS Neurosci Ther. 19:454–460. 2013.
View Article : Google Scholar : PubMed/NCBI
|
|
18
|
Reyes-Gordillo K, Shah R,
Arellanes-Robledo J, Hernández-Nazara Z, Rincón-Sánchez AR, Inagaki
Y, Rojkind M and Lakshman MR: Mechanisms of action of acetaldehyde
in the up-regulation of the human α2(I) collagen gene in hepatic
stellate cells: Key roles of Ski, SMAD3, SMAD4, and SMAD7. Am J
Pathol. 184:1458–1467. 2014. View Article : Google Scholar : PubMed/NCBI
|
|
19
|
Wong L, Hutson PR and Bushman W: Prostatic
inflammation induces fibrosis in a mouse model of chronic bacterial
infection. PloS One. 9:e1007702014. View Article : Google Scholar : PubMed/NCBI
|
|
20
|
Stadelmann WK, Digenis AG and Tobin GR:
Physiology and healing dynamics of chronic cutaneous wounds. Am J
Surg. 176(Suppl 2A): S26–S38. 1998. View Article : Google Scholar
|
|
21
|
Broughton G II, Janis JE and Attinger CE:
The basic science of wound healing. Plast Reconstr Surg. 117(Suppl
7): S12–S34. 2006. View Article : Google Scholar
|
|
22
|
Zeisberg M and Kalluri R: Cellular
mechanisms of tissue fibrosis. 1. Common and organ-specific
mechanisms associated with tissue fibrosis. Am J Physiol Cell
Physiol. 304:C216–C225. 2013. View Article : Google Scholar :
|
|
23
|
Seki E, de Minicis S, Inokuchi S, Taura K,
Miyai K, van Rooijen N, Schwabe RF and Brenner DA: CCR2 promotes
hepatic fibrosis in mice. Hepatology. 50:185–197. 2009. View Article : Google Scholar : PubMed/NCBI
|
|
24
|
Moore BB, Kolodsick JE, Thannickal VJ,
Cooke K, Moore TA, Hogaboam C, Wilke CA and Toews GB: CCR2-mediated
recruitment of fibrocytes to the alveolar space after fibrotic
injury. Am J Pathol. 166:675–684. 2005. View Article : Google Scholar : PubMed/NCBI
|
|
25
|
Ong VH, Carulli MT, Xu S, Khan K, Lindahl
G, Abraham DJ and Denton CP: Cross-talk between MCP-3 and TGFbeta
promotes fibroblast collagen biosynthesis. Exp Cell Res.
315:151–161. 2009. View Article : Google Scholar
|
|
26
|
Graham GJ and Locati M: Regulation of the
immune and inflammatory responses by the 'atypical' chemokine
receptor D6. J Pathol. 229:168–175. 2013. View Article : Google Scholar
|
|
27
|
Shi-Wen X, Rodríguez-Pascual F, Lamas S,
Holmes A, Howat S, Pearson JD, Dashwood MR, du Bois RM, Denton CP,
Black CM, et al: Constitutive ALK5-independent c-Jun N-terminal
kinase activation contributes to endothelin-1 overexpression in
pulmonary fibrosis: Evidence of an autocrine endothelin loop
operating through the endothelin A and B receptors. Mol Cell Biol.
26:5518–5527. 2006. View Article : Google Scholar : PubMed/NCBI
|
|
28
|
Swigris JJ and Brown KK: The role of
endothelin-1 in the pathogenesis of idiopathic pulmonary fibrosis.
BioDrugs. 24:49–54. 2010. View Article : Google Scholar : PubMed/NCBI
|
|
29
|
Krönke G, Reich N, Scholtysek C,
Akhmetshina A, Uderhardt S, Zerr P, Palumbo K, Lang V, Dees C,
Distler O, et al: The 12/15-lipoxygenase pathway counteracts
fibroblast activation and experimental fibrosis. Ann Rheum Dis.
71:1081–1087. 2012. View Article : Google Scholar : PubMed/NCBI
|
|
30
|
Tonnesen MG, Feng X and Clark RA:
Angiogenesis in wound healing. J Investig Dermatol Symp Proc.
5:40–46. 2000. View Article : Google Scholar
|
|
31
|
Shellenberger TD, Wang M, Gujrati M,
Jayakumar A, Strieter RM, Burdick MD, Ioannides CG, Efferson CL,
El-Naggar AK, Roberts D, et al: BRAK/CXCL14 is a potent inhibitor
of angiogenesis and a chemotactic factor for immature dendritic
cells. Cancer Res. 64:8262–8270. 2004. View Article : Google Scholar : PubMed/NCBI
|
|
32
|
Ye X, Wang Y, Cahill H, Yu M, Badea TC,
Smallwood PM, Peachey NS and Nathans J: Norrin, frizzled-4, and
Lrp5 signaling in endothelial cells controls a genetic program for
retinal vascularization. Cell. 139:285–298. 2009. View Article : Google Scholar : PubMed/NCBI
|
|
33
|
Ma MZ, Zhuang C, Yang XM, Zhang ZZ, Ma H,
Zhang WM, You H, Qin W, Gu J, Yang S, et al: CTHRC1 acts as a
prognostic factor and promotes invasiveness of gastrointestinal
stromal tumors by activating Wnt/PCP-Rho signaling. Neoplasia.
16:265–278. 278.e1–e13. 2014. View Article : Google Scholar : PubMed/NCBI
|
|
34
|
Zhou Y, Lee JY, Lee CM, Cho WK, Kang MJ,
Koff JL, Yoon PO, Chae J, Park HO, Elias JA and Lee CG:
Amphiregulin, an epidermal growth factor receptor ligand, plays an
essential role in the pathogenesis of transforming growth
factor-β-induced pulmonary fibrosis. J Biol Chem. 287:41991–42000.
2012. View Article : Google Scholar : PubMed/NCBI
|
|
35
|
Perugorria MJ, Latasa MU, Nicou A,
Cartagena-Lirola H, Castillo J, Goñi S, Vespasiani-Gentilucci U,
Zagami MG, Lotersztajn S, Prieto J, et al: The epidermal growth
factor receptor ligand amphiregulin participates in the development
of mouse liver fibrosis. Hepatology. 48:1251–1261. 2008. View Article : Google Scholar : PubMed/NCBI
|
|
36
|
Liu YJ, Xu Y and Yu Q: Full-length
ADAMTS-1 and the ADAMTS-1 fragments display pro- and antimetastatic
activity, respectively. Oncogene. 25:2452–2467. 2006. View Article : Google Scholar
|