Introduction
Lung cancer is reported to be the leading cause of
cancer-associated mortality among males in developed and developing
countries, and its mortality is the leading cause among females in
developed countries (1,2). Non-small cell lung cancer (NSCLC)
occupies the majority of the lung cancer cases and exhibits a high
mortality rate, and a low 5-year survival rate (3). A high metastatic potential of NSCLC
generates the lowest survival outcome (4). The complex process of tumorigenesis
and metastasis is due to a variety of factors, which remain to be
elucidated. Therefore, exploring the molecular mechanisms of NSCLC
metastasis is required for more effective clinical therapies.
Numerous studies have performed high-throughput
microarray technology and analysis methods for investigating the
molecular mechanisms in human diseases. For example, the study by
Sun et al (5) performed an
integrative microarray approach to analyze the genome-wide mRNA
expression in osteosarcoma cell lines and identified 8 ‘hub’ genes
that appeared to be involved in osteosarcoma (5). Huang et al (6) identified epithelial-mesenchymal
transition-associated prognostic biomarkers that predicted the
distant metastasis of lung cancer using DNA microarray and survival
data (6). The widespread use of
high-throughput technologies allows for the simultaneous and
convenient comprehensive examination of the global gene expression.
Application of these technologies can identify genes that may be
used as novel molecular targets for clinical treatment. The
bioinformatics analysis revealed more information with regards to
the significant functions, pathways, conceivable connections and
signaling of these differentially expressed genes (DEGs). The
interaction among DEGs, particularly the functional modules in the
interaction network, also remain to be elucidated for the molecular
mechanisms of metastasis. A previous study established a highly
metastatic lung cancer cell subline (SPC-A-1sci) from a weakly
metastatic cell line (SPC-A-1) through in vivo selection in
NOD/SCID mice (7). This pair of
cell lines provided an appropriate model for exploring the
mechanisms of NSCLC metastasis. Therefore, microarray analysis of
this pair of cell lines was performed to identify the
metastasis-related genes (MRGs) from the mRNA expression profiles
with comprehensive array analysis and in vitro
experiments.
Metallothionein 1X (MT1X) is involved in mineral
absorption and organism-specific biosystems. The T([20]) repeat in
the 3′-untranslated region of the MT1X gene has been reported to be
a sensitive and specific marker for detecting microsatellite
instability in colorectal cancer (8). A development of cisplatin resistance
was confirmed following knockdown of MT1X (9). The present study observed that a
knockdown of MT1X decreased the metastatic ability of the NSCLC
cell lines through a series of in vitro experiments. This
finding confirmed that the present microarray offers valuable
information regarding the metastatic mechanisms of NSCLC.
Materials and methods
Cell lines and cell culture
The SPC-A-1 human lung cancer cell line was
originally isolated from the surgical specimens of a Chinese
patient with advanced lung adenocarcinoma at the Shanghai Chest
Hospital and Cellular Institute of Chinese Academy of Science
(Shanghai, China). The highly metastatic lung cancer cell line,
SPC-A-1sci, was obtained from the Cellular Institute of Chinese
Academy of Science (Shanghai, China) and was established by
Professor Ming Yao (Shanghai Jiaotong University, The Shanghai
Cancer Institute, Shanghai, China) from the weakly metastatic cell
line (SPC-A-1) through selection in NOD/SCID mouse models (7). A549, H1299, PC-9, LC-21, H358, H292,
SPC-A-1 and SPC-A-1sci NSCLC cell lines (all from the American Type
Culture Collection, Manassas, VA, USA) were cultured in Dulbecco's
modified Eagle's medium (Thermo Fisher Scientific, Inc., Waltham,
MA, USA), supplemented with 10% fetal bovine serum (South America
origin; Biowest USA, Riverside, MO, USA), 100 U/ml penicillin
(Sigma-Aldrich; Merck Millipore, Darmstadt, Germany) and 100 µg/ml
streptomycin (Sigma-Aldrich; Merck Millipore) in a humidified
incubator at 37°C with 5% CO2.
Microarray data analysis
The total RNA from each cell line was harvested
using the RNeasy Mini kit (Qiagen GmbH, Hilden, Germany), according
to the manufacturer's instructions. In total, 6 specimens,
including three replicates of SPC-A-1sci and three replicates of
SPC-A-1 RNA specimens, were sent to Shanghai OE-Biotech Co., Ltd.
(Shanghai, China) and were processed according to the Agilent
Technologies, Inc. (Santa Clara, CA, USA) technical instructions.
Feature Extraction software (version 10.7.1.1; Agilent
Technologies, Inc.) was used to analyze the array images to obtain
the raw data. Genespring software (version 12.5; Agilent
Technologies, Inc.) was used to finish the basic analysis with the
raw data that was normalized with the quantile algorithm.
DEGs screening
The probes with ≥1 of 2 conditions which have flags
in ‘P’ were selected for further data analysis. DEGs were
subsequently identified through fold change, and the P-value
calculated with the t-test. The threshold set for up and
downregulated genes was a fold change ≥2.0 and P≤0.05.
Functional analysis and pathway
enrichment analysis
Gene-annotation enrichment analyses were applied to
determine the roles of these DEGs. Gene Ontology (GO; www.geneontology.org/) provides extensive details,
which consists of biological process, cellular components and
molecular functions (10). The
Kyoto Encyclopedia of Genes and Genomes (KEGG; www.genome.ad.jp/kegg/) is a comprehensive database
resource and forms a high-throughput data-mining environment
(11).
Protein-protein interaction (PPI)
network and module construction
Interaction networks between the proteins encoded by
the DEGs were identified using the database, BioGRID 3.4
(thebiogrid.org/), and were visualized by
Cytoscape 3.2 (cytoscape.org/). Modular analysis of
the PPI network was performed in ClusterONE (/www.paccanarolab.Org.sci-hub.org/clusterone/).
The cut-off criterion was false discovery rate <0.01 and the
clique value (k) was 6.
Small interfering RNA (siRNA)
transfection
siRNA oligonucleotides were synthesized by Guangzhou
RiboBio Co., Ltd. (Guangdong, China). Lipofectamine 2000 reagent
(Invitrogen; Thermo Fisher Scientific, Inc.) was used to deliver
siRNAs into the cells, according to the manufacturer's
instructions. Briefly, 3×10⁵ cells/well were plated into
6-well plates and cultured overnight to achieve 50–70% confluence,
and were subsequently washed with PBS. A mixture of Lipofectamine
2000 reagent and siRNA was added to the cells to final
concentrations of 5 ml/well and 2.5 mg/well, respectively, followed
by incubation at 37°C for 48 h. The transfection efficiency was
determined by reverse transcription-polymerase chain reaction
(RT-PCR).
Preparation of the protein
extracts
All procedures were performed on ice. Proteins from
the cultured SPC-A-1sci and SPC-A-1 cell lines were harvested from
8-cm culture plates, rinsed with cold PBS three times, scraped
using a cell scraper, and were subsequently transferred into 1.5 ml
tubes and lysed with 200 ml ice-cold lysis buffer per tube. After a
40 min incubation on ice, the lysates were centrifuged at 12,000 ×
g for 10 min at 4°C. The supernatants were collected and
stored at −20°C. Protein concentrations were measured with a
bicinchoninic acid protein assay kit (Thermo Fisher Scientific,
Inc.).
Western blot analysis
The protein samples (20 µg) were run on a 10%
SDS-PAGE gel and were transferred onto nitrocellulose (NC)
membranes. The NC membranes with protein were blocked in 5%
fat-free powdered milk at room temperature for 2 h. The primary
antibodies used areas follows: Primary rabbit polyclonal
anti-A-kinase anchoring protein 12 (AKAP12; 1:200 dilution; cat.
no. 25199-1-AP; ProteinTech Group, Inc., Chicago, IL, USA), rabbit
polyclonal anti-aldehyde dehydrogenase 7 family member A1 (ALDH7A1;
1:5,000 dilution; cat. no. 2070-S; Epitomics, Burlingame, CA, USA),
rabbit polyclonal anti-caveolin 1 (CAV1; cat. no. 21112-1; 1:500
dilution; Signalway Antibody LLC, College Park, MD, USA), rabbit
polyclonal anti-erb-b2 receptor tyrosine kinase 2 (Erbb2; 1:1,000
dilution; cat. no. 2165s; Cell Signaling Technology, Inc., Danvers,
MA, USA), rabbit polyclonal anti-growth arrest and DNA damage
inducible α (GADD45α; 1:200 dilution; cat. no. sc-797; Santa Cruz
Biotechnology, Inc., Dallas, TX, USA), goat polyclonal anti-keratin
18 (Krt18; 1:200 dilution; cat. no. 35624; Signalway Antibody LLC),
goat polyclonal anti-myosin heavy chain 9 (MYH9; 1:500 dilution;
cat. no. c2910; Santa Cruz Biotechnology, Inc.), goat polyclonal
anti-proliferating cell nuclear antigen (PCNA; 1:100 dilution; cat.
no. AF0239; Affinity Bioscience, Cincinnati, OH, USA), rabbit
polyclonal anti-carbamoyl-phosphate synthase 1 (CPS1; 1:200
dilution; cat. no. AP16053a; Abgent, Inc., San Diego, CA, USA),
rabbit polyclonal anti-phosphoglycerate dehydrogenase (PHGDH; 1:300
dilution; cat. no. AP2936c; Abgent, Inc.) and anti-β-actin
(1:5,000; cat. no. ab14128; Abcam, Cambridge, MA, USA). The
secondary antibodies were anti-goat-horseradish peroxidase (HRP)
(cat. no. A5420) and anti-rabbit-HRP (RABHRP1) (1:200;
Sigma-Aldrich; Merck Millipore). β-actin, was used as a
normalization for all the protein samples. Primary antibodies were
added and incubated for 1 h at room temperature and subsequently
overnight at 4°C. Following three washes in Tris-buffered saline
and Tween-20 (TBST; 10 min/wash), the corresponding secondary
antibody solution was added and the membranes were incubated for 1
h at room temperature. Subsequent to washing three times in TBST,
immunolabeling was visualized by electrochemiluminescence (EMD
Millipore, Billerica, MA, USA) and the chemiluminescence was
developed using film.
RT-quantitative PCR (RT-qPCR)
analysis
RNA samples were harvested using TRIzol reagent
(Invitrogen; Thermo Fisher Scientific, Inc.). The RT reagents were
used for the RT process at 37°C for 15 min and 85°C for 5 sec and
were obtained from Takara Biotechnology Co., Ltd. (Dalian, China).
Primary data were analyzed on a 7300 Real-Time PCR system with SDS
RQ Study software (Applied Biosystems; Thermo Fisher Scientific,
Inc.), according to the manufacturer's instructions. The cycling
conditions were as follows: Initial denaturation at 95°C for 10
sec, 40 cyles of 95°C for 5 sec and 60°C for 31 sec. cDNA templates
were combined with SYBR-Green premix, containing ROX (Takara
Biotechnology Co., Ltd.), to perform the RT-qPCR reactions. β-actin
was used as the endogenous control for quantifying the mRNA levels.
All the primers were provided by Shanghai Sunny Biotechnology Co.,
Ltd. (Shanghai, China; Table I).
The reactions were performed in triplicate and the
2−ΔΔCq method (12) was
used for quantification.
 | Table I.Primer sequence and basic information
for the 18 differentially expressed genes are listed. |
Table I.
Primer sequence and basic information
for the 18 differentially expressed genes are listed.
| Gene symbol | Gene name | Primer
direction | Primer sequence
(5′-3′) | Product | Fold change |
|---|
| Krt18 | Keratin 18 | F |
CCTACAAGCCCAGATTGCCA | 115 bp | 0.8530092 |
|
|
| R |
CCGAGCCAGCTCGTCATATT |
|
|
| Erbb2 | v-Erb-b2
erythroblastic leukemia viral oncogene homolog 2 | F |
CTCATCTACCAGGAGTGGCG | 112 bp | 5.041576 |
|
|
| R |
AAATACATCGGAGCCAGCC |
|
|
| MYH9 | Myosin, heavy chain
9 | F |
CGCGAAGTCAGCTCCCTAAA | 114 bp | 2.887932 |
|
|
| R |
GCCATCTACCTCTTCGTCGG |
|
|
| CAV1 | Caveolin 1 | F |
AGAACCTTGGGGATGTGCCT | 198 bp | 4.459152 |
|
|
| R |
AACTGTGAGGAGGTTTCCCTG |
|
|
| PRSS3 | Protease, serine,
3 | F |
GATGCAGACGGCTGCGAGG | 200 bp | 8.477807 |
|
|
| R |
TGGATGCGGGTCTTGTAGCA |
|
|
| MT1X | Metallothionein
1X | F |
CGCTGCGTGTTTTCCTCTTG | 157 bp | 3.608919 |
|
|
| R |
AGGAGCAGCAGCTCTTCTTG |
|
|
| AMFR | Autocrine motility
factor receptor | F |
CACCATCATCAGCGCCTACC | 182 bp | 3.332796 |
|
|
| R |
CTAGAACCCACACGAAGAGGC |
|
|
| ENTPD5 | Ectonucleoside
triphosphate diphosphohydrolase 5 | F |
TCAACCTAAGCAGGGTGCTG | 143 bp | 2.245442 |
|
|
| R |
CCTTGGCTTTGTGTTCTGGC |
|
|
| AKAP12 | A kinase (PRKA)
anchor protein 12 | F |
GCCACCAAGCTCCTACAGAA | 137 bp | 1.987722 |
|
|
| R |
TGGCTGTTTAGGGCTCCTTG |
|
|
| Aldh7a1 | Aldehyde
dehydrogenase 7 family, member A1 | F |
TCCTGTGTTCCAACCGCTAC | 154 bp | 5.018206 |
|
|
| R |
GCTAGGCTCAGCGAATGGAT |
|
|
| GADD45α | Growth arrest and
DNA-damage-inducible, alpha | F |
CACTGTCGGGGTGTACGAAG | 157 bp | 1.839682 |
|
|
| R |
GTTGATGTCGTTCTCGCAGC |
|
|
| PCNA | Proliferating cell
nuclear antigen | F |
TCTTCCCTTACGCAAGTCTCAG | 194 bp | −2.700688 |
|
|
| R |
GTCCTTGAGTGCCTCCAACA |
|
|
| PHGDH | Phosphoglycerate
dehydrogenase | F |
TGACAACACCTTTGCCCAGT | 147 bp | −2.815167 |
|
|
| R |
GGCGGCTCTTCCGTAAACA |
|
|
| FTSJ3 | FtsJ homolog 3 | F |
GAGGGGCGGCTACTCG | 299 bp | −6.439978 |
|
|
| R |
ATCCCTCAATCTAGACCCAGAGC |
|
|
| FKBP10 | FK506 binding
protein 10 | F |
GATGTGGTCATCGAGAGGTA | 139 bp | −11.381450 |
|
|
| R |
CCAAGGTGTTGCGATCATAG |
|
|
| FABP3 | Fatty acid binding
protein 3 | F |
AGCCTAGCCCAGCATCACTA | 107 bp | −11.937390 |
|
|
| R |
TAGCAAAACCCACACCGAGT |
|
|
| KYNU | Kynureninase | F |
TGGACAAGCGAAGGGTTGTTA | 109 bp | −3.508240 |
|
|
| R |
GTAGGAACACCAGCAGGCAA |
|
|
| CPS1 | Carbamoyl-phosphate
synthase 1 | F |
AGCAATCATTCCGGCCAAGA | 114 bp | −4.574547 |
|
|
| R |
CAGGGACATTGTTGGCGTTG |
|
|
Migration and invasion assays
Cell migration and invasion assays were performed
with 6.5-mm Transwell chambers (8-mm pore size; Corning
Incorporated, Corning, NY, USA). The cells were seeded at 100,000
cells per well into Transwell chambers and Matrigel-coated
Transwell chambers for the migration and invasion assays,
respectively. After 16 h incubation for the two assays, the cells
that remained on the upper chamber were removed with a cotton swab,
and the entire chamber was fixed with methyl alcohol and stained
with crystal violet. Migrated cells were counted using a CKX41
microscope (Olympus Corporation, Tokyo, Japan) at ×400
magnification and a DP20 Imaging system (Olympus Corporation).
Images from three random fields from three replicate wells were
captured and the number of cells that had migrated and invaded were
counted.
Statistical analysis
The results are presented as the mean ± standard
deviation. Comparisons of the quantitative data were analyzed by
the Student's t-test between two groups (two-tailed). Differences
between more than one group were analyzed using a one-way analysis
of variance with Bonferroni post-hoc test. P<0.05 was considered
to indicate a statistically significant difference. Analyses were
performed with SPSS 19.0 for Windows (IBM SPSS, Armonk, NY,
USA).
Results
DEG analysis
In total, 4,838 DEGs were screened, including 798
upregulated genes and 4,040 downregulated genes (fold change ≥2.0
and P≤0.05). There were more downregulated compared with
upregulated genes.
Functional analysis and pathway
enrichment analysis
The 10 most enriched GO functions for the DEGs are
listed in Tables II–IV. For the upregulated genes, the
enriched functions in the biological process category included gene
expression (P=1.46E-28), translation (P=1.46E-16), viral process
(P=5.94E-16) and the cellular protein metabolic process
(P=52.06E-13). The enriched cellular component categories were
cytosol (P=1.96E-31), membrane (P=52.79E-29), nucleoplasm
(P=51.56E-25) and mitochondrion (P=5.02E-23). The enriched
molecular function categories were poly-(A) RNA binding
(P=1.46E-28), protein binding (P=1.46E-16), structural constituent
of the ribosome (P=5.94E-16) and RNA binding (P=2.06E-13). The 10
most enriched KEGG pathways for the DEGs are listed in Table V. DEGs were predominantly enriched
in the biosynthesis of antibiotics (P=5.81E-08), carbon metabolism
(P=5.20E-07), spliceosome (P=5.81E-07) and ribosome
(P=7.39E-07).
| Table II.Top ten significantly enriched BP
terms in non-small cell lung cancer cell lines. |
Table II.
Top ten significantly enriched BP
terms in non-small cell lung cancer cell lines.
| Term | Category | Description | Count | P-value |
|---|
| GO:0010467 | BP | Gene
expression | 364 | 1.46E-28 |
| GO:0006412 | BP | Translation | 127 | 1.46E-16 |
| GO:0016032 | BP | Viral process | 228 | 5.94E-16 |
| GO:0044267 | BP | Cellular protein
metabolic process | 239 | 2.06E-13 |
| GO:0000278 | BP | Mitotic cell
cycle | 172 | 2.55E-12 |
| GO:0006614 | BP | SRP-dependent
cotranslational protein targeting to membrane | 65 | 2.31E-10 |
| GO:0044281 | BP | Small molecule
metabolic process | 430 | 2.81E-10 |
| GO:0019058 | BP | Viral life
cycle | 77 | 4.81E-10 |
| GO:0006413 | BP | Translational
initiation | 74 | 5.82E-10 |
| GO:0008380 | BP | RNA splicing | 108 | 8.55E-10 |
| Table IV.Top ten significantly enriched MF
terms in non-small cell lung cancer cell lines. |
Table IV.
Top ten significantly enriched MF
terms in non-small cell lung cancer cell lines.
| Term | Category | Description | Count | P-value |
|---|
| GO:0010467 | MF | Poly (A) RNA
binding | 364 | 1.46E-28 |
| GO:0006412 | MF | Protein
binding | 127 | 1.46E-16 |
| GO:0016032 | MF | Structural
constituent of ribosome | 228 | 5.94E-16 |
| GO:0044267 | MF | RNA binding | 239 | 2.06E-13 |
| GO:0000278 | MF | Identical protein
binding | 172 | 2.55E-12 |
| GO:0006614 | MF | Enzyme binding | 65 | 2.31E-10 |
| GO:0044281 | MF | Protein domain
specific binding | 430 | 2.81E-10 |
| GO:0019058 | MF | ATP binding | 77 | 4.81E-10 |
| GO:0006413 | MF | Unfolded protein
binding | 74 | 5.82E-10 |
| GO:0008380 | MF | Transcription
factor binding | 108 | 8.55E-10 |
| Table V.Top ten significantly enriched Kyoto
Encyclopedia of Genes and Genomes pathway in non-small cell lung
cancer cell lines. |
Table V.
Top ten significantly enriched Kyoto
Encyclopedia of Genes and Genomes pathway in non-small cell lung
cancer cell lines.
| Pathway | Count | Term | P-value |
|---|
| Path:hsa01130 | 101 | Biosynthesis of
antibiotics | 5.81E-08 |
| Path:hsa01200 | 62 | Carbon
metabolism | 5.20E-07 |
| Path:hsa03040 | 69 | Spliceosome | 5.81E-07 |
| Path:hsa03010 | 70 | Ribosome | 7.39E-07 |
| Path:hsa03013 | 76 | RNA transport | 1.63E-05 |
| Path:hsa04141 | 74 | Protein processing
in endoplasmic reticulum | 2.66E-05 |
| Path:hsa05012 | 63 | Parkinson's
disease | 9.04E-05 |
| Path:hsa01230 | 39 | Biosynthesis of
amino acids | 0.000125444 |
| Path:hsa00190 | 59 | Oxidative
phosphorylation | 0.00012915 |
| Path:hsa04932 | 64 | Non-alcoholic fatty
liver disease | 0.000189471 |
PPI network and module
construction
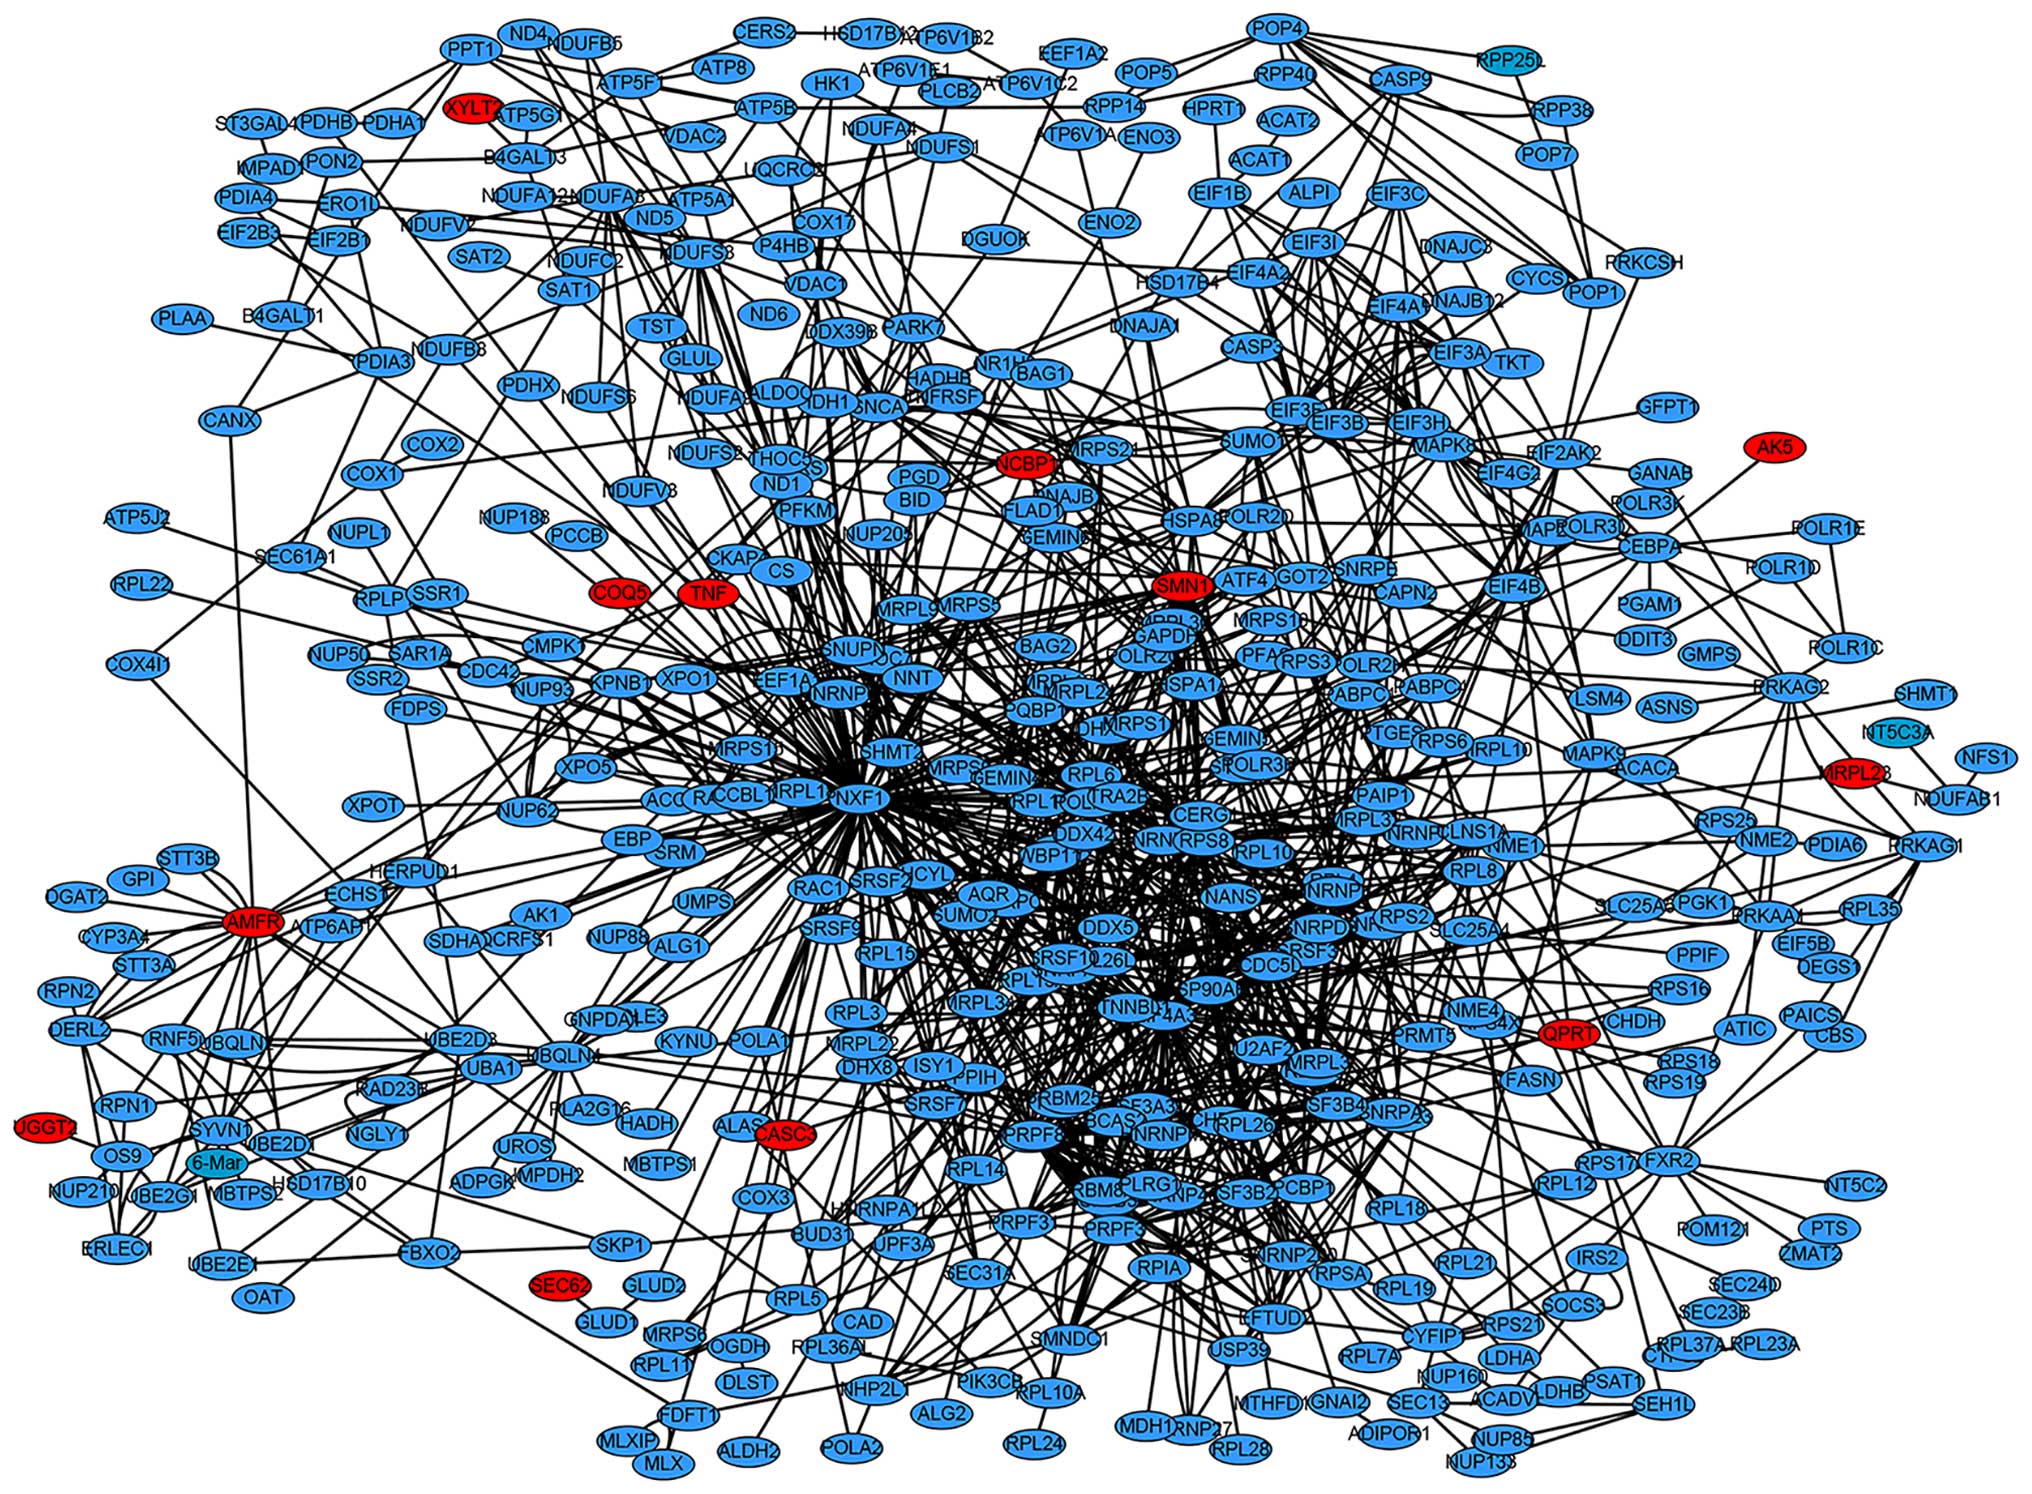
The PPI network of the DEGs was revealed to have 426
nodes and 1,156 interactions (Fig.
1). Cluster analysis was performed with ClusterONE. A total of
56 modules were obtained from the PPI network, of which the top two
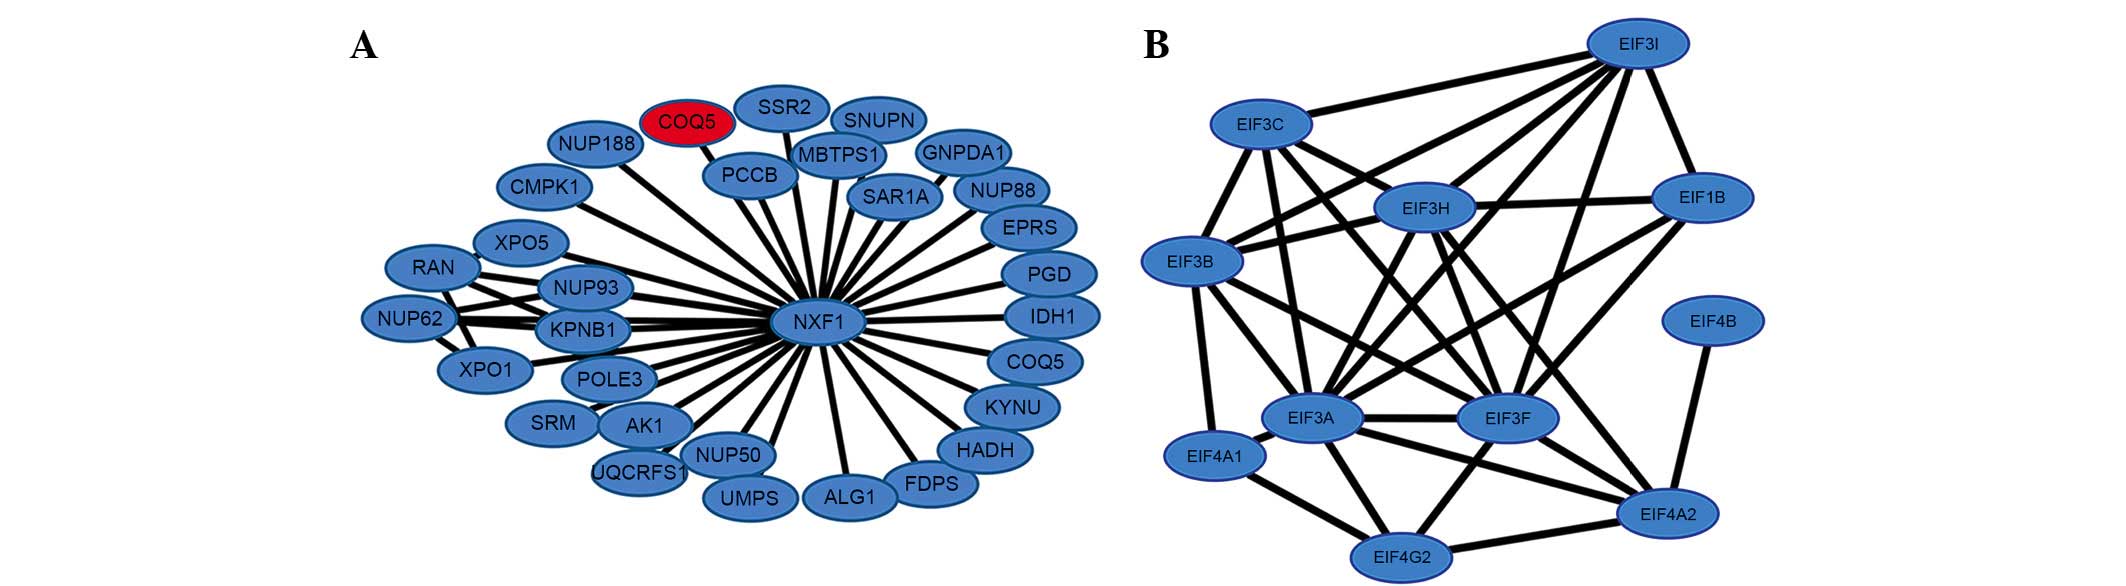
modules (modules A and B) are presented in Fig. 2. The enriched pathways for the DEGs
in the two modules are listed in Table VI. Module A had 31 nodes and 36
interactions. The four most enriched KEGG pathways for DEGs in
module A were biosynthesis of antibiotics (P=5.81E-08), protein
processing in the endoplasmic reticulum (P=2.66E-05), RNA transport
(P=0.00093377) and pyrimidine metabolism (P=0.034919775). The
module density was 0.103, quality was 0.353 and P=1.151E-7. Module
A predominantly consisted of downregulated genes and its ‘hub’ gene
was nuclear RNA export factor 1 (NXF1) with a degree of 107. In
this module, 11 genes were identified to participate in the mRNA
transport pathway, including NXF1, nucleoporin (NUP) 88, NUP188,
NUP50, karyopherin subunit β 1 (KPNB1), exportin (XPO) 1, NUP62,
NUP93, RAN member RAS oncogene family, snurportin 1 and XPO5. NXF1
transports mRNA by bulk export pathways (13). The interactome network analysis in
the expression profiles of the precursor-B-cell acute lymphoblastic
leukemia cell lines in a previous study predicted that bulk
dysregulation of NXF1 predicted poor prognosis for acute
lymphoblastic leukemia, and numerous mRNA export factors, including
NXF1 and NUP88, are deemed to be potential therapeutic targets in
cancer (14).
| Table VI.Enriched Kyoto Encyclopedia of Genes
and Genomes pathways for differentially expressed genes in modules
A-B. |
Table VI.
Enriched Kyoto Encyclopedia of Genes
and Genomes pathways for differentially expressed genes in modules
A-B.
| Module | Pathway | Numbers of
genes | Examples of
genes | P-value |
|---|
| A | Biosynthesis of
antibiotics | 4 | PCCB, SDHA, HADH,
IDH1 | 5.81E-08 |
|
| Protein processing
in endoplasmic reticulum | 2 | IDH1, SDHA | 2.66E-05 |
|
| RNA transport | 11 | NXF1, NUP88,
NUP188, NUP50 KPNB1, XPO1, NUP62, NUP93, RAN, SNUPN, XPO5 | 0.000933778 |
|
| Pyrimidine
metabolism | 2 | POLE3, CMPK1 | 0.034919775 |
| B | RNA transport | 9 | EIF3B, EIF3C,
EIF3C, EIF4A1, EIF3H, EIF4B, EIF3F, EIF1B, EIF4A2 | 1.63E-05 |
|
| Viral
myocarditis | 1 | EIF4G2 | 0.07922721 |
|
| Proteoglycans in
cancer | 1 | EIF4B | 0.134513214 |
|
| mTOR signaling
pathway | 1 | EIF4B | 0.255698228 |
Module B had 6 nodes and 15 interactions. In this
module, DEGs were predominantly enriched in RNA transport
(P=1.63E-05), viral myocarditis (P=0.07922721), proteoglycans in
cancer (P=0.134513214) and the mechanistic target of rapamycin
(mTOR) signaling pathway (P=0.255698228). The module density was
0.764, quality was 0.689 and P=5.248E-7. Module B consisted of 11
downregulated genes and its ‘hub’ genes were eukaryotic translation
initiation factor (EIF) 3A, EIF3F and EIF3B, with the same degree
of 15. EIF3A has been previously reported to improve cisplatin
sensitivity in ovarian cancer, and its overexpression in urinary
bladder cancer and NSCLC can provide a prognostic value (15–17).
EIF3F is downregulated in several cancer types, particularly in
melanoma and pancreatic cancer cells, and has a tumor suppressive
effect (18,19). EIF3B is reported to inhibit
migration in NSCLC (20).
RT-qPCR and western blotting
validation of the expression of selected DEGs
Notably, among the DEGs, insulin-like growth
factor-II mRNA binding protein 3, lipocalin2, colony stimulating
factor 1, annexin A2 and suppressor of cytokine signaling 3 were
identified as biomarkers for tumors (21–26).
In addition, epidermal growth factor receptor (EGFR), S100 calcium
binding protein (S100) P, S100A2, Erbb2, metastasis associated 1
(MTA1) and mTOR are widely recognized to be involved in the
metastasis of NSCLC (27–33). NME/NM23 nucleoside diphosphate
kinase 1 (NME1) was identified to be involved in migration and
invasion in numerous other types of cancer (34). According to the literature
searching and the microarray results, the dysregulated genes were
separated into three classes: Genes that had been reported only in
tumor; genes that had been reported in tumors and in tumor
metastasis; and genes that had been reported in neither. Due to the
large number of dysregulated genes, every gene could not be
validated. Therefore, 18 DEGs were selected to further test the
validity of the microarray results. Among the 18 genes, protease, 3
(PRSS3), MT1X, CAV1, Erbb2, GADD45α, Krt18, MYH9 and PCNA have been
previously reported to be involved in tumors and in tumor
metastasis. CPS1, autocrine motility factor receptor (AMFR),
ectonucleoside triphosphate diphosphohydrolase 5 (ENTPD5), AKAP12,
ALDH7A1, PHGDH, FK506 binding protein 10 (FKBP10) and fatty acid
binding protein 3 (FABP3) have been previously reported to be
involved in tumors, however, not in tumor metastasis. kynureninase
(KYNU) and FtsJ homolog 3 (FTSJ3) have not been previously reported
in tumors or in tumor metastasis. The mRNA levels of the 11
upregulated (PRSS3, MT1X, AMFR, ENTPD5, AKAP12, ALDH7A1, CAV1,
ERBB2, GADD45α, Krt18 and MYH9) and 7 downregulated genes (PHGDH,
KYNU, FTSJ3, FABP3, CPS1, PCNA and FKBP10) were verified in the
SPC-A-1sci and SPC-A-1 cell lines with RT-qPCR. The expression
level of the 11 upregulated genes were higher in SPC-A-1sci
compared with the SPC-A-1 cells, and the expression levels of the 7
downregulated genes were significantly lower in the SPC-A-1sci
compared with the SPC-A-1 cells (Fig.
3A). Due to the limited antibodies and the large number of
candidate proteins (18 proteins), the range of the noteworthy
candidates was restricted to 10 proteins (including 7 upregulated
proteins, AKAP12, ALDH7A1, CAV1, ERBB2, GADD45A, Krt18 and MYH9,
and 3 downregulated proteins, PHGDH, PCNA and CPS1) to verify the
expression on the protein levels in the SPC-A-1sci and SPC-A-1 cell
lines. The mRNA and protein levels were validated as consistent
with the microarray results (Fig.
3B).
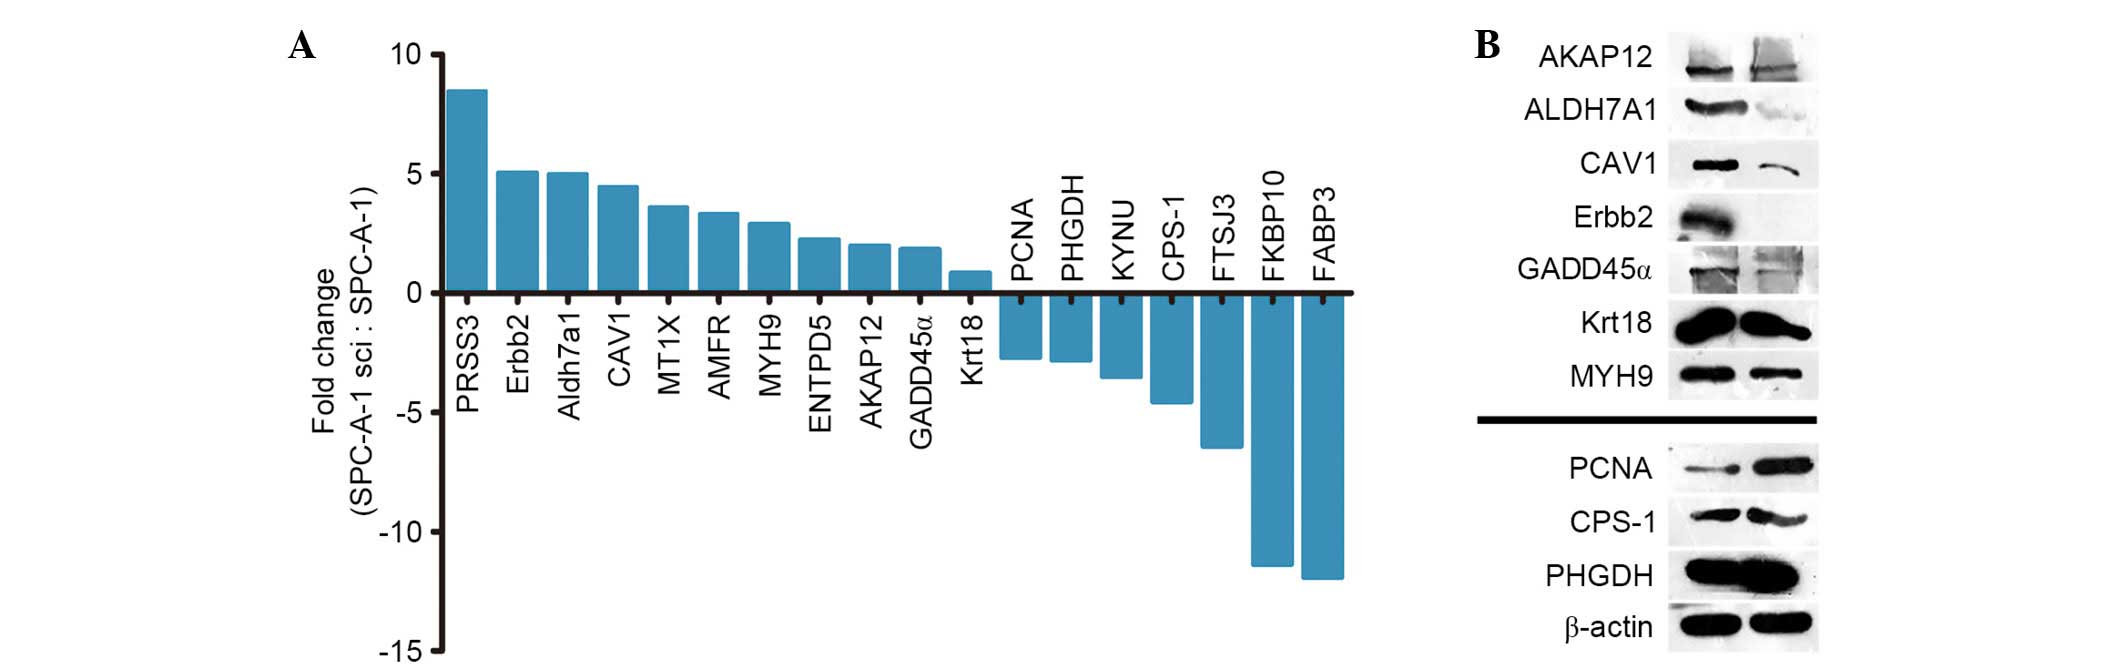 | Figure 3.Validation of the expression for DEGs
on the protein and mRNA levels. (A) Validation of 18 DEGs at the
mRNA level. (B) Validation of 10 DEGs at the protein level. DEGs,
differentially expressed genes; PRSS3, protease, serine 3; Erbb2,
erb-b2 receptor tyrosine kinase 2; Aldh7a1, aldehyde dehydrogenase
7 family member A1; CAV1, caveolin 1; MT1X, metallothionein 1X;
AMFR, autocrine motility factor receptor; MYH9, myosin heavy chain
9; ENTPD5, ectonucleoside triphosphate diphosphohydrolase 5;
AKAP12, A-kinase anchoring protein 12; GADD45α, growth arrest and
DNA damage inducible α; Krt18, keratin 18; PCNA, proliferating cell
nuclear antigen; PHGDH, phosphoglycerate dehydrogenase; KYNU,
kynureninase; CPS-1, carbamoyl-phosphate synthase 1; FTSJ3, FtsJ
homolog 3; FKBP10, FK506 binding protein 10; FABP3, fatty acid
binding protein 3. |
SPC-A-1sci cells transfected with
siRNA against MT1X exhibit low migration and invasion abilities in
vitro
The accuracy of the microarray can be verified with
further experiments. Therefore, the present study attempted to
identify MRGs for NSCLC by combining array analysis with in
vitro functional assays. Depending on the previous expression
verification and literature searching, 3 upregulated genes, MT1X,
AMFR and ENTPD5, were selected for further study. According to
previous studies, A549, H1299, PC-9 and SPC-A-1sci were revealed to
exhibit higher metastasis ability compared with LC-21, SPC-A-1,
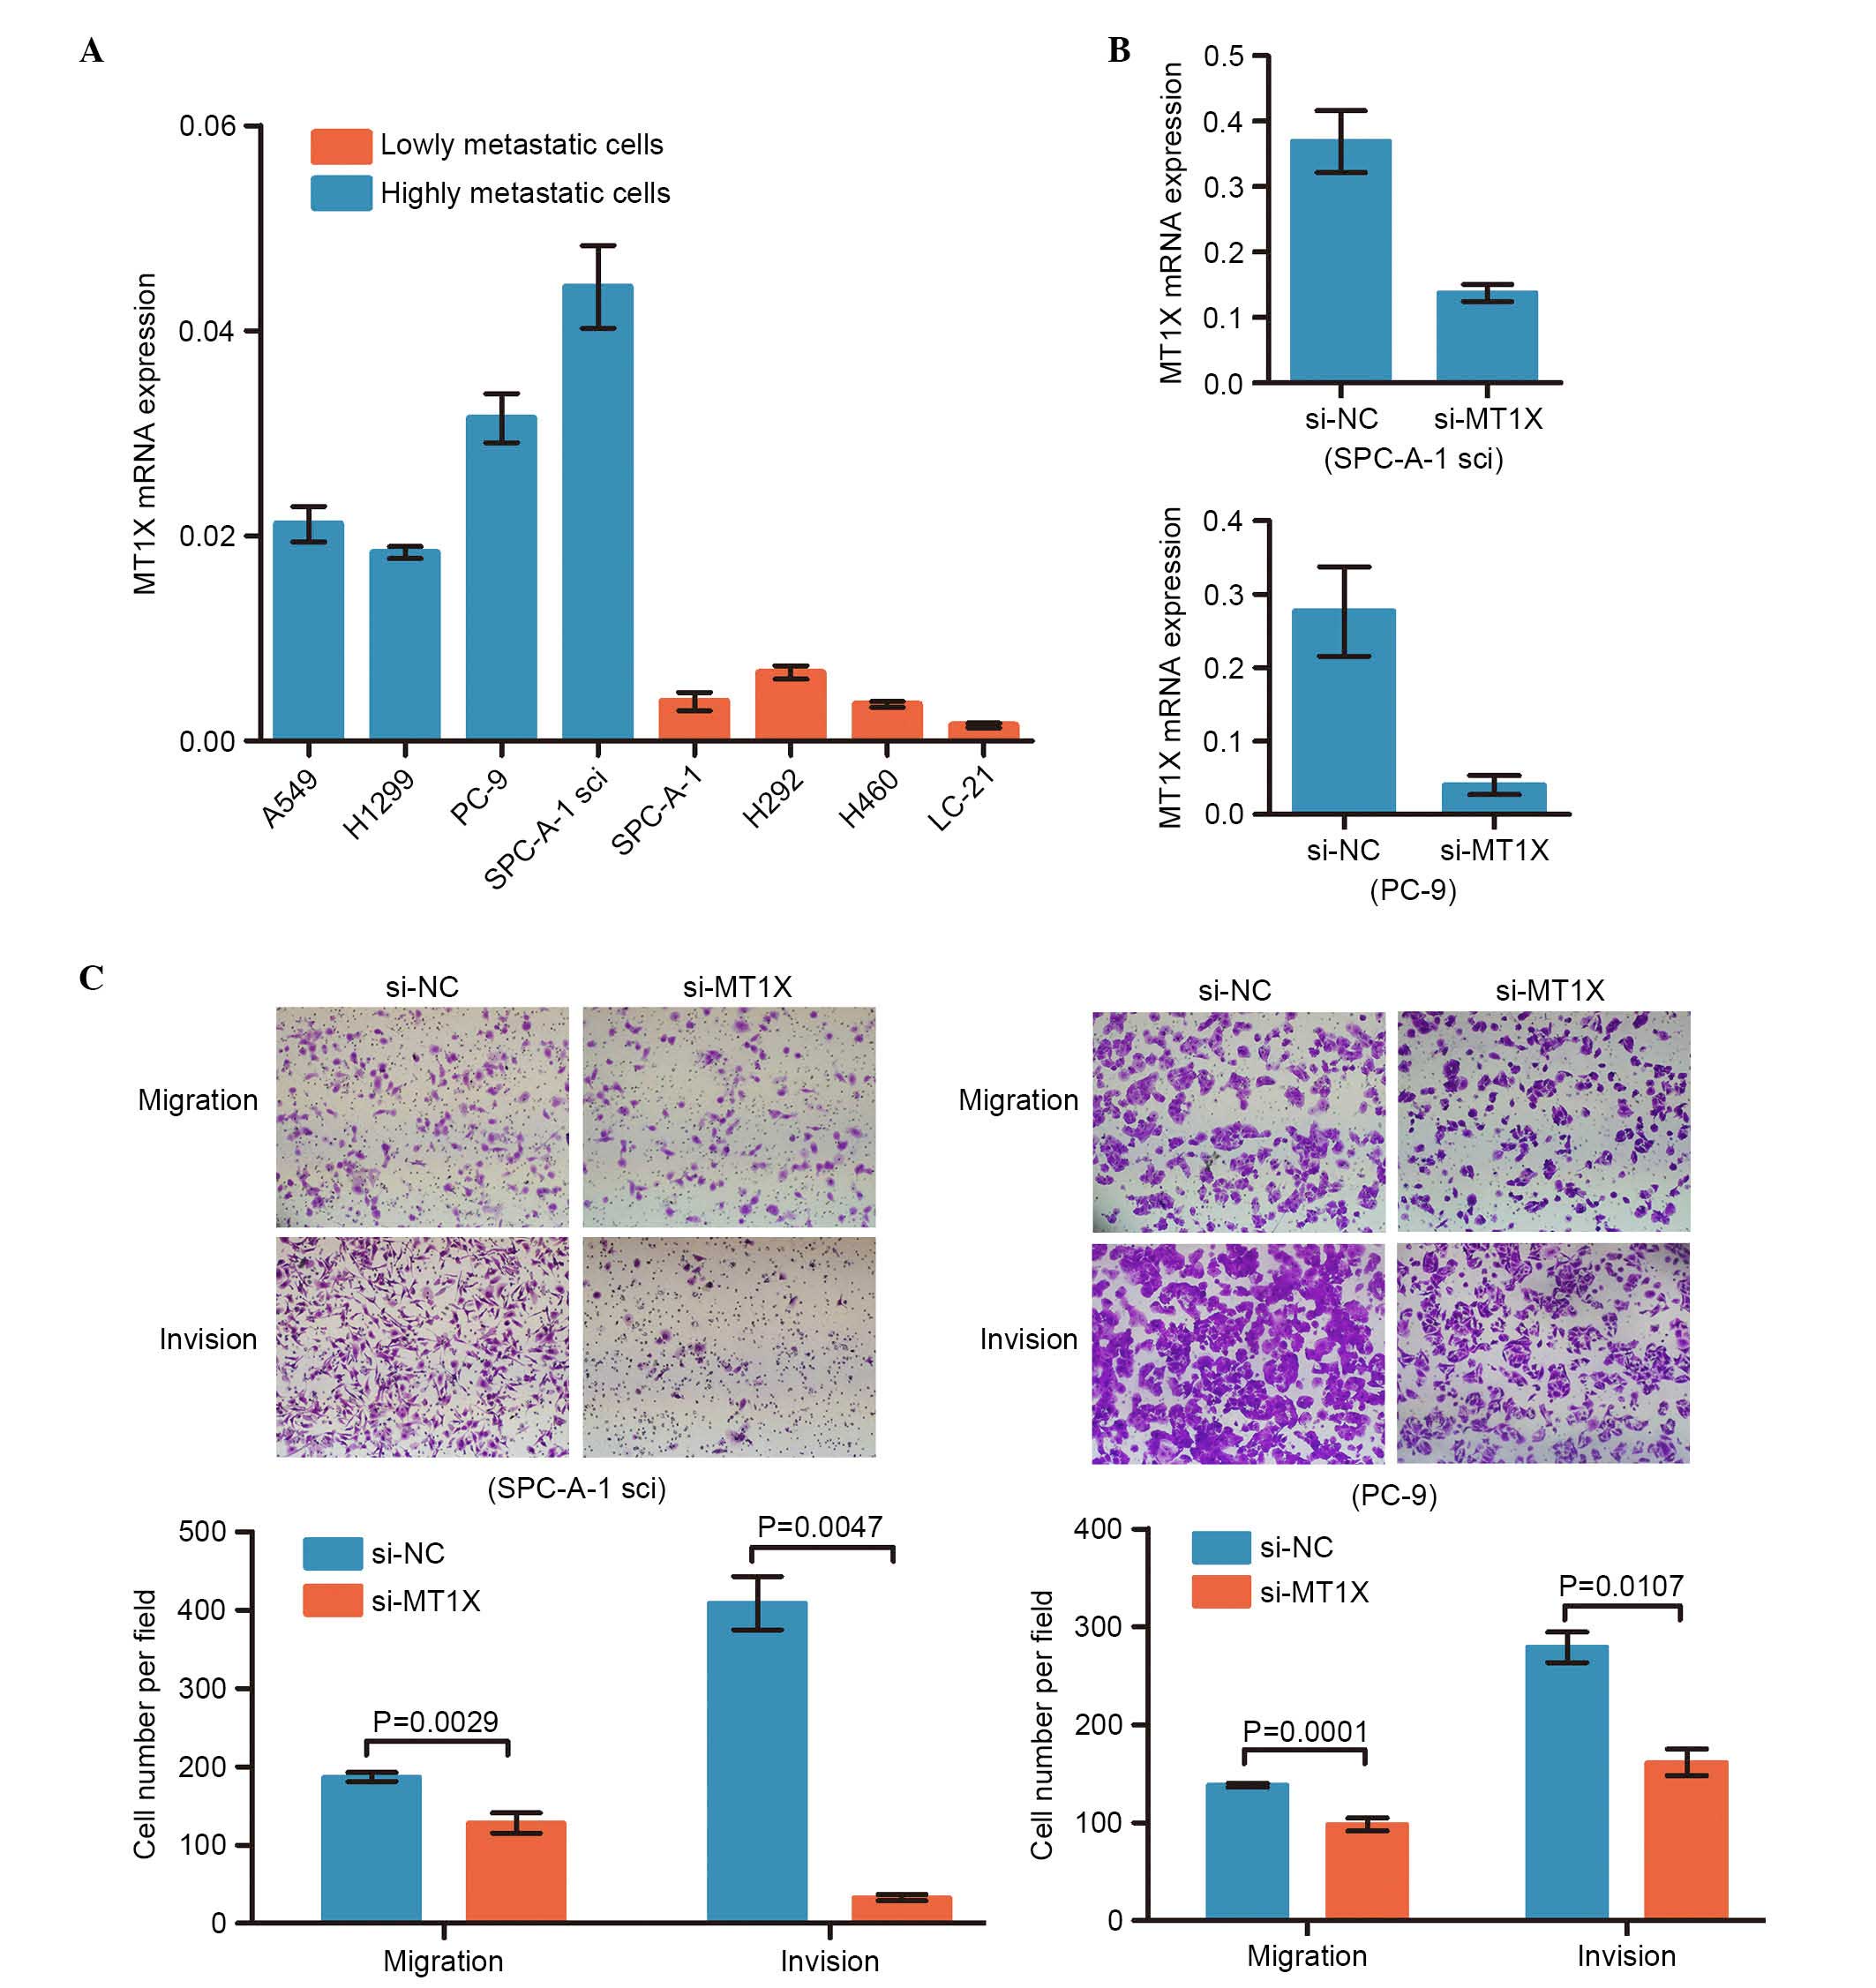
H460 and H292 (35,36). Following analysis of the 3
noteworthy genes, only MT1X expression levels in these cell lines
were demonstrated to be markedly overexpressed in the highly
metastatic cell lines (A549, H1299, PC-9 and SPC-A-1sci) compared
with the weakly metastatic cells (LC-21, SPC-A-1, H358 and H292)
(Fig. 4A). Therefore, the present
study focused on exploring the function of MT1X in the metastasis
of lung cancer. The SPC-A-1sci and PC-9 cells were transfected with
MT1X siRNA and migration and invasion assays were performed.
Effective knockdown of MT1X in the two NSCLC cell lines was
confirmed with RT-qPCR (Fig. 4B).
Notably, when compared with the control group, the cells
transfected with si-MT1X exhibited significantly lower migration
and invasion abilities compared with negative control cells in
SPC-A-1sci and PC-9 (Fig. 4C). The
results indicate a potential role of MT1X in lung cancer
metastasis.
MT1X expression levels in lung cancer
are associated with advanced clinical stage and indicate a poor
prognosis
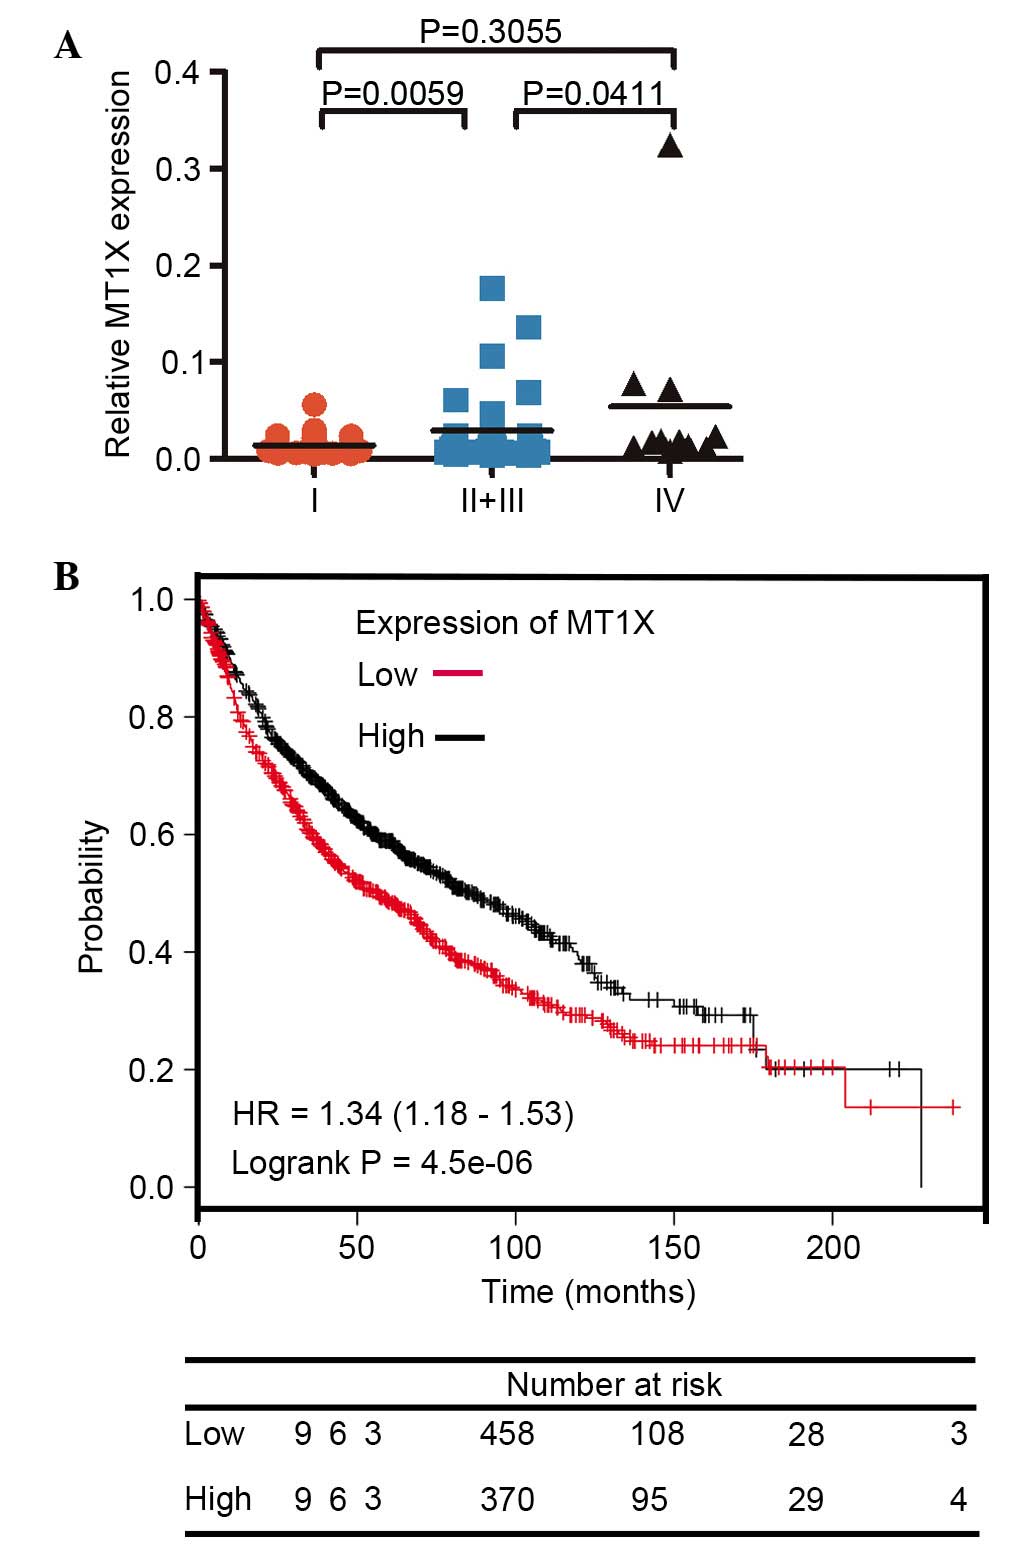
To further validate the function of MT1X in lung
cancer, its expression level was compared in human lung cancer
tissues (n=72) and matched adjacent normal lung tissues using
RT-qPCR. The stage for patients was classed in accordance with the
7th Edition of the AJCC Cancer Tumor Node Metastasis Classification
(37). A prominent statistical
difference between stages I and IV was revealed following the
collection of all the data (Fig.
5A). Therefore, the upregulation of MT1X appeared to be
associated with a higher clinical stage. Kaplan Meier-plotter
(www.kmplot.com) is highly valuable for
researchers making the preliminary assessment of biomarkers. In
2009, Györffy el al (38)
integrated a database with a Kaplan Meier-plotter to detect the
prognostic value of new biomarkers and search biomarker candidates
in NSCLC. In 2010, Győrffy et al (39) used the Kaplan Meier-plotter to
perform survival analysis and confirm the prognostic power of the
proliferation-related genes. In the present study, an integrative
data analysis was performed with the Kaplan Meier-plotter and the
results suggested that a high expression level of MT1X indicated a
poor prognosis in lung cancer, as well as in breast cancer
(Fig. 5B). Overall, with respect
to the clinical features, the high expression of MT1X was
positively correlated with clinical stage, indicating its important
role in the metastatic process of NSCLC and poor prognosis in
patients.
Discussion
mRNA expression profiles were conducted in
SPC-A-1sci and SPC-A-1 cell lines to detect the MRGs. A total of
4,838 DEGs were screened, including 798 upregulated and 4,040
downregulated genes. Systematic analysis was performed to establish
the validity of the microarray, and identify the possible MRGs.
Firstly, a comprehensive bioinformatics analysis of DEGs was
performed. With the KEGG database, DEGs were revealed to be
predominantly enriched in the biosynthesis of antibiotics, carbon
metabolism, spliceosome and ribosome categories. Furthermore, DEGs
were identified by the BioGRID 3.4 database and visualized by
Cytoscape 3.2 to form an integral PPI network. Modular analysis of
the PPI network was performed with ClusterONE and the two main
modules were selected for further analysis. In module A, 31 DEGs
were enriched in the biosynthesis of antibiotics, protein
processing in endoplasmic reticulum, RNA transport and pyrimidine
metabolism. The genes were mostly centered in the RNA transport
pathway. Its ‘hub’ gene NXF1, with a degree of 107, was reported to
be a potential therapeutic target in cancer. In module B, DEGs were
predominantly enriched in RNA transport, viral myocarditis,
proteoglycans in cancer and the mTOR signaling pathway. Module B
consisted of 11 genes and all of its ‘hub’ genes (EIF3A, EIF3F and
EIF3B) were extensively reported to have an association with
cancer. The EIF family and NXF1 are predominantly enriched in the
RNA transport pathway. RNA transport has a correlation with cell
migration and tumor cell metastasis, therefore, we can possibly
regard the DEGs enriched in RNA transport and establish their
potential function in NSCLC (40).
When scanning the 4,838 DEGs, EGFR, FGFR3, S100P, S100A2, MTA1 and
mTOR were widely recognized as involved in the metastasis of NSCLC,
and Erbb2 and NME1 were identified as genes that were associated
with migration and invasion in numerous other types of cancer. The
aforementioned findings verified that the present microarray
results contain a number of tumor-associated genes. For further
confirmation of the microarray, 4,838 DEGs were classed into three
groups. A combined literature search with this classification,
allowed the selection of 18 genes to detect the expression of the
mRNA level, and 10 of these 18 genes detect the expression at the
protein level. All the test results were consistent with the
microarray.
In confirming the accuracy of the microarray, more
confidence was observed when selecting the novel MRGs for NSCLC
from the microarray. Three upregulated genes (MT1X, AMFR and
ENTPD5) were selected for further study and the difference in their
expression levels was detected in four highly (A549, H1299, PC-9
and SPC-A-1sci) and four weakly metastatic NSCLC cell lines (LC-21,
SPC-A-1, H460 and H292). The MT1X expression levels were markedly
overexpressed in highly metastatic compared with weakly metastatic
cells. Following transfection with siRNA-MT1X in the SPC-A-1sci and
PC-9 cell lines, the two transfected cell lines exhibited
significantly lower migration and invasion abilities compared with
the control cells. Furthermore, the expression of MT1X in 72 pairs
of clinical samples revealed a prominent statistical difference in
expression between stages I and IV. The association between a poor
prognosis and MT1X expression in lung cancer was demonstrated by a
Kaplan Meier-plotter with a total of 1,928 cases of patients with
lung cancer. The aforementioned results suggested that MT1X is
associated with the metastatic ability in NSCLC and indicates a
poor prognosis in patients with lung cancer. Therefore, MT1X is a
potential prognostic clinical marker for NSCLC. However, further
investigations are required to elucidate the metastatic-promoting
mechanisms of MT1X.
In conclusion, the present study identified DEGs
using bioinformatics analysis and in vivo assays, and proved
that this mRNA microarray has clinical value in screening genes
involved in metastasis in NSCLC. Future experiments are required to
confirm the role and reveal the functional mechanism of MT1X. The
detection of additional MRGs from the microarray is required in
order to explore the molecular mechanisms of NSCLC metastasis.
References
|
1
|
Torre LA, Bray F, Siegel RL, Ferlay J,
Lortet-Tieulent J and Jemal A: Global cancer statistics, 2012.
Cancer J Clin. 65:87–108. 2015. View Article : Google Scholar
|
|
2
|
Siegel RL, Miller KD and Jemal A: Cancer
statistics, 2015. CA Cancer J Clin. 65:5–29. 2015. View Article : Google Scholar : PubMed/NCBI
|
|
3
|
Molina JR, Yang P, Cassivi SD, Schild SE
and Adjei AA: Non-small cell lung cancer: Epidemiology, risk
factors, treatment, and survivorship. Mayo Clin Proc. 83:584–594.
2008. View
Article : Google Scholar : PubMed/NCBI
|
|
4
|
Gupta GP and Massagué J: Cancer
metastasis: Building a framework. Cell. 127:679–695. 2006.
View Article : Google Scholar : PubMed/NCBI
|
|
5
|
Sun L, Li J and Yan B: Gene expression
profiling analysis of osteosarcoma cell lines. Mol Med Rep.
12:4266–4272. 2015.PubMed/NCBI
|
|
6
|
Huang HL, Wu YC, Su LJ, Huang YJ,
Charoenkwan P, Chen WL, Lee HC, Chu WC and Ho SY: Discovery of
prognostic biomarkers for predicting lung cancer metastasis using
microarray and survival data. BMC Bioinformatics. 16:542015.
View Article : Google Scholar : PubMed/NCBI
|
|
7
|
Jia DS, Yan M, Wang X, Hao X, Liang L, Liu
L, Kong H, He X, Li J and Yao M: Development of a highly metastatic
model that reveals a crucial role of fibronectin in lung cancer
cell migration and invasion. BMC Cancer. 10:3642010. View Article : Google Scholar : PubMed/NCBI
|
|
8
|
Morandi L, de Biase D, Visani M, Monzoni
A, Tosi A, Brulatti M, Turchetti D, Baccarini P, Tallini G and
Pession A: T([20]) repeat in the 3′-untranslated region of the MT1X
gene: A marker with high sensitivity and specificity to detect
microsatellite instability in colorectal cancer. Int J Colorectal
Dis. 27:647–656. 2012. View Article : Google Scholar : PubMed/NCBI
|
|
9
|
Peng B, Gu Y, Xiong Y, Zheng G and He Z:
Microarray-assisted pathway analysis identifies MT1X & NFκB as
mediators of TCRP1-associated resistance to cisplatin in oral
squamous cell carcinoma. PLoS One. 7:e514132012. View Article : Google Scholar : PubMed/NCBI
|
|
10
|
Huang da W, Sherman BT and Lempicki RA:
Systematic and integrative analysis of large gene lists using DAVID
bioinfor-matics resources. Nat Protoc. 4:44–57. 2009. View Article : Google Scholar : PubMed/NCBI
|
|
11
|
Harris MA, Clark J, Ireland A, Lomax J,
Ashburner M, Foulger R, Eilbeck K, Lewis S, Marshall B, Mungall C,
et al: The gene ontology (GO) database and informatics resource.
Nucleic Acids Res. 32:(Database issue). D258–D261. 2004. View Article : Google Scholar : PubMed/NCBI
|
|
12
|
Livak KJ and Schmittgen TD: Analysis of
relative gene expression data using real-time quantitative PCR and
the 2(−Delta Delta C(T)) method. Methods. 25:402–408. 2001.
View Article : Google Scholar : PubMed/NCBI
|
|
13
|
Siddiqui N and Borden KL: mRNA export and
cancer. Wiley Interdiscip Rev RNA. 3:13–25. 2012. View Article : Google Scholar : PubMed/NCBI
|
|
14
|
Hajingabo LJ, Daakour S, Martin M,
Grausenburger R, Panzer-Grümayer R, Dequiedt F, Simonis N and
Twizere JC: Predicting interactome network perturbations in human
cancer: Application to gene fusions in acute lymphoblastic
leukemia. Mol Biol Cell. 25:3973–3985. 2014. View Article : Google Scholar : PubMed/NCBI
|
|
15
|
Zhang Y, Yu JJ, Tian Y, Li ZZ, Zhang CY,
Zhang SF, Cao LQ, Zhang Y, Qian CY, Zhang W, et al: eIF3a improve
cisplatin sensitivity in ovarian cancer by regulating XPC and
p27Kip1 translation. Oncotarget. 6:25441–25451. 2015. View Article : Google Scholar : PubMed/NCBI
|
|
16
|
Spilka R, Ernst C, Bergler H, Rainer J,
Flechsig S, Vogetseder A, Lederer E, Benesch M, Brunner A, Geley S,
et al: eIF3a is over-expressed in urinary bladder cancer and
influences its phenotype independent of translation initiation.
Cell Oncol (Dordr). 37:253–267. 2014. View Article : Google Scholar : PubMed/NCBI
|
|
17
|
Shen J, Yin JY, Li XP, Liu ZQ, Wang Y,
Chen J, Qu J, Xu XJ, McLeod HL, He YJ, et al: The prognostic value
of altered eIF3a and its association with p27 in non-small cell
lung cancers. PLoS One. 9:e960082014. View Article : Google Scholar : PubMed/NCBI
|
|
18
|
Marchione R, Laurin D, Liguori L,
Leibovitch MP, Leibovitch SA and Lenormand JL: MD11-mediated
delivery of recombinant eIF3f induces melanoma and colorectal
carcinoma cell death. Mol Ther Methods Clin Dev. 2:140562015.
View Article : Google Scholar : PubMed/NCBI
|
|
19
|
Wen F, Zhou R, Shen A, Choi A, Uribe D and
Shi J: The tumor suppressive role of eIF3f and its function in
translation inhibition and rRNA degradation. PLoS One.
7:e341942012. View Article : Google Scholar : PubMed/NCBI
|
|
20
|
Wang H, Ru Y, Sanchez-Carbayo M, Wang X,
Kieft JS and Theodorescu D: Translation initiation factor eIF3b
expression in human cancer and its role in tumor growth and lung
colonization. Clin Cancer Res. 19:2850–2860. 2013. View Article : Google Scholar : PubMed/NCBI
|
|
21
|
Do SI, Kim YW, Park HR and Park YK:
Expression of insulin-like growth factor-II mRNA binding protein 3
(IMP3) in osteosarcoma. Oncol Res. 17:269–272. 2008. View Article : Google Scholar : PubMed/NCBI
|
|
22
|
Jiang Z, Lohse CM, Chu PG, Wu CL, Woda BA,
Rock KL and Kwon ED: Oncofetal protein IMP3: A novel molecular
marker that predicts metastasis of papillary and chromophobe renal
cell carcinomas. Cancer. 112:2676–2682. 2008. View Article : Google Scholar : PubMed/NCBI
|
|
23
|
Miyamoto T, Asaka R, Suzuki A, Takatsu A,
Kashima H and Shiozawa T: Immunohistochemical detection of a
specific receptor for lipocalin2 (solute carrier family 22 member
17, SLC22A17) and its prognostic significance in endometrial
carcinoma. Exp Mol Pathol. 91:563–568. 2011. View Article : Google Scholar : PubMed/NCBI
|
|
24
|
Aharinejad S, Salama M, Paulus P, Zins K,
Berger A and Singer CF: Elevated CSF1 serum concentration predicts
poor overall survival in women with early breast cancer. Endocr
Relat Cancer. 20:777–783. 2013. View Article : Google Scholar : PubMed/NCBI
|
|
25
|
Liu X, Ma D, Jing X, Wang B, Yang W and
Qiu W: Overexpression of ANXA2 predicts adverse outcomes of
patients with malignant tumors: A systematic review and
meta-analysis. Med Oncol. 32:3922015. View Article : Google Scholar : PubMed/NCBI
|
|
26
|
Wan J, Che Y, Kang N and Wu W: SOCS3
blocks HIF-1α expression to inhibit proliferation and angiogenesis
of human small cell lung cancer by downregulating activation of
Akt, but not STAT3. Mol Med Rep. 12:83–92. 2015.PubMed/NCBI
|
|
27
|
Chien MH, Lee WJ, Hsieh FK, Li CF, Cheng
TY, Wang MY, Chen JS, Chow JM, Jan YH, Hsiao M, et al: Keap1-Nrf2
interaction suppresses cell motility in lung adenocarcinomas by
targeting the S100P protein. Clin Cancer Res. 21:4719–4732. 2015.
View Article : Google Scholar : PubMed/NCBI
|
|
28
|
Lococo F, Paci M, Rapicetta C, Rossi T,
Sancisi V, Braglia L, Cavuto S, Bisagni A, Bongarzone I, Noonan DM,
et al: Preliminary evidence on the diagnostic and molecular role of
circulating soluble EGFR in non-small cell lung cancer. Int J Mol
Sci. 16:19612–19630. 2015. View Article : Google Scholar : PubMed/NCBI
|
|
29
|
Bulk E, Sargin B, Krug U, Hascher A, Jun
Y, Knop M, Kerkhoff C, Gerke V, Liersch R, Mesters RM, et al:
S100A2 induces metastasis in non-small cell lung cancer. Clin
Cancer Res. 15:22–29. 2009. View Article : Google Scholar : PubMed/NCBI
|
|
30
|
Li S, Tian H, Yue W, Li L, Gao C, Si L, Li
W, Hu W, Qi L and Lu M: Down-regulation of MTA1 protein leads to
the inhibition of migration, invasion, and angiogenesis of
non-small-cell lung cancer cell line. Acta Biochim Biophys Sin
(Shanghai). 45:115–122. 2013. View Article : Google Scholar : PubMed/NCBI
|
|
31
|
Zhu X, Zhang X, Wang H, Song Q, Zhang G,
Yang L, Geng J, Li X, Yuan Y and Chen L: MTA1 gene silencing
inhibits invasion and alters the microRNA expression profile of
human lung cancer cells. Oncol Rep. 28:218–224. 2012.PubMed/NCBI
|
|
32
|
Li L, Liu D, Qiu ZX, Zhao S, Zhang L and
Li WM: The prognostic role of mTOR and p-mTOR for survival in
non-small cell lung cancer: A systematic review and meta-analysis.
PLoS One. 10:e01167712015. View Article : Google Scholar : PubMed/NCBI
|
|
33
|
Liu J, Cho SN, Akkanti B, Jin N, Mao J,
Long W, Chen T, Zhang Y, Tang X, Wistub II, et al: ErbB2 pathway
activation upon Smad4 Loss promotes lung tumor growth and
metastasis. Cell Rep. pii:S2211–S1247. 2015.
|
|
34
|
McCorkle JR, Leonard MK, Kraner SD,
Blalock EM, Ma D, Zimmer SG and Kaetzel DM: The metastasis
suppressor NME1 regulates expression of genes linked to metastasis
and patient outcome in melanoma and breast carcinoma. Cancer
Genomics Proteomics. 11:175–194. 2014.PubMed/NCBI
|
|
35
|
Yu T, Li J, Yan M, Liu L, Lin H, Zhao F,
Sun L, Zhang Y, Cui Y, Zhang F, et al: MicroRNA-193a-3p and −5p
suppress the metastasis of human non-small-cell lung cancer by
downregulating the ERBB4/PIK3R3/mTOR/S6K2 signaling pathway.
Oncogene. 34:413–423. 2015. View Article : Google Scholar : PubMed/NCBI
|
|
36
|
Yu T, Liu L, Li J, Yan M, Lin H, Liu Y,
Chu D, Tu H, Gu A and Yao M: miRNA-10a is upregulated in NSCLC and
may promote cancer by targeting PTEN. Oncotarget. 6:30239–30250.
2015.PubMed/NCBI
|
|
37
|
Talsma K, van Hagen P, Grotenhuis BA,
Steyerberg EW, Tilanus HW, van Lanschot JJ and Wijnhoven BP:
Comparison of the 6th and 7th Editions of the UICC-AJCC TNM
Classification for Esophageal Cancer. Annals of Surgical Oncology.
July;2012.19(7): 2142–2148. View Article : Google Scholar : PubMed/NCBI
|
|
38
|
Györffy B, Lanczky A, Eklund AC, Denkert
C, Budczies J, Li Q and Szallasi Z: An online survival analysis
tool to rapidly assess the effect of 22,277 genes on breast cancer
prognosis using microarray data of 1,809 patients. Breast Cancer
Res Treat. 123:725–731. 2010. View Article : Google Scholar : PubMed/NCBI
|
|
39
|
Győrffy B, Surowiak P, Budczies J and
Lánczky A: Online survival analysis software to assess the
prognostic value of biomarkers using transcriptomic data in
non-small-cell lung cancer. PLoS One. 8:e822412013. View Article : Google Scholar : PubMed/NCBI
|
|
40
|
Shankar J and Nabi IR: RNA purification
from tumor cell protrusions using porous polycarbonate filters.
Methods Mol Biol. 714:353–366. 2011. View Article : Google Scholar : PubMed/NCBI
|