Introduction
Osteosarcoma (OS), as an aggressive malignant
cancer, is the most frequent human primary bone neoplasm in
children and in adolescents (1).
Notably, OS has a high metastatic potential (2). Based on the available literature,
~45% patients with OS progressed to lung metastasis, which is the
major cause of death in patients with OS (3). Currently, the standard therapy is
radical surgery combined with chemotherapy (4). However, there is strong controversy
over the role of chemotherapy in treating cancer. Further progress
is required in the treatment of OS (5). Therefore, it is urgent to investigate
the detailed molecular mechanisms underlying OS progression, which
will facilitate the development of effective therapeutic
strategies.
Many complex diseases, for example, cancer, involve
a continuum of molecular events, which begin with early initiation
events and progress to disastrous end-stage events. Understanding
the disease-stage-specific molecular events is vital for
understanding disease pathology and developing efficient
therapeutic strategies. Identification of disease-associated
signatures can contribute to investigations into the process of
tumorigenesis. However, it is difficult to identify novel
biomarkers associated with OS, due to high costs and time-consuming
experiments (6). Computational
methodologies counteract this. However, the majority of
computational methods focus on the differential expression of genes
and static regulation between genes (7,8),
ignoring the network rewiring or dynamic regulation between
molecules during different disease stages. Furthermore, it is well
established that many diseases are induced by perturbations of
complex molecular networks, rather than the individual genes.
Differential network analysis has been applied to protein-protein
interaction networks (9),
protein-gene interaction networks (10), and functional gene interaction
networks (11). However, only two
conditions were considered (i.e., only one resulting differential
network) in the former studies using computational methods.
Generally, the interactions vary at different disease stages, and
the changes in interactions are causally associated with disease
progression. Thus, simultaneously analyzing network dynamics in the
period of disease progression is of great importance for
understanding disease mechanisms.
The current study attempted to detect dynamically
controlled genes and modules associated with OS using a novel
computational method. Inference of multiple differential modules
(iMDM) (12) was presented
to measure OS microarray data at four Huvos grades (13) to capture the connectivity changes
of sub-networks during the process of OS development. Using
iMDM, multiple sub-networks were constructed from
time-course transcription data, and candidate genes that may
underlie the OS were identified. Gene expression profile data of OS
from the European Molecular Biology Laboratory-European
Bioinformatics Institute (EMBL-EBI) database. The construction of
multiple differential co-expression networks (M-DCNs) was performed
using gene expression profiles across different OS conditions
(grade 1, 2, 3 and 4 OS). Subsequently, iMDM was used to
analyze the DCNs to identify shared candidate modules across
different disease stages. Then, statistical analysis was performed
to select multiple differential modules (M-DMs) based on the null
score distribution of candidate modules generated using randomized
networks. Finally, Module Connectivity Dynamic Score (MCDS) was
employed to quantify the change in the connectivity of shared gene
modules among different conditions. It is believed that the
findings of the current study may provide guidelines for
experimental validation in the future, and shed light on the
pathogenesis of OS.
Materials and methods
Analysis of microarray data
The gene expression profile of E-GEOD-33382
(13) was downloaded from the
EMBL-EBI database, which was based on the A-GEOD-10295 Illumina
human-6 v2.0 expression beadchip platform (using nuIDs as
identifier). Gene microarray data of 45 OS samples (10 OS with
grade 1, 13 with grade 2, 15 with grade 3, and 7 with grade 4) with
2 replicates, and osteoblast cell samples derived from mesenchymal
stem cells (n=3) in duplicate as controls were obtained. Probe
annotation files were downloaded. The probes were aligned to the
gene symbols, and 13,326 genes were ultimately obtained.
STRING protein-protein
interactions
The original human protein-protein interaction
network (PPIN) involving 787,896 interactions (16,730 genes) was
downloaded from the STRING database (http://string-db.org/), and only the proteins that
were common with the microarray data were used to construct the
background PPIN.
iMDM approach
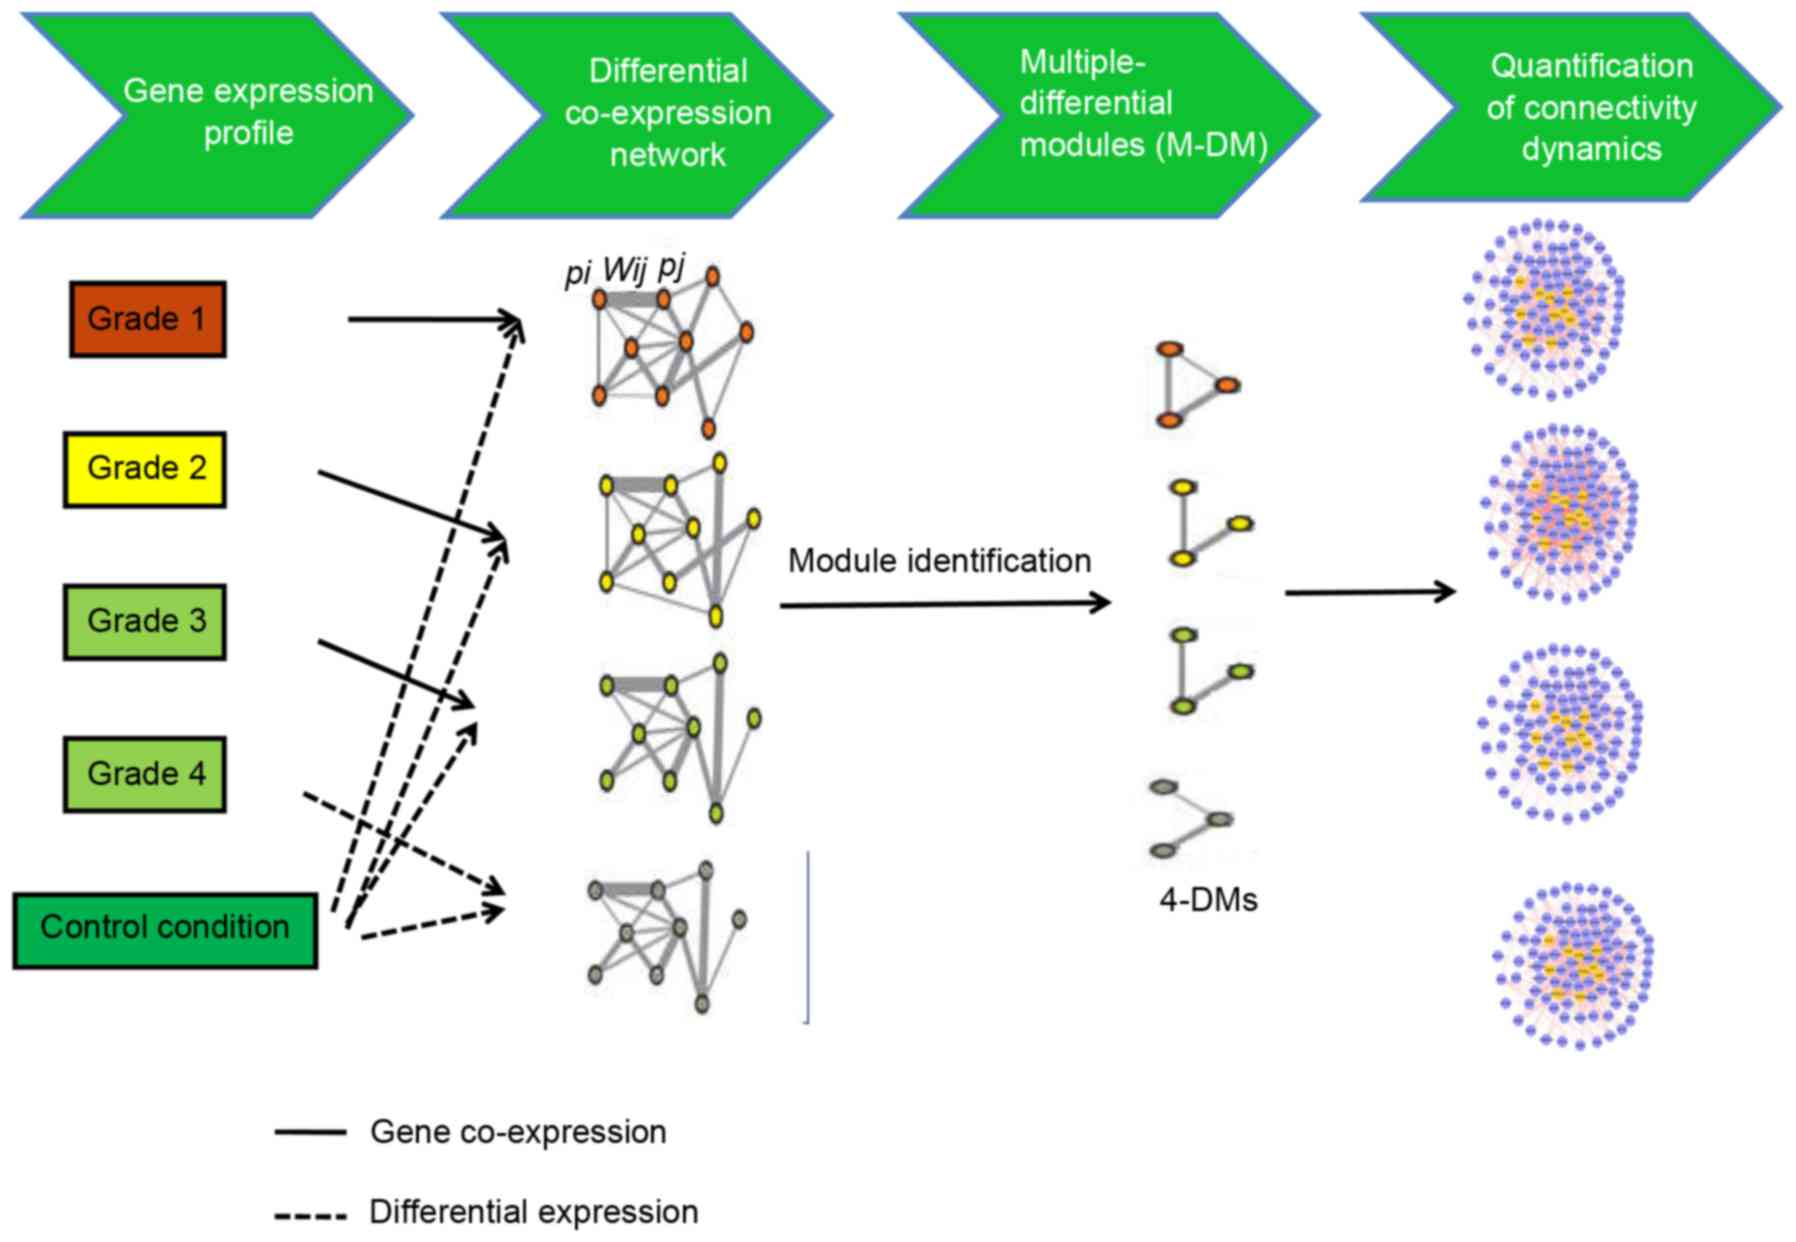
A flowchart of the iMDM algorithm is presented in
Fig. 1. This method used the input
transcriptome data gathered in control and disease conditions. The
following three steps were performed: Construction of the M-DCNs,
one for each condition; using the M-module algorithm (14) to extract statistically significant
M-DMs in M-DCNs; quantification of the change in the connectivity
of shared M-DMs.
Construction of DCNs
For each disease grade, the DCN was constructed on
the basis of differential expression in the OS and control
conditions via two steps.
In step 1, a binary co-expression network
construction was implemented after edges were selected according to
the absolute value of the Pearson correlation coefficient (PCC) of
the microarray profiles of two genes. The 1st order partial PCC was
utilized to remove indirect correlation induced by a third gene
(15). In the current study, only
edges with correlations greater than the predefined value δ(δ=0.9)
were reserved to construct the co-expression network.
In the second step, weight was assigned to the edge
of the binary co-expression network according to the P-values of
differential gene expression in the OS and control conditions. A
one-side t-test was used to seek differential gene expression for
microarray data. The weight wx,y on edge (x,y) in the
DCN was defined:
Wx,y={(logPx+logPy)1/2(2*maxl∈v|logPl)1/2ifcor(x,y)≥δ,0,ifcor(x,y)<δ,
In this formula, Px and Py
were the P-values for gene × and gene y, respectively. V was the
nodes of the co-expression network, and cor(x,y) was the absolute
value of PCC between gene × and gene y on the basis of their
expression profiles. Under the weighting, genes that were
co-expressed and markedly differentially expressed were assigned
higher weight values.
Considering M-DCNs, there were the same nodes, yet
edges were different and defined as Hk=(V,Ek)
(1≤k≤M). A multiple candidate module, C, was determined as a set of
nodes whose connectivity among them was higher than random
expectation across all M-DCNs under consideration.
Identification of multiple candidate
modules in M-DCNs
Unique and shared modules were identified across the
M-DCNs, termed multiple candidate modules. The M-module algorithm
described by Ma et al (14)
is designed to extract gene modules that have common members, yet
different connectivity across multiple interaction networks. Based
on this, this M-module algorithm was adapted to detect the
candidate modules. The identification of candidate modules
consisted of three steps: i) Seed prioritization; ii) module search
through seed expansion; and iii) refinement of candidate
modules.
Seed prioritization
With the aim of identifying seed genes, genes were
sorted in the M-DCNs based on the topological measurement (degree)
feature. For each network Hk=(V,Ek) (1≤k≤M)
with an adjacency matrix
Ak=(axyk)n*n, a function was
constructed to compute the importance of vertex × in the
corresponding DCN, and this function was defined as:
g(x)=∑y∈Nk(x)A′xykg(y)
Where g(x) denoted the importance of vertex × in the
DCN, Nk(x) denotes the set of neighbors of gene × in
Hk; A’k was the degree normalized weighted
adjacency matrix which was counted as
A'k=D−1/2AkD1/2 where D was
diagonal matrix with element
Dxy=∑yAxyk. A'g was on behalf of
the information propagation on network through the edges of
networks, which meant the importance of a node depending on the
number of the adjacent nodes, strength of connection and importance
of its adjacent nodes.
For each gene, after acquiring its ranks in all
individual DCNs, determined as g=[g(1),. . ., g(M)], a
z-score was calculated for each rank g(l). Subsequently,
the sort order was obtained for that gene across all DCNs by means
of averaging the z-scores among all DCNs. The top 5% genes were
identified, and named as seed genes.
Module search
Beginning with each seed gene, the stage of module
search iteratively contained genes whose addition resulted in the
maximum decrease in the graph entropy-based function till no
decrease was observed in the objective function. For a given vertex
× ∈ C, Lk(x) was denoted as the total weight between
vertex × as well as other vertices of the candidate module C in the
network Hk. Similarly, L̅k(i) represented the
weight value between vertex × as well as vertices outside of module
C. Then, the entropy for connectivity of vertex × to module C
was:
Gk(Cx)=–px[k]logpx[k]–(1–px[k])log(1–px[k])px[k]=Lk(x)L¯k(i)+Lk(x)
The objective for using graph entropy was to
quantify the skewness of in-module connectivity vs. out-module
connectivity. Adding over all vertices in C and DCN k, the entropy
for C across all DCNs and normalized for the size of C was shown as
follows:
G(C)=(∑k–1MGk(C))[C]
Where Gk(C) = ∑x∈CH(Cy).
The objective function was defined as:
∑x=1τminH(Cx)s.t.{ixy∈{0,1};∑y=1τixy≥1;∑x=1nixy<0
Where Cx (1<x<τ) is a candidate module.
i=[i1,. . .,iτ] was an index matrix where
each column was a module and each row equaled to a gene. The
constraint was that each gene belonged to one or more modules, and
each module has to include at least one gene.
Refinement of candidate modules
During the refinement step, the multiple candidate
modules with sizes <5 were eliminated. Furthermore, the Jaccard
index (16), which is the ratio of
intersection over union for two sets, was employed to merge the
overlapping multiple candidate modules. In the current study, a
Jaccard index ≥0.5 was set as the threshold.
Statistical significance of candidate
modules
In this study, the statistical significance of
multiple candidate modules was performed based on the null score
distribution of candidate modules generated using randomized
networks. Briefly, each network was randomized 100 times by
degree-preserved edge shuffling. In order to require the module
scores for the null distribution, module search was implemented on
the randomized networks. Significantly, the empirical P-value of a
candidate module was counted as the probability of the module
having the observed score or smaller by chance using the formula
below:
Pvalue=sum(count(HR)>count(HDCN))count(HR)
In which count (HR) stood for the number
of modules produced by randomized networks, count (HDCN)
represented the number of modules generated by DCN.
Then, P-values were adjusted for multiple testing
using false discovery rate (FDR) based on the method of
Benjamini-Hochberg (17). FDR≤0.05
was set as the significance threshold.
Quantification of connectivity
dynamics of shared M-DMs
By definition, each M-DM with M≥2 has multiple
component modules from different DCNs. In an attempt to quantify
the connectivity change of component modules, the MCDS as a
graph-theoretical measure was used. In detail, given an M-DMC whose
weighted adjacent matrices of the corresponding induced subgraphs
were denoted by ACX(1≤x≤M), the MCDS between two
adjacent component modules was determined as the L2 norm
of the matrix subtraction normalized by the number of genes in the
M-DM. The overall MCDS of an M-DM is defined as the mean MCDS of
all pairwise comparisons, and computed based on the equation:
τ(AC)=∑x=1M–1ΔAx,x+1C/(M–1)
Similarly, the statistical significance of MCDS for
an M-DM was calculated as that for M-DMs. Specifically, the null
distribution for MCDS scores was firstly counted on the basis of
the random M-DMs. Then, the P-value of an MCDS was calculated based
on the null distribution. Finally, the Benjamini-Hochberg was
applied for correction. A FDR of 0.05 was considered as the
significance threshold.
In order to identify dynamically controlled genes
in OS, topological parameters were utilized to deeply investigate
biological significance of genes in dynamic module.
Pathway enrichment analysis for the
genes in dynamic modules identified
Previously, several studies have demonstrated that
certain pathways are more dynamic than others in the progression of
disease (18,19). To reveal this, in the present
study, Database for Annotation, Visualization and Integrated
Discovery (DAVID; version 6.8; https://david.ncifcrf.gov) (20,21)
was employed for Kyoto Encyclopedia of Genes and Genomes (KEGG;
http://www.genome.jp/kegg) pathway
enrichment analysis of genes in dynamic modules obtained above,
which provides analytic tools for extracting biological meaning
from large list of genes (20).
Expression Analysis Systematic Explorer (EASE) was utilized to
evaluate the significant pathways. Significant terms were
determined according to the presence of at least two genes and
P<0.05 in the pathways.
Results
M-DCNs construction
In our study, in addition to basal conditions, four
conditions, OS grades 1–4, were also included (M=4). Thus, 4 DCNs
would be acquired, and identify 4-DMs. Subsequently, the
significance of DMs and MCDS was used to further extract
significant genes. These significant genes across four conditions
may shed light on the molecular mechanism underlying OS progression
in different grades.
The microarray data were aligned to the original
PPIN, then the background PPIN was identified, which contained
400,797 interactions and 11,863 genes. In order to eliminate
indirect correlations and to make this network more confident, only
interactions with δ≥0.9 in the background PPIN were selected to
construct DCNs, Thus, 4 DCNs were constructed, and each of them
included 2,138 edges and 272 nodes.
Identification of multiple candidate
modules in-M DCNs and statistical significance of candidate
modules
Based on the z-score distribution of 272 nodes in
DCNs, 13 genes had top 5% z-score value, which were termed as seed
genes (Table I). The z-scores of
all seed genes were >200. Subsequently, the steps of module
search and module refinement were implemented. Subsequently, 4
candidate modules in the DCNs of all grade 1, 2, 3, and 4 OS
conditions were screened out.
 | Table I.Seed genes and the distribution of
their average z-scores. |
Table I.
Seed genes and the distribution of
their average z-scores.
| Gene name (gene
symbol) | Average
z-score |
|---|
| Karyopherin subunit
α 3 (KPNA3) | 354.1070 |
| UTP3, small subunit
processome component homolog (UTP3) | 304.5631 |
| Asparaginyl-tRNA
synthetase (NARS) | 273.5091 |
| Prostaglandin E
synthase 3 (PTGES3) | 268.3388 |
| ARP6 actin-related
protein 6 homolog (ACTR6) | 256.8489 |
| ALG5,
dolichyl-phosphate β-glucosyltransferase (ALG5) | 233.6674 |
| Protein phosphatase
1 regulatory subunit 12A (PPP1R12A) | 229.4946 |
| Ubiquitination
factor E4A (UBE4A) | 227.2643 |
| Immediate early
response 3 interacting protein 1 (IER3IP1) | 219.0473 |
| YEATS domain
containing 4 (YEATS4) | 209.6316 |
| Chromosome 14 open
reading frame 166 (C14orf166) | 207.9445 |
| Activating
transcription factor 1 (ATF1) | 207.7166 |
| RAP1B, member of
RAS oncogene family (RAP1B) | 205.7397 |
Next, empirical P-values of these 4 candidate
modules were calculated using randomized networks. At a FDR
criterion of 0.05, these 4 candidate modules including module 1, 2,
3 and 4 were significant, as presented in Table II.
| Table II.The significant modules based on
FDR. |
Table II.
The significant modules based on
FDR.
| Modules | FDR values | Nodes | Edges | Initial seed
gene |
|---|
| Module 1 | 0 | 166 | 1731 | KPNA3 |
| Module 2 | 9.78E-03 | 140 | 1539 | UTP3 |
| Module 3 | 0 | 103 |
870 | PPP1R12A |
| Module 4 | 0 | 71 |
578 | YEATS4 |
Shared 4-DMs can be utilized to
uncover dynamics in the process of OS progression
Since component modules of a 4-DM had the same gene
set in M-DCNs, yet were different in the connectivity, 4-DM offers
a natural way to obtain the changes in dynamic connectivity. Thus,
to this end, MCDS were used to quantify the dynamics of 4-DMs in
the current study. Because the DCNs were weighted on the basis of
the degree of gene expression correlation, MCDS quantified not only
the presence and absence of edges, but also the changes in edge
weights, which can be regarded as the interaction strength among
genes.
In order to extract M-DMs that exhibit
significantly different dynamics than would be expected by chance,
the MCDS of real 4-DMs were compared to a null distribution of MCDS
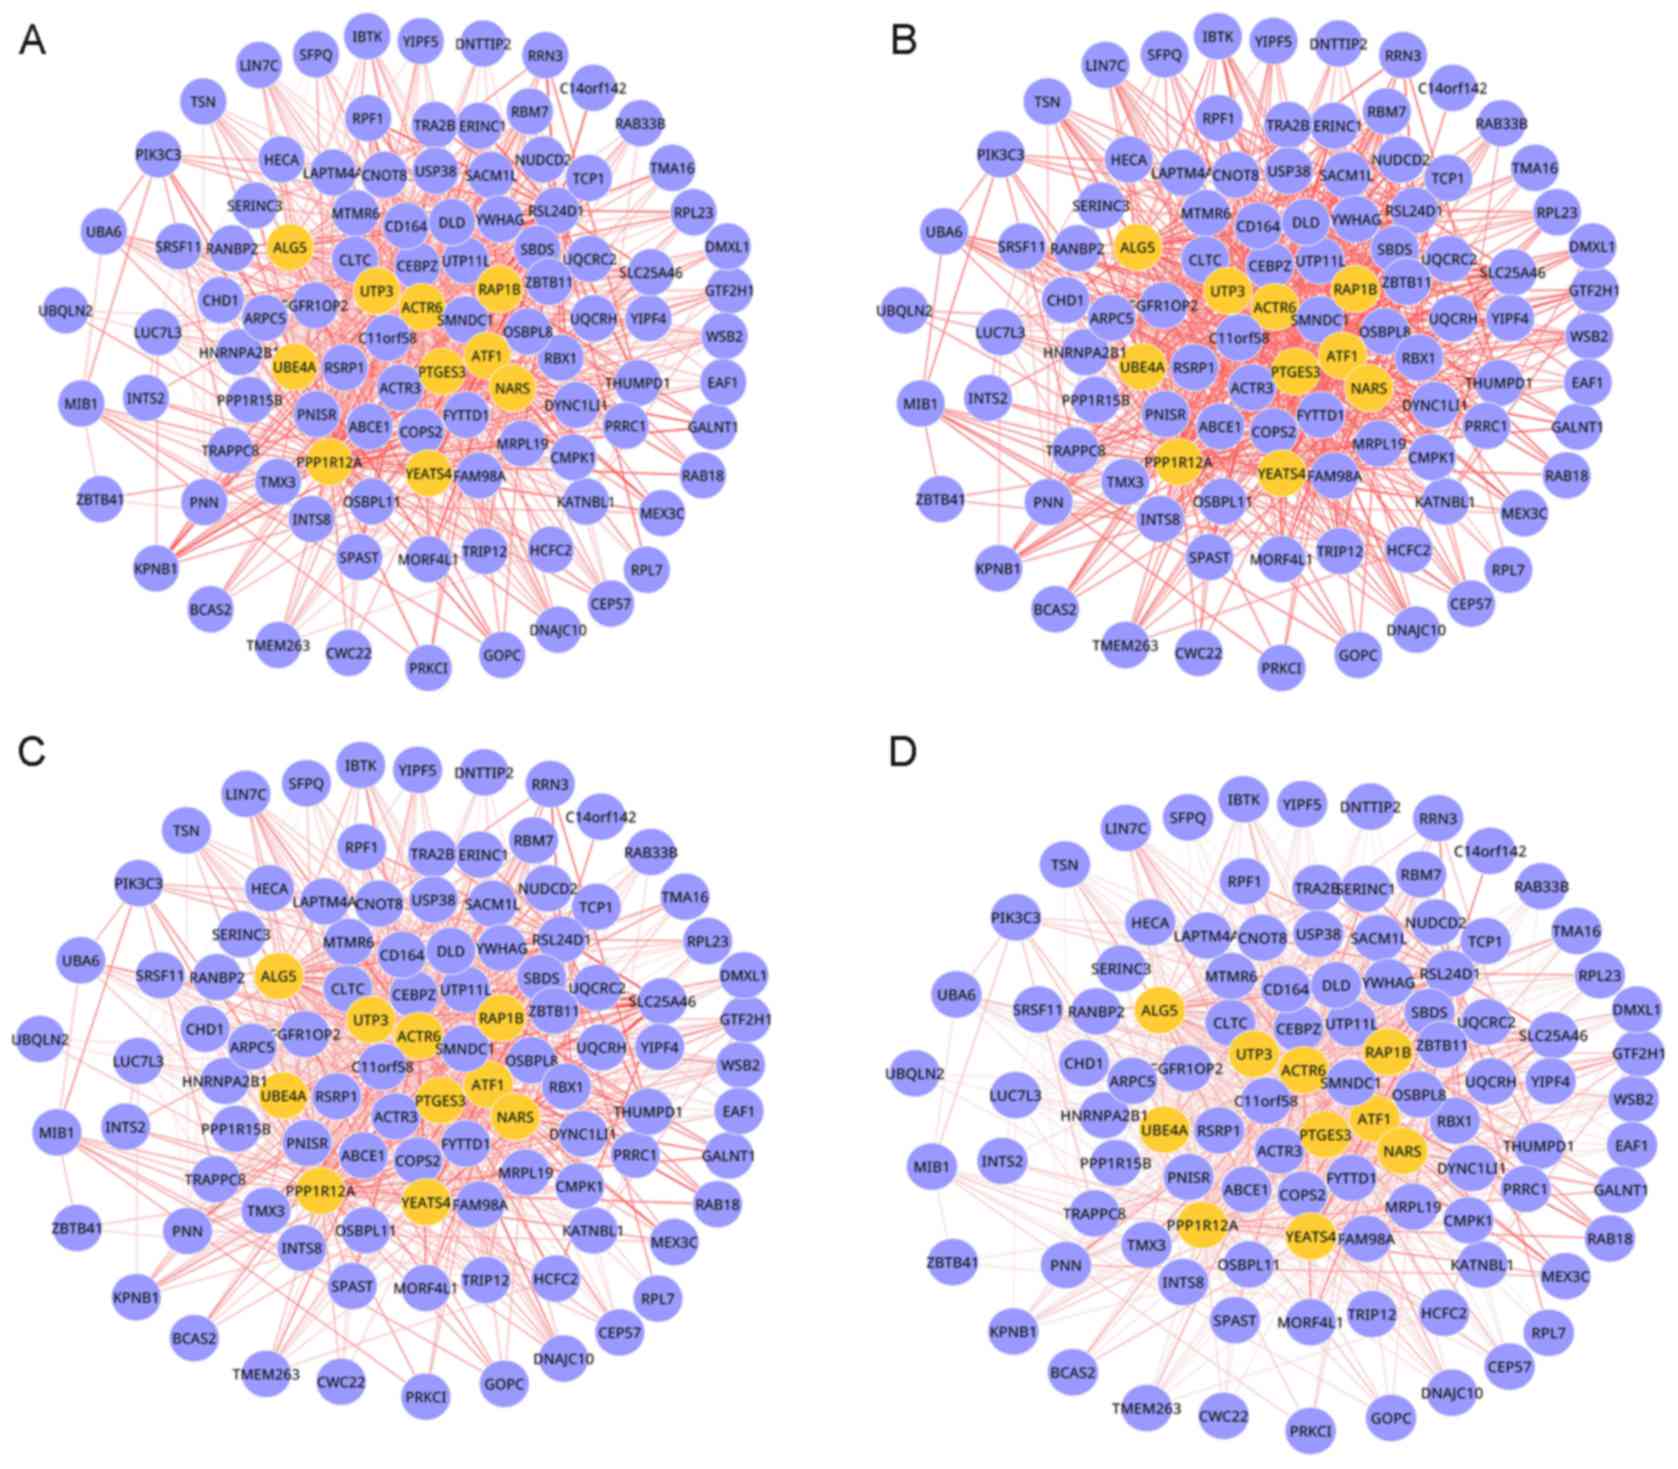
of random 4-DMs. At an FDR-value threshold of 0.05, only module 3
observed in the DCNs of grade 1, 2, 3 and 4 OS was dynamic. This
dynamic DM involved 103 nodes and 870 edges, as presented in
Fig. 2. As OS progression
increased, the connectivity of multiple interactions in this module
was markedly changed, which indicated that network rewiring has
important roles during OS progression.
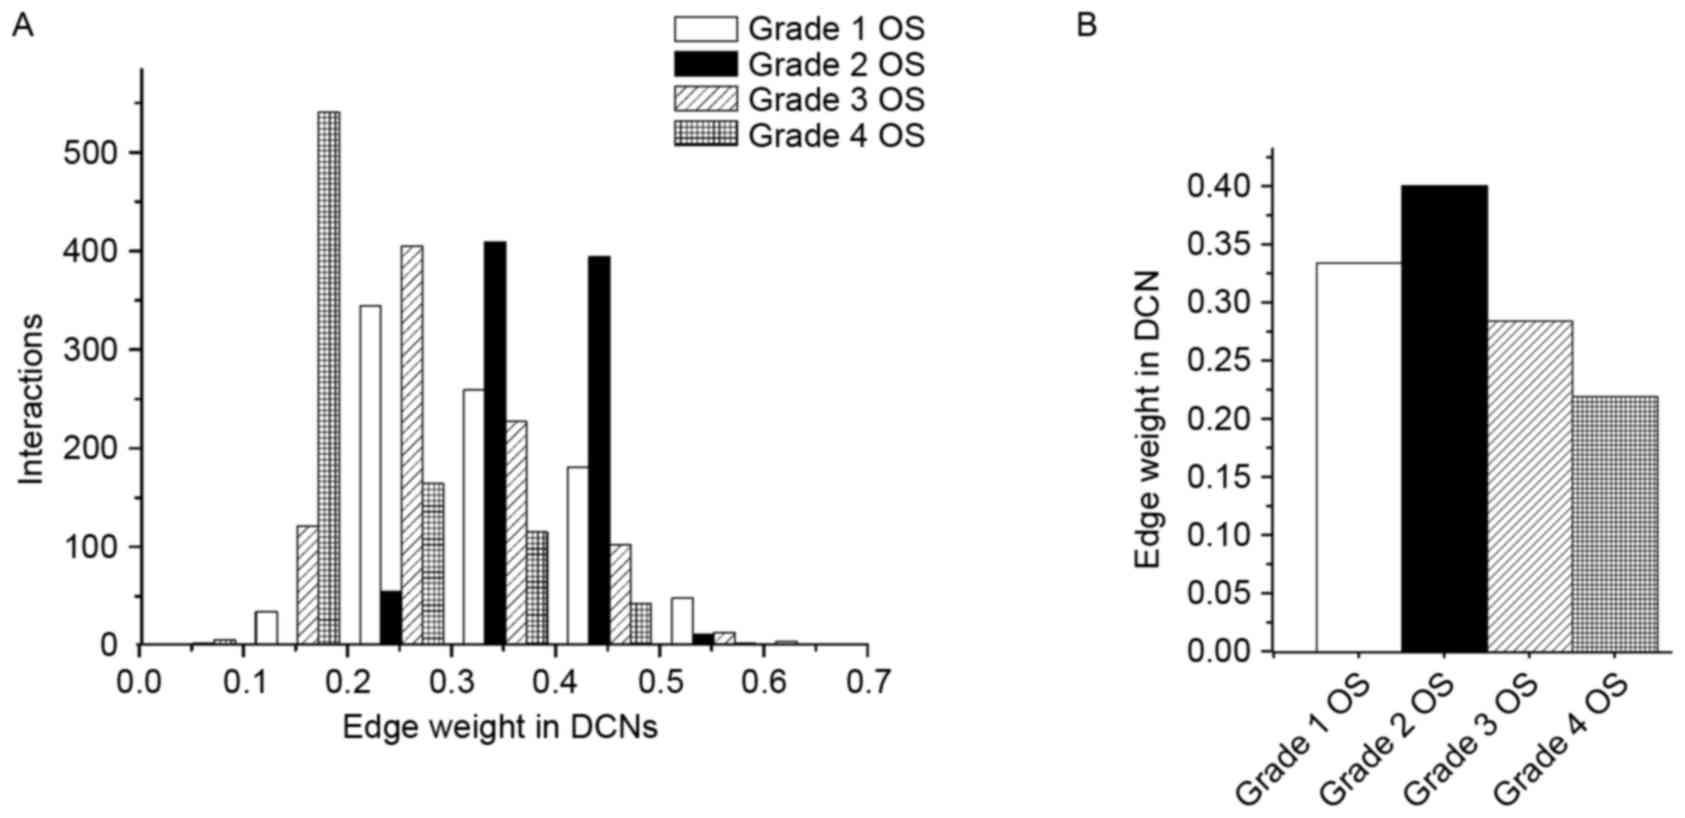
Since the edge weight in DCNs is a degree of
differential expression between disease and control conditions, the
mean edge weight serves as a measure of differential activity of
the module. Fig. 3 presents the
distribution of edge weight in the dynamic 4-DMs for grade 1, 2, 3
and 4 OS. For the sake of clarity, only edges that had significant
weight changes (P<0.05) were exhibited. As presented in Fig. 3A, the number of interactions in the
grade 4 OS network was greater than that in the other networks in
the weight distribution of 0.1–0.2; particularly higher compared
with grade 1 and 2 OS networks. Furthermore, the count of
interactions in grade 2 OS network was greater than that in other
networks in the weight distribution of 0.3–0.5. Similarly, the
number of interactions in grade 3 OS network was higher in the
distribution of 0.2–0.3, relative to the other conditions.
For this dynamic module, the majority of the
changed edges with increased weight were detected in the grade 2
OS, relative to the other three OS conditions (Fig. 3B). Accordingly, these connectivity
changes demonstrated that the pathway was rewired between different
OS grades.
By analyzing the topological centrality (degree)
for genes, if was determined that seed genes, including protein
phosphatase 1 regulatory subunit 12A (PPP1R12A), UTP3, small
subunit processome component homolog (UTP3), prostaglandin E
synthase 3 (PTGES3) and ubiquitination factor E4A had the highest
degrees among the genes.
Pathway enrichment analysis
Previously, several studies have demonstrated that
certain pathways are more dynamic than others during the
progression of disease (18,19).
To investigate this in OS, pathway enrichment analysis was
performed for dynamic module 3. Based on the presence of at least
two genes and a P<0.05 in the pathways, a total of two
significant pathway terms (ubiquitin-mediated proteolysis and
ribosome) were identified to be enriched in this module.
Discussion
From a biological perspective, numerous diseases
are induced by perturbations to the gene network. Such
perturbations change dynamically as the disease develops. However,
the knowledge about the dynamics of gene networks in the process of
disease progression is rather limited. Thus, in the current study,
an iMDM algorithm was created to analyze the microarray data
from OS at four clinical stages to capture the connectivity changes
of sub-networks in the process of OS development, and to identify
candidate genes that may be useful for OS treatment. Based on the
z-score distribution of 272 nodes in DCNs, 13 seed genes were
identified. Following the determination of statistical significance
of multiple candidate modules, a total of four candidate modules,
modules 1, 2, 3 and 4, were significant. Furthermore, module 3
observed in the DCNs of grade 1, 2, 3 and 4 OS were dynamic when
the MCDS of real 4-DMs were compared with a null distribution of
MCDS of random 4-DMs. The initial seed gene of this module was
PPP1R12A. Notably, the functions of the dynamic module 3 included
ubiquitin-mediated proteolysis and ribosome. Seed genes with the
highest degrees included PPP1R12A, UTP3 and PTGES3. The results
demonstrated that pathway functions (ubiquitin-mediated proteolysis
and ribosome) and several seed genes (PPP1R12A, UTP3 and PTGES3)
may have important roles in the progression of OS.
The ubiquitin-mediated proteolysis system has
important functions in various basic cellular processes, for
instance regulation of cell cycle, immune and inflammatory
responses, modulation of development and differentiation (22). Considering its role in numerous
processes, it is unsurprising that ubiquitin-mediated proteolysis
has been implicated in the progression of various diseases.
Alterations in ubiquitin-mediated proteolysis has been suggested to
be significantly associated with overexpression of hypoxia
inducible factor (HIF)-1α and HIF-2α (23). Notably, HIF-1α has been
demonstrated to induce a hypoxic microenvironment via coordinated
regulation of hypoxia-responsive genes, and adaptation to a hypoxic
microenvironment is crucial for the tumor progression (24). Additionally, Guo et al
(25) have indicated that HIF-1α
is activated in human OS. Thus, it is inferred that the
ubiquitin-mediated proteolysis pathway may have an important role
in OS progression.
PPP1R12A, a member of myosin phosphatase target
(MYPT) family, is also termed MYPT1. PPP1R12A is part of a Rho
kinase pathway (26). As
previously reported, PPP1R12A participates in diverse cellular
functions, including cell cycle regulation (27,28),
and cell migration and adhesion (29). In cancer cells, abnormal regulation
of cell division contributes to metastatic potential (30). It is demonstrated that the cell
cycle regulatory pathway is often somatically inactivated in OS
(31). Furthermore, suppression of
Notch signaling inhibits OS growth by changing the expression of
cell cycle regulators (32). Cell
migration is a multistep process that requires alterations of
cell-substrate adhesions, cytoskeleton and extracellular matrix.
Aberrant migration is associated with inflammatory disorders and
cancer (33–35). Specifically, 82% pancreatic cancers
have enhanced expression of PPP1R12A (36). Currently, knowledge of the
involvement of PPP1R12A in OS progression is limited. In light of
these results, we hypothesize that PPP1R12A may be a potential gene
involved OS progression, partially via altered regulation of the
cell cycle and cell migration.
UTP3 is a component of the small subunit (SSU)
processome. The SSU processome, consisting of 40 proteins and the
U3 small nucleolar RNA, is required for ribosome biosynthesis
(37). Ribosomes are vital for the
translation of mRNA into protein and are essential for cell growth.
Dysregulation of ribosome biosynthesis has been indicated to be
connected with alterations in cell proliferation, cell cycle and
cell growth (38,39). Changing the dynamics of ribosome
production can frequently accelerate cell transformation and
contribute to increased susceptibility to cancer (40). Furthermore, Jorgensen et al
(41) used microarray data to
demonstrated that deletion of UTP4, UTP6, and UTP10, which are all
involved in ribosome biogenesis, suppresses cancer cell
proliferation. Bernstein and Baserga (42) indicated that when SSU processome
proteins are detected, ribosomes are no longer generated and cells
stall in G1. In the current study, dynamic module 3, which was
observed in all grade 1, 2, 3, and 4 OS DCNs, was enriched for
genes involved in the ribosome pathway. Accordingly, it is inferred
that UTP3 may have important roles in OS development via regulating
ribosome biogenesis, which further mediates cell cycle
progression.
PTGES3 is a prostaglandin E synthase enzyme.
Dysregulation of the prostaglandin-endoperoxide synthase pathway
may cause the accumulation of pro-inflammatory signals, which is
characteristic of cancer (43,44).
Recently, PTGES3 has been suggested to be overexpressed in multiple
cancers, including colorectal (45) and non-small cell lung cancer
(46). Notably, a previous study
demonstrated that the high expression of PTGES3 is associated with
the stage of endometrioid endometrial cancer (47). Taken together, the findings of the
current study indicate that PTGES3 may affect the progression of OS
by regulating inflammatory responses.
In conclusion, the data of the present study offers
a comprehensive bioinformatics analysis of OS, which may provide
new insights into the understanding of the mechanism underlying OS
progression. There are multiple directions whereby the iMDM
concept can be extended in future work. For instance, genetic
mutation data from exomes can be applied as prior information to
guide module searching, under the hypothesis that mutated sequences
are potentially involved in the diseases being investigated. In
addition, transcriptome information can be integrated with
epigenomic data to understand how environmental factors disrupt
gene networks. Furthermore, comparing dynamic events referring to
different molecular types may provide new mechanistic insights into
the interactions in the progression of disease. Finally, the
iMDM framework is widely applicable to other tumor samples
for which disease stage-specific transcriptome data are available.
The genes and pathways identified using iMDM may be used as
potential biomarkers in clinics. Thus, in the current study,
pathway functions (ubiquitin-mediated proteolysis and ribosome) and
several seed genes (PPP1R12A, UTP3, and PTGES3) in the dynamic
module (module 3) are associated with the progression of OS and may
serve as potential therapeutic targets in this disease.
Nevertheless, further experimental studies are still required to
verify these findings.
References
|
1
|
Ottaviani G and Jaffe N: The epidemiology
of osteosarcomaPediatric and adolescent osteosarcoma. Springer; pp.
3–13. 2010
|
|
2
|
Walkley CR, Qudsi R, Sankaran VG, Perry
JA, Gostissa M, Roth SI, Rodda SJ, Snay E, Dunning P, Fahey FH, et
al: Conditional mouse osteosarcoma, dependent on p53 loss and
potentiated by loss of Rb, mimics the human disease. Genes Dev.
22:1662–1676. 2008. View Article : Google Scholar : PubMed/NCBI
|
|
3
|
Buddingh EP, Anninga JK, Versteegh MI,
Taminiau AH, Egeler RM, van Rijswijk CS, Hogendoorn PC, Lankester
AC and Gelderblom H: Prognostic factors in pulmonary metastasized
high-grade osteosarcoma. Pediatr Blood Cancer. 54:216–221.
2010.PubMed/NCBI
|
|
4
|
Rettew AN, Getty PJ and Greenfield EM:
Receptor tyrosine kinases in osteosarcoma: Not just the usual
suspectsCurrent Advances in Osteosarcoma. Springer; pp. 47–66.
2014
|
|
5
|
Hameed M and Dorfman H: Primary malignant
bone tumors-recent developmentsSeminars in diagnostic pathology.
Elsevier; pp. 86–101. 2011, View Article : Google Scholar : PubMed/NCBI
|
|
6
|
Polager S and Ginsberg D: p53 and E2f:
Partners in life and death. Nat Rev Cancer. 9:738–748. 2009.
View Article : Google Scholar : PubMed/NCBI
|
|
7
|
Liu X, Tang WH, Zhao XM and Chen L: A
network approach to predict pathogenic genes for Fusarium
graminearum. PLoS One. 5:pii: e130212010. View Article : Google Scholar
|
|
8
|
Chen L, Wang RS and Zhang XS: Biomolecular
networks: Methods and applications in systems biology. John Wiley
& Sons; 2009, View Article : Google Scholar
|
|
9
|
Ellis JD, Barrios-Rodiles M, Colak R,
Irimia M, Kim T, Calarco JA, Wang X, Pan Q, O'Hanlon D, Kim PM, et
al: Tissue-specific alternative splicing remodels protein-protein
interaction networks. Mol Cell. 46:884–892. 2012. View Article : Google Scholar : PubMed/NCBI
|
|
10
|
Harbison CT, Gordon DB, Lee TI, Rinaldi
NJ, Macisaac KD, Danford TW, Hannett NM, Tagne JB, Reynolds DB, Yoo
J, et al: Transcriptional regulatory code of a eukaryotic genome.
Nature. 431:99–104. 2004. View Article : Google Scholar : PubMed/NCBI
|
|
11
|
Zhang B, Tian Y, Jin L, Li H, Shih IeM,
Madhavan S, Clarke R, Hoffman EP, Xuan J, Hilakivi-Clarke L and
Wang Y: DDN: A caBIG® analytical tool for differential network
analysis. Bioinformatics. 27:1036–1038. 2011. View Article : Google Scholar : PubMed/NCBI
|
|
12
|
Ma X, Gao L, Karamanlidis G, Gao P, Lee
CF, Garcia-Menendez L, Tian R and Tan K: Revealing pathway dynamics
in heart diseases by analyzing multiple differential networks. PLoS
Comput Biol. 11:e10043322015. View Article : Google Scholar : PubMed/NCBI
|
|
13
|
Kuijjer ML, Rydbeck H, Kresse SH, Buddingh
EP, Lid AB, Roelofs H, Bürger H, Myklebost O, Hogendoorn PC,
Meza-Zepeda LA and Cleton-Jansen AM: Identification of osteosarcoma
driver genes by integrative analysis of copy number and gene
expression data. Genes Chromosomes Cancer. 51:696–706. 2012.
View Article : Google Scholar : PubMed/NCBI
|
|
14
|
Ma X, Gao L and Tan K: Modeling disease
progression using dynamics of pathway connectivity. Bioinformatics.
30:2343–2350. 2014. View Article : Google Scholar : PubMed/NCBI
|
|
15
|
Watson-Haigh NS, Kadarmideen HN and
Reverter A: PCIT: An R package for weighted gene co-expression
networks based on partial correlation and information theory
approaches. Bioinformatics. 26:411–413. 2010. View Article : Google Scholar : PubMed/NCBI
|
|
16
|
Sarawagi S and Kirpal A: Efficient set
joins on similarity predicates. Proceedings of the 2004 ACM SIGMOD
international conference on Management of data ACM. 743–754. 2004.
View Article : Google Scholar
|
|
17
|
Benjamini Y and Hochberg Y: Controlling
the false discovery rate: a practical and powerful approach to
multiple testing. J R Stat Soc. Series B (Methodological).
57:289–300. 1995.
|
|
18
|
Taylor IW, Linding R, Warde-Farley D, Liu
Y, Pesquita C, Faria D, Bull S, Pawson T, Morris Q and Wrana JL:
Dynamic modularity in protein interaction networks predicts breast
cancer outcome. Nat Biotechnol. 27:199–204. 2009. View Article : Google Scholar : PubMed/NCBI
|
|
19
|
Bisson N, James DA, Ivosev G, Tate SA,
Bonner R, Taylor L and Pawson T: Selected reaction monitoring mass
spectrometry reveals the dynamics of signaling through the GRB2
adaptor. Nat Biotechnol. 29:653–658. 2011. View Article : Google Scholar : PubMed/NCBI
|
|
20
|
da W Huang, Sherman BT and Lempicki RA:
Systematic and integrative analysis of large gene lists using DAVID
bioinformatics resources. Nat Protoc. 4:44–57. 2009.PubMed/NCBI
|
|
21
|
da W Huang, Sherman BT and Lempicki RA:
Bioinformatics enrichment tools: Paths toward the comprehensive
functional analysis of large gene lists. Nucleic Acids Res.
37:1–13. 2009. View Article : Google Scholar : PubMed/NCBI
|
|
22
|
Ciechanover A, Orian A and Schwartz AL:
Ubiquitin-mediated proteolysis: Biological regulation via
destruction. Bioessays. 22:442–451. 2000. View Article : Google Scholar : PubMed/NCBI
|
|
23
|
Guo G, Gui Y, Gao S, Tang A, Hu X, Huang
Y, Jia W, Li Z, He M, Sun L, et al: Frequent mutations of genes
encoding ubiquitin-mediated proteolysis pathway components in clear
cell renal cell carcinoma. Nat Genet. 44:17–19. 2011. View Article : Google Scholar : PubMed/NCBI
|
|
24
|
Rivard A, Berthou-Soulie L, Principe N,
Kearney M, Curry C, Branellec D, Semenza GL and Isner JM:
Age-dependent defect in vascular endothelial growth factor
expression is associated with reduced hypoxia-inducible factor 1
activity. J Biol Chem. 275:29643–29647. 2000. View Article : Google Scholar : PubMed/NCBI
|
|
25
|
Guo M, Cai C, Zhao G, Qiu X, Zhao H, Ma Q,
Tian L, Li X, Hu Y, Liao B, et al: Hypoxia promotes migration and
induces CXCR4 expression via HIF-1α activation in human
osteosarcoma. PLoS One. 9:e905182014. View Article : Google Scholar : PubMed/NCBI
|
|
26
|
Nishioka T, Shohag MH, Amano M and
Kaibuchi K: Developing novel methods to search for substrates of
protein kinases such as Rho-kinase. Biochim Biophys Acta.
1854:1663–1666. 2015. View Article : Google Scholar : PubMed/NCBI
|
|
27
|
Chiyoda T, Sugiyama N, Shimizu T, Naoe H,
Kobayashi Y, Ishizawa J, Arima Y, Tsuda H, Ito M, Kaibuchi K, et
al: LATS1/WARTS phosphorylates MYPT1 to counteract PLK1 and
regulate mammalian mitotic progression. J Cell Biol. 197:625–641.
2012. View Article : Google Scholar : PubMed/NCBI
|
|
28
|
Li J, Liu X, Liao J, Tian J, Wang J, Wang
X, Zhang J and Xu X: MYPT1 sustains centromeric cohesion and the
spindle-assembly checkpoint. J Genet Genomics. 40:575–578. 2013.
View Article : Google Scholar : PubMed/NCBI
|
|
29
|
Grassie ME, Moffat LD, Walsh MP and
MacDonald JA: The myosin phosphatase targeting protein (MYPT)
family: A regulated mechanism for achieving substrate specificity
of the catalytic subunit of protein phosphatase type 1δ. Arch
Biochem Biophys. 510:147–159. 2011. View Article : Google Scholar : PubMed/NCBI
|
|
30
|
Lafleur EA, Koshkina NV, Stewart J, Jia
SF, Worth LL, Duan X and Kleinerman ES: Increased Fas expression
reduces the metastatic potential of human osteosarcoma cells. Clin
Cancer Res. 10:8114–8119. 2004. View Article : Google Scholar : PubMed/NCBI
|
|
31
|
Horowitz JM, Park SH, Bogenmann E, Cheng
JC, Yandell DW, Kaye FJ, Minna JD, Dryja TP and Weinberg RA:
Frequent inactivation of the retinoblastoma anti-oncogene is
restricted to a subset of human tumor cells. Proc Natl Acad Sci
USA. 87:2775–2779. 1990. View Article : Google Scholar : PubMed/NCBI
|
|
32
|
Tanaka M, Setoguchi T, Hirotsu M, Gao H,
Sasaki H, Matsunoshita Y and Komiya S: Inhibition of Notch pathway
prevents osteosarcoma growth by cell cycle regulation. Br J Cancer.
100:1957–1965. 2009. View Article : Google Scholar : PubMed/NCBI
|
|
33
|
Ellenbroek SI, Iden S and Collard JG: Cell
polarity proteins and cancer. Seminars in cancer biology Elsevier.
208–215. 2012. View Article : Google Scholar
|
|
34
|
Vasiliev JM: Cytoskeletal mechanisms
responsible for invasive migration of neoplastic cells. Int J Dev
Biol. 48:425–440. 2004. View Article : Google Scholar : PubMed/NCBI
|
|
35
|
Wodarz A and Näthke I: Cell polarity in
development and cancer. Nat Cell Biol. 9:1016–1024. 2007.
View Article : Google Scholar : PubMed/NCBI
|
|
36
|
Jaffee EA, Jhaveri DT and Anders R:
Diagnostic biomarkers and therapeutic targets for pancreatic cancer
US Patent 20,150,316,554. Filed December 2, 2013; issued November
5. 2015
|
|
37
|
Phipps KR, Charette J and Baserga SJ: The
small subunit processome in ribosome biogenesis-progress and
prospects. Wiley Interdiscip Rev RNA. 2:1–21. 2011. View Article : Google Scholar : PubMed/NCBI
|
|
38
|
Ruggero D and Pandolfi PP: Does the
ribosome translate cancer? Nat Rev Cancer. 3:179–192. 2003.
View Article : Google Scholar : PubMed/NCBI
|
|
39
|
Montanaro L, Treré D and Derenzini M:
Nucleolus, ribosomes, and cancer. Am J Pathol. 173:301–310. 2008.
View Article : Google Scholar : PubMed/NCBI
|
|
40
|
Kondoh N, Shuda M, Tanaka K, Wakatsuki T,
Hada A and Yamamoto M: Enhanced expression of S8, L12, L23a, L27
and L30 ribosomal protein mRNAs in human hepatocellular carcinoma.
Anticancer Res. 21:2429–2433. 2001.PubMed/NCBI
|
|
41
|
Jorgensen P, Nishikawa JL, Breitkreutz BJ
and Tyers M: Systematic identification of pathways that couple cell
growth and division in yeast. Science. 297:395–400. 2002.
View Article : Google Scholar : PubMed/NCBI
|
|
42
|
Bernstein KA and Baserga SJ: The small
subunit processome is required for cell cycle progression at G1.
Mol Biol Cell. 15:5038–5046. 2004. View Article : Google Scholar : PubMed/NCBI
|
|
43
|
Colotta F, Allavena P, Sica A, Garlanda C
and Mantovani A: Cancer-related inflammation, the seventh hallmark
of cancer: Links to genetic instability. Carcinogenesis.
30:1073–1081. 2009. View Article : Google Scholar : PubMed/NCBI
|
|
44
|
Grivennikov SI, Greten FR and Karin M:
Immunity, inflammation, and cancer. Cell. 140:883–899. 2010.
View Article : Google Scholar : PubMed/NCBI
|
|
45
|
Cebola I, Custodio J, Muñoz M,
Díez-Villanueva A, Paré L, Prieto P, Aussó S, Coll-Mulet L, Boscá
L, Moreno V and Peinado MA: Epigenetics override pro-inflammatory
PTGS transcriptomic signature towards selective hyperactivation of
PGE2 in colorectal cancer. Clin Epigenetics. 7:742015. View Article : Google Scholar : PubMed/NCBI
|
|
46
|
Liang Y, Liu M, Wang P, Ding X and Cao Y:
Analysis of 20 genes at chromosome band 12q13: RACGAP1 and MCRS1
overexpression in nonsmall-cell lung cancer. Genes Chromosomes
Cancer. 52:305–315. 2013. View Article : Google Scholar : PubMed/NCBI
|
|
47
|
Lomnytska MI, Becker S, Gemoll T, Lundgren
C, Habermann J, Olsson A, Bodin I, Engström U, Hellman U, Hellman
K, et al: Impact of genomic stability on protein expression in
endometrioid endometrial cancer. Br J Cancer. 106:1297–1305. 2012.
View Article : Google Scholar : PubMed/NCBI
|