Introduction
Androgens serve an essential role as autocrine or
paracrine agents in mammalian ovarian follicle growth, maturation
and luteinization (1). However,
androgens have a dual role in follicle development. Low androgen
concentrations promote follicle recruitment from the reserve pool
into the development pool. This occurs by promoting
theca-interstitial cell (TIC) and granulosa cell (GC)
proliferation, and reducing follicle atresia and apoptosisby
binding to androgen receptors on preantral follicles or small
antral follicles (2). Conversely,
high androgen concentrations may exert inhibitory effects, for
example, hyperandrogenism-induced antral follicle arrest in rats
(3). Hyperandrogenemia is
associated with numerous clinical disorders, in which reproductive
dysfunction and metabolic alterations coexist, for example,
polycystic ovary syndrome (PCOS), obesity and congenital adrenal
hyperplasia (4). Furthermore,
there is growing evidence to suggest that the elevated levels of
circulating androgens in girls with clinical obesity may lead to an
increased neuroendocrine drive to the reproductive axis (5,6). The
etiology of PCOS is unclear, and ethical and logistic constraints
limit decisive clinical studies. Consequently, treatment is
palliative rather than curative, and focuses on symptomatic
approaches. Heritable tendencies have previously been recognized,
however complex interactions exist between genetic and
environmental factors. Therefore, in order to identify causative
genes, our previous study conducted a genome-wide association study
(GWAS) of PCOS in a Han Chinese population (7). To the best of our knowledge, this
study was the first to demonstrate that fructose-1,6-bisphosphatase
(FBP1), luteinizing hormone/choriogonadotropin receptor,
follicle-stimulating hormone receptor and insulin receptor are
correlated with PCOS etiology (7).
Some physiological and metabolic abnormalities that
are often reported to be associated with PCOS include gestational
diabetes, impaired glucose tolerance, hyperinsulinemia and type 2
diabetes mellitus; thus, increasing the risk of morbidity and
mortality. Previous studies onnon-human primates, sheep, rats and
mice have suggested an epigenetic mechanism for PCOS based upon
in utero exposure of the developing female fetus to androgen
excess and associated metabolic consequences (8–10).
Female rhesus monkeys exposed to excessive levels of prenatal
androgens have presented the most comprehensive adult PCOS-like
phenotype, meeting all three diagnostic criteria, in addition to
the metabolic comorbidities of insulin resistance, impaired
pancreatic beta cell function and increased prevalence of type 2
diabetes mellitus. Furthermore, this adult metabolic phenotype is
preceded by excessive insulin sensitivity, increased insulin
secretion relative to insulin sensitivity in infancy and increased
glucose clearance rate (11).
FBP1 is a key regulatory enzyme of gluconeogenesis
that catalyzes the hydrolysis of fructose-1,6-bisphosphate to
fructose-6-phosphate and inorganic phosphate. FBP1 is a critical
protein, since most glucose consumption and energy use of vital
organs is dependent on gluconeogenesis. FBP1 deficiency is
associated with fasting hypoglycemia and metabolic acidosis due to
impaired gluconeogenesis (12).
Following stimulation of human breast cancer cells with estradiol,
the expression of the FBP1 protein increased (13). In addition, exposure of fetuses to
sustained hypoglycemia resulted in maintenance of hepatic insulin
action and increased FBP1 expression (14).
In the present study, an in vitro
testosterone model was used, as it exhibits the main features of
the hyperandrogenism phenotype in PCOS. Therefore, this model has
been applied to mimic human PCOS (15,16).
Murine primary follicles, GCs and TICs were cultured in
vitro and treated with a high concentration of androgens. The
molecular mechanisms underlying the effects of the FBP1 signaling
pathway onnormal follicle development and hyperandrogenism-induced
abnormal follicle growth were investigated. These findings may
provide a theoretical basis forthe mechanism of PCOS, and
information regarding clinical prevention, diagnosis and genetic
counseling.
Materials and methods
Animals
Female Kunming mice [n=200; age, 14 days (weight,
8–10 g) and 26–28 days (weight, 17–20 g)] were purchased from the
Animal Facility of Shandong University (Jinan, China) and housed in
a 12-h light/12-h dark cycle (lights on at 7 a.m., off at 7 p.m.).
Food and water were given. The present study was ethically approved
by the Center for Reproductive Medicine, Shandong University
(Jinan, China).
Isolation and culture of primary
follicles
Primary follicle cells were cultured in operating
liquid, containing α-minimum Essential medium (α-MEM; Hyclone; GE
Healthcare Life Sciences, Logan, UT, USA), supplemented with 10%
heat-inactivated fetal bovine serum (FBS; Hyclone; GE Healthcare
Life Sciences), 100 U/ml penicillin and 100 µg/ml streptomycin
sulfate. Culture medium I: α-MEM supplemented with 10% FBS, ITS-mix
(insulin 5 mg/ml, transferrin 5 mg/ml, selenium 5 ng/ml;
Sigma-Aldrich; Merck KGaA, Darmstadt, Germany) and 100 mU/ml
recombinant follicle-stimulating hormone (FSH; Livzon
Pharmaceutical Group Co., Ltd., Zhuhai, China) and luteinizing
hormone (LH; Merck Serono GmbH, Darmstadt, Germany). Culture medium
II was the same as culture medium I, with the omission of α-MEM
supplemented with 5% FBS. Follicle culture was prepared as
previously reported (17).
The 14-day-old mice were sacrificed by cervical
dislocation prior to rapid dissection of the ovaries, which were
placed in DMEM/F12 medium supplemented with 10% FBS, 100 IU/ml
penicillin and 100 µg/ml streptomycin (all from Sigma-Aldrich;
Merck KGaA). The tissue adhering to ovaries was removed using the
beveled edges of two syringe needles. The ovaries were transferred
into the operating liquid and were mechanically dissected again
with two syringe needles. Follicles with one layer of GCs, a
centrally placed oocyte, an intact basal membrane and some attached
theca cells were collected and cultured individually in 10 µl
culture medium I, overlying paraffin oil (Sigma-Aldrich; Merck
KGaA). The culture dishes were maintained at 37°C in an incubator
containing 100% humidity and 5% CO2. Following 4 days of
culturing, 10 µl culture medium I was added to each cultured cell
type. At 6 days, medium I was changed to culture medium II.
Subsequent refreshment was conducted every other day by removing
and replacing 10 µl media. Follicular morphology was recorded using
an inverted microscope prior to each refreshment.
Isolation of GCs and TICs
The GCs and TICs were collected as previously
reported (18). GCs were isolated
from the ovaries of 14-day-old mice. Following mechanical
dissection, follicles were digested in a medium containing 1 mg/ml
collagenase I, 0.025% trypsin and 0.02 mg/ml DNase I
(Sigma-Aldrich; Merck KGaA) for 30–45 min at 37°C. After 2 washes,
the cells were seeded with Dulbecco's modified Eagle's medium
(DMEM)/F12 (Hyclone; GE Healthcare Life Sciences) supplemented with
5% FBS, 100 IU/ml penicillin and 100 µg/ml streptomycin sulfate,
and cultured overnight for adhesion. Following this period, the
cells were cultured in fresh medium in the presence or absence of
the various reagents for the indicated durations.
The TICs were isolated from the ovaries of
26–28-day-old mice. The ovaries were isolated from connective
tissues under a stereomicroscope and were collected in culture
medium (DMEM supplemented with 10% FBS, 100 U/ml penicillin, 0.1
mg/ml streptomycin, and 100 ng/ml recombinant FSH). The follicles
on the surface of the ovaries were punctured with fine tweezers to
remove GCs and oocytes. The punctured ovaries were cut into 1
mm3 fragments using scissors in culture medium
containing 0.2% collagenase and 0.1% DNase, and were then pipetted
to facilitate cell dispersion. The suspension of ovarian fragments
was incubated at 37°C for 20 min and pipetted at the
10th and 20th min. Ovarian fragments, follicles and
oocytes that could not be removed by puncturing with fine tweezers
were filtered through a series of nylon meshes (pore size order,
155, 82, 40, 20 and 10 µm). The resulting cell suspension was
centrifuged at 250 × g at 4°C for 5 min, and the supernatant was
removed. To reduce the effects of collagenase to a negligible
level, the above washing procedure was repeated 4 times. Finally,
the cells were suspended in the culture medium, and the number of
viable cells was counted by trypan blue exclusion test.
Effects of testosterone on follicle
growth
According to a previous report (19), 1×10⁻⁵ mol/l testosterone
(Sigma-Aldrich; Merck KGaA) was considered able to induce
hyperandrogenism; therefore, the present study selected
1×10⁻⁶, 1×10⁻⁵ and 1×10⁻⁴ mol/l as
test doses, and observed follicle development for 14 days to
determine the optimum dosage.
MTT assay analysis
GCs and TICs were seeded (1×10⁴
cells/well) in 96-well plates and incubated in fresh medium with
various reagents. Cells were treated with 1×10⁻⁷,
1×10⁻⁶, 1×10⁻⁵, 1×10⁻⁴ or
1×10⁻³ mol/l testosterone for 24 and 48 h, and cell
proliferation was monitored by MTT assay to determine the optimum
dose. A total of 20 µl MTT reagent wasadded to each well of the
96-well plate and incubated at 37°C for 4 h, the supernatant was
then removed and the cells were treated with 150 µl/well dimethyl
sulfoxide for 10 min. Absorbance (optical density) was recorded at
570 nm using an ELISA plate reader.
Experimental group design
The optimum dosage of testosterone and flutamide was
determined as 1×10⁻⁵ mol/l testosterone and flutamide, according to
the aforementioned experiments and previously published papers
(20,21). Flutamide was used in the present
study as it is an androgen receptor antagonist which reverses the
effects of androgens (20,21). Follicles, GCs and TICs were divided
into the following groups: Control (CTR), testosterone (T),
flutamide (F) and flutamide + testosterone (F+T) groups. The GCs
and TICs of each group were treated with testosterone for 48 h at
37°C. The follicles and cells in the F+T group were treated with
flutamide for 2 h prior to the addition of testosterone to their
culture medium.
Hormone level measurement
The supernatant of cultured follicles was collected
via centrifugation at 200 × g for 5 min at 4°C, in order to detect
the levels of estradiol (E2), progesterone (P) and
insulin (INS) by chemiluminescence assay (cat. no. Unicel DXI800;
Beckman Coulter, Inc., Brea, CA, USA) on day 7 and 14 in
vitro.
RNA extraction and reverse
transcription-quantitative polymerase chain reaction (RT-qPCR)
The mRNA expression levels of genes associated with
FPB1, including FBP1, glucose-6-phosphatase catalytic subunit (G6
PC), phosphoenolpyruvate carboxykinase 1 (PCK1) and forkhead box
protein O1 (FOXO1) were detected by RT-qPCR. Follicles and cells
were initially lysed with TRIzol® reagent (Invitrogen;
Thermo Fisher Scientific, Inc., Waltham, MA, USA). Total RNA was
extracted according to the manufacturer's instructions. Total RNA
(1 µg) was reverse transcribed in a final volume of 20 µl
containing random primers (Takara Bio, Inc., Otsu, Japan), 5X
PrimeScript Buffer 2.0 µl, PrimeScript RT Enzyme Mix I 1.0 µl,
Oligo dT Primer (50 µM) 1.0 µl, Random 6 mers (100 µM) 1.0 µl and
RNase Free dH2O up to 20 µl (all from Takara
Biotechnology Co., Ltd., Dalian, China). qPCR was performed using
SYBR Premix Ex Taq (Takara Bio, Inc.) according to the
manufacturer's instructions. The primer pairs used for RT-qPCR were
as follows: FBP1 forward, TCA ACT GCT TCA TGC TGG AC and reverse,
GGG TCA AAG TCC TTG GCA TA; G6PC forward, GGT CCT GGA CAC CGA CTA
CT and reverse, TGG CTT TTT CTT TCC TCG AA; PCK1 forward, TGA CTC
GGA TGG GCA TAT CT and reverse, CAT ATC CGC TTC CAA AGG AG; FOXO1
forward, AAG AGC GTG CCC TAC TTC AA and reverse, CTC CCT CTG GATT
GAG CAT C; and GAPDH forward, GAC AGT CAG CCG CAT CTT CT and
reverse, TTA AAA GCA GCC CTG GTG AC. RT-qPCR was conducted using a
LightCycler® 480 sequence detection system (Roche
Diagnostics, Basel, Switzerland). A total of 2 µl cDNA was used for
qPCR and the thermocycling conditions applied were as follows: 95°C
for 15 sec, followed by 45 cycles of 95°C for 5 sec and 60°C for 20
sec, then 95°C for 1 min and cooling to 55°C. The mRNA expression
levels were normalized to GAPDH mRNA and results were analyzed
using the 2−∆∆Cq method (22).
Western blot analysis
FBP1 protein expression was analyzed by western blot
analysis. Cells were collected and lysed in SDS sample buffer [62.5
mM Tris-HCl (pH 6.8), 3% SDS, 10% glycerol, 50 mM DL-dithiothreitol
and 0.1% bromophenol blue] with protease inhibitors (Roche
Diagnostics, Indianapolis, IN, USA). Total proteins were quantified
using a bicinchoninic acid kit (Pierce; Thermo Fisher Scientific,
Inc.) according to the manufacturer's instructions. Protein samples
were boiled at 100°C in loading buffer for 10 min, then 10 µg
protein from each sample (1 µg/µl, 10 µl) was electrophoresed
through a precast gel (NuPAGE Novex 4–12% Bis-Tris gel; 1.5 mm; 10
wells; Invitrogen; Thermo Fisher Scientific, Inc.). Proteins were
transferred from the gel to a polyvinylidene difluoride membrane
(EMD Millipore, Billerica, MA, USA) by means of the semidry
technique using the Criterion Blotter (Bio-Rad Laboratories, Inc.,
Hercules, CA, USA) at 100 V for 60 min and blocked with 5% milk in
PBS (pH 7.4) containing 0.05% Tween-20.
The membranes were incubated overnight at 4°C with
rabbit anti-FBP1 (cat. no. ab109020; Abcam, Cambridge, UK) diluted
to 1 µg/ml and anti-β-actin (cat. no. A5441, 1:200; Sigma-Aldrich;
Merck KGaA) antibodies. After washing with TBST [25 mM Tris-HCl (pH
7.5), 137 mM NaCl, 2.7 mM KCl and 0.05% Tween-20], the membrane was
incubated at 37°C with alkaline peroxidase-conjugated affinipure
goat anti-rabbit immunoglobulin G (IgG; cat. no. 111-035-003,
1:10,000; Jackson ImmunoResearch Laboratories, Inc., West Grove,
PA, USA) for 1 h. The proteins were detected with an enhanced
chemiluminescence system (Pierce; Thermo Fisher Scientific, Inc.).
Semi-quantitative analysis of western blotting was conducted using
the Image Quant-TL software (version 7.0; GE Healthcare Life
Sciences, Pittsburgh, PA, USA).
Immunofluorescence staining
Follicles were cultured in 96-well culture slides,
and the GCs and TICs were grown in 4-well culture slides until they
reached 70% confluence. Following washing 3 times with PBS (5
min/wash), the cells were fixed with freshly prepared 4%
paraformaldehyde diluted in PBS for 10 min at room temperature. The
fixative solution was aspirated, and the cells were washed with PBS
before being blocked with 10% normal goat serum (Sigma; Merck KGaA)
for 1 h at room temperature. Briefly, 0.1% Triton X-100/PBS was
applied to the cells for 5 min. The primary antibodies were diluted
in PBS + 10% goat serum and applied to the cells overnight at 4°C.
The following antibody was used: Rabbit anti-FBP1 (1:200, cat. no.
ab109020; Abcam). After 3 washes with PBS (5 min/wash), goat
anti-mouse fluorescein isothiocyanate-conjugated IgG secondary
antibody (1:200, cat. no. ab31430; Abcam) was applied, and the
samples were incubated in the dark for 1 h at room temperature.
Following this incubation, the cells were washed three times with
PBS containing 0.1% Tween-20 and the cells were then washed with
PBS. Finally, slides were counterstained with nuclear DAPI staining
for 2.5 h at 4°C in the dark (Sigma-Aldrich; Merck KGaA), mounted
with a coverslip using VECTASHIELD® Hard Set Mounting
Medium with DAPI and observed under a fluorescence image analyzer
(cat. no. CKX41; Olympus Corporation, Tokyo, Japan). The following
negative control conditions were also included: No primary antibody
and no secondary antibody.
Immunohistochemistry of ovarian
tissues
Immunohistochemistry was performed on ovarian tissue
from 14-day-old mice with rabbit anti-FBP1 (1:200, cat. no.
ab109020; Abcam) and isotype IgG (1:100, cat. no. sc-2028; Santa
Cruz Biotechnology, Inc., Dallas, TX, USA). The ovarian tissues
were fixed in 10% formalin at 4°C for 24 h, embedded in paraffin
and then the slides were cut in triplicate (5-µm thick sections);
one slide was processed for immunohistochemistry with the FBP1
antibody and the second slide was processed with isotype IgG as a
control. Formalin-fixed paraffin-embedded sections were incubated
at 60°C for 30 min, deparaffinized in xylene and rehydrated by
washing with an ethanol gradient (100% then 95%) and water. Antigen
retrieval (boiling for 10 min in 10 mM sodium citrate, pH 6.0) and
peroxidase quenching (0.3% hydrogen peroxide treatment for 10 min)
were also performed. Sections were incubated in Blocking Buffer
(PBS with 5% normal goat serum (cat. no. ZLI-9021; ZSGB-BIO;
OriGene Technologies, Inc., Beijing, China), 0.5% bovine serum
albumin (cat. no. A6003-25G; Sigma; Merck KGaA) and 0.1% Triton
X-100) for 45 min at room temperature and then incubated at 4°C
with rabbit anti-FBP1 (1:200, cat. no. ab109020; Abcam) overnight.
Followed by incubation for 30 min at room temperature with
biotinylated goat anti-rabbit IgG (1:300) Vectastain ABC elite
(cat. no. BA-1000; Vector Laboratories, Inc., Burlingame, CA, USA).
All of the slides were examined using a Nikon Eclipse E800
microscope (Nikon Corporation, Tokyo, Japan).
Statistical analysis
Experiments were repeated at least three times and
the results are expressed as the mean ± standard deviation. The
data were evaluated for statistical differences using SPSS (version
18.0; SPSS Inc., Chicago, IL, USA). One-way analysis of variance
followed by a least-significant-difference test was used for
statistical comparisons among multiple groups. P<0.05 was
considered to indicate a statistically significant difference.
Results
Testosterone promotes the development
of cultured follicles in vitro
To determine the function of testosterone on
follicle development, primary follicles isolated from ovaries of
14-day-old mice were cultured in vitro and treated with
various doses of testosterone. As presented in Fig. 1, the effects of 1×10⁻⁶,
1×10⁻⁵ and 1×10⁻⁴ mol/l testosterone on mice
primary follicles were observed in vitro under an inverted
microscope, and it was identified that all three concentrations of
testosterone promoted follicle development at an early stage (day
7), but eventually inhibited follicle growth at a later stage (days
7–14). There were no significant differences amongthe three groups
(P>0.05); therefore, 1×10⁻⁵ mol/l testosterone was
chosen for subsequent experiments using follicles, according to the
preliminary test and in reference to published literature (Fig. 1; Tables I and II) (20).
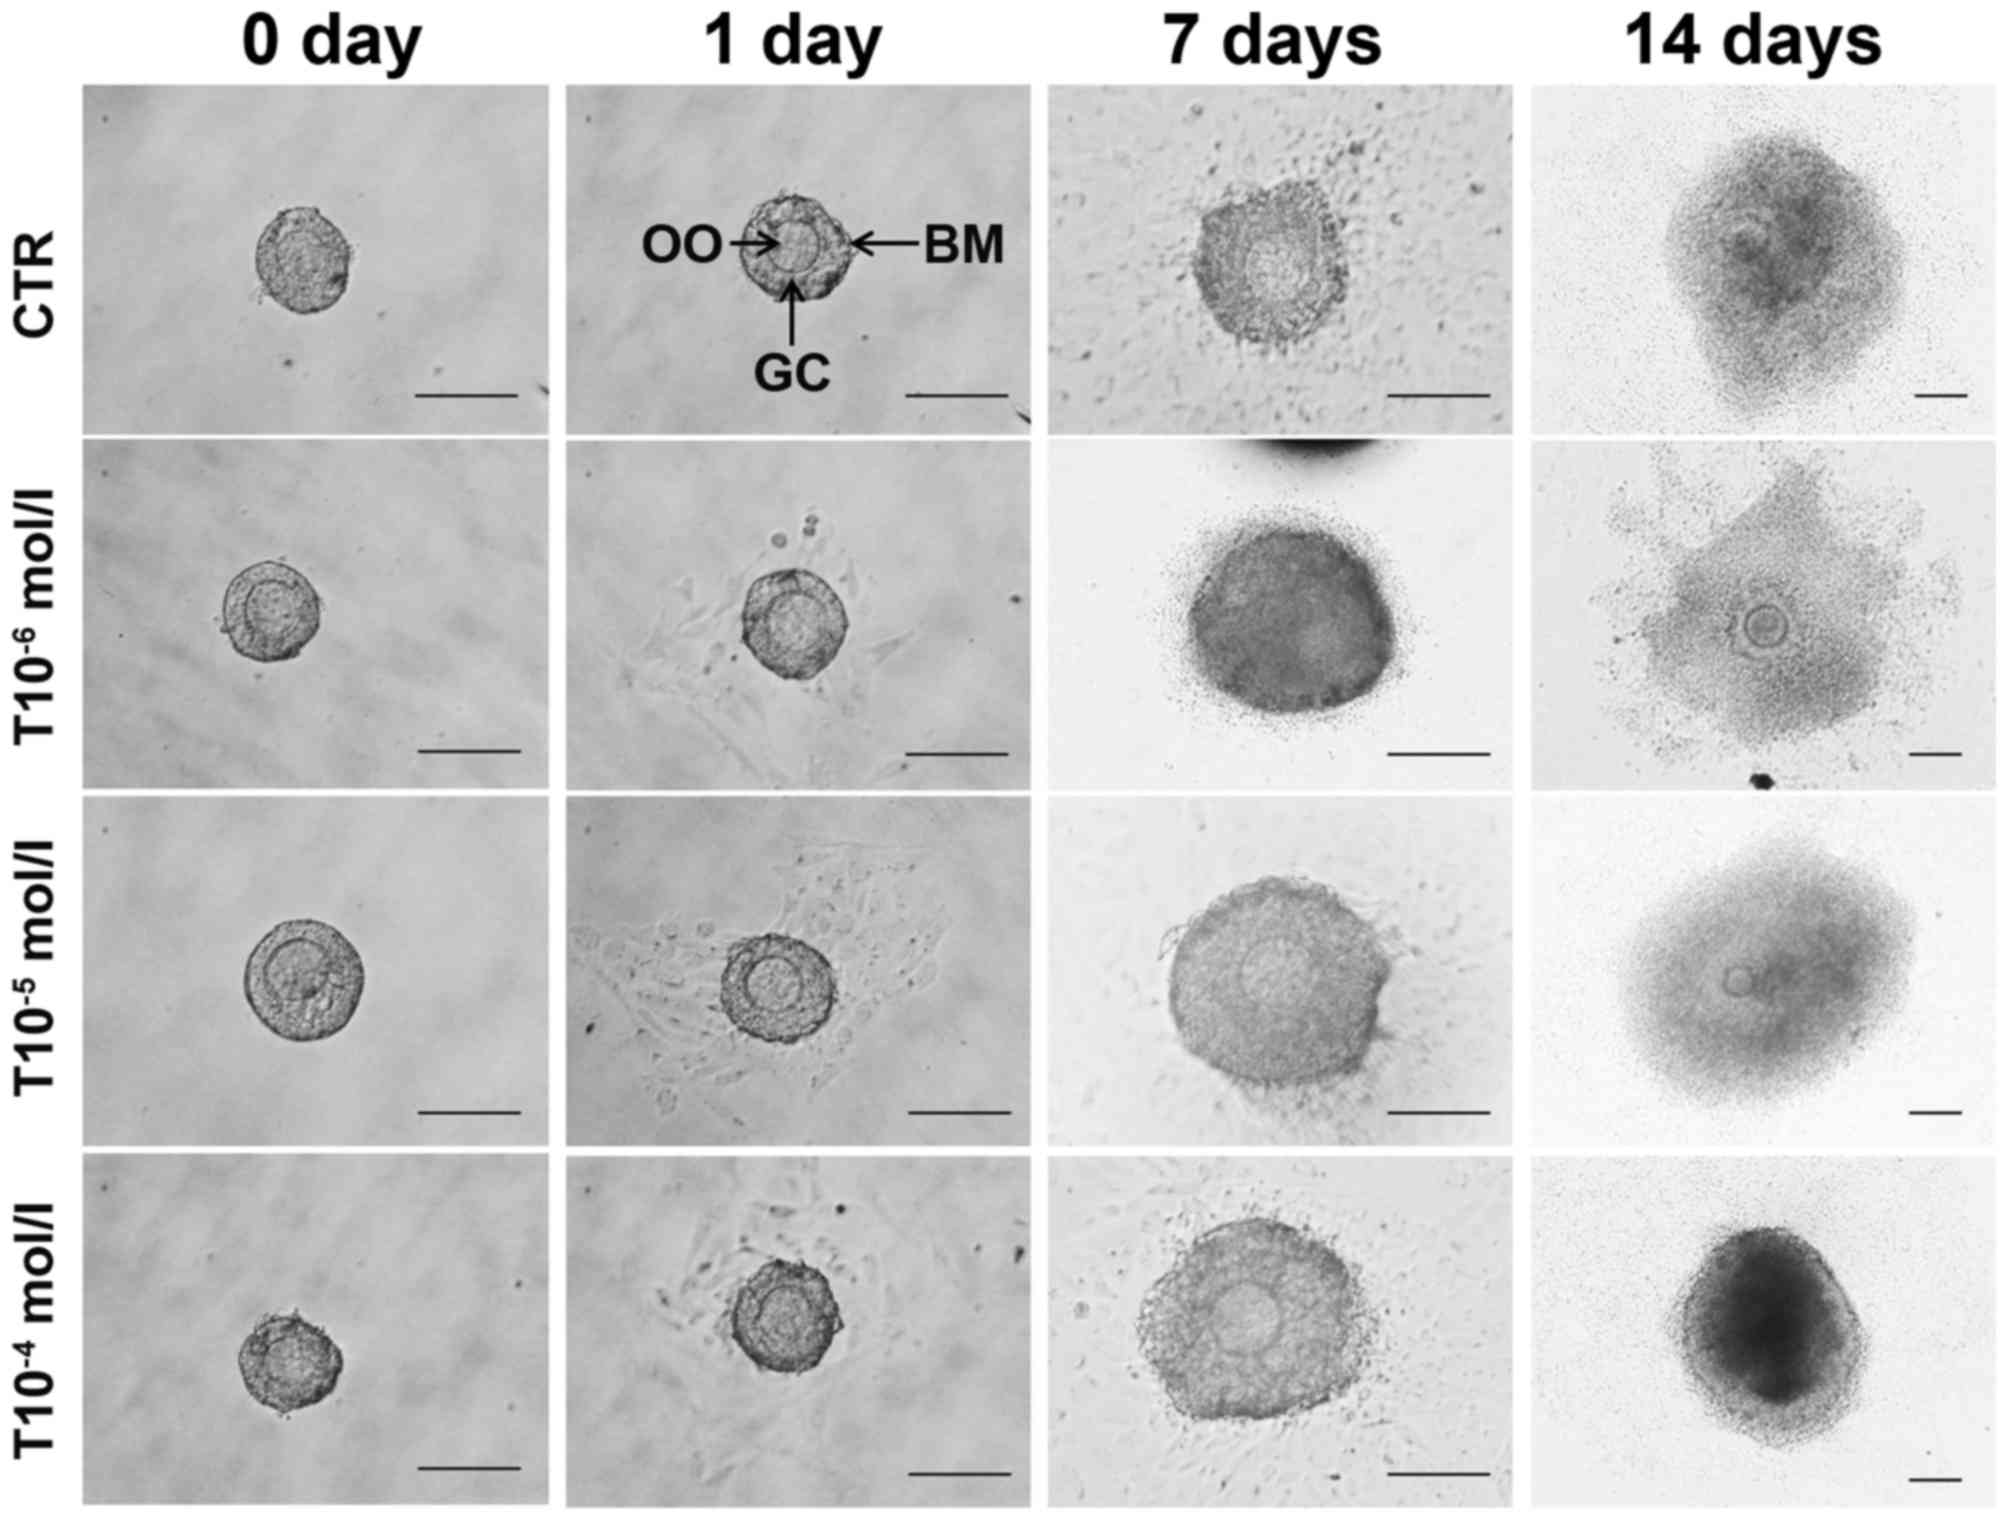 | Figure 1.Effects of testosterone on follicle
development in vitro. Primary follicles were treated with
various concentrations of testosterone (T10−6,
T10−5 and T10−4 mol/l). The photomicrographs
illustrate the morphological and size changes in follicles. The OO
are centrally located within a single layer of GCs, a few stromal
cells remain with the follicle at day 7. Following 7 days in
culture the follicles were observed and photographed, and the
follicle had increased by ~40% in diameter. By day 14, the follicle
treated with concentrations of testosterone (T10−6,
T10−5 and T10−4 mol/l) further increased in
diameter by ~8-fold. All three concentrations of testosterone
promoted follicle developmentup today 7, but eventually inhibited
follicle growth betweendays 7 and 14. There were no significant
differences in diameter among the testosterone-treated groups
(P>0.05). CTR, control group (no testosterone treatment); T,
testosterone treatment group; OO, oocytes; BM, basement membrane;
GC, granulosa cell. Scale bar, 100 µm. |
 | Table I.Effects of various concentrations of
testosterone on follicle diameter. |
Table I.
Effects of various concentrations of
testosterone on follicle diameter.
|
|
| 7 days | 14 days |
|---|
|
|
|
|
|
|---|
| Group | Total follicle
number | Mean diameter
(µm) | P-value | Mean diameter
(µm) | P-value |
|---|
| CTR | 30 | 100.0±2.3 |
| 521.3±3.3 |
|
| T 10−6
mol/l | 30 |
130.2±5.7a | 0.043 |
462.3±2.9a | 0.049 |
| T 10−5
mol/l | 30 |
138.5±2.2a | 0.035 |
433.4±5.3a | 0.033 |
| T 10−4
mol/l | 30 |
146.7±6.2a | 0.019 |
332.8±7.1a | 0.008 |
| Table II.Effects of various concentrations of
testosterone on follicle development. |
Table II.
Effects of various concentrations of
testosterone on follicle development.
|
|
| 7 days | 14 days |
|---|
|
|
|
|
|
|---|
| Group | Total follicle
number | Live follicle
number (%) | Arrested follicle
number (%) | Live follicle
number (%) | Arrested follicle
number (%) |
|---|
| CTR | 30 | 29 (96.67) | 1 (3.33) | 29 (96.67) | 1 (3.33) |
| T 10−6
mol/l | 30 | 27 (90.00) | 3 (10.00) | 26 (86.67) | 4 (13.33) |
| T 10−5
mol/l | 30 | 26 (86.67) | 4 (13.33) | 25 (83.33) | 5 (16.67) |
| T 10−4
mol/l | 30 | 24 (80.00) | 6
(20.00)a | 22 (73.33) | 8
(26.67)a |
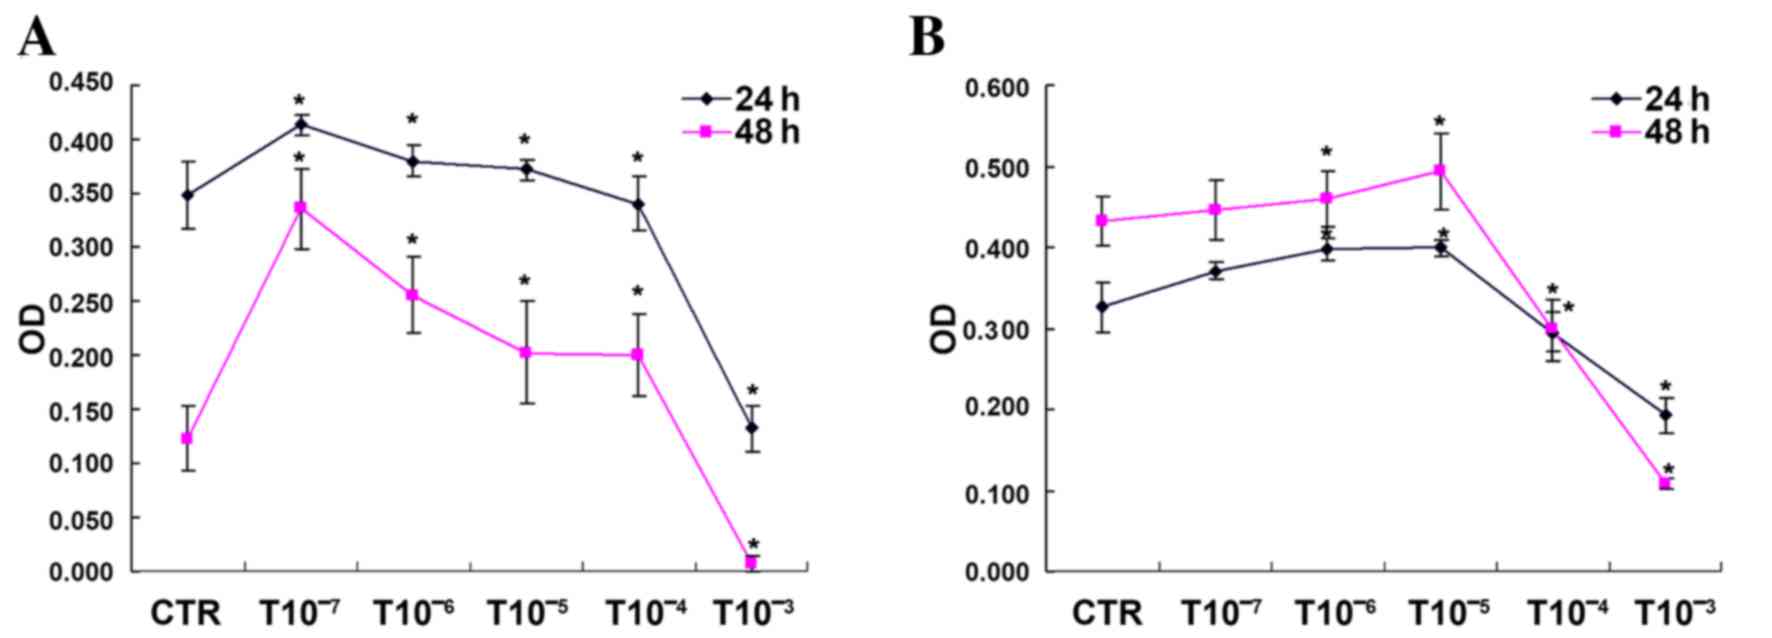
Testosterone induces the proliferation
of GCs and TICs in vitro
Cultured GCs and TICs were treated with testosterone
and cell proliferation was analyzed by MTT assay. As presented in
Fig. 2, 1×10⁻³ mol/l
testosterone inhibited GC proliferation, whereas GC growth was
significantly promoted following 24 and 48 h treatment with the
other testosterone concentrations (P<0.05). In addition,
1×10⁻⁶ and 1×10⁻⁵ mol/l testosterone promoted
TIC proliferation, whereas cell growth in the 1×10⁻⁴ and
1×10⁻³ mol/l testosterone groups was significantly
inhibited (P<0.05; Fig. 2).
Therefore, 10−5 mol/l testosterone treatment for 48 h
was chosen for follow-up experiments on GCs and TICs.
Effects of testosterone on hormone
secretion in follicles
As presented in Table
III, on day 7 E2, P and INS levels were
significantly higher in the follicle supernatant of the T group
when compared with the CTR group (P<0.05); however, only
E2 and INS levels were significantly higher inthe F+T
group when compared with the CTR group (P<0.05). On day 14, the
follicle supernatant of eachgroup was analyzed and it was
indentifed that the levels of E2 and P in the T group,
E2 and INS in the F group, and E2 in the F+T
group were significantly higher compared with in the CTR group
(P<0.05).
| Table III.Effects of testosterone on follicular
hormone secretion in vitro. |
Table III.
Effects of testosterone on follicular
hormone secretion in vitro.
|
| 7 days | 14 days |
|---|
|
|
|
|
|---|
| Group | E2
(pg/ml) | P (ng/ml) | INS (mIU/l) | E2
(pg/ml) | P (ng/ml) | INS (mIU/l) |
|---|
| CTR | 334.50±10.12 | 0.41±0.08 | 170.80±10.11 | 2,356.25±50.98 | 10.15±1.21 | 148.00±12.31 |
| T |
4,300.00±20.86a |
0.80±0.06a |
355.10±21.25a |
5,300.00±43.87b |
18.57±2.13b | 194.38±11.09 |
| F |
73.50±4.11a |
0.17±0.02a |
323.50±29.87a |
5,221.11±39.97b | 11.68±0.99 |
459.10±20.31b |
| F+T |
4,300.00±38.78a |
0.52±0.09 |
321.50±30.01a |
4,997.35±50.22b | 13.13±0.97 | 183.30±20.76 |
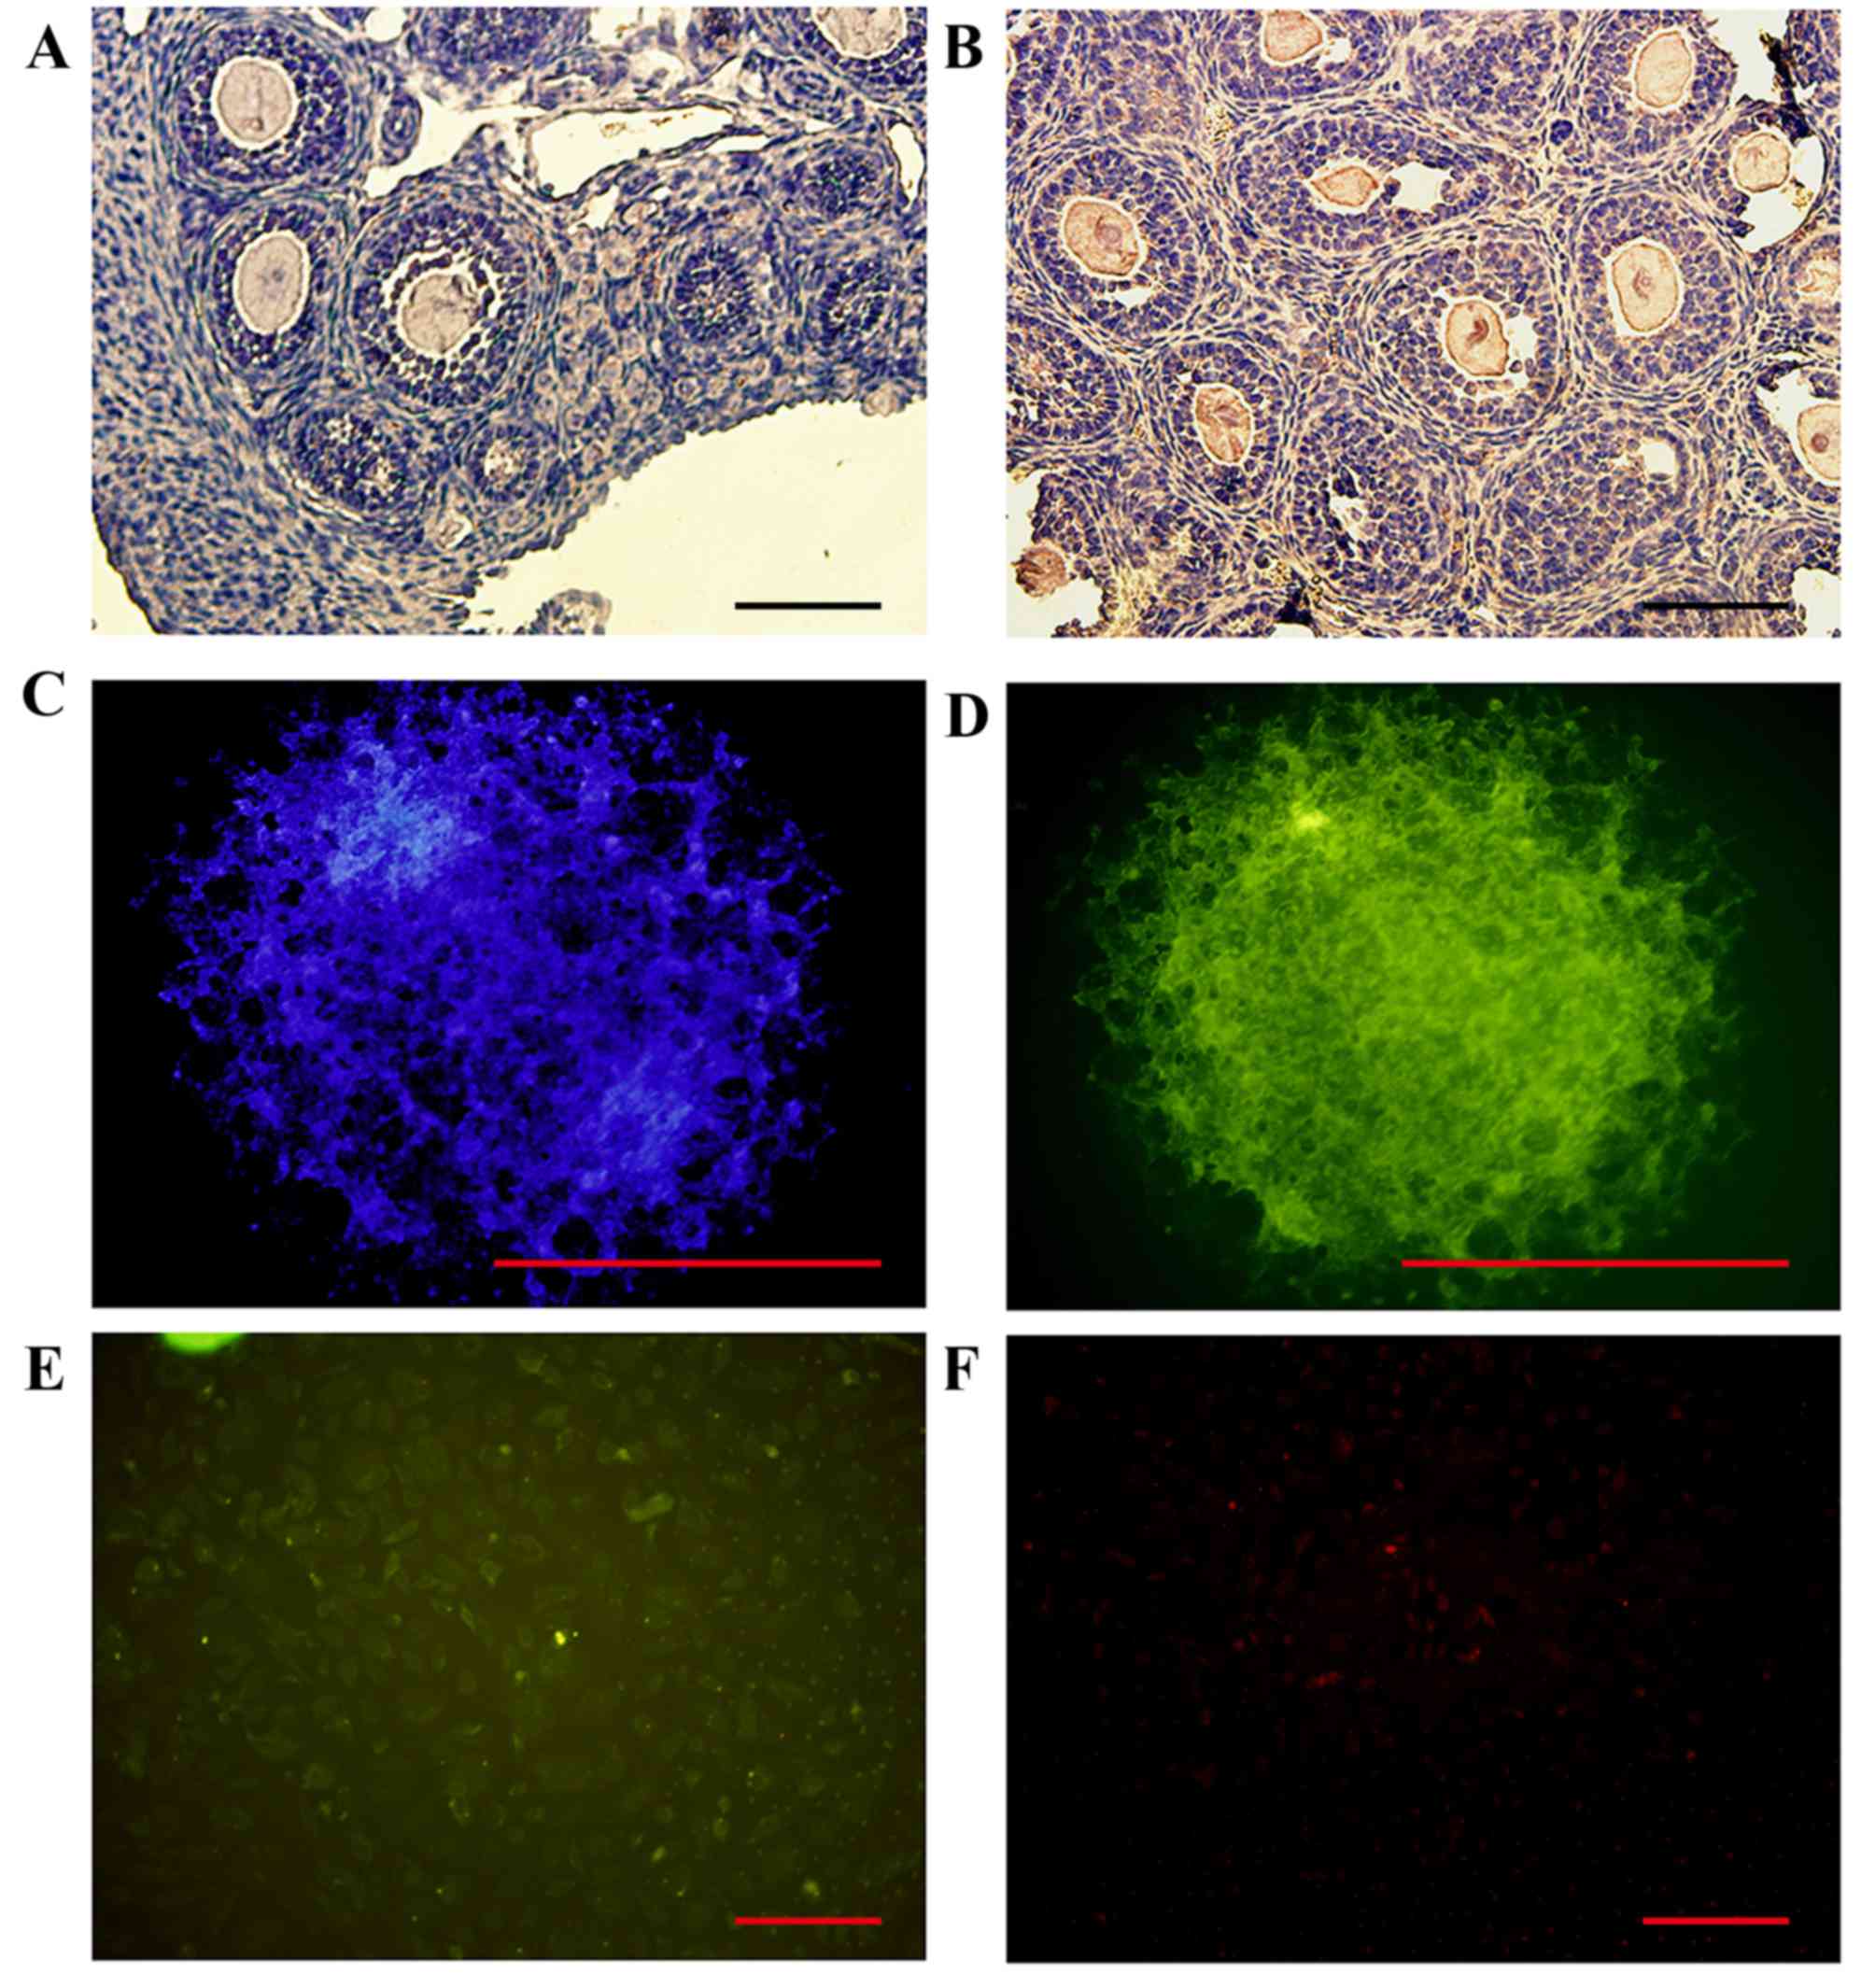
Ovarian expression of FBP1
FBP1 protein expression was detected by
immunohistochemical staining of ovarian tissue sections from
14-day-old mice. The results demonstrated that FBP1 was primarily
expressed in the ovarian oocytes, GCs and TICs. FBP1 protein was
markedly expressed in the GCs of follicles that were cultured for
14 days, and the cytoplasm and nuclei of GCs and TICs in
vitro (Fig. 3).
Effects of testosterone on FBP1 mRNA
expression in GCs
Using RT-qPCR, it was demonstrated that various
concentrations of testosterone had a significant impact on the mRNA
expression of FBP1 in GCs. The mRNA expression levels of FBP1 were
significantly higher in GCs treated with testosterone compared with
in the CTR group, with the exception of the 1×10⁻⁷ mol/l
testosterone-treated group (P<0.05). In addition, FBP1
expression was detected following treatment of GCs with
1×10⁻⁵ mol/l testosterone for various durations; the
mRNA expression levels of FBP1 were significantly increased in GCs
treated with testosterone for 2, 12 and 48 h. GCs treated with
flutamide exhibited significantly increased FBP1 expression at 2,
24 and 48 h, and GCs treated with flutamide + testosterone
exhibited significantly decreased FBP1 expression at 12 and 24 h,
and increased expression at 48 h (P<0.05), as presented in
Fig. 4.
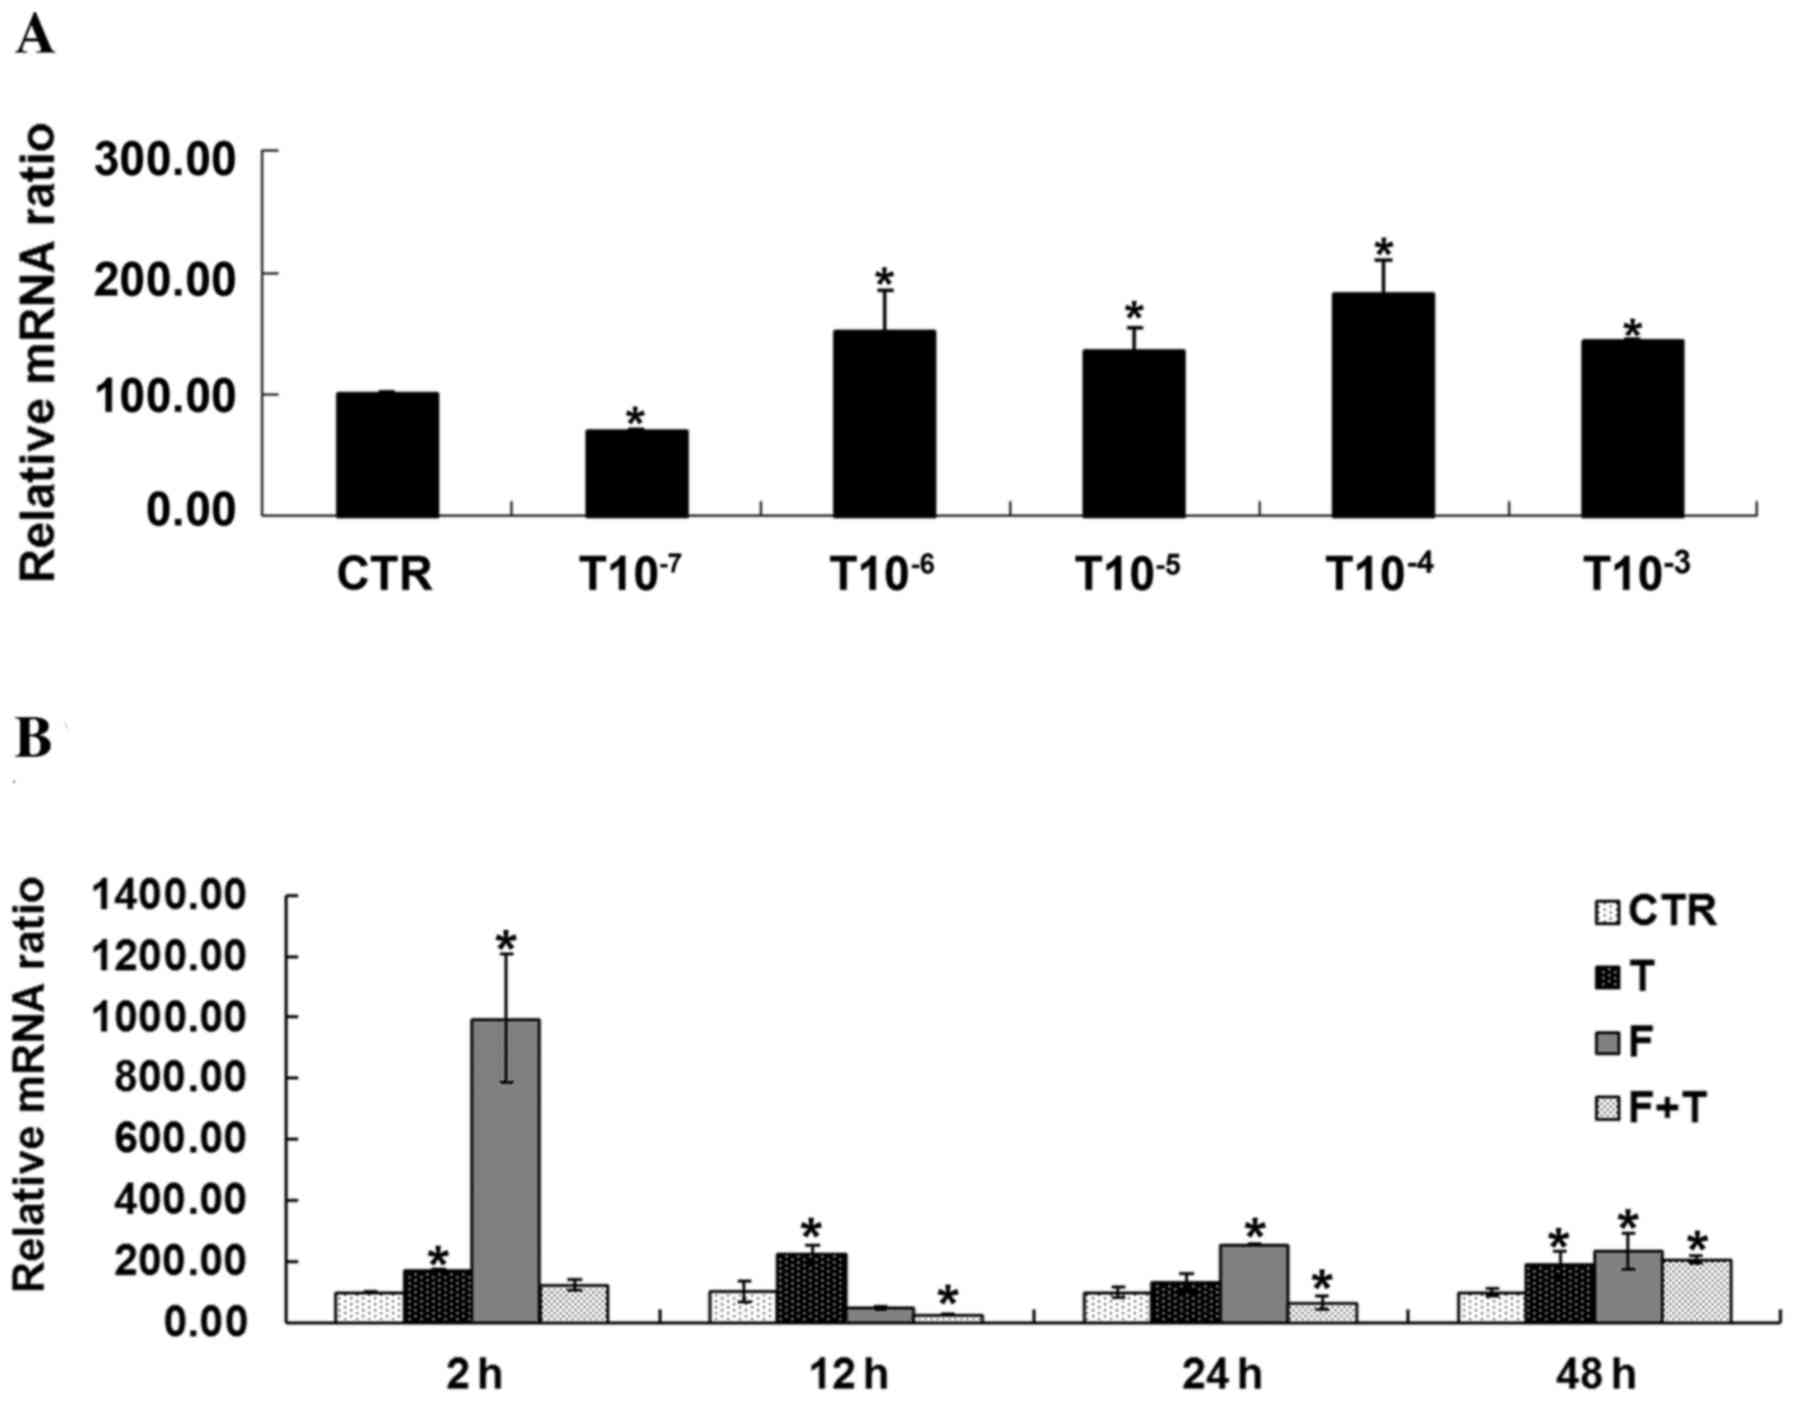 | Figure 4.Effects of testosterone on FBP1 mRNA
expression in GCs. (A) Expression of FBP1 was significantly
increased in GC streated with 1×10⁻⁶, 1×10⁻⁵,
1×10⁻⁴ and 1×10⁻³ mol/l testosterone compared
with in the CTR group, *P<0.05 vs. CTR group. (B) FBP1 mRNA
expression was significantly increased in GCs treated with
testosterone for 2, 12 and 48 h compared with the CTR group at the
same time. FBP1 mRNA expression was increased in GCs treated with
flutamide + testosterone at 48 h compared with the CTR group.
Treatment of GCs with flutamide led to a significant upregulation
in FBP1 expression at 2, 24 and 48 h compared with the CTR group.
Conversely, when treated with flutamide + testosterone, mRNA
expression in GCs was significantly decreased at 12 and 24 h.
*P<0.05 vs. respective CTR group. CTR, control group (no
testosterone treatment); T, testosteronetreatment group; F,
flutamide treatment group; F+T, flutamide + testosterone group;
FBP1, fructose-1,6-bisphosphatase 1; GC, granulosa cell. |
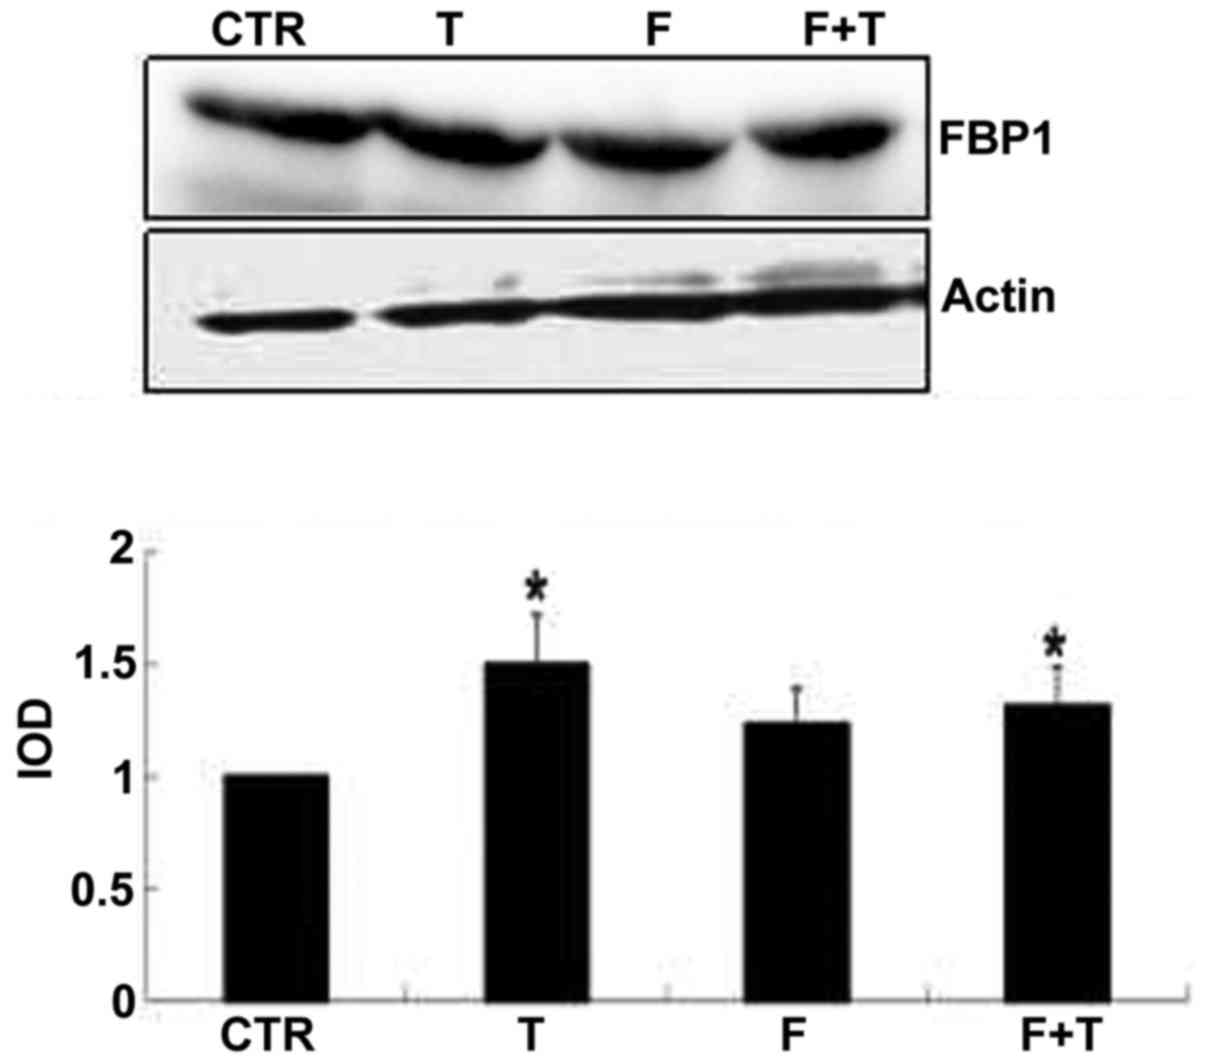
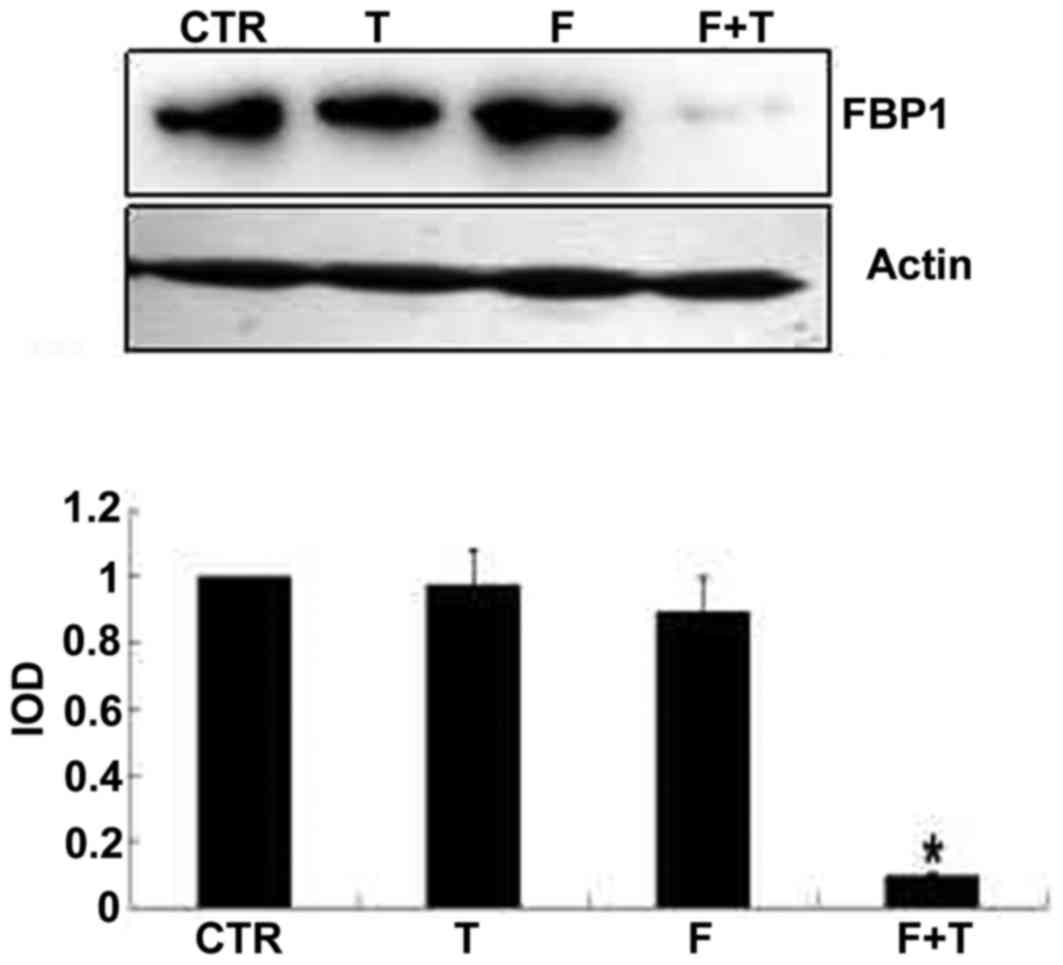
FBP1 total protein expression in GCs
and TICs
As determined by western blot analysis, the protein
expression levels of FBP1 were higher in the GCs of the T and F+T
groups compared with the CTR group (P<0.05). There was no
significant difference in FBP1 protein expression in the TICs of
the T group compared with the CTR group; however, expression in the
TICs of the F+T group was significantly lower than in the CTR group
(Figs. 5 and 6).
Effects of testosterone on the FBP1
signaling pathway in GCs and TICs
Using RT-qPCR, the mRNA expression levels of FBP1
and PCK1 were significantly increased in GCs treated with
testosterone compared with in the CTR group, whereas testosterone
significantly inhibited FOXO1 and peroxisome proliferator-activated
receptor γ coactivator 1α (PGC-1α) expression (P<0.05).
Flutamide promoted the expression of FOXO1, and inhibited the mRNA
expression of FBP1 and PGC-1α in GCs (P<0.05). In TICs,
testosterone and flutamide treatment inhibited the mRNA expression
of FOXO1 and G6PC, and promoted the mRNA expression of PCK1
(P<0.05). There were no significant differences in FBP1 mRNA
expression in TICs treated with testosterone or flutamide (Fig. 7).
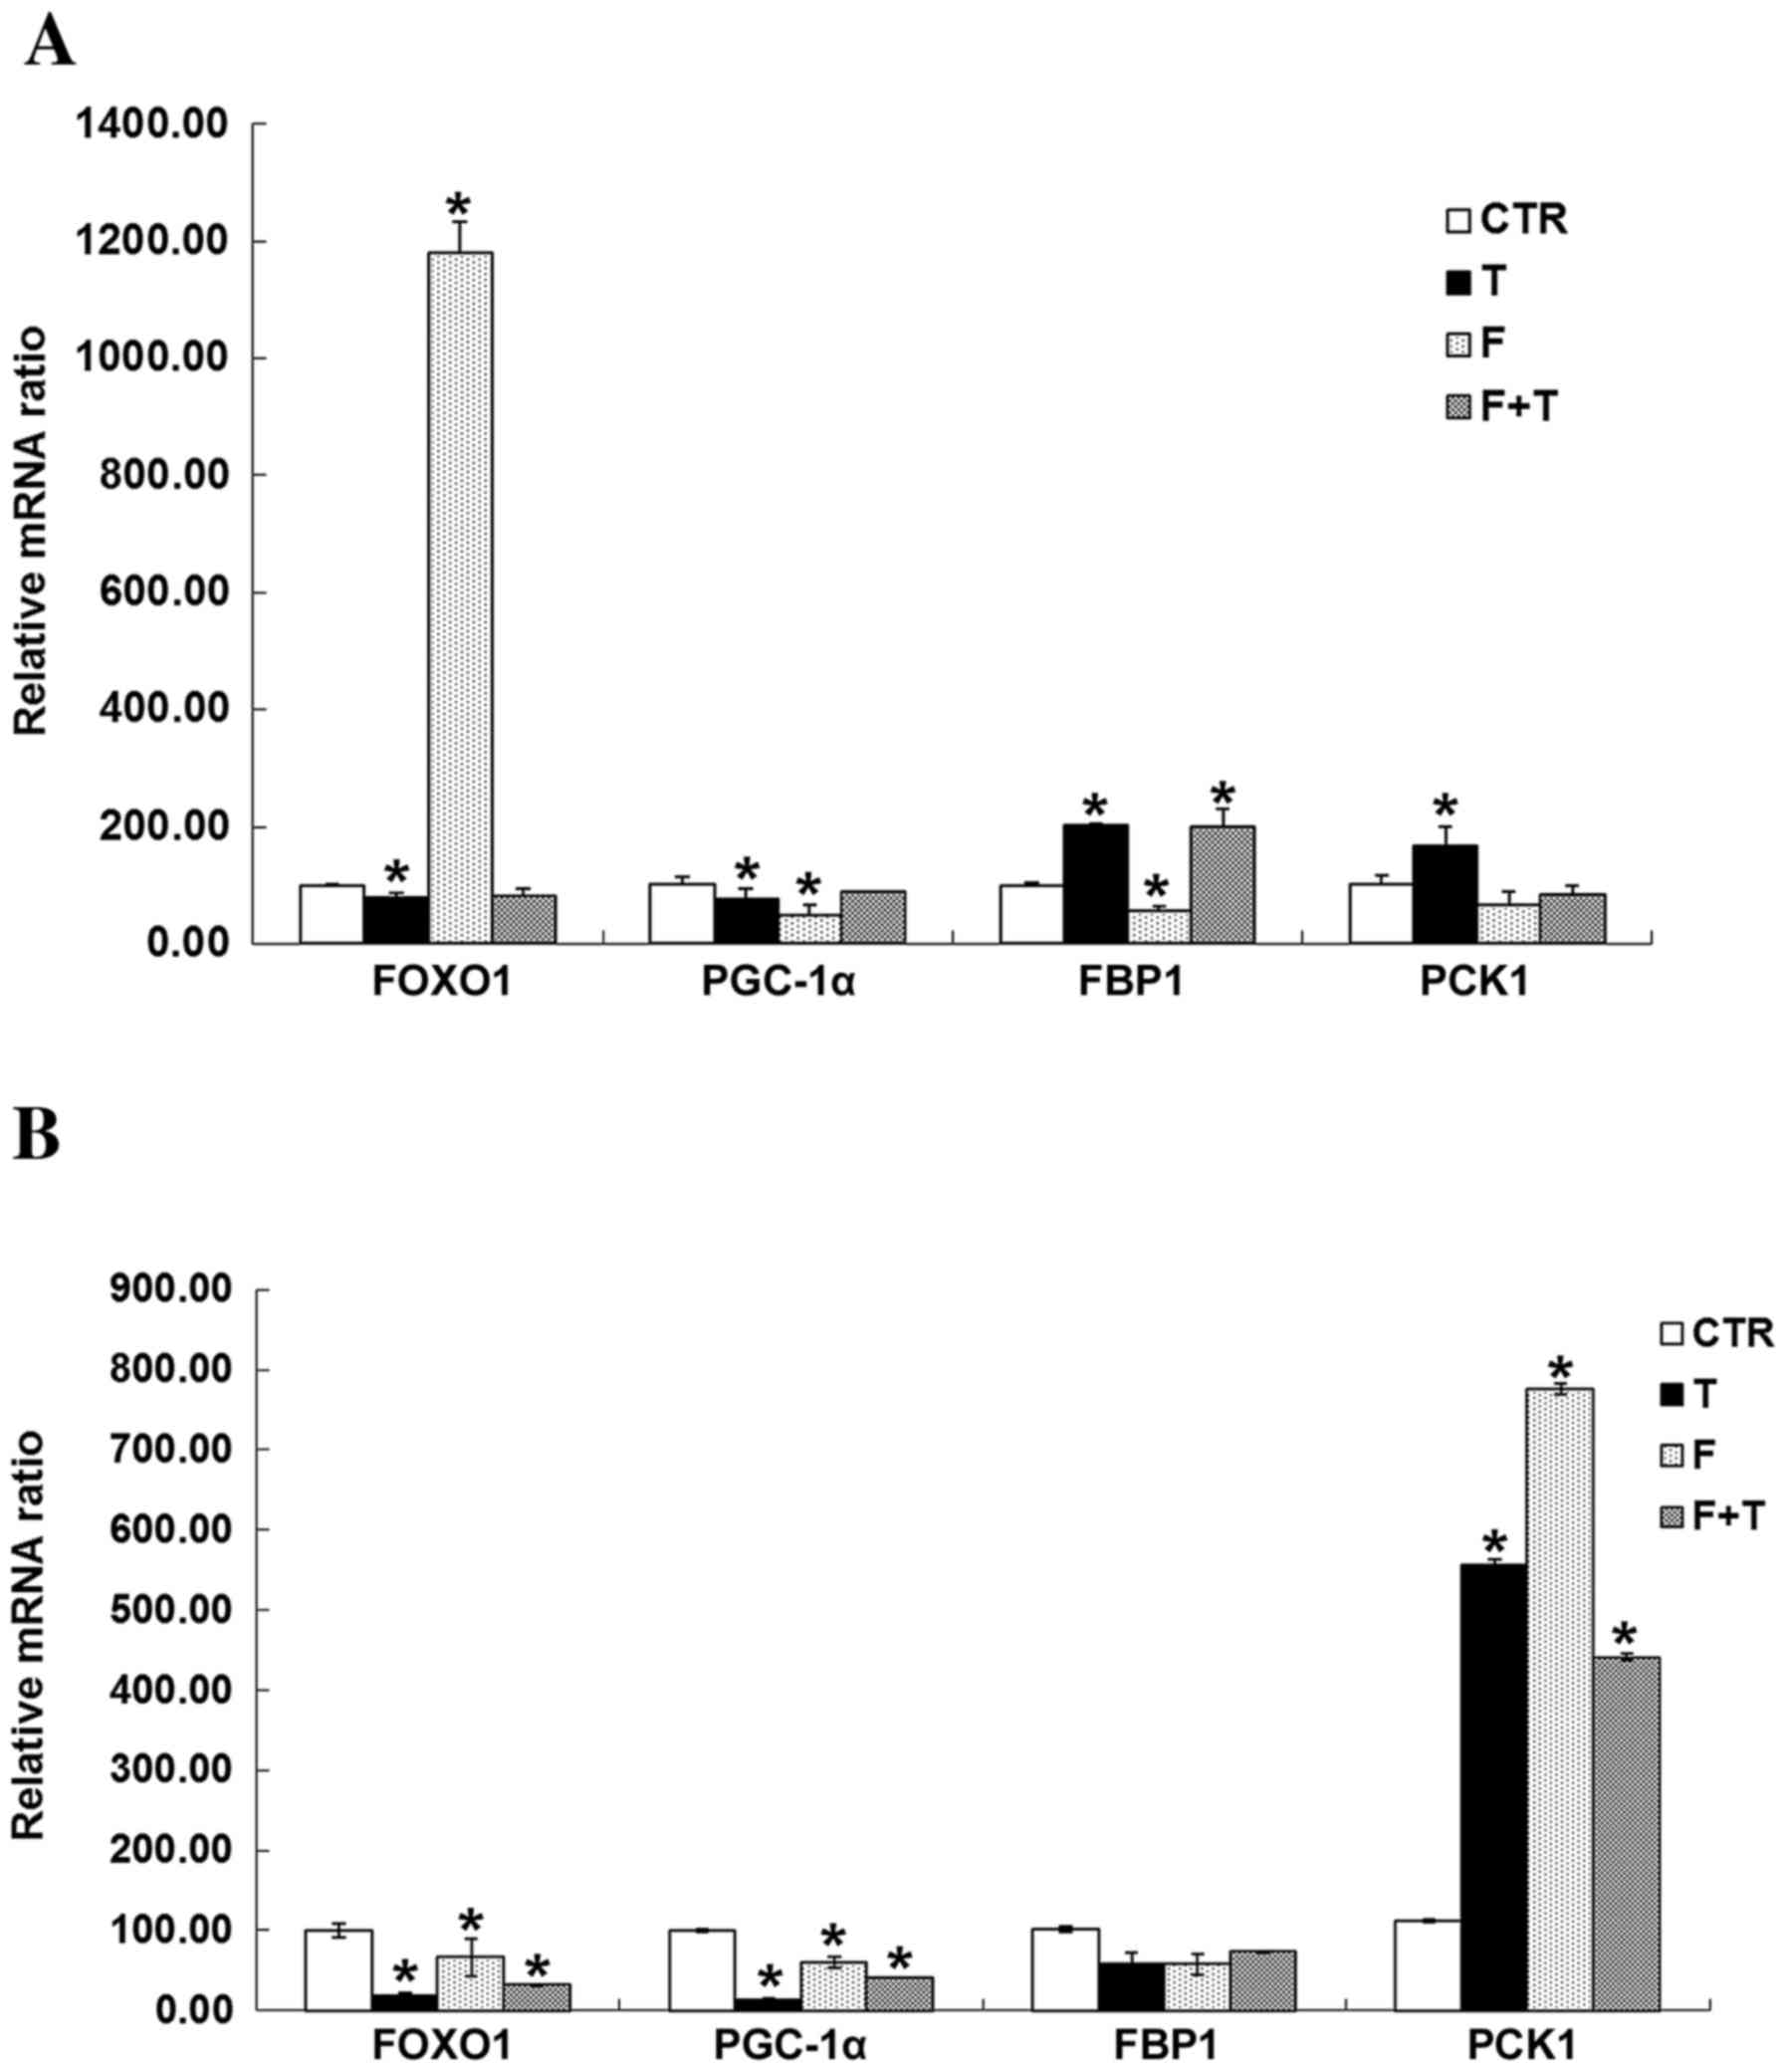 | Figure 7.Effects of testosterone and/or
flutamide on the expression of FBP1 signaling pathway genes in GCs
and TICs. (A) Testosterone induced a significant increase in the
mRNA expression levels of FBP1 and PCK1 in GCs compared with the
CTR group, whereas testosterone significantly inhibited FOXO1 and
PGC-1α mRNA expression. *P<0.05 vs. respective CTR group.
Flutamide promoted the expression of FOXO1, and inhibited the
expression of FBP1 and PGC-1α mRNA in GCs compared with the CTR
group. *P<0.05 vs. respective CTR group. (B) In TICs,
testosterone or flutamide, or a combination of the two inhibited
the mRNA expression of FOXO1 and G6PC compared with the CTR group,
but promoted the mRNA expression of PCK1. *P<0.05 vs. respective
CTR group. There was no significant effect on the expression of
FBP1 mRNA in TIC by testosterone or fluoride, P>0.05. CTR,
control group (no testosterone treatment); T, testosteronetreatment
group; F, flutamide treatment group; F+T, flutamide + testosterone
group; FOXO1, forkhead box protein O1; PGC-1α, peroxisome
proliferator-activated receptor γ coactivator 1α; FBP1,
fructose-1,6-bisphosphatase 1; PCK1, phosphoenolpyruvate
carboxykinase 1; TIC, theca-interstitial cell; GC, granulosa cell;
G6PC, glucose-6-phosphatase catalytic subunit. |
Discussion
Gluconeogenesis mainly occursin the liver; hepatic
gluconeogenesis and the insulin signaling pathway are dependent on
several key enzymes, including G6 PC, PCK1, and upstream regulatory
molecules FOXO1 and PGC-1α.
FBP can catalyze the hydrolysis of
fructose-1,6-diphosphate to fructose-6-phosphate and inorganic
phosphate. Mammals have two versionsof the FBP gene, the liver type
(FBP1) that is found with in tissues associated with
gluconeogenesis, such as the liver, kidney and digestive tract;
andthe muscle type (FBP2), which only exists in skeletal muscle.
Insulin inhibits FOXO1 through Akt-mediated phosphorylation and
nuclear exclusion, and inhibits G6 PC and PCK1 gene expression
(23). PGC-1 is a key modulator of
hepatic gluconeogenesis and a central target of the insulin-cAMP
axis in the liver, which can induce FBP1, G6 PC and PCK1, resulting
in an increased glucose output (24).
PCOS is the most common endocrinopathy among
reproductive-aged women, and is a common cause of anovulatory
infertility and menstrual cycle abnormalities associated with
hypersecretion of LH and insulin. In addition, it is associated
with hyperandrogenism in 5–10% of reproductive women worldwide, as
well as an increased risk of type 2 diabetes and cardiovascular
disease (25). Via a nationwide
epidemiological survey, a previous study identified that PCOS had
an incidence rate between 6 and 8% in Chinese women of reproductive
age (26,27). Furthermore, in our study
population, the hyperandrogenism phenotype accounted for 20–60% of
patientswith PCOS (28,29). PCOS is associated with significant
familial aggregation, and frequently occurs in first-degree
relatives; the rates of PCOS in mothers and sisters of patients
with PCOS are reported at 24 and 32%, respectively. However, the
risk was higher when considering untreated premenopausal women only
(30). Although 17 genes have been
identified in correlation with PCOS by GWAS, genes were detected
mainly through a single GWAS; verification in a larger population
has not been performed and studies of the underlying molecular cell
biology have yet to be conducted; therefore, the candidate genes
for the pathogenesis of PCOS have yet to be revealed (27). A range of animal models, including
rodents, sheep and nonhuman primates, has been established in the
study of PCOS. However, at present, an animal model that mimics all
features associated with human PCOS has not been established. The
present study used murine follicles, GCs and TICs as are search
model to verify the alterations in FBP1 during abnormal development
of ovarian follicles caused by high concentrations of
testosterone.
It has previously been identified that androgens
suppress female fetal renal gluconeogenesis in an ovine model of
PCOS (31). At present, few
studies have reported whether key enzymes of gluconeogenesis in
mammalian ovarian tissues function optimally in PCOS, particularly
FBP1 (32). The present study
confirmed that androgens servea dual role in follicle development
and affected follicular hormone secretion; 1×10⁻⁵ mol/l
testosterone treatment stimulated GC and TIC development, whereas
excessive testosterone inhibited their development. In addition,
FBP1 was detected by immunofluorescence staining and it was
identified that FBP1 was primarily expressed in ovarian oocytes,
GCs and TICs. Furthemore, FBP1 protein was significantly expressed
in GCs of the 14-day cultured follicle, and in the cytoplasm and
nucleiof GCs and TICs in vitro. Testosterone increased FBP1
expression of GCs at specific time intervals and testosterone
concentrations. A high concentration of testosterone was able to
increase the expression of FBP1 protein in GCs; however, it did not
affect FBP1 expression in TICs. Conversely, treatment with
flutamide and testosterone led to a decrease in FBP1 protein in GCs
and TICs. Potentially, flutamide may competitively bind to androgen
receptors. In addition, the main genes of the FBP1 signaling
pathway were detected, and the results demonstrated that the mRNA
expression levels of FBP1 and PCK1 were significantly increased in
GCs treated with testosterone, whereas a high concentration of
testosterone significantly inhibited FOXO1 and PGC-1 expression. In
addition, flutamide was able to promote the expression of FOXO1 and
inhibit the mRNA expression of FBP1 and PGC-1 in GCs. In TICs,
testosterone or flutamide was able to inhibit the mRNA expression
of FOXO1 and G6 PC, and promote the mRNA expression of PCK1. These
findings may be associated with the abnormal metabolism of insulin
and abnormal glucose metabolism induced by high concentrations of
testosterone. Furthermore, identification of the role and specific
mechanisms of FBP1 in the development of PCOS is required in order
to verify this theory infuture FBP1 gene knockout mice
experiments.
In conclusion, the present study demonstrated that
the FBP1 signaling pathway may be involved in normal follicle
growth, as well as in hyperandrogenism-induced abnormal development
of follicles; however, the specific mechanism requires further
investigation.
Acknowledgements
The authors would like to thank the staff members of
this trial, our colleagues and all the study staff for their
efforts in collecting and ensuring the accuracy of the data. This
project was supported by grants from the Natural Science Foundation
of Shandong Province (grant no. ZR2012HL15) and the Postdoctoral
Innovation Foundation of Shandong Province (grant no.
201203052).
References
|
1
|
Chang C, Lee SO, Wang RS, Yeh S and Chang
TM: Androgen receptor (AR) physiological roles in male and female
reproductive systems: Lessons learned from AR-knockout mice lacking
AR in selective cells. Biol Reprod. 89:212013. View Article : Google Scholar : PubMed/NCBI
|
|
2
|
Shea LD, Woodruff TK and Shikanov A:
Bioengineering the ovarian follicle microenvironment. Annu Rev
Biomed Eng. 16:29–52. 2014. View Article : Google Scholar : PubMed/NCBI
|
|
3
|
Kim JY, Xue K, Cao M, Wang Q, Liu JY,
Leader A, Han JY and Tsang BK: Chemerin suppresses ovarian
follicular development and its potential involvement in follicular
arrest in rats treated chronically with dihydrotestosterone.
Endocrinology. 154:2912–2923. 2013. View Article : Google Scholar : PubMed/NCBI
|
|
4
|
Dumesic DA, Oberfield SE, Stener-Victorin
E, Marshall JC, Laven JS and Legro RS: Scientific statement on the
diagnostic criteria, epidemiology, pathophysiology, and molecular
genetics of polycystic ovary syndrome. Endocr Rev. 36:487–525.
2015. View Article : Google Scholar : PubMed/NCBI
|
|
5
|
McGee WK, Bishop CV, Bahar A, Pohl CR,
Chang RJ, Marshall JC, Pau FK, Stouffer RL and Cameron JL: Elevated
androgens during puberty in female rhesus monkeys lead to increased
neuronal drive to the reproductive axis: A possible component of
polycystic ovary syndrome. Hum Reprod. 27:531–540. 2012. View Article : Google Scholar : PubMed/NCBI
|
|
6
|
Usadi RS and Legro RS: Reproductive impact
of polycystic ovary syndrome. Curr Opin Endocrinol Diabetes Obes.
19:505–511. 2012. View Article : Google Scholar : PubMed/NCBI
|
|
7
|
Shi Y, Zhao H, Shi Y, Cao Y, Yang D, Li Z,
Zhang B, Liang X, Li T, Chen J, et al: Genome-wide association
study identifies eight new risk loci for polycystic ovary syndrome.
Nat Genet. 44:1020–1025. 2012. View
Article : Google Scholar : PubMed/NCBI
|
|
8
|
Makieva S, Saunders PT and Norman JE:
Androgens in pregnancy: Roles in parturition. Hum Reprod Update.
20:542–559. 2014. View Article : Google Scholar : PubMed/NCBI
|
|
9
|
Lebbe M and Woodruff TK: Involvement of
androgens in ovarian health and disease. Mol Hum Reprod.
19:828–837. 2013. View Article : Google Scholar : PubMed/NCBI
|
|
10
|
Connolly F, Rae MT, Späth K, Boswell L,
McNeilly AS and Duncan WC: In an ovine model of polycystic ovary
syndrome (PCOS) prenatal androgens suppress female fetal renal
gluconeogenesis. PLoS One. 10:e01321132015. View Article : Google Scholar : PubMed/NCBI
|
|
11
|
Nicol LE, O'Brien TD, Dumesic DA, Grogan
T, Tarantal AF and Abbott DH: Abnormal infant islet morphology
precedes insulin resistance in PCOS-like monkeys. PLoS One.
9:e1065272014. View Article : Google Scholar : PubMed/NCBI
|
|
12
|
Takagi D, Ben-Ari J, Nemet D, Zeharia A
and Eliakim A: Recurrent infantile hypoglycemia due to combined
fructose-1,6-diphosphatase deficiency and growth hormone
deficiency. J Pediatr Endocrinol Metab. 26:761–763. 2013.
View Article : Google Scholar : PubMed/NCBI
|
|
13
|
Drabovich AP, Pavlou MP, Dimitromanolakis
A and Diamandis EP: Quantitative analysis of energy metabolic
pathways in MCF-7 breast cancer cells by selected reaction
monitoring assay. Mol Cell Proteomics. 11:422–434. 2012. View Article : Google Scholar : PubMed/NCBI
|
|
14
|
Thorn SR, Sekar SM, Lavezzi JR, O'Meara
MC, Brown LD, Hay WW Jr and Rozance PJ: A physiological increase in
insulin suppresses gluconeogenic gene activation in fetal sheep
with sustained hypoglycemia. Am J Physiol Regul Integr Comp
Physiol. 303:R861–R869. 2012. View Article : Google Scholar : PubMed/NCBI
|
|
15
|
Romero S and Smitz J: Exposing cultured
mouse ovarian follicles under increased gonadotropin tonus to
aromatizable androgens influences the steroid balance and reduces
oocyte meiotic capacity. Endocrine. 38:243–253. 2010. View Article : Google Scholar : PubMed/NCBI
|
|
16
|
Roland AV, Nunemaker CS, Keller SR and
Moenter SM: Prenatal androgen exposure programs metabolic
dysfunction in female mice. J Endocrinol. 207:213–223. 2010.
View Article : Google Scholar : PubMed/NCBI
|
|
17
|
Zhang CP, Yang JL, Zhang J, Li L, Huang L,
Ji SY, Hu ZY, Gao F and Liu YX: Notch signaling is involved in
ovarian follicle development by regulating granulosa cell
proliferation. Endocrinology. 152:2437–2447. 2011. View Article : Google Scholar : PubMed/NCBI
|
|
18
|
Itami S, Yasuda K, Yoshida Y, Matsui C,
Hashiura S, Sakai A and Tamotsu S: Co-culturing of follicles with
interstitial cells in collagen gel reproduce follicular development
accompanied with theca cell layer formation. Reprod Biol
Endocrinol. 9:1592011. View Article : Google Scholar : PubMed/NCBI
|
|
19
|
Yang JL, Zhang CP, Li L, Huang L, Ji SY,
Lu CL, Fan CH, Cai H, Ren Y, Hu ZY, et al: Testosterone induces
redistribution of forkhead box-3a and down-regulation of growth and
differentiation factor 9 messenger ribonucleic acid expression at
early stage of mouse folliculogenesis. Endocrinology. 151:774–782.
2010. View Article : Google Scholar : PubMed/NCBI
|
|
20
|
Forsgren KL and Young G: Stage-specific
effects of androgens and estradiol-17beta on the development of
late primary and early secondary ovarian follicles of coho salmon
(Oncorhynchus kisutch) in vitro. Biol Reprod. 87:642012. View Article : Google Scholar : PubMed/NCBI
|
|
21
|
Lenie S and Smitz J: Functional AR
signaling is evident in an in vitro mouse follicle culture bioassay
that encompasses most stages of folliculogenesis. Biol Reprod.
80:685–695. 2009. View Article : Google Scholar : PubMed/NCBI
|
|
22
|
Livak KJ and Schmittgen TD: Analysis of
relative gene expresison data using real-time quantitiative PCR and
the 2(-Delta Delta C(T)) method. Methods. 25:402–408. 2001.
View Article : Google Scholar : PubMed/NCBI
|
|
23
|
Zhang P, Tu B, Wang H, Cao Z, Tang M,
Zhang C, Gu B, Li Z, Wang L, Yang Y, et al: Tumor suppressor p53
cooperates with SIRT6 to regulate gluconeogenesis by promoting
FoxO1 nuclear exclusion. Proc Natl Acad Sci USA. 111:10684–10689.
2014; View Article : Google Scholar : PubMed/NCBI
|
|
24
|
Puigserver P, Rhee J, Donovan J, Walkey
CJ, Yoon JC, Oriente F, Kitamura Y, Altomonte J, Dong H, Accili D
and Spiegelman BM: Insulin-regulated hepatic gluconeogenesis
through FOXO1-PGC-1alpha interaction. Nature. 423:550–555. 2003.
View Article : Google Scholar : PubMed/NCBI
|
|
25
|
Walters KA, Allan CM and Handelsman DJ:
Rodent models for human polycystic ovary syndrome. Biol Reprod.
86:1492012. View Article : Google Scholar : PubMed/NCBI
|
|
26
|
Li T, Wu K, You L, Xing X, Wang P, Cui L,
Liu H, Cui Y, Bian Y, Ning Y, et al: Common variant rs9939609 in
gene FTO confers risk to polycystic ovary syndrome. PLoS One.
8:e662502013. View Article : Google Scholar : PubMed/NCBI
|
|
27
|
Chen ZJ, Zhao H, He L, Shi Y, Qin Y, Shi
Y, Li Z, You L, Zhao J, Liu J, et al: Genome-wide association study
identifies susceptibility loci for polycystic ovary syndrome on
chromosome 2p16.3, 2p21 and 9q33.3. Nat Genet. 43:55–59. 2011.
View Article : Google Scholar : PubMed/NCBI
|
|
28
|
Zhang HY, Guo CX, Zhu FF, Qu PP, Lin WJ
and Xiong J: Clinical characteristics, metabolic features, and
phenotype of Chinese women with polycystic ovary syndrome: A
large-scale case-control study. Arch Gynecol Obstet. 287:525–531.
2013. View Article : Google Scholar : PubMed/NCBI
|
|
29
|
Chen Z: Polycystic ovary syndrome etiology
and clinical research. J Reprod Med. 16:2322007.
|
|
30
|
Kahsar-Miller MD, Nixon C, Boots LR, Go RC
and Azziz R: Prevalence of polycystic ovary syndrome (PCOS) in
first-degree relatives of patients with PCOS. Fertil Steril.
75:53–58. 2001. View Article : Google Scholar : PubMed/NCBI
|
|
31
|
Connolly F, Rae MT, Späth K, Boswell L,
McNeilly AS and Duncan WC: In an ovine model of polycystic ovary
syndrome (PCOS) prenatal androgens suppress female fetal renal
gluconeogenesis. PLoS One. 10:e01321132015. View Article : Google Scholar : PubMed/NCBI
|
|
32
|
Dupont J and Scaramuzzi RJ: Insulin
signalling and glucose transport in the ovary and ovarian function
during theovarian cycle. Biochem J. 473:1483–1501. 2016. View Article : Google Scholar : PubMed/NCBI
|